
Automated Capillary Electrophoresis Immunoblot for the Detection of Alpha-Synuclein in Mouse Tissue
Abstract
Background:
Alpha-synuclein (aSyn) is a key player in neurodegenerative diseases such as Parkinson’s disease (PD), dementia with Lewy bodies, or multiple system atrophy. aSyn is expressed throughout the brain, and can also be detected in various peripheral tissues. In fact, initial symptoms of PD are non-motoric and include autonomic dysfunction, suggesting that the periphery might play an important role in early development of the disease. aSyn is expressed at relatively low levels in non-central tissues, which brings challenges for its detection and quantification in different tissues.
Objective:
Our goal was to assess the sensitivity of aSyn detection in central and peripheral mouse tissues through capillary electrophoresis (CE) immunoblot, considering the traditional SDS-PAGE immunoblot as the current standard.
Methods:
Tissues from central and non-central origin from wild type mice were extracted, and included midbrain, inner ear, and esophagus/stomach. aSyn detection was assessed through immunoblotting using Simple Western size-based CE and SDS-PAGE.
Results:
CE immunoblots show a consistent detection of aSyn in central and peripheral tissues. Through SDS-PAGE, immunoblots revealed a reliable signal corresponding to aSyn, particularly following membrane fixation.
Conclusion:
Our results suggest a reliable detection of aSyn in central and peripheral tissues using the CE Simple Western immunoblot system. These observations can serve as preliminary datasets when aiming to formally compare CE with SDS-PAGE, as well as for further characterization of aSyn using this technique.
INTRODUCTION
Alpha-synuclein (aSyn) is a 140 amino acid protein highly abundant in the brain that is implicated in Parkinson’s disease (PD), dementia with Lewy bodies and multiple system atrophy. The histopathological hallmarks of PD are the loss of dopaminergic neurons in the substantia nigra, and the presence of Lewy bodies and Lewy neurites, proteinaceous inclusions containing aggregated aSyn [1, 2]. Importantly, aSyn pathology is not only limited to the central nervous system, as it has been described throughout the peripheral nervous system, including the enteric nervous system [3]. However, the precise role of aSyn in neurodegeneration is still unclear, and needs to be further investigated [4, 5].
aSyn undergoes posttranslational modifications (PTMs) that have been correlated with implications for its pathobiology, including misfolding, aggregation, and cytotoxicity [6, 7]. In addition, self-propagating properties of aSyn have been related to pathological PTMs that may, therefore, be relevant for disease progression [8, 9]. As a consequence, the search for pathological aSyn in human tissue and biofluids as a potential biomarker for PD is of great interest in the field [10, 11].
The onset of non-motor features, such as REM-sleep disturbances, hyposmia, or gastrointestinal dysfunction [12–14], takes place many years prior to the onset of the typical motor features [15, 16]. Interestingly, the gastrointestinal tract has attracted significant interest as a relevant site of PD pathology, in the context of the brain first vs. body first hypothesis [17–20]. Furthermore, studies have suggested a dysfunction of the inner ear physiology on early stages of PD [21, 22]. In this context, detecting Syn and aSyn pathology in the periphery is extremely important, and techniques that improve the sensitivity over traditional methods are necessary.
Immune-based protein detection through Simple Western size-based capillary electrophoresis (CE) is an automated and sensitive version of the conventional SDS-PAGE immunoblot technique. Instead of using a gel for protein separation, proteins travel along a capillary using an electric gradient and are immobilized photochemically at the capillary wall. Protein detection using CE was firstly developed with the aim of providing a more precise immunoblot experience [23]. After sample preparation, the machine runs in a fully automated manner, producing quantifiable results in less than one day [24–26]. Considering an optimized plate set-up on the Simple Western Peggy Sue device (Bio-techne, Minneapolis, MN, USA), up to 88 independent protein lysates can be individually incubated with one primary antibody and its respective secondary antibody, or 11 protein lysates using 8 different antibodies.
In the present study, we describe the detection of aSyn expression in mouse tissue using size-based CE Simple Western on a Peggy Sue device. For this, aSyn was detected in tissue lysates from central (midbrain) and non-central origin (inner ear and esophagus/stomach) by the automated CE immunoassay. Subsequently, aSyn expression was detected using the same tissue samples employing the traditional SDS-PAGE immunoblot technique.
MATERIALS AND METHODS
Tissue extraction
Six 15- to 18-month-old male wild type (WT) C57BL/6J mice were used for experiments. Animals were acquired from the Central Research Animal Facility of the University Medical Center Göttingen, Germany. Two 5-week-old female aSyn null mice, C57BL/6JOlaHsd, were obtained from Envigo (Horst, The Netherlands). These mice correspond to a C57BL/6J substrain carrying a deletion in the aSyn locus (Snca), resulting in a lack of Snca expression [27, 28]. The C57BL/6JOlaHsd substrain has been widely used as a mouse model for aSyn deficiency [29–31]. All experimental procedures were performed according to the German animal welfare regulations by the state of Lower Saxony (LAVES). Mice were euthanized with carbon dioxide and rapidly transcardially perfused with phosphate buffered saline (PBS) to eliminate all blood from the circulatory system and tissues. The organs collected included midbrain, inner ear, and esophagus/stomach. After dissection, tissues were instantly frozen and stored at –150°C until further preparation steps.
Preparation of tissue lysates
Tissues were thawed and collected in tissue protein extraction reagent lysis buffer (T-PER, Thermo Fischer Scientific, Darmstadt, Germany) supplemented with protease and phosphatase inhibitors (Roche, Basel, Switzerland) and homogenized at 4°C using the Precellys 24 Tissue Homogenizer (Bertin Technologies, Montigny-le-Bretonneux, France). Tissue lysates were then centrifuged at 4°C and 17530 x g for 10 min in a fixed angle rotor. The supernatants were then collected into fresh tubes. Protein concentrations were determined using the Bradford Protein Assay on the Tecan infinite M200 PRO plate reader (Männedorf, Switzerland). Samples were then stored at –80°C until used for experiments.
Simple Western automated capillary electrophoresis (CE) immunoassay
Size-based CE Simple Western immunoassays were performed using the Peggy Sue device (Bio-techne) according to the manufacturer’s instructions. Reagents used included the 12–230 kDa Peggy Sue Separation Module, which consists of capillaries, plates, wash buffer, upper and lower running buffers 2, upper and lower running buffer cups, wash buffer cup, cleaning sponges, separation matrix 2, stacking matrix 2, 10x sample buffer and standard pack1 with DTT and FL standard master mix (Bio-techne). For detection, anti-mouse secondary antibody (#042–205, Bio-techne), streptavidin-HRP for protein ladder detection (#042–414, Bio-techne) and total protein streptavidin-HRP (#042–976, Bio-techne) were used additionally. Tissue lysate dilutions were prepared using 0.1x sample buffer and 5x Master Mix containing DTT, SDS and fluorescent standards (Bio-techne). Samples were denaturized at 95°C and 800 rpm for 5 min (Thermomixer comfort, Eppendorf). All samples were pipetted onto a 384-well assay plate in technical duplicates. Anti-total aSyn mouse antibody (#610787 BD Transduction Laboratories, Heidelberg, Germany) was diluted 1 : 40 with antibody diluent (Bio-techne). Together with the anti-mouse secondary HRP-conjugated antibody (#042–205, Bio-techne), antibodies and samples were dispensed into designated wells in a 384-well plate according to the manufacturer’s preparation template. The plate was spun for 5 min and 1000 x g at room temperature (RT) in a swing out rotor. The Peggy Sue size assay was programmed with the Compass for Simple Western software (Bio-techne, version 3.1.7). The fully automated steps performed by Peggy Sue can be described as follows: The capillaries were filled sequentially with the separation matrix, stacking matrix and the final sample mixture, followed by electrophoretic protein separation inside the capillaries at 250 V for 40 min. To photochemically immobilize the proteins to the inner capillary walls, the capillaries were exposed to UV light for 250 s. Excess matrix was removed by washing the capillaries three times with washing buffer. For blocking, antibody diluent was applied for 23 min, followed by incubation with the primary antibodies for 30 min. Two wash cycles were followed by incubation with HRP-conjugated secondary antibodies for 30 min. After two further wash cycles, the luminol/peroxide mixture was loaded into the capillaries and chemiluminescence was recorded at different exposures: 4, 8, 16, 32, 64, 128, 256, 512 s. The detected chemiluminescent signals were analyzed using the Compass for Simple Western Software (Bio-techne, version 3.1.7).
SDS-PAGE immunoblot
Tissue lysates were denaturized in 4x Laemmli’s sample buffer (Bio-Rad, Feldkirchen, Germany) at 95°C for 5 min. 20μg of protein from each tissue lysate were loaded on 12% SDS-PAGE gels and separated at 120 V for 90 min. To improve transfer efficiency, the gel was immersed in 20% ethanol for 10 min. Then, proteins were transferred to polyvinylidendifloride (PVDF) membranes using the iBlot 2 Dry Blotting System (Invitrogen, Carlsbad, CA, USA) for 7 min at 25 V, 0.9 A. Immediately after the transfer, membranes were stained in Total Protein Stain solution (Li-Cor, Bad Homburg, Germany), as described below. After washing with PBS, membranes were submitted to a fixation step using 4% PFA for 1 h at RT. This step was skipped for specific immunoblots in which the aim was to characterize the aSyn signal without membrane fixation. PVDF membranes were then placed in blocking solution containing 5% bovine serum albumin (BSA) in TBS-Tween 0.05% for 1 h at RT before the first antibody solution was added. Membranes were incubated overnight at 4°C in blocking solution containing anti-total aSyn mouse monoclonal antibody (#610787 BD Transduction Laboratories) in a dilution of 1 : 3,000. The next day, membranes were washed in TBS-Tween 0.05% and incubated for 1 h at RT in blocking solution containing IRDye secondary anti-mouse antibody (#926–32212, Li-Cor) in a dilution of 1 : 10,000. Following several washing steps in TBS-Tween 0,05%, fluorescent immunodetection was performed using Odyssey CLx (Li-Cor) according to the manufacturer’s instructions.
Total protein detection and aSyn normalization using CE and SDS-PAGE
In CE, total protein detection was executed automatically during the same experimental assay as aSyn, but run separately in different capillaries. Following automatic sample loading and protein immobilization, capillaries were loaded with a biotinylation reagent for 30 min. The chemiluminescent signal was subsequently obtained after adding streptavidin-HRP conjugate (#042–414, Protein Simple) for 30 min and two washing steps with wash buffer.
The total protein detection for SDS-PAGE was performed after completion of the transfer using fluorescence immunodetection. PVDF membranes were rinsed in distilled H2O, followed by 5 min incubation at RT with Revert 700 Total Protein Stain solution (Li-Cor). Image acquisition for fluorescent immunodetection was subsequently performed using Odyssey CLx (Li-Cor) according to the manufacturer’s instructions.
The normalization of each aSyn signal to the Total Protein signal was performed manually for both CE and SDS-PAGE, following equivalent calculations.
Quantitative analysis
The aSyn chemiluminescent signal detected on the size-based CE Simple Western system was automatically quantified by the Compass for Simple Western software (Bio-techne, version 3.1.7). In SDS-PAGE immunoblots, the levels of aSyn detection and total protein were quantified by measuring band fluorescence intensity using the Image Studio Software (Li-Cor). In both CE and SDS-PAGE, the detected aSyn signal was normalized to total protein levels.
RESULTS
Optimization of antibody and protein concentrations for CE (Simple Western)
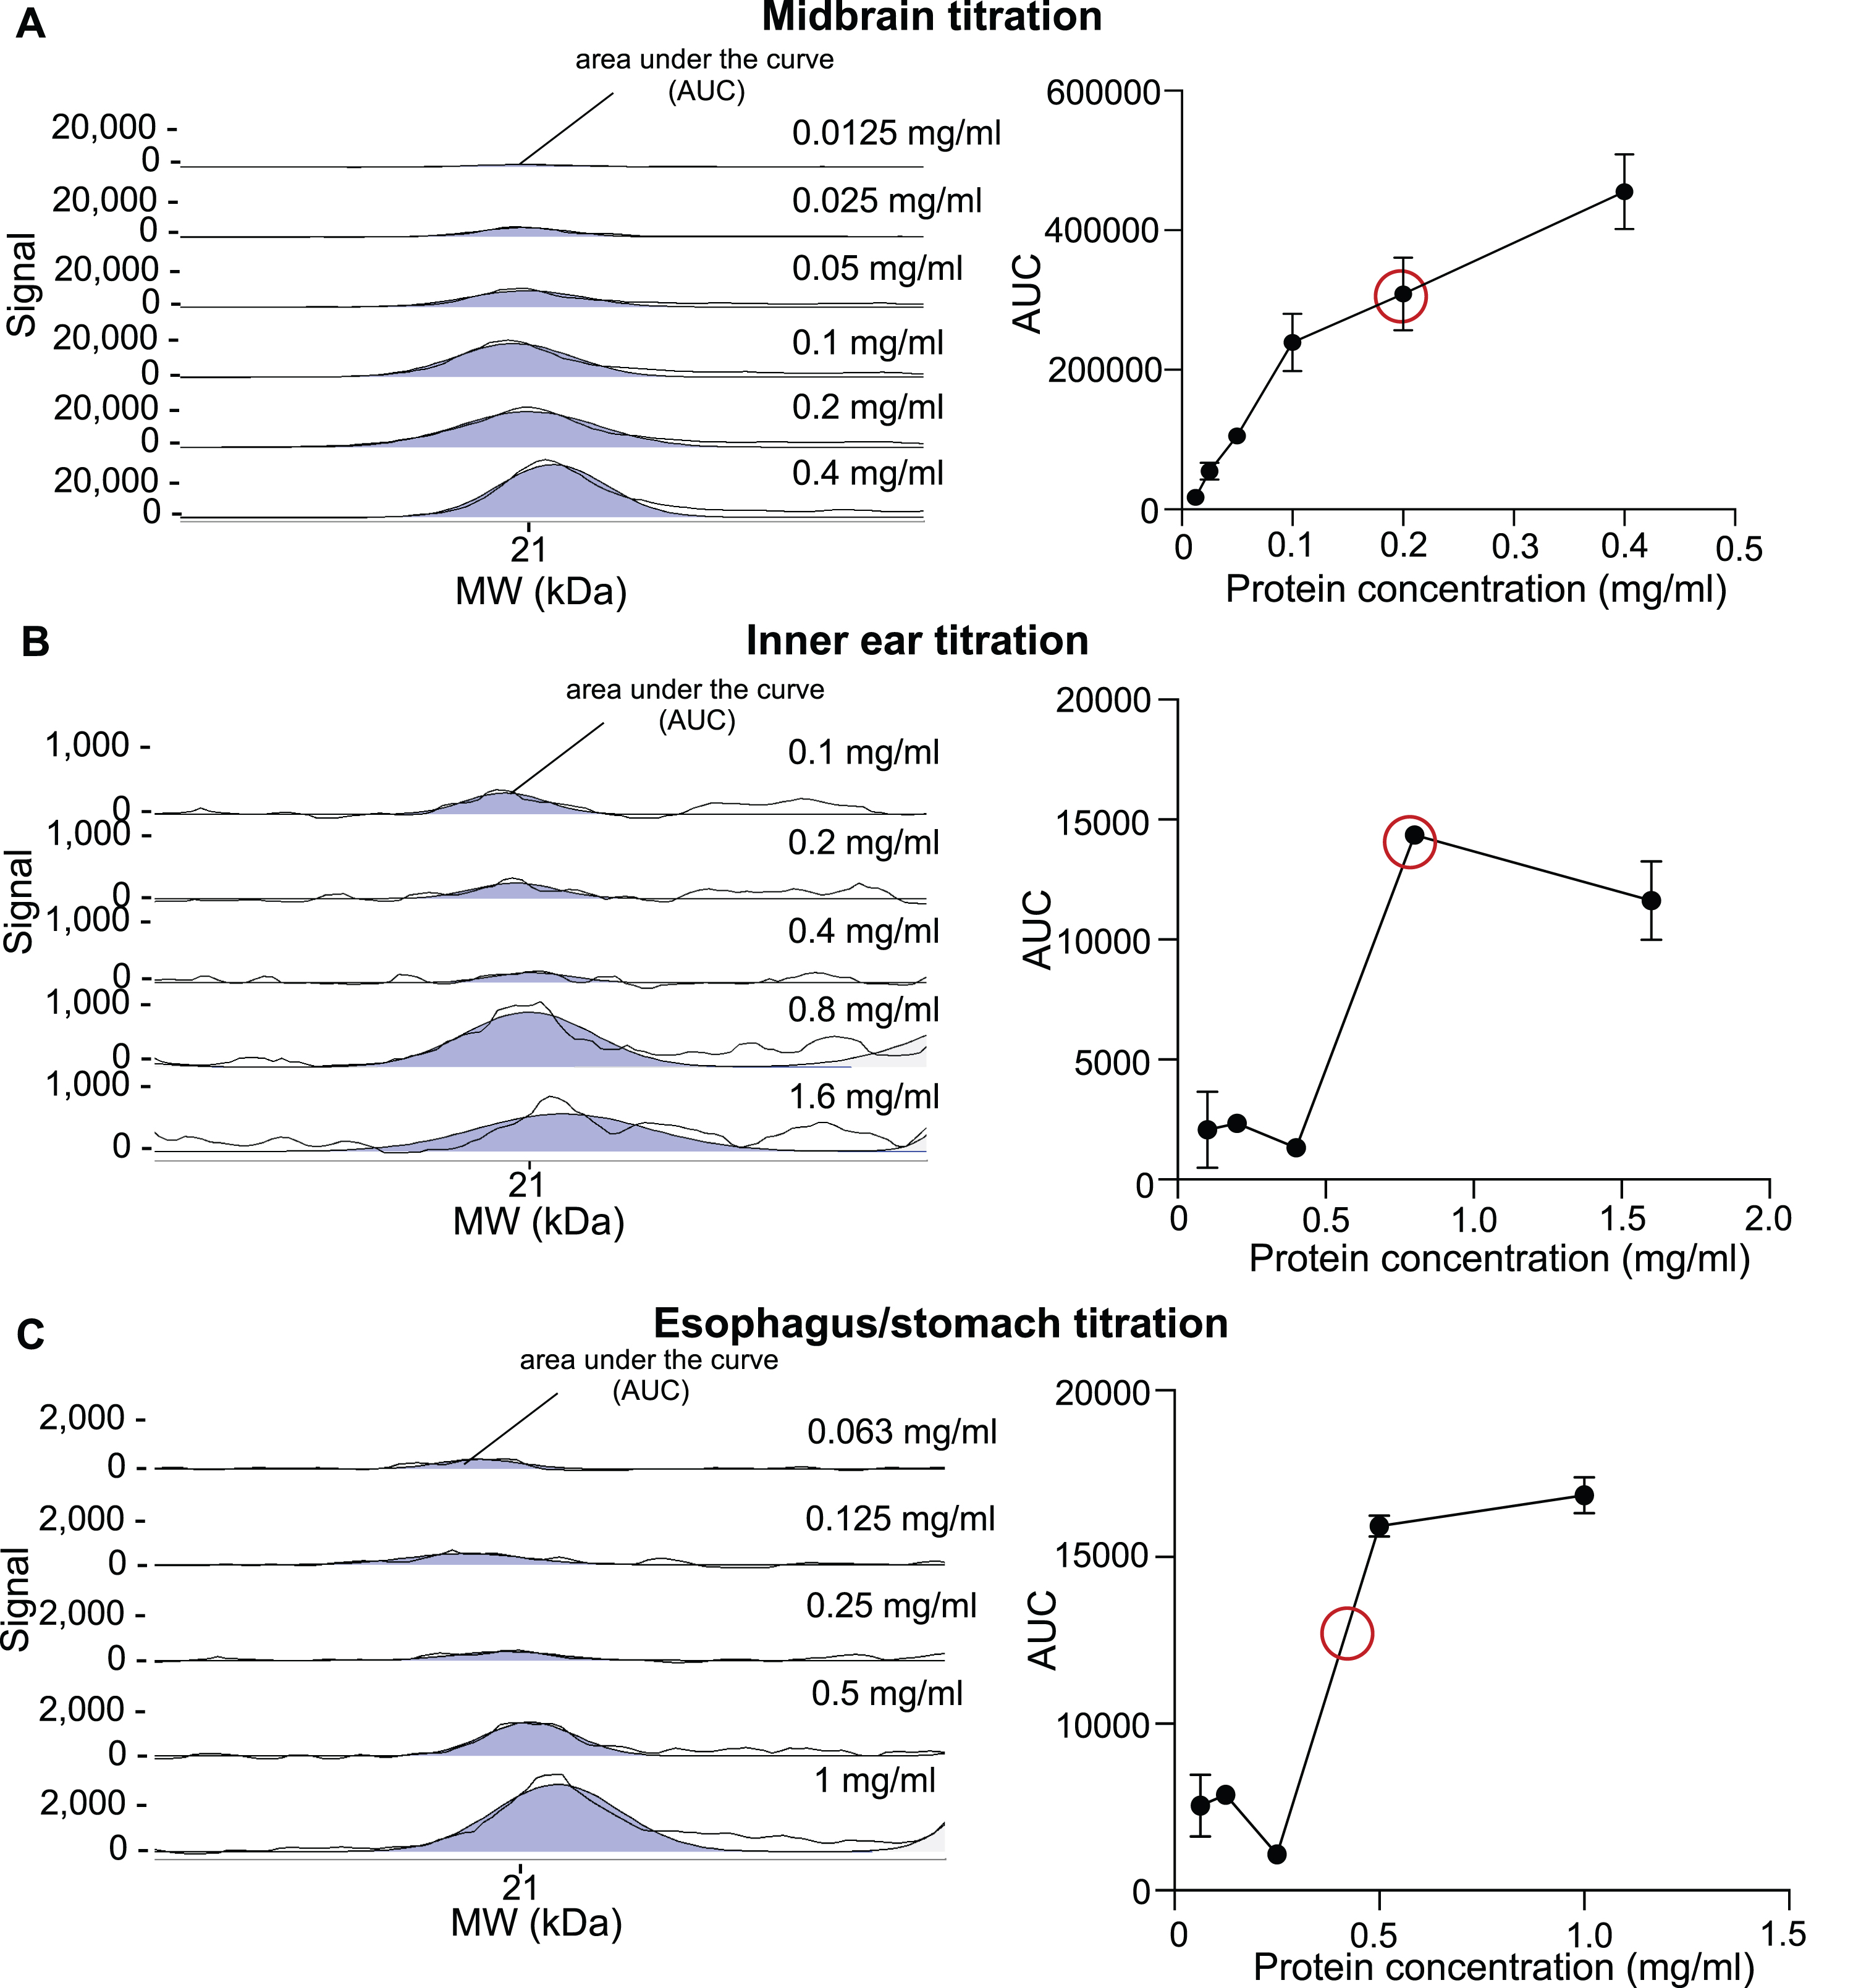
The primary antibody dilution and tissue protein amount were titrated to assess the quantitative assay range. For aSyn antibody titration, midbrain samples were chosen. The anti-total aSyn antibody was tested in different concentrations ranging from 0.00625 mg/ml to 0.2 mg/ml, aiming to reach an antibody saturation of approximately 95% to 99%. This was reached at an estimated concentration of 0.025 mg/ml (Fig. 1). Tissue-specific titration experiments followed using the anti-total aSyn antibody at a concentration of 0.025 mg/ml (1 : 40). To determine the linear detection range of aSyn in the midbrain, inner ear and esophagus/stomach tissue lysates, samples with a protein concentration between 0.0125 mg/ml and 1.6 mg/ml were subjected to CE immunoassay. A useful protein concentration of 0.2 mg/ml was determined for the midbrain and therefore chosen for subsequent experiments. For inner ear and esophagus/stomach tissues, 0.8 mg/ml and 0.4 mg/ml were selected, respectively (Fig. 2).
Fig. 1
Optimization of anti-total aSyn antibody dilution for CE in midbrain tissue. A midbrain tissue lysate with a protein concentration of 0.2 mg/ml was subjected to CE Simple Western immunoassay using anti-total aSyn antibody in a range of dilutions (1 : 160, 1 : 80, 1 : 40, 1 : 20, 1 : 10, 1 : 5). The total aSyn signal is shown as the area under the curve (AUC) in the selected electropherograms (left). The two black lines in each electropherogram represent both the original curve and an adaptation to the fitted peaks. Values for the AUC at 21 kDa of different antibody dilutions were automatically quantified by the Compass for Simple Western software and depicted as a saturation curve (right). To reach a 95-99% antibody saturation range, a protein concentration of 0.025 mg/ml (1 : 40) for the anti-total aSyn antibody is required (red lines). This dilution was used for all subsequent experiments, including the detection of total aSyn in different tissues.
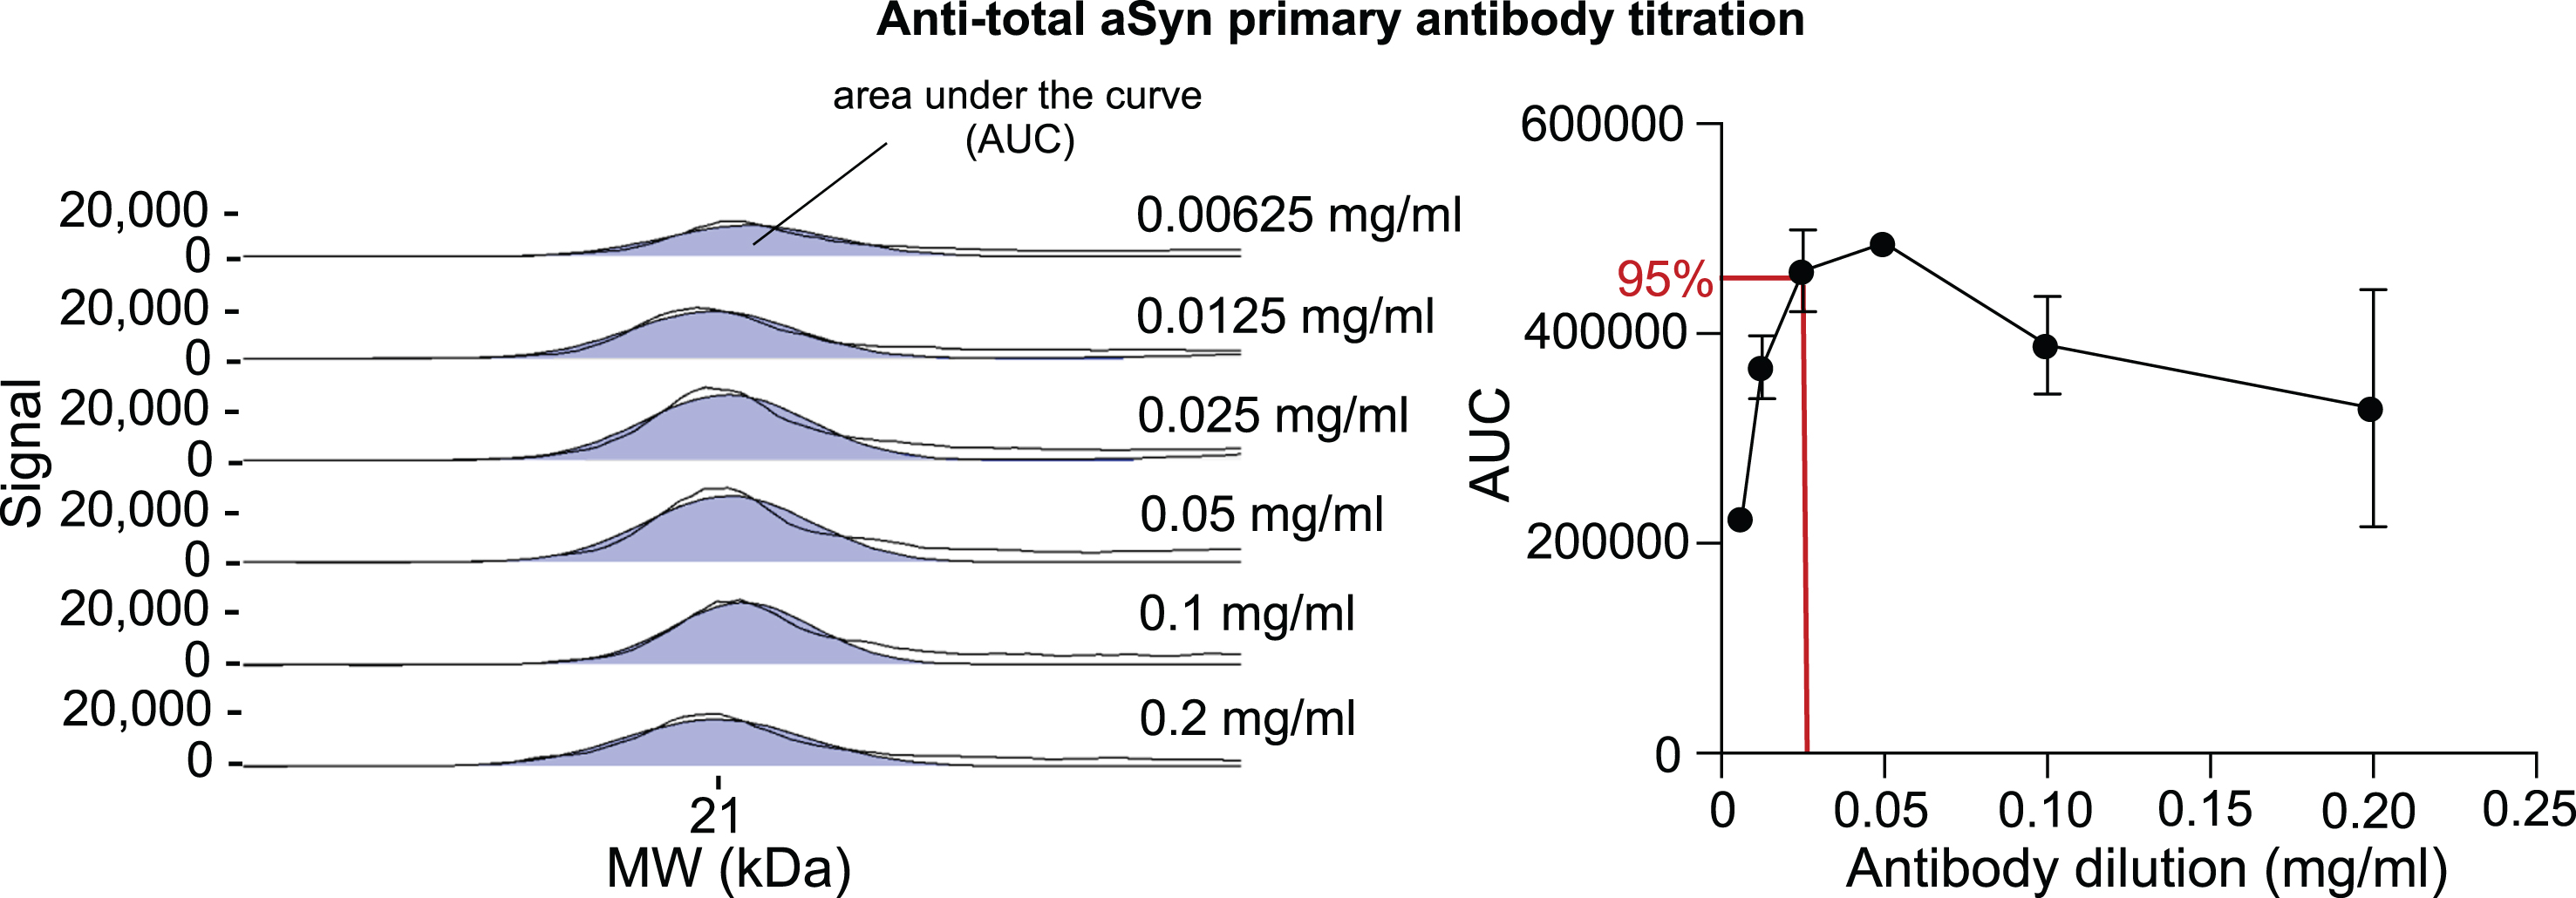
Fig. 2
Optimization of lysate protein concentrations for midbrain, inner ear, and esophagus/stomach tissues for CE using anti-total aSyn antibody. Tissue lysate dilutions with different protein concentrations, ranging from 0.0125 mg/ml to 1.6 mg/ml, were subjected to CE Simple Western immunoassay using anti-total aSyn primary antibody at a dilution of 1 : 40. The selected electropherograms are shown on the left-hand side. The black lines represent both the selected electropherogram curve and a curve representing the adaptation to the fitted peaks. On the right, the quantified areas under the curve (AUC) were plotted against the corresponding protein concentrations. The useful linear assay range was estimated from the curve. The concentration chosen within the linear range for aSyn detection (red circle) remains tissue-specific and corresponds to 0.2 mg/ml for midbrain tissue lysate (A), 0.8 mg/ml for inner ear tissue lysate (B), and 0.4 mg/ml for esophagus/stomach tissue lysate (C).
As a linear range also needed to be determined for the total protein assay, an undiluted total protein biotinylating reagent and, for comparison, a 1 : 3 dilution in H2O were tested on midbrain samples, loaded at different protein concentrations. Based on the results obtained, a total protein reagent dilution of 1 : 3 was selected for inner ear and esophagus/stomach tissues, whereas an undiluted total protein reagent was selected for midbrain tissue (Supplementary Figure 1).
aSyn detection by CE immunoblot (Simple Western)
aSyn was detected in both central and peripheral tissues using the automated size-based CE Simple Western system. A signal for aSyn was observed at an apparent molecular mass of 21 kDa in the midbrain, inner ear, and esophagus/stomach tissue lysates of 18-month-old WT C57BL/6J mice (Fig. 3).
Fig. 3
Peak assignment: Identification of the aSyn signal on CE (Simple Western) immunoblot. Midbrain tissue lysates with a protein concentration of 0.2 mg/ml (A), inner ear with 0.8 mg/ml (B) and esophagus/stomach with 0.4 mg/ml (C) of 18-month-old WT C57BL/6J mice were separated by capillary electrophoresis, immobilized by UV light, and incubated with either anti-total aSyn antibody or antibody diluent. A chemiluminescent signal was detected through HRP-conjugated secondary antibody. For each of the tissues, three conditions were assessed: 1) incubation of WT mouse tissue with anti-total aSyn antibody (WT+primary and secondary ab), 2) incubation of WT mouse tissue without primary antibody (WT+only secondary ab) and 3) incubation of aSyn KO mouse tissue with anti-total aSyn antibody (KO+primary and secondary ab). For all three tissues, a peak with an apparent molecular mass of 21 kDa could be assigned to aSyn (depicted in blue). Detection signals observed above the 40 kDa region in peripheral tissues correspond to cross-reactivity of either the primary antibody, the secondary antibody, or both. The black lines represent both the selected electropherogram curve and a curve representing the adaptation to the fitted peaks.
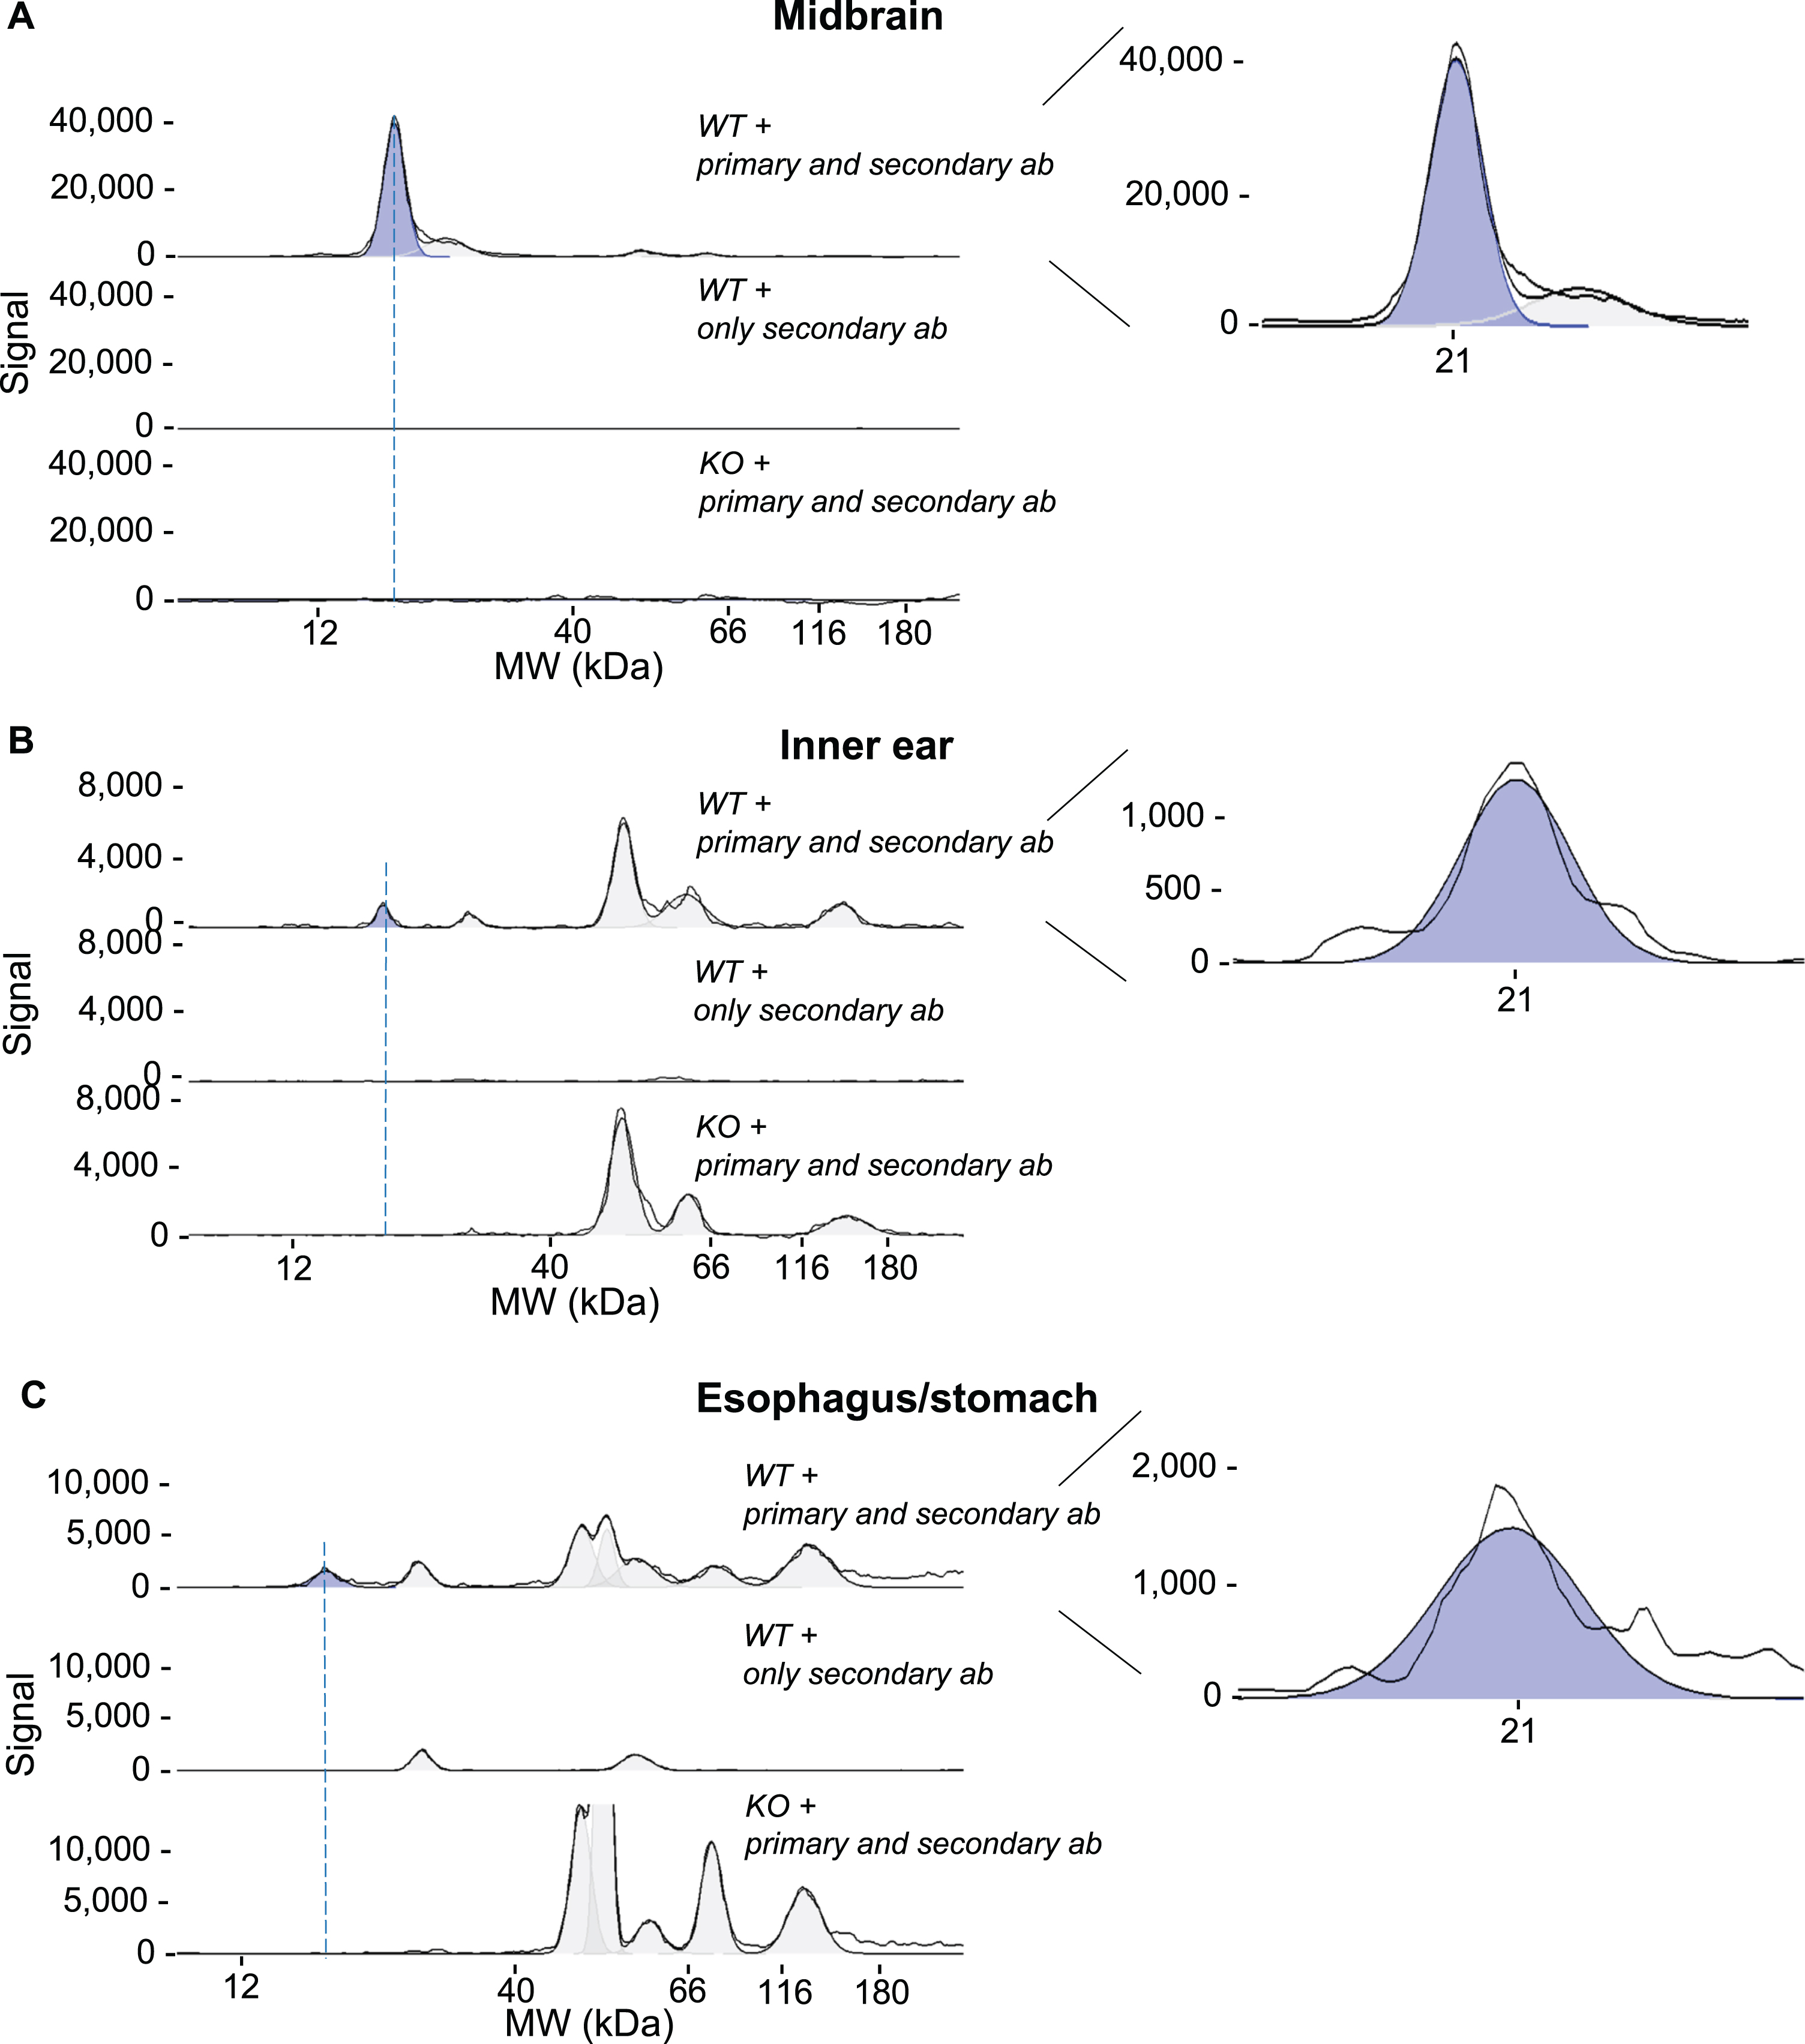
A signal corresponding to aSyn was detected as a single peak at 21 kDa in the midbrain. In peripheral tissues, such as the inner ear and esophagus/stomach, in addition to the aSyn signal at 21 kDa, a background signal at higher molecular weights was also observed. To confirm the assignment of the 21 kDa peaks as aSyn, we conducted control experiments, which included incubation with only the secondary antibody, as well as the use of tissue-specific lysates from the aSyn null mice substrain C57BL/6JOlaHsd (Fig. 3).
Peaks ranging from 50 kDa to 180 kDa were detected after incubating aSyn KO tissue with primary anti-aSyn antibody. Additional peaks around 30 kDa and 60 kDa were observed when incubating tissue lysates of non-central origin with only a secondary antibody, indicating their likely nonspecific nature. These observations indicate the presence of a 21 kDa peak corresponding to aSyn in both central and peripheral tissues (Fig. 3).
Midbrain, inner ear, and esophagus/stomach tissues from five different mice were tested for aSyn expression in relation to total protein, which was chosen as loading control between tissues to enhance the signal accuracy of aSyn throughout the experiments (Fig. 4).
Fig. 4
Detection of aSyn in tissue lysates through CE (Simple Western) immunoblot. Tissue lysates of five biological replicates of 18-month-old WT C57BL/6J mice were loaded in duplicates and separated by CE. The protein concentration used for midbrain lysates was 0.2 mg/ml (A), for inner ear 0.8 mg/ml (B) and for esophagus/stomach lysates 0.4 mg/ml (C). Immunodetection of aSyn was performed with an anti-total aSyn antibody in a dilution of 0.025 mg/ml (1 : 40) and an HRP-conjugated secondary antibody. The total protein signal was detected using a total protein detection kit and HRP conjugated streptavidin and quantified by automated chemiluminescent signal measurements using the Compass for Simple Western software of the area under the curve (AUC). The aSyn detection signal is depicted in blue within the electropherograms at 21 kDa. The black lines represent both the selected electropherogram curve and a curve representing the adaptation to the fitted peaks. A single electropherogram curve was chosen to illustrate the total protein signal (A,B,C).
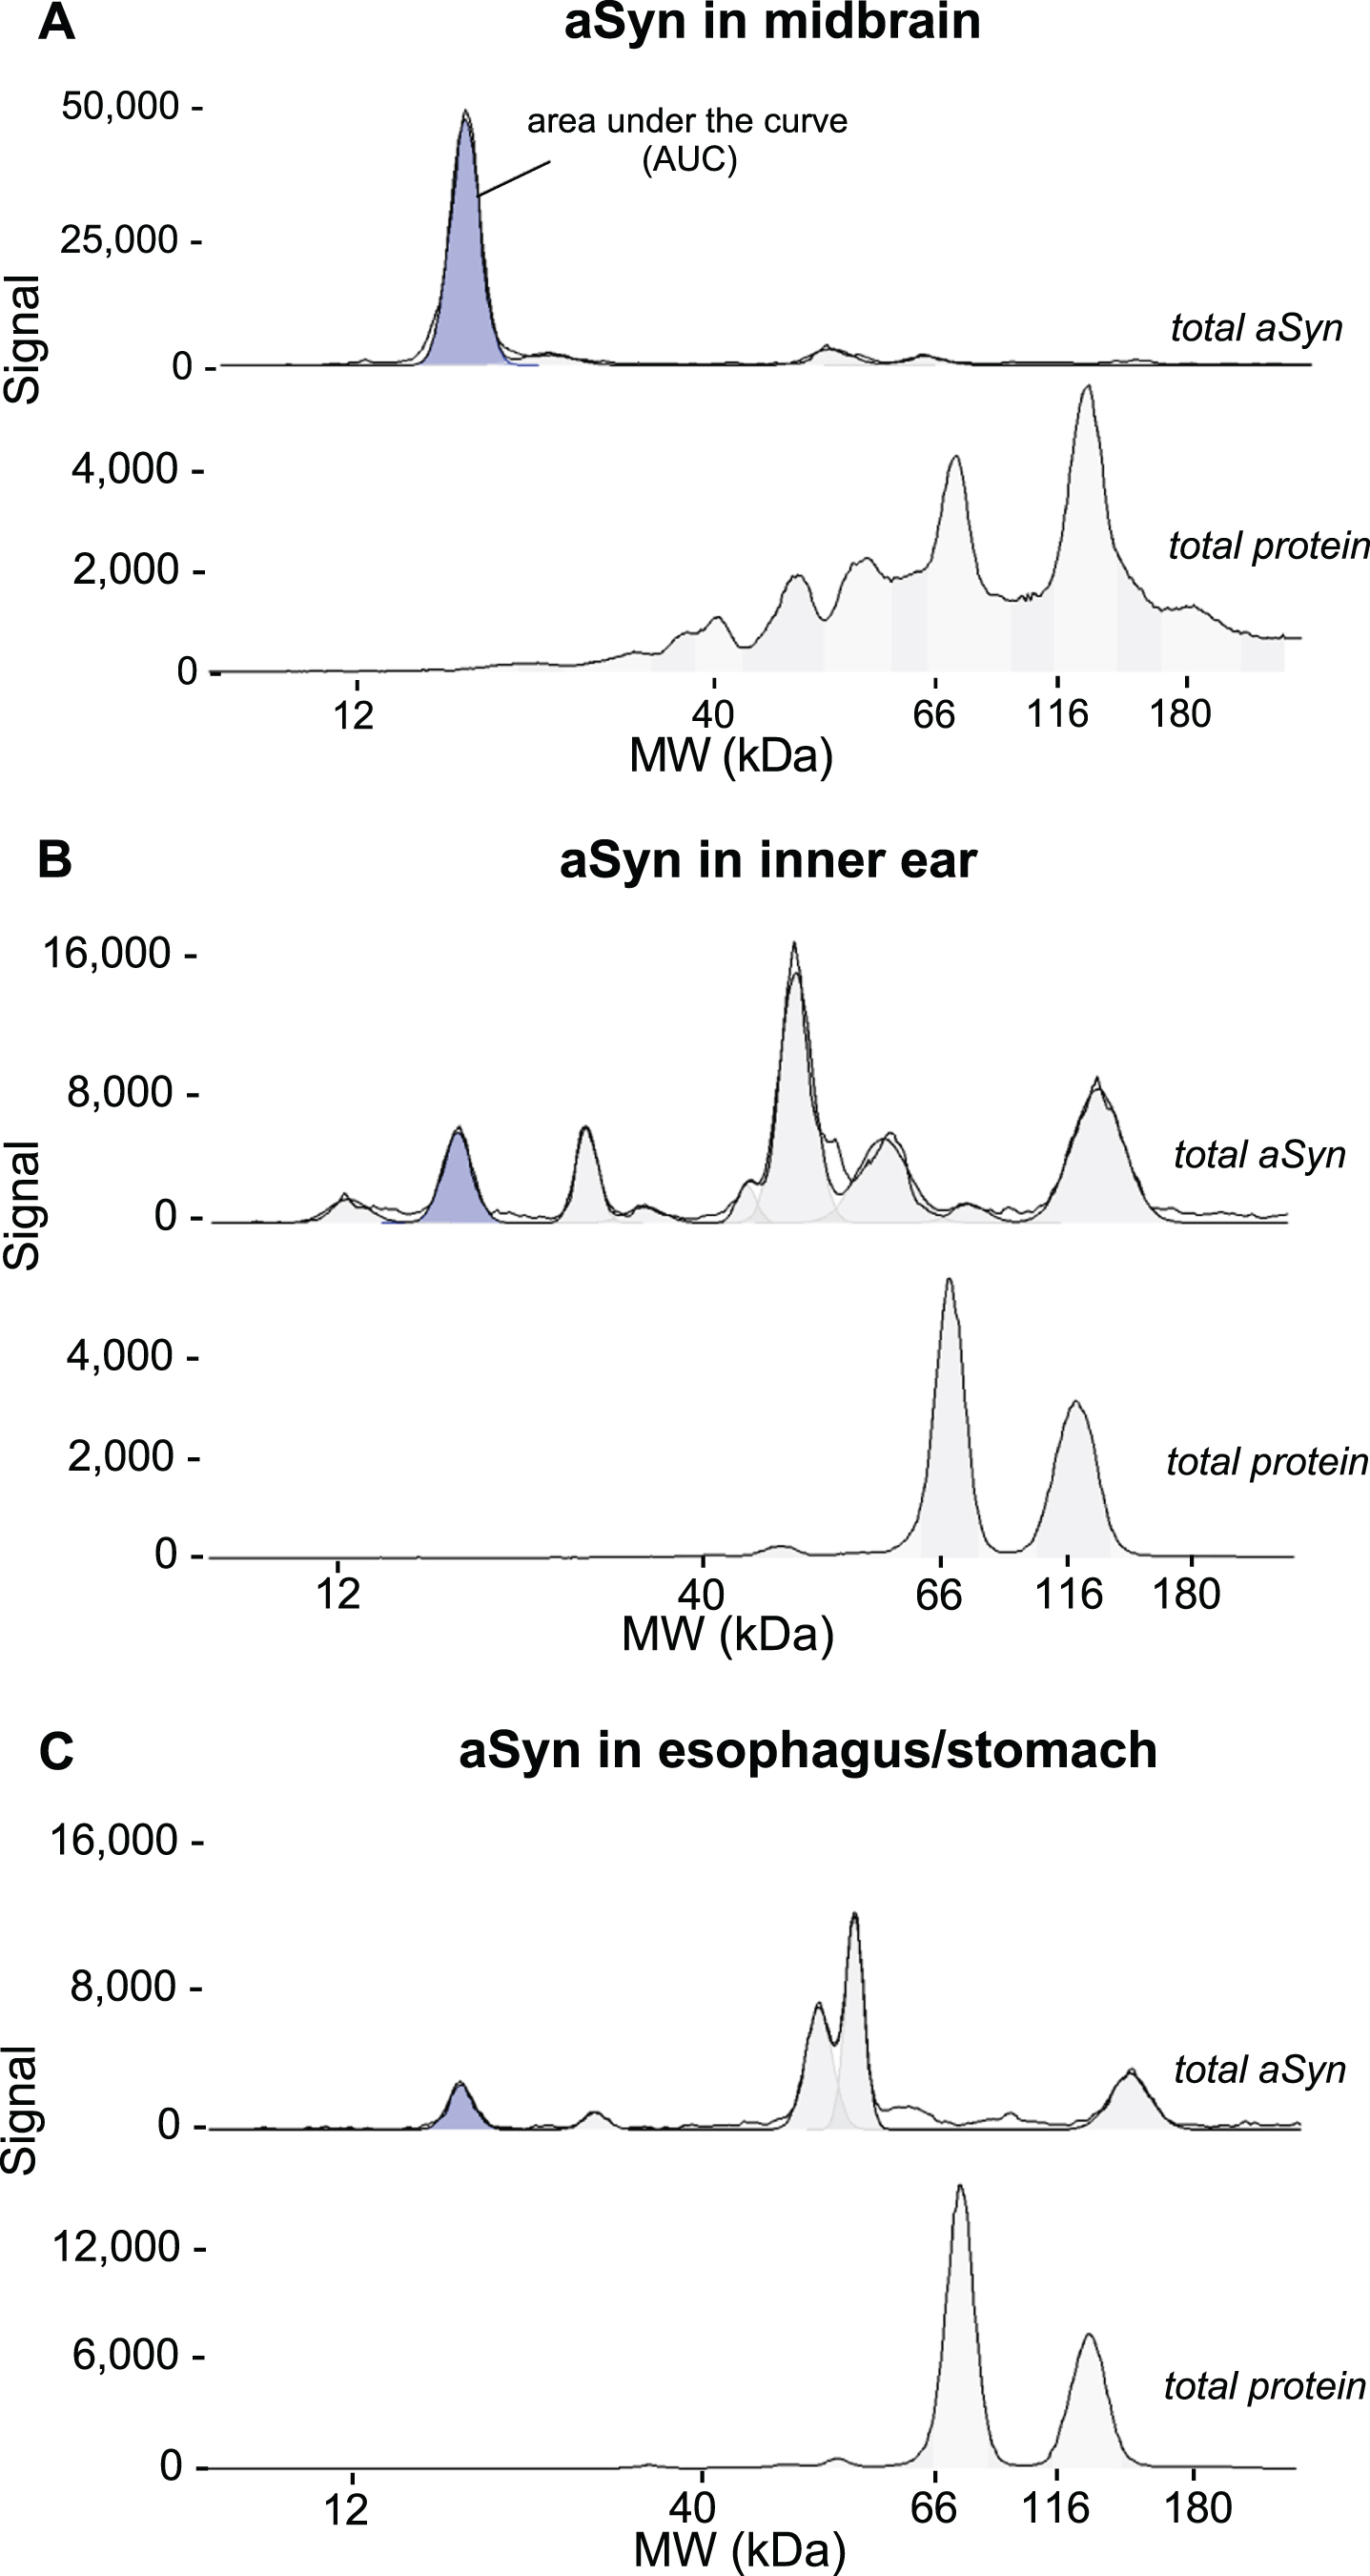
The 21 kDa aSyn signal in the midbrain was significantly stronger than in peripheral tissues (Figs. 4 and 6). In addition, the identified aSyn signal within the midbrain exhibited variability across individual animals, demonstrating an even greater fluctuation per animal in peripheral tissues (Fig. 6).
Fig. 5
Detection of aSyn in tissue lysates through SDS-PAGE immunoblot. Tissue lysates of five 15-month-old WT mice were subjected to SDS-PAGE. 20μg of protein lysates from midbrain (A), inner ear (B), and esophagus/stomach tissues (C) were loaded in triplicates and separated in the same polyacrylamide gel. The n4 runs were selected for each tissue for representation of the membrane. After transfer, membranes were stained in Total Protein Stain solution and then fixed with 4% PFA for 1 h at RT before incubation with anti-total aSyn antibody solution, followed by incubation with the IRDye-conjugated secondary anti-mouse antibody. The fluorescent immunodetection of the aSyn signal was performed at 800 nm, the total protein signal at 700 nm on the same membrane using Odyssey CLx (Li-Cor).
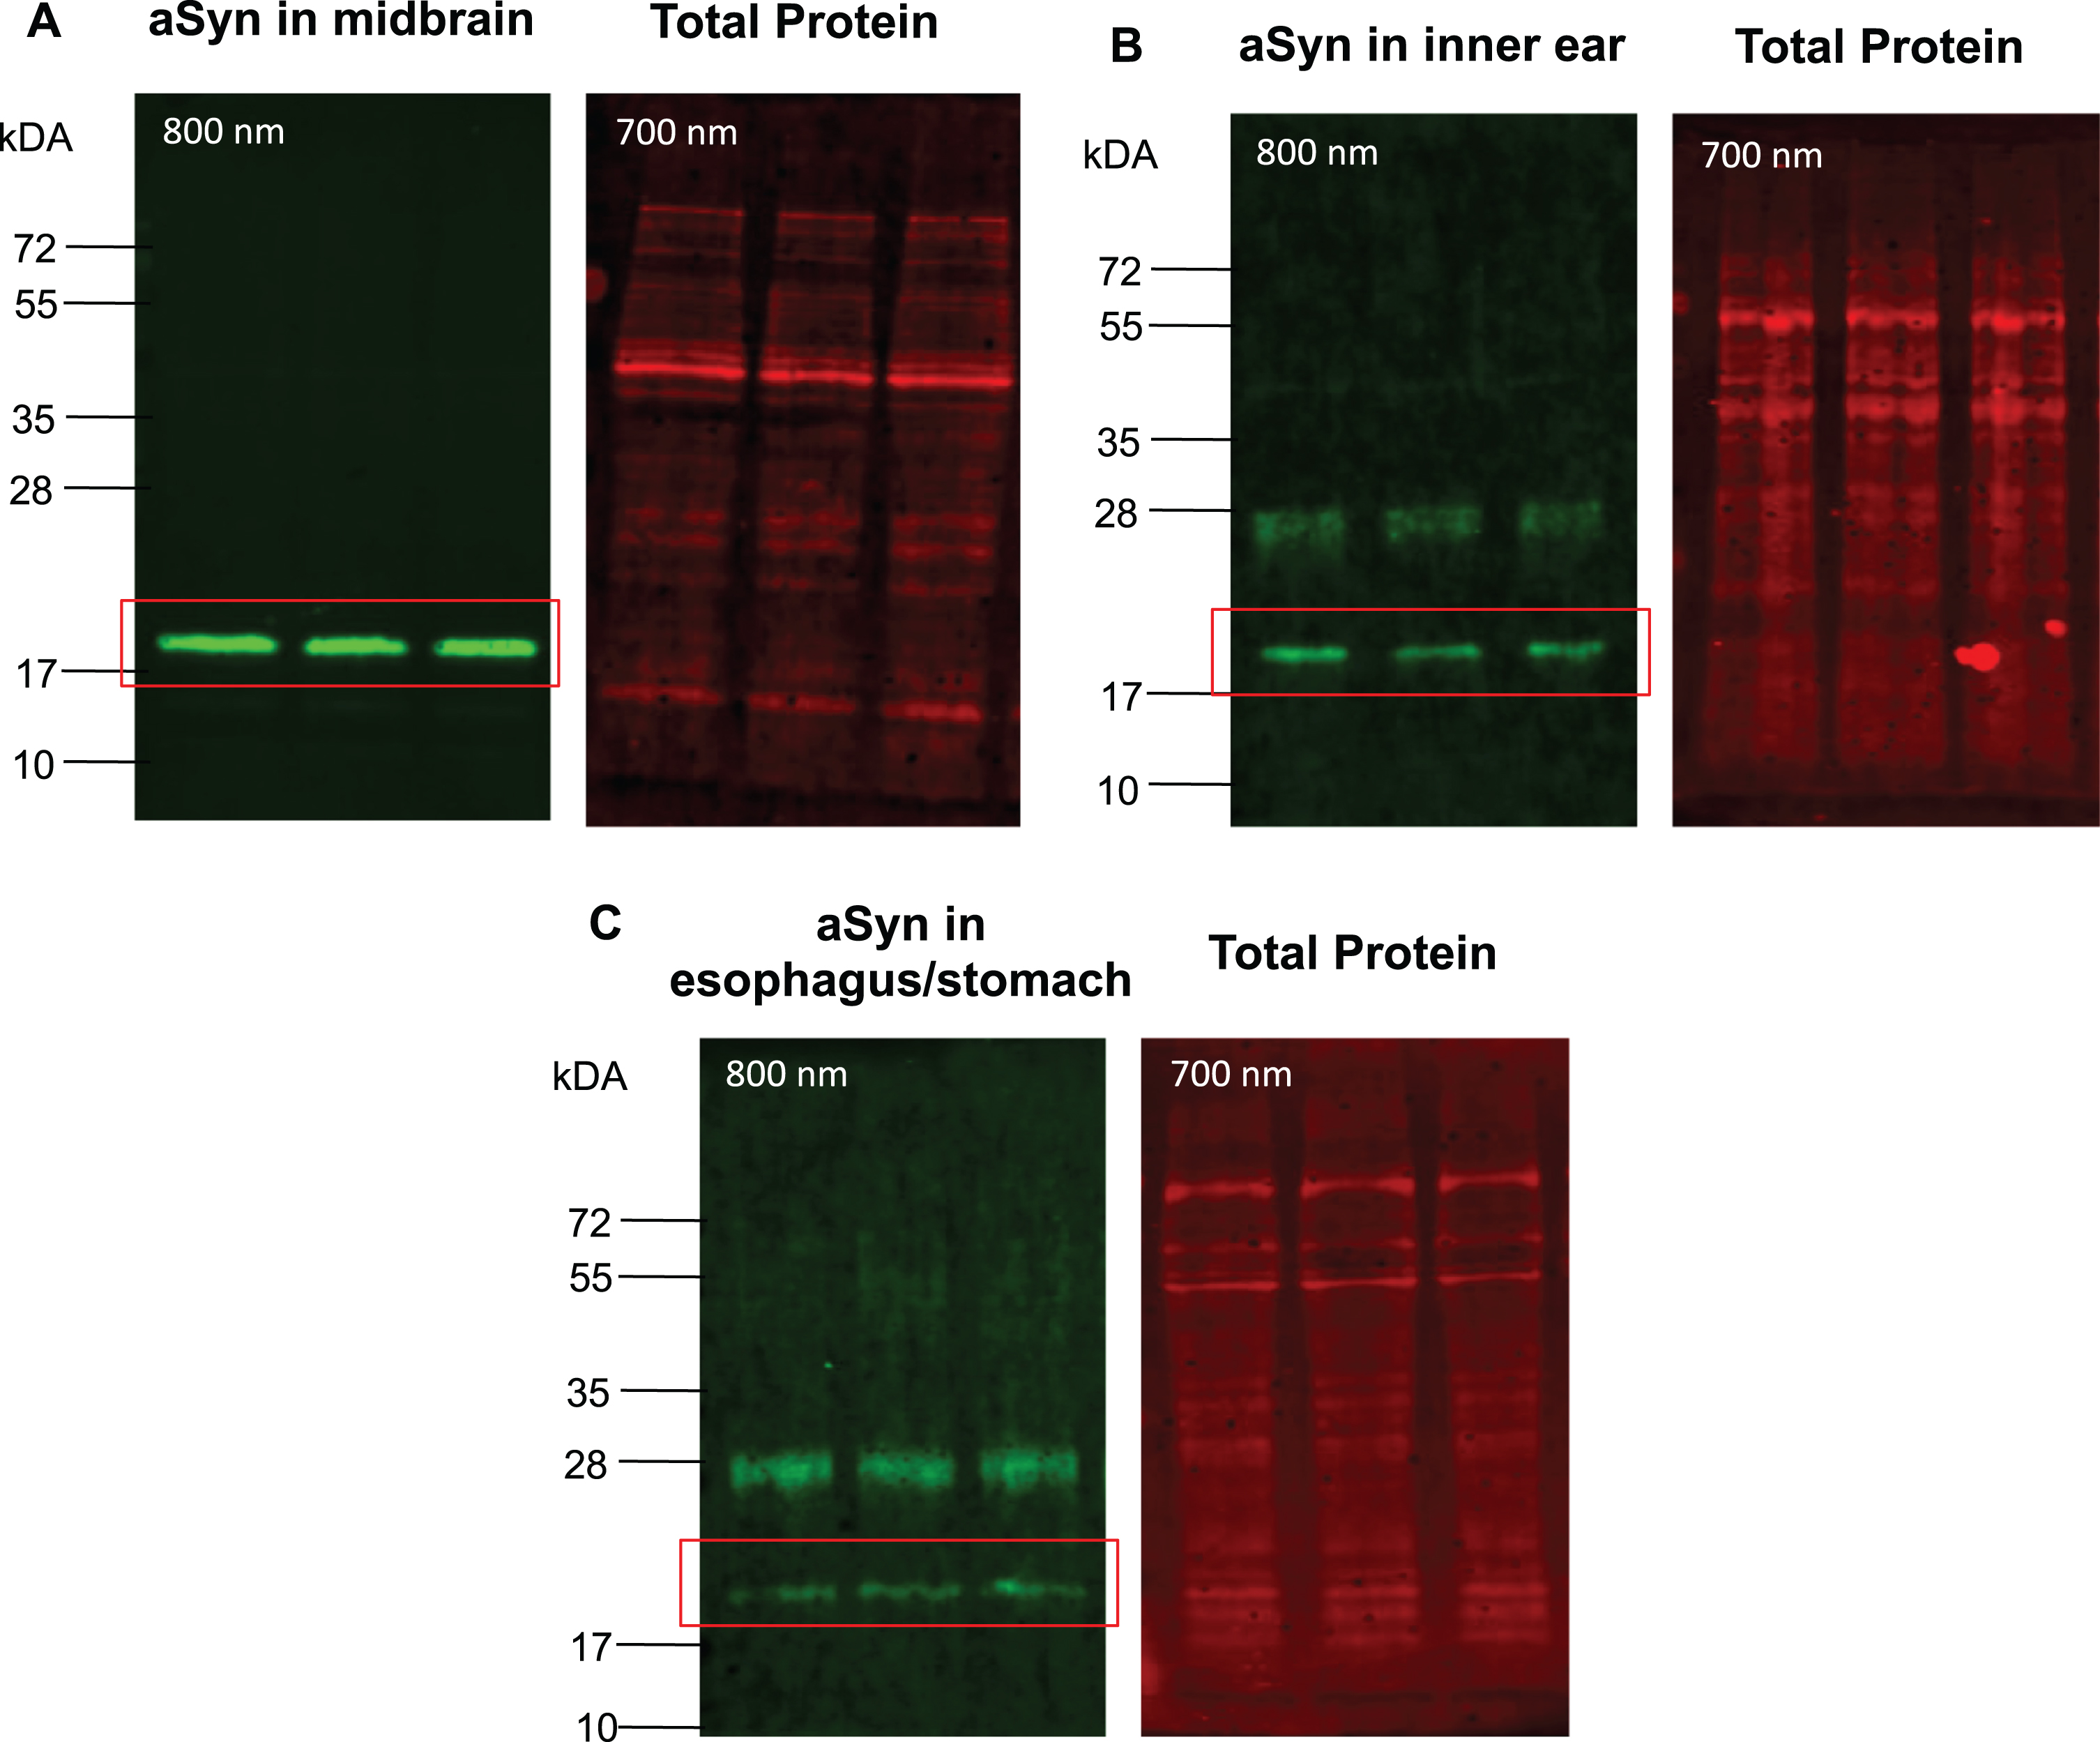
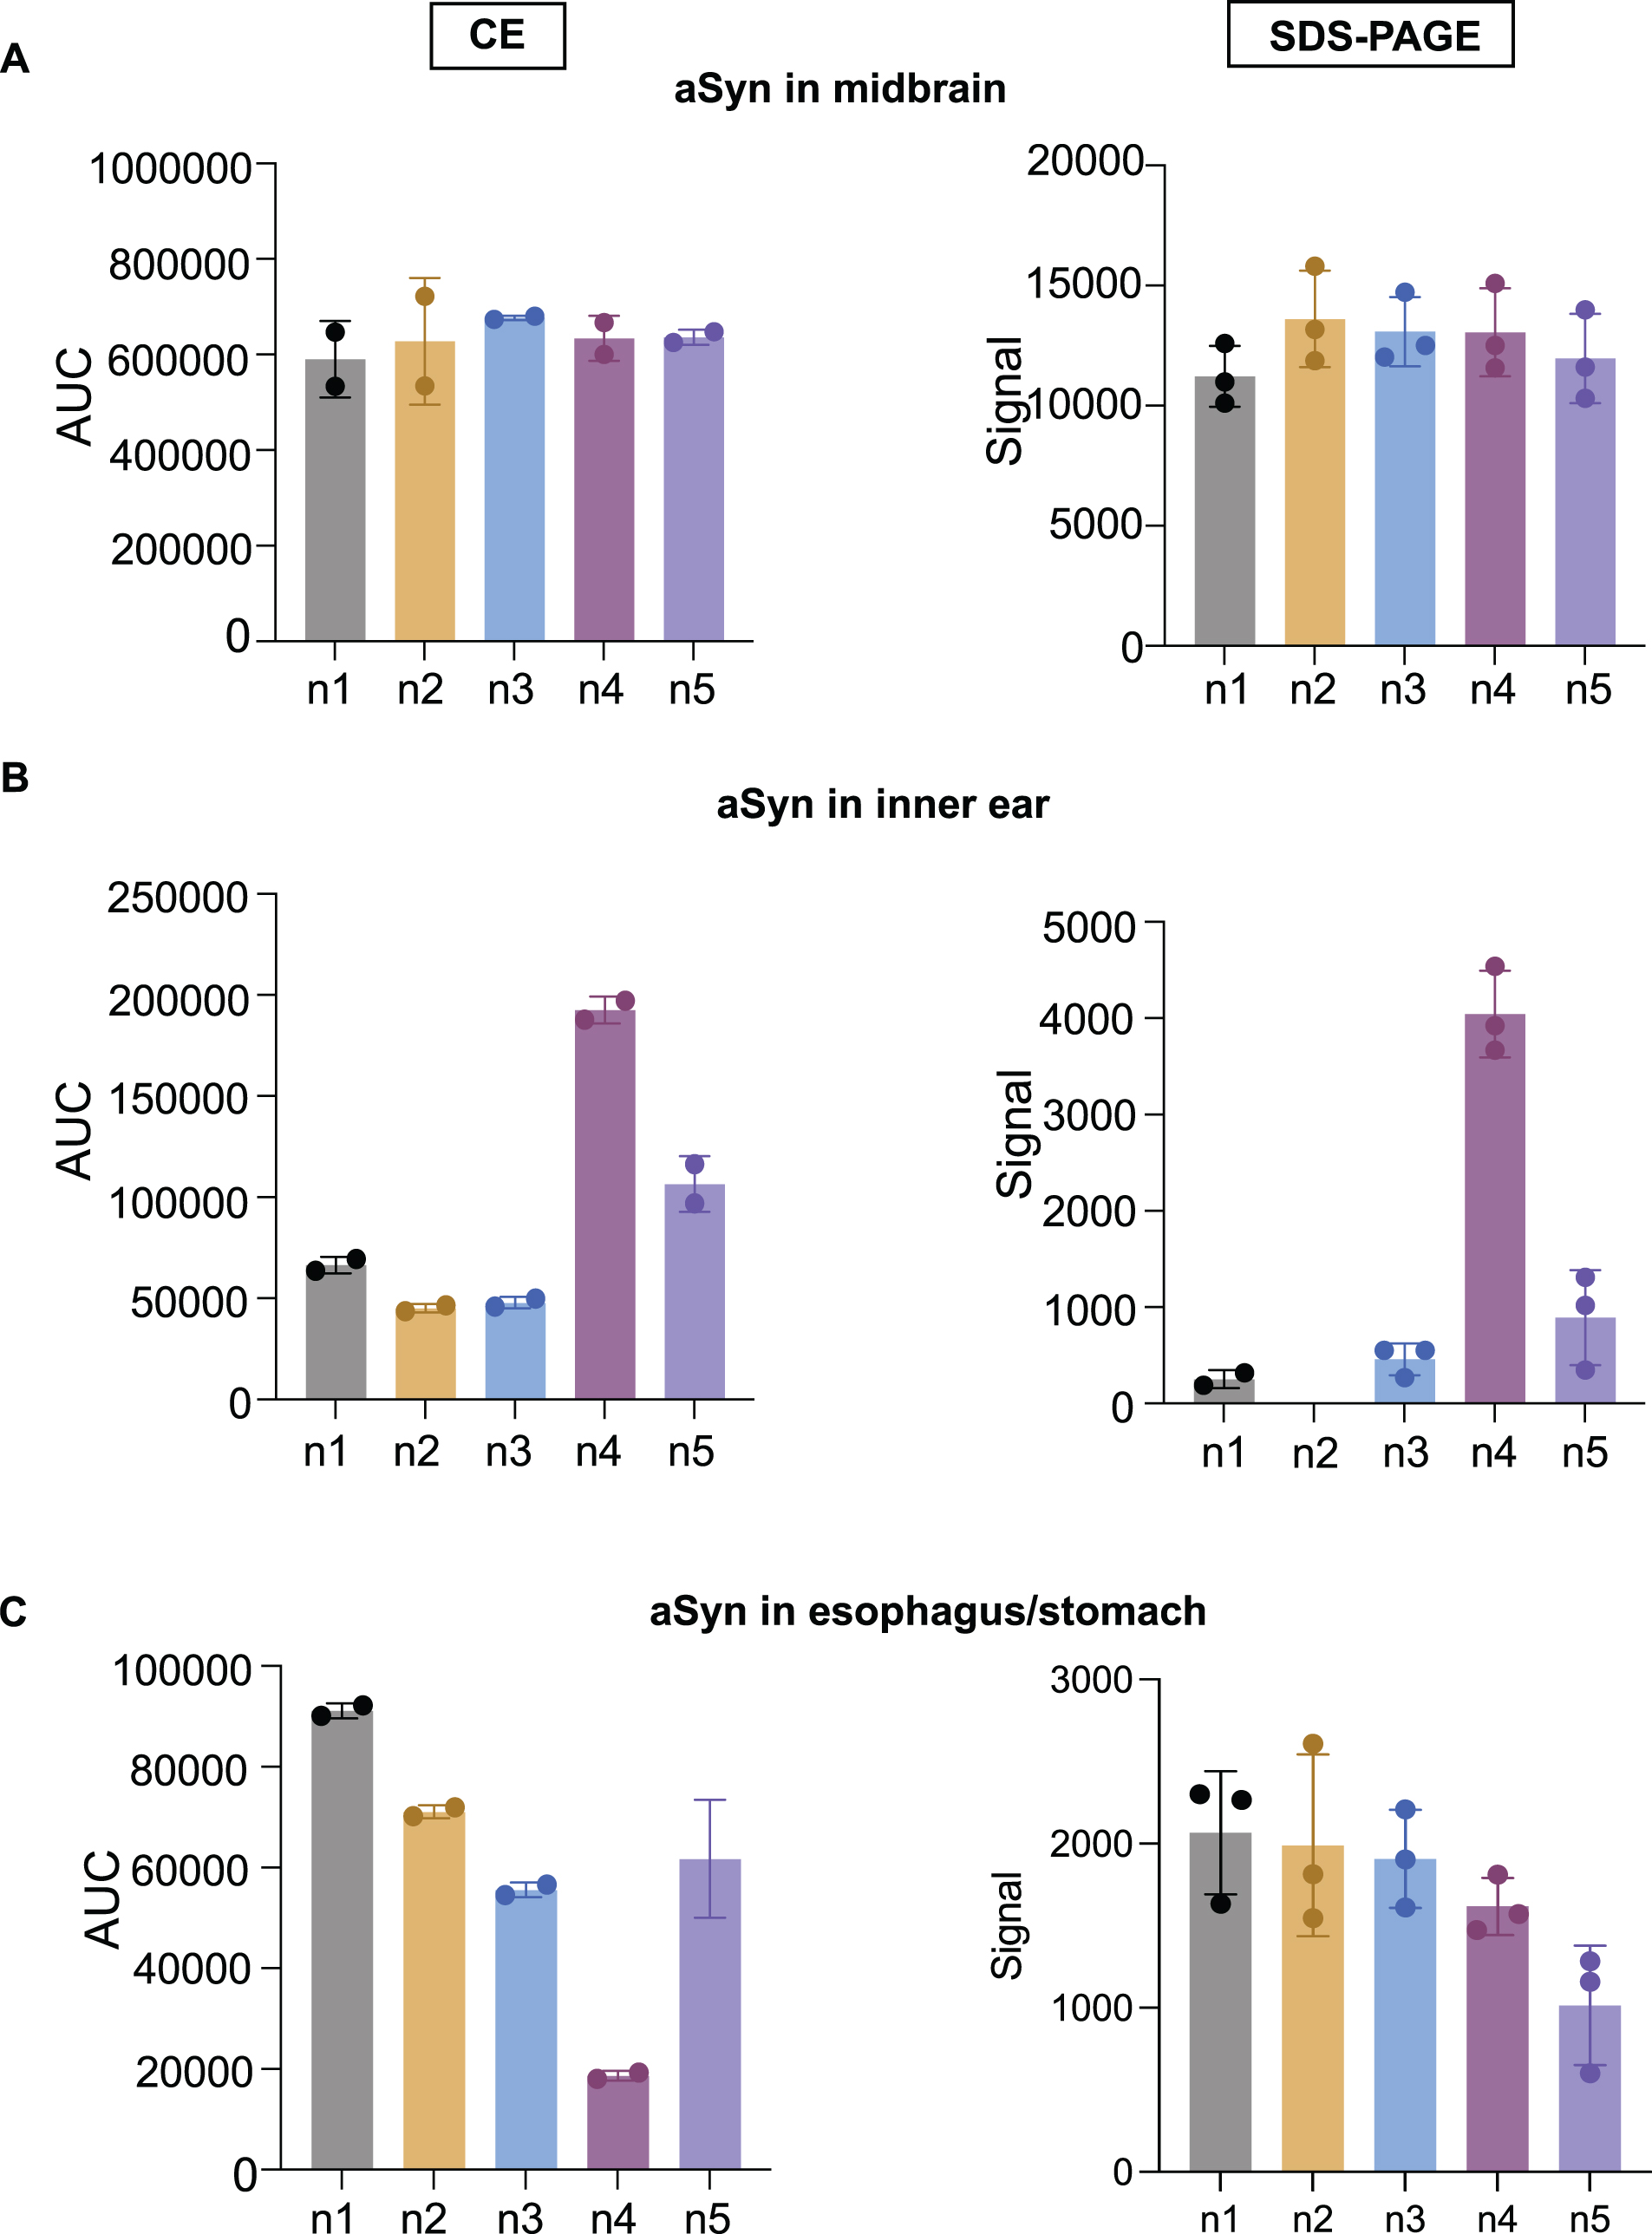
Fig. 6
aSyn detection signal in the midbrain, inner ear, and esophagus stomach tissues using CE and SDS-PAGE. Tissue lysates of five 15-month-old WT mice were subjected to CE and SD-PAGE. For CE, the protein concentration used for midbrain lysates was 0.2 mg/ml (A), for inner ear 0.8 mg/ml (B), and for esophagus/stomach lysates 0.4 mg/ml (C). Calculations were performed on dual technical replicates in separate capillaries within the same run. For SDS-PAGE, 20μg of protein lysates from midbrain, inner ear, and esophagus/stomach tissues were loaded in triplicates and separated in the same polyacrylamide gel. After transfer, the membrane was fixed with 4% PFA for 1 h at RT. The aSyn detection signal was quantified and normalized to total protein. On the bar graphs, the x-axis represents tissue-specific protein lysates from five different mice (n1-n5), and the y-axis represents the area under the curve (AUC) or signal by the mean±SD.
aSyn detection by SDS-PAGE immunoblot
aSyn was analyzed using the same tissue samples via conventional SDS-PAGE immunoblot, with the membrane either fixed post-transfer or not. A signal corresponding to aSyn at 18–19 kDa was consistently detected in central and peripheral tissues when the membrane underwent fixation (Figs. 5 and 6; Supplementary Figure 2). Without membrane fixation, a weak signal for aSyn at approximately 18–19 kDa was detected in the midbrain with a certain of degree of heterogeneity between signals. In peripheral tissues as the inner ear and esophagus/stomach, no signal corresponding to aSyn was observed in the expected molecular mass range without membrane fixation (data not shown).
DISCUSSION
Determining protein expression is a crucial aspect when aiming to understand physiological processes, as well to elucidate cell pathophysiology in mammals. Since the introduction of SDS-PAGE immunoblot decades ago [32–34], this technique has remained the gold-standard and widely used by the scientific community. However, methodological and detection differences can result in significant variability. Consequently, numerous efforts have been undertaken to address this issue, resulting in the development and introduction of novel methods, such as: the size-based CE Simple Western system, microchip electrophoresis, DigiWest, Micro-loader and thin-film direct coating with suction-immunoblot, among others [35].
Considering the traditional SDS-PAGE immunoblot as the current standard for aSyn detection, our study aimed to assess the sensitivity and general suitability of aSyn detection in tissue using CE immunoblot. For this, we applied sized-based CE immunblotting using the Simple Western system. In this CE method, the machine runs fully automated, producing quantifiable immunoblot results overnight. We used Peggy Sue, an advanced immunoblotting system by Bio-techne, that is being used with increased frequency in recent years due to its advantages in experimental performance and precision [25, 36–38].
Experimental planning and sample preparation is followed by an automated running time, providing a user-independent protein signal detection. Its usage can be considered a time-saving strategy, as the complete experimental run and quantification are delivered automatically in less than one day. In addition, the use of the CE Simple Western system includes a higher throughput of data for each run, as well as the need of much less lysate material to obtain a final result, saving in many cases valuable sample material.
Experiments utilizing this method have been conducted to evaluate protein expression in various tissues [39–41]. Consequently, we believe this technique holds the potential to introduce new possibilities in the realm of PD and other synucleinopathies. In particular, we appraise the existence of a fully automated protein detection technique that has the potential to overcome the inter-user variability and the error-prone steps associated with traditional immunoblotting.
Our results showed that: 1) CE Simple Western system enables accuracy in the detection of aSyn in central and peripheral tissues. 2) The use of SDS-PAGE immunoblot for aSyn detection exhibits a reliable aSyn signal in the midbrain and esophagus/stomach tissues, albeit with reduced consistency in the inner ear.
In view of the consistent aSyn detection demonstrated by CE in both central and non-central tissues, it is noteworthy that SDS-PAGE exhibited more reliable detection of aSyn in the midbrain, inner ear, and esophagus/stomach tissues only in immunoblots with membrane fixation (Fig. 5). In fact, SDS-PAGE immunoblots without membrane fixation exhibited inconsistencies in aSyn intensity in the midbrain, with a very faint or absent aSyn signal observed in peripheral tissues (data not shown).
It is intriguing that the endogenous aSyn levels observed in SDS-PAGE immunoblots from non-central tissues exhibit some disparities with CE regarding the relative aSyn signal detection per animal (Fig. 6), suggesting potential technical differences in aSyn detection reliability in the periphery with SDS-PAGE. However, additional experiments are necessary for a formal comparison between both methods.
In comparison to the central nervous system, the expression of aSyn is significantly lower in peripheral organs. This implies that SDS-PAGE might be less reliable for aSyn detection in organs with less endogenous aSyn expression levels, despite performing immunoblots using a membrane that has undergone fixation.
It is also important to note that pre-experimental work, which include antibody titration and tissue-specific titration experiments, is highly advisable before starting the CE runs (Figs. 1 and 2). As such, we need to consider this tuning fact for CE, not present in SDS-PAGE immunoblots as typically carried out, accounting for a probable disadvantage when intending to compare both techniques. On the other hand, including a protein fixation step within the capillaries is not yet possible when running a CE immunoblot, in contrast to SDS-PAGE immunoblots.
A relevant physiological aspect to keep in mind while working with tissue samples is the heterogeneous expression of housekeeping genes along different tissues, including the expression differences at different age-stages. For this reason, the use of total protein for normalization purposes is recommended [42–46].
Furthermore, aSyn exhibited migration differences between CE and SDS-PAGE, with an estimated molecular weight of 21 kDa in CE and 17–19 kDa in SDS-PAGE immunoblots. To explain this phenomenon, we contemplate some aspects that may have contributed to disparities in the separation pattern of aSyn in these two distinctive systems. Factors that may play a role include, for example, the chemical environment in which protein separation occurs. In CE, protein separation takes place in a capillary filled with a buffer solution, while in SDS-PAGE, it happens in a polyacrylamide gel matrix. Another aspect to be considered is charge-to-mass ratio, as aSyn carries a net negative charge at neutral pH due to the presence of aspartic acid and glutamic acid residues. However, its charge can vary depending on the pH of the environment, affecting its ionic strength and, consequently, its migration. In light of these differences, it shouldn’t be surprising that relative subtleties might occur in the migration process, considering the distinctions between both electrophoretic systems. As such, additional challenges may arise when aiming to characterize oligomeric species of aSyn, along with other toxic forms that have been correlated with aSyn pathology.
Taken together, our study provides preliminary insights into the use of CE for aSyn detection, positioning it as a reliable method for detecting aSyn in both central and non-central tissues. Nonetheless, additional experiments are necessary for robust assay validation.
In conclusion, CE Simple Western system provides an automated method that enables a reliable aSyn detection in various tissues, even those where the protein is expressed at lower levels. Consequently, these results can serve as preliminary datasets for future studies aiming to explore novel possibilities in understanding the molecular mechanisms associated with PD and other synucleinopathies using this technique.
ACKNOWLEDGMENTS
The authors wish to extend their sincere appreciation to the Promotionskolleg from the University Medical Center Göttingen, Germany, for their invaluable support to medical students.
FUNDING
C.S. was supported with an intramural grant provided by the University Medical Center Göttingen, Germany. T.F.O. is supported by BMBF through the EU Joint Programme on Neurodegenerative Disease Research (JPND, http://www.jpnd.edu) project (OligoFit) and by the German Research Foundation (Deutsche Forschungsgemeinschaft, DFG) under Germany’s Excellence Strategy - EXC 2067/1- 390729940, and by SFB1286 (B8).
CONFLICT OF INTEREST
T.F.O. is an Editorial Board member of this journal, but was not involved in the peer-review process of this article nor had access to any information regarding its peer review.
The other authors have no conflict of interest to report.
DATA AVAILABILITY
The data supporting the findings of this study are available within the article and/or its supplementary material. Specific data sets are available upon reasonable request from the corresponding authors.
SUPPLEMENTARY MATERIAL
[1] The supplementary material is available in the electronic version of this article: https://dx.doi.org/10.3233/JPD-230379.
REFERENCES
[1] | Spillantini MG , Schmidt ML , Lee VM-Y , Trojanowski JQ , Jakes R , Goedert M ((1997) ) α-Synuclein in Lewy bodies. Nature 388: , 839–840. |
[2] | Spillantini MG , Crowther RA , Jakes R , Hasegawa M , Goedert M ((1998) ) α-Synuclein in filamentous inclusions of Lewy bodies from Parkinson’s disease and dementia with Lewy bodies. Proc Natl Acad Sci U S A 95: , 6469–6473. |
[3] | Tanei Z ichi , Saito Y , Ito S , Matsubara T , Motoda A , Yamazaki M , Sakashita Y , Kawakami I , Ikemura M , Tanaka S , Sengoku R , Arai T , Murayama S ((2021) ) Lewy pathology of the esophagus correlates with the progression of Lewy body disease: A Japanese cohort study of autopsy cases. Acta Neuropathol 141: , 25–37. |
[4] | Iljina M , Garcia GA , Horrocks MH , Tosatto L , Choi ML , Ganzinger KA , Abramov AY , Gandhi S , Wood NW , Cremades N , Dobson CM , Knowles TPJ , Klenerman D ((2016) ) Kinetic model of the aggregation of alpha-synuclein provides insights into prion-like spreading. Proc Natl Acad Sci U S A 113: , E1206–E1215. |
[5] | Roberts HL , Brown DR ((2015) ) Seeking a mechanism for the toxicity of oligomeric α-synuclein. Biomolecules 5: , 282–305. |
[6] | Okochi M , Walter J , Koyama A , Nakajo S , Baba M , Iwatsubo T , Meijer L , Kahle PJ , Haass C ((2000) ) Constitutive phosphorylation of the Parkinson’s disease associated α-synuclein. J Biol Chem 275: , 390–397. |
[7] | Chandra S , Chen X , Rizo J , Jahn R , Südhof TC ((2003) ) A broken α-helix in folded α-synuclein. J Biol Chem 278: , 15313–15318. |
[8] | Luk KC , Kehm V , Carroll J , Zhang B , O’Brien P , Trojanowski JQ , Lee VMY ((2012) ) Pathological α-synuclein transmission initiates Parkinson-like neurodegeneration in nontransgenic mice. Science 338: , 949–953. |
[9] | Watts JC , Giles K , Oehler A , Middleton L , Dexter DT , Gentleman SM , DeArmond SJ , Prusiner SB ((2013) ) Transmission of multiple system atrophy prions to transgenic mice. Proc Natl Acad Sci U S A 110: , 19555–19560. |
[10] | El-Agnaf OMA , Salem SA , Paleologou KE , Curran MD , Gibson MJ , Court JA , Schlossmacher MG , Allsop D ((2006) ) Detection of oligomeric forms of α-synuclein protein in human plasma as a potential biomarker for Parkinson’s disease. FASEB J 20: , 419–425. |
[11] | Chahine LM , Beach TG , Brumm MC , Adler CH , Coffey CS , Mosovsky S , Caspell-Garcia C , Serrano GE , Munoz DG , White CL , Crary JF , Jennings D , Taylor P , Foroud T , Arnedo V , Kopil CM , Riley L , Dave KD , Mollenhauer B ((2020) ) In vivo distribution of α-synuclein in multiple tissues and biofluids in Parkinson disease. Neurology 95: , E1267–E1284. |
[12] | Pfeiffer RF ((2016) ) Non-motor symptoms in Parkinson’s disease. Parkinsonism Relat Disord 22: , S119–S122. |
[13] | Postuma RB , Lang AE , Massicotte-Marquez J , Montplaisir J ((2006) ) Potential early markers of Parkinson disease in idiopathic REM sleep behavior disorder. Neurology 66: , 845–851. |
[14] | Mantri S , Morley JF , Siderowf AD ((2019) ) The importance of preclinical diagnostics in Parkinson disease. Parkinsonism Relat Disord 64: , 20–28. |
[15] | Claassen DO , Josephs KA , Ahlskog MJE , Silber MH , Tippmann-Peikert CM , Boeve BF ((2010) ) REM sleep behavior disorder preceding other aspects of synucleinopathies by up to half a century. Neurology 75: , 494–499. |
[16] | Postuma RB , Aarsland D , Barone P , Burn DJ , Hawkes CH , Oertel W , Ziemssen T ((2012) ) Identifying prodromal Parkinson’s disease: Pre-Motor disorders in Parkinson’s disease. Mov Disord 27: , 617–626. |
[17] | Braak H , Rüb U , Gai WP , Del Tredici K ((2003) ) Idiopathic Parkinson’s disease: Possible routes by which vulnerable neuronal types may be subject to neuroinvasion by an unknown pathogen. J Neural Transm 110: , 517–536. |
[18] | Hawkes CH , Del Tredici K , Braak H ((2007) ) Parkinson’s disease: A dual-hit hypothesis. Neuropathol Appl Neurobiol 33: , 599–614. |
[19] | Stokholm MG , Danielsen EH , Hamilton-Dutoit SJ , Borghammer P ((2016) ) Pathological α-synuclein in gastrointestinal tissues from prodromal Parkinson disease patients. Ann Neurol 79: , 940–949. |
[20] | Borghammer P , Van Den Berge N ((2019) ) Brain-first versus gut-first Parkinson’s disease: A hypothesis. J Parkinsons Dis 9: , S281–S295. |
[21] | Pisani V , Sisto R , Moleti A , Di Mauro R , Pisani A , Brusa L , Altavista MC , Stanzione P , Di Girolamo S ((2015) ) An investigation of hearing impairment in de-novo Parkinson’s disease patients: A preliminary study. Parkinsonism Relat Disord 21: , 987–991. |
[22] | Pötter-Nerger M , Govender S , Deuschl G , Volkmann J , Colebatch JG ((2015) ) Selective changes of ocular vestibular myogenic potentials in Parkinson’s disease. Mov Disord 30: , 584–589. |
[23] | Nguyen U , Squaglia N , Boge A , Fung PA ((2011) ) The Simple Western™: A gel-free, blot-free, hands-free Western blotting reinvention. Nat Methods 8: , v–vi. |
[24] | Wenz C , Rüfer A ((2009) ) Microchip CGE linked to immunoprecipitation as an alternative to Western blotting. Electrophoresis 30: , 4264–4269. |
[25] | Chen JQ , Heldman MR , Herrmann MA , Kedei N , Woo W , Blumberg PM , Goldsmith PK ((2013) ) Absolute quantitation of endogenous proteins with precision and accuracy using a capillary Western system. Anal Biochem 442: , 97–103. |
[26] | O’neill RA , Bhamidipati A , Bi X , Deb-Basu D , Cahill L , Ferrante J , Gentalen E , Glazer M , Gossett J , Hacker K , Kirby C , Knittle J , Loder R , Mastroieni C , Maclaren M , Mills T , Nguyen U , Parker N , Rice A , Roach D , Suich D , Voehringer D , Voss K , Yang J , Yang T , Horn PB Vander ((2006) ) Isoelectric focusing technology quantifies protein signaling in 25 cells. Proc Natl Acad Sci U S A 103: , 16153–16158. |
[27] | Specht CG , Schoepfer R ((2004) ) Deletion of multimerin-1 in α-synuclein-deficient mice. Genomics 83: , 1176–1178. |
[28] | Specht CG , Schoepfer R ((2001) ) Deletion of the alpha-synuclein locus in a subpopulation of C57BL/6J inbred mice. BMC Neurosci 2: , 1471–2202. |
[29] | Gajović S , Mitrečić D , Augustinčić L , Iaconcig A , Muro AF ((2006) ) Unexpected rescue of alpha-synuclein and multimerin1 deletion in C57BL/6JOlaHsd mice by beta-adducin knockout. Transgenic Res 15: , 255–259. |
[30] | Pelkonen A , Yavich L ((2012) ) Cortical spreading depression in alpha-synuclein knockout mice. Synapse 66: , 81–84. |
[31] | Faustini G , Longhena F , Bruno A , Bono F , Grigoletto J , La Via L , Barbon A , Casiraghi A , Straniero V , Valoti E , Costantino G , Benfenati F , Missale C , Pizzi M , Spillantini MG , Bellucci A ((2020) ) Alpha-synuclein/synapsin III pathological interplay boosts the motor response to methylphenidate. Neurobiol Dis 138: . |
[32] | Towbin H , Staehelint T , Gordon J ((1979) ) Electrophoretic transfer of proteins from polyacrylamide gels to nitrocellulose sheets: Procedure and some applications. Biochemistry 76: , 4350–4354. |
[33] | Renart J , Reiser J , Stark GR ((1979) ) Transfer of proteins from gels to diazobenzyloxymethyl-paper and detection with antisera: A method for studying antibody specificity and antigen structure. Proc Natl Acad Sci U S A 76: , 3116–3120. |
[34] | Burnette’ WN ((1981) ) “Western Blotting”: Electrophoretic transfer of proteins from sodium dodecyl sulfate-polyacrylamide gels to unmodified nitrocellulose and radiographic detection with antibody and radioiodinated protein A. Anal Biochem 112: , 195–203. |
[35] | Mishra M , Tiwari S , Gomes A V. ((2017) ) Protein purification and analysis: Next generation western blotting techniques. Expert Rev Proteomics 14: , 1037–1053. |
[36] | Besong Agbo D , Klafki H , Poschmann G , Seyfarth K , Genius J , Janßen C , Stühler K , Wurst W , Meyer HE , Klingenspor M , Wiltfang J ((2013) ) Development of a capillary isoelectric focusing immunoassay to measure DJ-1 isoforms in biological samples. Anal Biochem 443: , 197–204. |
[37] | Wang J , Valdez A , Chen Y ((2017) ) Evaluation of automated Wes system as an analytical and characterization tool to support monoclonal antibody drug product development. J Pharm Biomed Anal 139: , 263–268. |
[38] | Zhang S , Chen M , Zhou S , Raoufi F , Wiswell D , Hsieh SC , Seghezzi W ((2021) ) Development of a novel capillary electrophoresis-based approach for detection of anti-drug antibody responses. J Immunol Methods 494: , 113047. |
[39] | Arora AS , Zafar S , Kollmar O , Llorens F , Tahir W , Vanselow S , Kumar P , Schmerr MJ , Schmitz M , Zerr I ((2015) ) Application of capillary immunoelectrophoresis revealed an age- and gender-dependent regulated expression of PrPC in liver. Electrophoresis 36: , 3026–3033. |
[40] | Liu R , Cao X , Liang Y , Li X , Jin Q , Li Y , Du H , Zao X , Ye Y ((2022) ) Downregulation of ST6GAL1 promotes liver inflammation and predicts adverse prognosis in hepatocellular carcinoma. J Inflamm Res 15: , 5801–5814. |
[41] | Myskiw J , Lamoureux L , Peterson A , Knox D , Jansen GH , Coulthart MB , Booth SA ((2023) ) Development of an automated capillary immunoassay to detect prion glycotypes in Creutzfeldt-Jakob Disease. Lab Invest 103: , 100029. |
[42] | Aldridge GM , Podrebarac DM , Greenough WT , Weiler IJ ((2008) ) The use of total protein stains as loading controls: An alternative to high-abundance single-protein controls in semi-quantitative immunoblotting. J Neurosci Methods 172: , 250–254. |
[43] | Eaton SL , Roche SL , Llavero Hurtado M , Oldknow KJ , Farquharson C , Gillingwater TH , Wishart TM ((2013) ) Total protein analysis as a reliable loading control for quantitative fluorescent western blotting. PLoS One 8: , e72457. |
[44] | Nie X , Li C , Hu S , Xue F , Kang YJ , Zhang W ((2017) ) An appropriate loading control for western blot analysis in animal models of myocardial ischemic infarction. Biochem Biophys Rep 12: , 108–113. |
[45] | Moritz CP ((2017) ) Tubulin or not tubulin: Heading toward total protein staining as loading control in western blots. Proteomics 17: , 1600189. |
[46] | Kirshner ZZ , Gibbs RB ((2018) ) Use of the REVERT® total protein stain as a loading control demonstrates significant benefits over the use of housekeeping proteins when analyzing brain homogenates by Western blot: An analysis of samples representing different gonadal hormone states. Mol Cell Endocrinol 473: , 156–165. |


