
Identifying New Subtypes of Multiple System Atrophy Using Cluster Analysis
Abstract
Background:
Multiple system atrophy (MSA) is a disease with diverse symptoms and the commonly used classifications, MSA-P and MSA-C, do not cover all the different symptoms seen in MSA patients. Additionally, these classifications do not provide information about how the disease progresses over time or the expected outcome for patients.
Objective:
To explore clinical subtypes of MSA with a natural disease course through a data-driven approach to assist in the diagnosis and treatment of MSA.
Methods:
We followed 122 cases of MSA collected from 3 hospitals for 3 years. Demographic characteristics, age of onset, clinical signs, scale assessment scores, and auxiliary examination were collected. Age at onset; time from onset to assisted ambulation; and UMSARS I, II, and IV, COMPASS-31, ICARS, and UPDRS III scores were selected as clustering elements. K-means, partitioning around medoids, and self-organizing maps were used to analyze the clusters.
Results:
The results of all three clustering methods supported the classification of three MSA subtypes: The aggressive progression subtype (MSA-AP), characterized by mid-to-late onset, rapid progression and severe clinical symptoms; the typical subtype (MSA-T), characterized by mid-to-late onset, moderate progression and moderate severity of clinical symptoms; and the early-onset slow progression subtype (MSA-ESP), characterized by early-to-mid onset, slow progression and mild clinical symptoms.
Conclusions:
We divided MSA into three subtypes and summarized the characteristics of each subtype. According to the clustering results, MSA patients were divided into three completely different types according to the severity of symptoms, the speed of disease progression, and the age of onset.
INTRODUCTION
Multiple system atrophy (MSA) is a fatal adult-onset neurodegenerative disease and an atypical parkinsonian disorder. It is characterized by progressive autonomic dysfunction, Parkinson’s syndrome, and cerebellar damage [1]. The disease progresses faster and has a worse prognosis than idiopathic Parkinson’s disease [2]. The pathological hallmark is the presence of intracellular inclusions of misfolded alpha-synuclein protein in oligodendrocytes, which is also a feature of Parkinson’s disease [3].
The current MSA classification method was proposed in 1998. If the features of Parkinson’s disease are dominant, the patient should be designated MSA-P; if cerebellar features are dominant, the patient is designated MSA-C [4]. However, this classification is still deficient in clinical use. First, subtypes that are not easily identified may be missed. Some underlying clinical manifestations, such as nonmotor symptoms, which may lead to some potential subtypes being classified into other subtypes. Several MSA subtypes have been reported in the literature that do not fit the current classification. These new forms of MSA include MSA with predominantly autonomic failure (MSA-AF) [5], mixed MSA with coexisting Parkinson’s disease and cerebellar ataxia (MSA-P/C) [6], early-onset MSA with an age of onset between 30 and 40 years (YOMSA) [7], MSA with survival of more than 15 years (LDMSA) [8], and MSA presenting with corticobasal ganglia syndrome (MSA-CBS) [9]. Second, the current staging method describes the symptoms but does not reflect the rapidity of disease progression, which is not conducive to prognostic prediction. In light of these issues, we have progressively established a study cohort for MSA since 2017 and utilized various clustering techniques to process the data, with the objective of investigating the clinical classification of MSA in its natural state.
MATERIALS AND METHODS
Participants
Patients with MSA who attended the outpatient or inpatient neurology departments of 3 hospitals from January 1, 2017, to December 31, 2022, were recruited.
Inclusion criteria: 1) meeting the diagnostic criteria for clinically probable and likely MSA as outlined in the expert consensus on multisystem atrophy published by Gilman et al. in their second revision from 2008 [10]; 2) detailed and reliable medical history recall; and 3) signed informed consent.
Exclusion criteria: 1) other neurodegenerative diseases; 2) other reasons affecting limb movement or condition assessment; and 3) other serious complications.
A total of 164 patients diagnosed with MSA were initially included in the study. Of these, 35 patients did not meet the follow-up endpoint, and 7 patients had more than 20% missing data; therefore, their data were excluded from the analysis. This resulted in a final sample size of 122 patients in the cluster analysis (see Supplementary Figure 1). Supplementary Table 1 shows the grading of diagnostic reliability of the cases in this study under both the old and new diagnostic criteria.
The participants consistently received the same treatment regimen throughout the study. The medication administered consisted of levodopa, pramipexole hydrochloride, amantadine hydrochloride, buspirone hydrochloride, and midodrine hydrochloride, along with Shengmai Yin for the management of orthostatic hypotension. In addition, few patients underwent brief rehabilitation or physical therapy, none underwent deep brain stimulation or other surgical treatment. However, it is worth noting that a significant number of patients under the age of 50 continue working, which could have potential implications for the progression of the condition.
This study was reviewed by the ethics committee of Xijing Hospital (approval No. of ethics committee: KY20222171-C-1) and filed in the Chinese Clinical Trial Registry (registration number: ChiCTR2300072941). The study obtained written informed consent from all participants.
Study method
Basic information was collected face-to-face from patients, including sex, age at presentation (years), age at onset (years), time from onset to nonmotor symptoms combined with motor symptoms (months), time from onset to catheterization or diaper dependence (months), and time from onset to assisted ambulation (months). Onset was defined as the point at which any motor or nonmotor symptoms, such as Parkinson’s symptoms, cerebellar ataxia, orthostatic hypotension or neurogenic bladder disorders, were first observed by either the patient or their family. Data that could not be collected at this time were collected during the 3-year follow-up period. The end point of follow-up was disease progression to the point where patients had all three of the following: nonmotor symptoms combined with motor symptoms, catheterization, and assisted ambulation. Patients who still had not met the follow-up endpoint as of June 1, 2023, were not included in this study.
Clinical signs were collected by questioning and examination. It was divided into motor and non-motor symptoms. The definitions described above are given in Supplementary Table 2.
Red flag signs included rapid progression within 3 years of motor onset, moderate to severe postural instability within 3 years of motor onset, craniocervical dystonia induced or exacerbated by L-dopa in the absence of limb dyskinesia, severe speech impairment within 3 years of motor onset, severe dysphagia within 3 years of motor onset, unexplained Babinski sign, jerky myoclonic postural or kinetic tremor, postural deformities, stridor, inspiratory sighs, cold discolored hands and feet, erectile dysfunction (below age of 60 years), pathologic laughter or crying. The MSA diagnostic criteria published by MDS in 2022 was used for the specific definition [11].
The study identified several positive imaging findings, which comprised putaminal atrophy; putaminal hypointensity with hyperintense lateral putaminal rim on T2-weighted sequences (at 1.5 Tesla magnet strength); and various infratentorial abnormalities, including atrophy of the pons, middle cerebellar peduncle (MCP), medulla oblongata, inferior olives, and cerebellum, as well as T2 hyperintensities in the pons (“hot cross bun sign”), MCP, and cerebellum [12]. The presence of any of these findings was regarded as positive and recorded as a dichotomous variable. The “Hot cross bun” sign was recorded as stage 0– 5 [13].
The following scales were administered:
1 Overall condition assessment: Unified Multiple System Atrophy Rating Scale (UMSARS) [14], range 0– 104, with higher scores indicating greater damage.
2 Autonomic function assessment: Composite Autonomic Symptom Score-31 (COMPASS-31) [15], range 0– 100, with higher scores indicating greater damage.
3 Cerebellar symptom assessment: International Cooperative Ataxia Rating Scale (ICARS) [16], range 0– 100, with higher scores indicating greater damage.
4 Parkinson’s symptom assessment: Movement Disorder Society Unified Parkinson’s Disease Rating Scale part3 (UPDRS-III) [17], range 0– 72, with higher scores indicating greater damage.
5 Mood assessment: Hamilton Anxiety Scale (HAMA-14) [18], range 0– 56, with higher scores indicating worse anxiety, and Hamilton Depression Rating Scale (HAMD-17) [19], range 0– 68, with higher scores indicating worse depression.
6 Sleep: Pittsburgh Sleep Quality Index (PSQI), range 0– 21, with higher scores indicating poorer sleep quality.
7 Disability assessment: Modified Hoehn and Yahr Scale (H-Y) [20], range 1– 5, with higher scores indicating greater damage, and the Schwab and England Activities of Daily Living Scale (S&E), range from 0% – 100%, with lower scores indicating greater damage.
8 UMSARS served as the predetermined primary outcome measure, while the COMPASS-31, ICARS, UPDRS-III and duration from onset to assisted walking were considered secondary outcome measures.
9 All clinical data collection for this study was conducted by three neurologists who specialize in MSA and have received standardized training in the scoring of relevant scales at Xijing Hospital to minimize potential human errors.
Statistical analysis
Double data entry and proofreading were conducted utilizing EpiData v 3.1. Missing values were replaced by the mean of all cases.
Cluster analysis
Currently, there is no consensus on the parameters of cluster analysis applied to clinical typing. For exploratory analyses, by convention, the sample size is generally controlled at more than ten times the number of variables to ensure that the sample size has sufficient dimensionality. These variables were subjected to z-score conversion before the clustering analysis.
We selected three clustering methods: K-means, partitioning around medoids (PAM), and self-organizing maps (SOM). K-means is the most basic and commonly used clustering algorithm. It is a partition scheme that iteratively finds K clusters and minimizes the squared errors between each sample’s distance and its corresponding cluster centroid. PAM [21] is a partitional algorithm, and it is similar to K-means [22]. PAM clustering is highly robust to outliers, which is an advantage over K-means because K-means is highly sensitive to outliers. SOM is a type of artificial neural network that is trained by an unsupervised machine learning technique to project a set of given data points (high-dimensional data) into a low-dimensional (usually two-dimensional) grid while preserving the topological structure of the data [23]. R software (Copyright (C) 2020 The R Foundation for Statistical Computing) was used for all profiling analyses.
Analysis of clustering results
Data were analyzed in the following manner: Student’s t test as appropriate was used to analyze group differences in normally distributed data, while Kruskal– Wallis one-way ANOVA by ranks was employed for non-Gaussian distributed variables. Distributional differences were assessed using Pearson’s χ2 test for independence. SPSS v.25 was used for all profiling analyses.
RESULTS
In this study, a total of 122 patients with MSA were included, with 69 (56.6%) males and 53 (43.4%) females. The mean age was 58.86±7.84 years, and the mean age of onset was 55.16±7.92 years. The median time from onset to assisted walking was 48.52 months, with an interquartile range of 29.46 months; the median time from onset to catheterization or diaper dependence was 48.50 months, with an interquartile range of 32.16 months; and the median duration of motor symptoms combined with nonmotor symptoms was 29.15 months, with an interquartile range of 48.43 months. Among all patients, 41 had onset of motor symptoms, accounting for 33.6% of the total; 81 had onset of nonmotor symptoms, accounting for 66.4% of the total. The patients were classified according to the guidelines into 60 MSA-P patients, accounting for 49.2%, and 62 MSA-C patients, accounting for 50.8%. The scores of various scales and clinical characteristics of the patients are shown in Table 1.
Table 1
Demographic and clinical data of the whole patients (n = 122)
| Variable | Response options | Overall |
| Gender, n (%) | Male | 69 (56.6) |
| Female | 53 (43.4) | |
| Age (mean (SD)) | 58.86 (7.84) | |
| Age of onset (mean (SD)) | 55.16 (7.92) | |
| Time from onset to assisted walking- months (mean (SD)) | 48.52 (29.46) | |
| Time from onset to catheterization or diaper dependence- months (mean (SD)) | 48.50 (32.16) | |
| Duration of motor symptoms combined with non-motor symptom – months (mean (SD)) | 29.15 (48.43) | |
| Symptoms onset | Motor symptoms | 41 (33.6) |
| n (%) | Non-motor symptoms | 81 (66.4) |
| Accuracy of diagnosis | Probable | 68 (55.7) |
| Possible | 54 (44.3) | |
| PC-Types | P | 60 (49.2) |
| n (%) | C | 62 (50.8) |
| UMSARS I (mean (SD)) | 19.70 (9.48) | |
| UMSARS II (mean (SD)) | 21.18 (10.36) | |
| UMSARS IV (median [IQR]) | 2 [3] | |
| COMPASS-31 (mean (SD)) | 49.25 (20.93) | |
| ICARS (mean (SD)) | 46.06 (26.43) | |
| UPDRS III (mean (SD)) | 31.10 (17.19) | |
| HAMA (mean (SD)) | 13.23 (6.31) | |
| HAMD (mean (SD)) | 13.46 (6.89) | |
| PSQI (mean (SD)) | 7.52 (6.16) | |
| H-Y(median [IQR]) | 3 [1.5] | |
| S&E (median [IQR]) | 50 [50] | |
| Number of red flag signs (median [IQR]) | 2 [2] | |
| MRI | Positive imaging findings n (%) | 89 (73.0) |
| Atrophy of putamen (and signal decrease on iron-sensitive sequences) | 31 (25.4) | |
| Atrophy of middle cerebellar peduncle | 20 (16.4) | |
| Atrophy of pons | 28 (23.0) | |
| Atrophy of cerebellum | 89 (73.0) | |
| “Hot cross bun” sign | 1 [2] | |
| Levodopa is effective n (%) | 38 (31.1) |
The results were represented by mean (SD), median [IQR] or percentage (%). UMSARS, Unified Multiple System Atrophy Rating Scale (UMSARS); COMPASS-31, Composite Autonomic Symptom Score-31; ICARS, International Cooperative Ataxia Rating Scale; UPDRS-III, Movement Disorder Society Unified Parkinson’s Disease Rating Scale part3; HAMA-14, Hamilton Anxiety Scale; HAMD-17, Hamilton Depression Rating Scale; PSQI, Pittsburgh Sleep Quality Index; H-Y, Modified Hoehn and Yahr Scale; S&E, Schwab and England Activities of Daily Living Scale.
Principal component analysis was conducted using SPSS 25, which resulted in eight components. However, the results of K-means clustering using these eight components cannot be reasonably interpreted in clinical practice. We summarized the variables with higher correlation coefficients for each component based on the rotated component matrix table, as shown in the Table 2. To ensure the rationality of cluster attribute selection, we consulted domestic experts in movement disorders and statistics, integrated the results of PCA. Selected eight factors for cluster analysis: age at onset, time from onset to assisted walking, UMSARS I, II, and IV, COMPASS-31, ICARS, and UPDRS III scores.
Table 2
Principal component analysis of demographic and clinical data (n = 122)
| Components | Variables | Correlation Coefficient | Summary of Characteristics |
| 1 | UMSARS I | 0.857 | Severity of symptoms |
| UMSARS II | 0.877 | ||
| UPDRS III | 0.869 | ||
| 2 | Time from onset to catheterization or diaper dependence | 0.871 | Rate of disease progression |
| Time from onset to assisted walking | 0.765 | ||
| 3 | Age at onset | 0.944 | Age |
| Age | 0.967 | ||
| 4 | ICARS | 0.741 | Cerebellar symptoms |
| P-Types | 0.733 | ||
| 5 | HAMA | 0.745 | Mood |
| 6 | Duration of motor symptoms combined with non-motor symptoms | 0.695 | Rate of disease progression |
| 7 | PSQI | 0.766 | Sleep |
| 8 | Number of red flag signs | 0.912 | Red flag signs |
K-means
We compared the clustering results for 2, 3, and 4 groups. When clustering was performed with 2 groups, there were significant differences in age of onset, disease progression rate, and disease severity between the two groups. However, the clinical significance was poor, and it was not possible to provide a descriptive characterization including features. When clustering was performed with 4 groups, the features among the groups overlapped, and there were no differences in many dimensions. After comprehensive analysis, we found that the clustering result of 3 clusters was more in line with clinical practice and was more interpretable. Therefore, we used 3 clusters in the main analyses of this study.
Cluster 1 contained 36 individuals with a mean age of onset of 56.43±6.98 years, which was older than that of Cluster 3 (p < 0.001). The time from onset to assisted walking and time from onset to catheterization or diaper dependence were the shortest (p < 0.001). UMSARS I, II, and IV, COMPASS-31, ICARS, and UPDRS III scores were all the highest among the three groups (p < 0.001). The H&Y stage and S&E scale were also higher than the other two groups (p < 0.001). The positive frequency of atrophy of putamen (and signal decrease on iron-sensitive sequences) was higher than that of Cluster 2 and Cluster 3 (p < 0.001). The “Hot cross bun” sign stage was higher than that of Cluster 3 (p = 0.027).
Cluster 2, comprising 47 participants, did not exhibit a significant difference in the age of onset when compared to Cluster 1 but was observed to be higher than Cluster 3 (p < 0.001). The duration from onset to assisted walking was found to be between the durations observed for the other two groups (p < 0.001), while the duration from onset to catheterization or diaper dependence was slightly longer than that of Cluster 1 (p < 0.001) but no statistical difference between Cluster 3. The scores for UMSARS I and II, UPDRS III, H&Y stage and S&E scale were at a moderate level among all three groups (p < 0.001). However, the scores for UMSARS IV, ICARS, and COMPASS-31 were higher than Cluster 3 (p < 0.001), but the difference compared to Cluster 1 was not statistically significant.
Cluster 3 consisted of 39 cases, with the youngest age of onset and an average age of 49.52±7.21 years. Disease progression was relatively gradual, exhibiting the longest time from onset to assisted walking and to catheterization (p < 0.001). The UMSARS I, II, and IV; ICARS; and UPDRS III scores, H&Y stage and S&E scale were the lowest among all three groups (p < 0.001). The COMPASS-31 was lower than that in Cluster 1 (p < 0.001), but it was no statistically significant difference between Cluster 3 and Cluster 2.
Furthermore, no significant differences were observed among the subgroups in gender, motor symptoms onset, P-type or C-type, HAMA, HAMD, PSQI. A comparison of the demographic and clinical features in the three clusters is shown in Table 3.
Table 3
Comparison of the demography and clinical features between three clusters based on K-means cluster analysis
| Variables | Cluster | p | Multiple comparisons | ||
| 1 | 2 | 3 | |||
| n = 36 | n = 47 | n = 39 | |||
| Gender (male, %) | 17 (47.2) | 28 (59.6) | 24 (61.5) | 0.398 | – |
| Age | 59.12 (6.91) | 62.80 (7.46) | 53.88 (6.29) | <0.001 | All comparisons |
| Age at onset | 56.43 (6.98) | 58.88 (6.53) | 49.52 (7.21) | <0.001 | I vs. III, II vs. III |
| Time from onset to assisted walking-months(MEDIAN [P25, P75]) | 24.00 [19.75, 37.00] | 47.00 [33.00, 58.50] | 57.00 [49.00, 72.00] | <0.001 | All comparisons |
| Time from onset to catheterization or diaper dependence-months(MEDIAN [P25, P75]) | 24.00 [17.00, 46.38] | 48.00 [36.00, 61.50] | 53.00 [34.00, 73.50] | <0.001 | I vs. II, I vs. III |
| Duration of motor symptoms combined with non-motor symptoms-months(MEDIAN [P25, P75]) | 12.00 [5.50, 18.00] | 16.00 [11.00, 36.00] | 24.00 [7.00, 41.00] | 0.139 | – |
| Motor symptoms onsetn (%) | 13 (36.1) | 18 (38.3) | 10 (25.6) | 0.433 | – |
| P-Typesn (%) | 18 (50.0) | 20 (42.6) | 22 (56.4) | 0.438 | – |
| UMSARS I(MEDIAN [P25, P75]) | 29.50 [26.00, 34.75] | 17.00 [13.68, 21.00] | 12.00 [10.00, 14.00] | <0.001 | All comparisons |
| UMSARS II(MEDIAN [P25, P75]) | 31.50 [28.75, 36.00] | 17.00 [15.00, 21.50] | 13.00 [9.50, 15.50] | <0.001 | All comparisons |
| UMSARS IV(MEDIAN [P25, P75]) | 3.00 [2.00, 4.00] | 3.00 [2.00, 4.00] | 1.00 [0.00, 1.00] | <0.001 | I vs. III, II vs. III |
| COMPASS-31 | 63.61 (16.85) | 45.45 (16.43) | 40.57 (22.73) | <0.001 | I vs. II, I vs. III |
| ICARS(MEDIAN [P25, P75]) | 53.50 [43.00, 79.50] | 56.00 [33.00, 73.50] | 22.00 [13.50, 33.00] | <0.001 | I vs. III, II vs. III |
| UPDRS III(MEDIAN [P25, P75]) | 47.50 [39.00, 63.75] | 24.00 [21.00, 28.50] | 18.00 [12.27, 24.50] | <0.001 | All comparisons |
| HAMA | 14.14 (6.31) | 12.61 (6.66) | 13.14 (5.92) | 0.55 | – |
| HAMD | 14.50 [8.50, 21.25] | 13.00 [8.50, 15.00] | 13.00 [9.00, 17.43] | 0.572 | – |
| PSQI(MEDIAN [P25, P75]) | 7.00 [3.00, 10.25] | 8.00 [2.50, 14.00] | 7.00 [1.50, 9.87] | 0.57 | – |
| H-Y(MEDIAN [P25, P75]) | 4.00 [3.00, 4.00] | 3.00 [2.75, 4.00] | 2.50 [2.00, 3.00] | <0.001 | All comparisons |
| S&E(MEDIAN [P25, P75]) | 30.00 [27.50, 40.00] | 60.00 [35.00, 75.00] | 80.00 [75.00, 90.00] | <0.001 | All comparisons |
| Number of red flag signs (MEDIAN [P25, P75]) | 3.00 [2.00, 4.00] | 2.00 [1.50, 4.00] | 2.00 [1.00, 3.00] | 0.011 | I vs. III, II vs. III |
| Positive imaging findingsn (%) | 23 (63.9) | 38 (80.9) | 28 (71.8) | 0.222 | – |
| Atrophy of putamen (and signal decrease on iron-sensitive sequences) | 18(50.0) | 11(23.4) | 2(5.1) | <0.001 | I vs. II, I vs. III |
| Atrophy of middle cerebellar peduncle | 9(25.0%) | 7(14.9) | 4(10.3) | 0.228 | – |
| Atrophy of pons | 10(27.8) | 12(25.5) | 6(15.4) | 0.384 | – |
| Atrophy of cerebellum | 23(63.9) | 38(80.9) | 28(71.8) | 0.222 | – |
| “Hot cross bun” sign | 2[0, 3] | 1[0, 2] | 0[0, 1] | 0.027 | I vs. III |
| Levodopa is effectiven (%) | 13(36.1) | 15(31.9) | 10(25.6) | 0.625 | – |
The results were represented by mean±standard deviation, median [P25, P75] or percentage (%). Student’s t test was used to analyze group differences in normally distributed data, Kruskal– Wallis one-way ANOVA by ranks was employed for non-Gaussian distributed variables, distributional differences were assessed using Pearson’s χ2 test for independence.
PAM
Similar to the K-means cluster results, the best clustering results in PAM were obtained when K = 3. The variation in COMPASS-31 sets apart the PAM clustering outcomes from those of k-mean clustering. PAM clustering demonstrated a distinctive difference in the compass-31 total score among the three groups, with cluster1 taking the lead, followed by Cluster2, and Cluster 3 occupying the bottom place. Component comparisons of other variables showed the same trend as k-means results. The results of the comparisons among groups are shown in Table 4.
Table 4
Comparison of the demography and clinical features between three clusters based on PAM
| Variables | Cluster | p | Multiple comparisons | ||
| 1 | 2 | 3 | |||
| n = 26 | n = 56 | n = 40 | |||
| Gender (male, %) | 13 (50.0) | 30 (53.6) | 26 (65.0) | 0.403 | – |
| Age | 60.32 (7.22) | 60.99 (7.19) | 54.93 (7.78) | <0.001 | I vs. III, II vs. III |
| Age at onset | 57.71 (7.10) | 57.24 (6.62) | 50.60 (8.29) | <0.001 | I vs. III, II vs. III |
| Time from onset to assisted walking- months(MEDIAN [P25, P75]) | 31.00 [18.25, 37.75] | 39.00 [26.25, 52.67] | 57.00 [48.00, 67.00] | <0.001 | All comparisons |
| Time from onset to catheterization or diaper dependence- months(MEDIAN [P25, P75]) | 21.50 [13.00, 41.25] | 48.00 [31.75, 60.00] | 52.00 [35.00, 67.00] | <0.001 | I vs. II, I vs. III |
| Duration of motor symptoms combined with non-motor symptoms-months(MEDIAN [P25, P75]) | 13.00 [6.25, 18.00] | 14.00 [8.75, 27.00] | 24.00 [8.00, 40.00] | 0.203 | – |
| Motor symptoms onsetn (%) | 9 (34.6) | 21 (37.5) | 11 (27.5) | 0.588 | – |
| P-Typesn (%) | 16 (61.5) | 21 (37.5) | 23 (57.5) | 0.056 | – |
| UMSARS I(MEDIAN [P25, P75]) | 32.00 [28.25, 38.50] | 19.50 [14.00, 22.50] | 12.00 [10.00, 14.00] | <0.001 | All comparisons |
| UMSARS II(MEDIAN [P25, P75]) | 33.00 [30.25, 36.75] | 19.00 [16.00, 26.00] | 12.50 [9.75, 15.25] | <0.001 | All comparisons |
| UMSARS IV(MEDIAN [P25, P75]) | 3.00 [2.25, 4.00] | 3.00 [2.00, 4.00] | 1.00 [0.00, 1.00] | <0.001 | I vs. III, II vs. III |
| COMPASS-31 | 66.65 (16.06) | 47.84 (16.79) | 39.91 (22.41) | <0.001 | All comparisons |
| ICARS(MEDIAN [P25, P75]) | 47.00 [40.75, 58.75] | 62.00 [35.75, 78.75] | 22.00 [13.75, 33.00] | <0.001 | I vs. III, II vs. III |
| UPDRS III(MEDIAN [P25, P75]) | 60.50 [44.50, 68.00] | 25.00 [21.75, 33.00] | 17.50 [12.40, 24.25] | <0.001 | All comparisons |
| HAMA | 14.27 (6.13) | 12.78 (6.60) | 13.19 (6.09) | 0.613 | – |
| HAMD | 14.50 [9.25, 22.50] | 13.00 [8.00, 17.25] | 12.50 [8.75, 16.25] | 0.533 | – |
| PSQI(MEDIAN [P25, P75]) | 7.00 [3.25, 11.25] | 7.50 [1.75, 11.58] | 7.00 [2.00, 9.81] | 0.736 | – |
| H-Y(MEDIAN [P25, P75]) | 4.00 [3.00, 5.00] | 3.00 [3.00, 4.00] | 2.50 [2.00, 3.00] | <0.001 | All comparisons |
| S&E(MEDIAN [P25, P75]) | 30.00 [20.00, 40.00] | 50.00 [30.00, 70.00] | 80.00 [77.50, 90.00] | <0.001 | All comparisons |
| Number of red flag signs (MEDIAN [P25, P75]) | 2.50 [2.00, 4.00] | 3.00 [2.00, 4.00] | 2.00 [1.00, 2.25] | 0.004 | I vs. III, II vs. III |
| Positive imaging findingsn (%) | 17 (65.4) | 44 (78.6) | 28 (70.0) | 0.418 | – |
| Atrophy of putamen (and signal decrease on iron-sensitive sequences) | 13(50.0) | 16(28.6) | 2(5.0) | <0.001 | I vs. III |
| Atrophy of middle cerebellar peduncle | 7(26.9) | 9(16.1) | 4(10.0) | 0.216 | – |
| Atrophy of pons | 7(26.9) | 7(26.8) | 6(15.0) | 0.345 | – |
| Atrophy of cerebellum | 17(65.4) | 44(78.6) | 28(70) | 0.401 | – |
| “Hot cross bun” sign | 2[0, 3] | 1[0, 2] | 0[0, 1] | 0.045 | I vs. III |
| Levodopa is effectiven (%) | 6(23.1) | 20(35.7) | 12(30.0) | 0.496 | – |
SOM
After multiple attempts, we were unable to make the number of samples in each node as balanced as possible, so we chose a sample size of 8∼20 for each node. Ultimately, we clustered the 122 patients into 3 clusters with the following characteristics. Cluster 1 (red): higher UMSARS I, UMSARS II, COMPASS-31, and UPDRS III scores; rapid progression; late age of onset; severe clinical symptoms. Cluster 2 (orange): moderate UMSARS I, UMSARS II, and COMPASS-31 scores; moderate time from onset to assisted ambulation; moderate progression; moderate clinical symptoms; late age of onset. Cluster 3 (green): long onset to ambulation; early age of onset; low UMSARS I, UMSARS II, COMPASS-31, and UPDRS III scores; slow progression; mild clinical symptoms. The results of the comparisons among groups were shown in Table 5.
Table 5
Comparison of the demography and clinical features between the three clusters based on SOM
| Variables | Cluster | p | Multiple comparisons | ||
| 1 | 2 | 3 | |||
| n = 33 | n = 78 | n = 11 | |||
| red | orange | green | |||
| Gender (male, %) | 18 (54.5) | 46 (59.0) | 5 (45.5) | 0.673 | – |
| Age | 59.20 (7.23) | 59.19 (7.96) | 55.55 (8.69) | 0.342 | – |
| Age at onset | 56.41 (7.18) | 55.89 (7.32) | 46.27 (9.22) | <0.001 | I vs. III, II vs. III |
| Time from onset to assisted walking- months(MEDIAN [P25, P75]) | 24.00 [20.00, 37.00] | 48.00 [36.00, 57.00] | 120.00 [102.00, 138.15] | <0.001 | All comparisons |
| Time from onset to catheterization or diaper dependence- months(MEDIAN [P25, P75]) | 24.00 [17.00, 36.00] | 48.00 [34.00, 59.75] | 115.00 [102.00, 135.50] | <0.001 | All comparisons |
| Duration of motor symptoms combined with non-motor symptoms- months(MEDIAN [P25, P75]) | 12.00 [6.00, 18.00] | 12.50 [5.00, 34.50] | 85.00 [45.50, 108.00] | <0.001 | I vs. III, II vs. III |
| Motor symptoms onsetn (%) | 12 (36.4) | 27 (34.6) | 2 (18.2) | 0.517 | – |
| P-Typesn (%) | 18 (54.5) | 37 (47.4) | 5 (45.5) | 0.765 | – |
| UMSARS I(MEDIAN [P25, P75]) | 30.00 [26.00, 37.00] | 15.00 [12.00, 20.00] | 11.00 [8.50, 12.00] | <0.001 | All comparisons |
| UMSARS II(MEDIAN [P25, P75]) | 31.00 [28.00, 36.00] | 16.50 [12.78, 20.00] | 14.00 [12.00, 14.00] | <0.001 | I vs. II, I vs. III |
| UMSARS IV(MEDIAN [P25, P75]) | 3.00 [2.00, 4.00] | 2.00 [1.00, 3.00] | 2.00 [1.00, 4.00] | 0.026 | I vs. II |
| COMPASS-31 | 66.12 (14.37) | 44.34 (19.37) | 33.45 (18.69) | <0.001 | I vs. II, I vs. III |
| ICARS(MEDIAN [P25, P75]) | 47.00 [40.00, 70.00] | 34.50 [20.25, 67.00] | 44.00 [33.00, 61.50] | 0.1 | – |
| UPDRS III(MEDIAN [P25, P75]) | 51.00 [39.00, 66.00] | 22.50 [18.25, 29.00] | 18.00 [15.50, 18.00] | <0.001 | All comparisons |
| HAMA | 14.51 (6.54) | 13.12 (6.23) | 10.18 (5.47) | 0.138 | – |
| HAMD | 15.00 [9.00, 22.00] | 13.00 [9.00, 16.75] | 11.00 [8.50, 15.50] | 0.556 | – |
| PSQI(MEDIAN [P25, P75]) | 7.58 [4.00, 12.00] | 7.00 [1.00, 10.00] | 8.00 [2.50, 13.00] | 0.399 | – |
| H-Y(MEDIAN [P25, P75]) | 4.00 [3.00, 4.00] | 3.00 [2.00, 3.75] | 2.50 [2.00, 3.00] | <0.001 | I vs. II, I vs. III |
| S&E(MEDIAN [P25, P75]) | 30.00 [20.00, 40.00] | 70.00 [40.00, 80.00] | 80.00 [60.00, 80.00] | <0.001 | I vs. II, I vs. III |
| Number of red flag signs (MEDIAN [P25, P75]) | 3.00 [2.00, 4.00] | 2.00 [1.00, 3.00] | 3.00 [1.00, 3.00] | 0.185 | – |
| Positive imaging findingsn (%) | 20 (60.6) | 58 (74.4) | 11 (100.0) | 0.035 | – |
| Atrophy of putamen (and signal decrease on iron-sensitive sequences) | 15(45.5) | 14(17.9) | 2(18.2) | 0.01 | I vs. II |
| Atrophy of middle cerebellar peduncle | 9(27.3) | 10(12.8) | 1(9.1) | 0.158 | |
| Atrophy of pons | 8(24.2) | 19(24.4) | 1(9.1) | 0.631 | |
| Atrophy of cerebellum | 20 (60.6) | 58 (74.4) | 11 (100.0) | 0.027 | I vs. III |
| “Hot cross bun” sign | 1[0, 2] | 1[0, 2] | 0[0, 1] | 0.254 | |
| Levodopa is effectiven (%) | 10(30.3) | 24(30.8) | 4(36.4) | 0.910 | – |
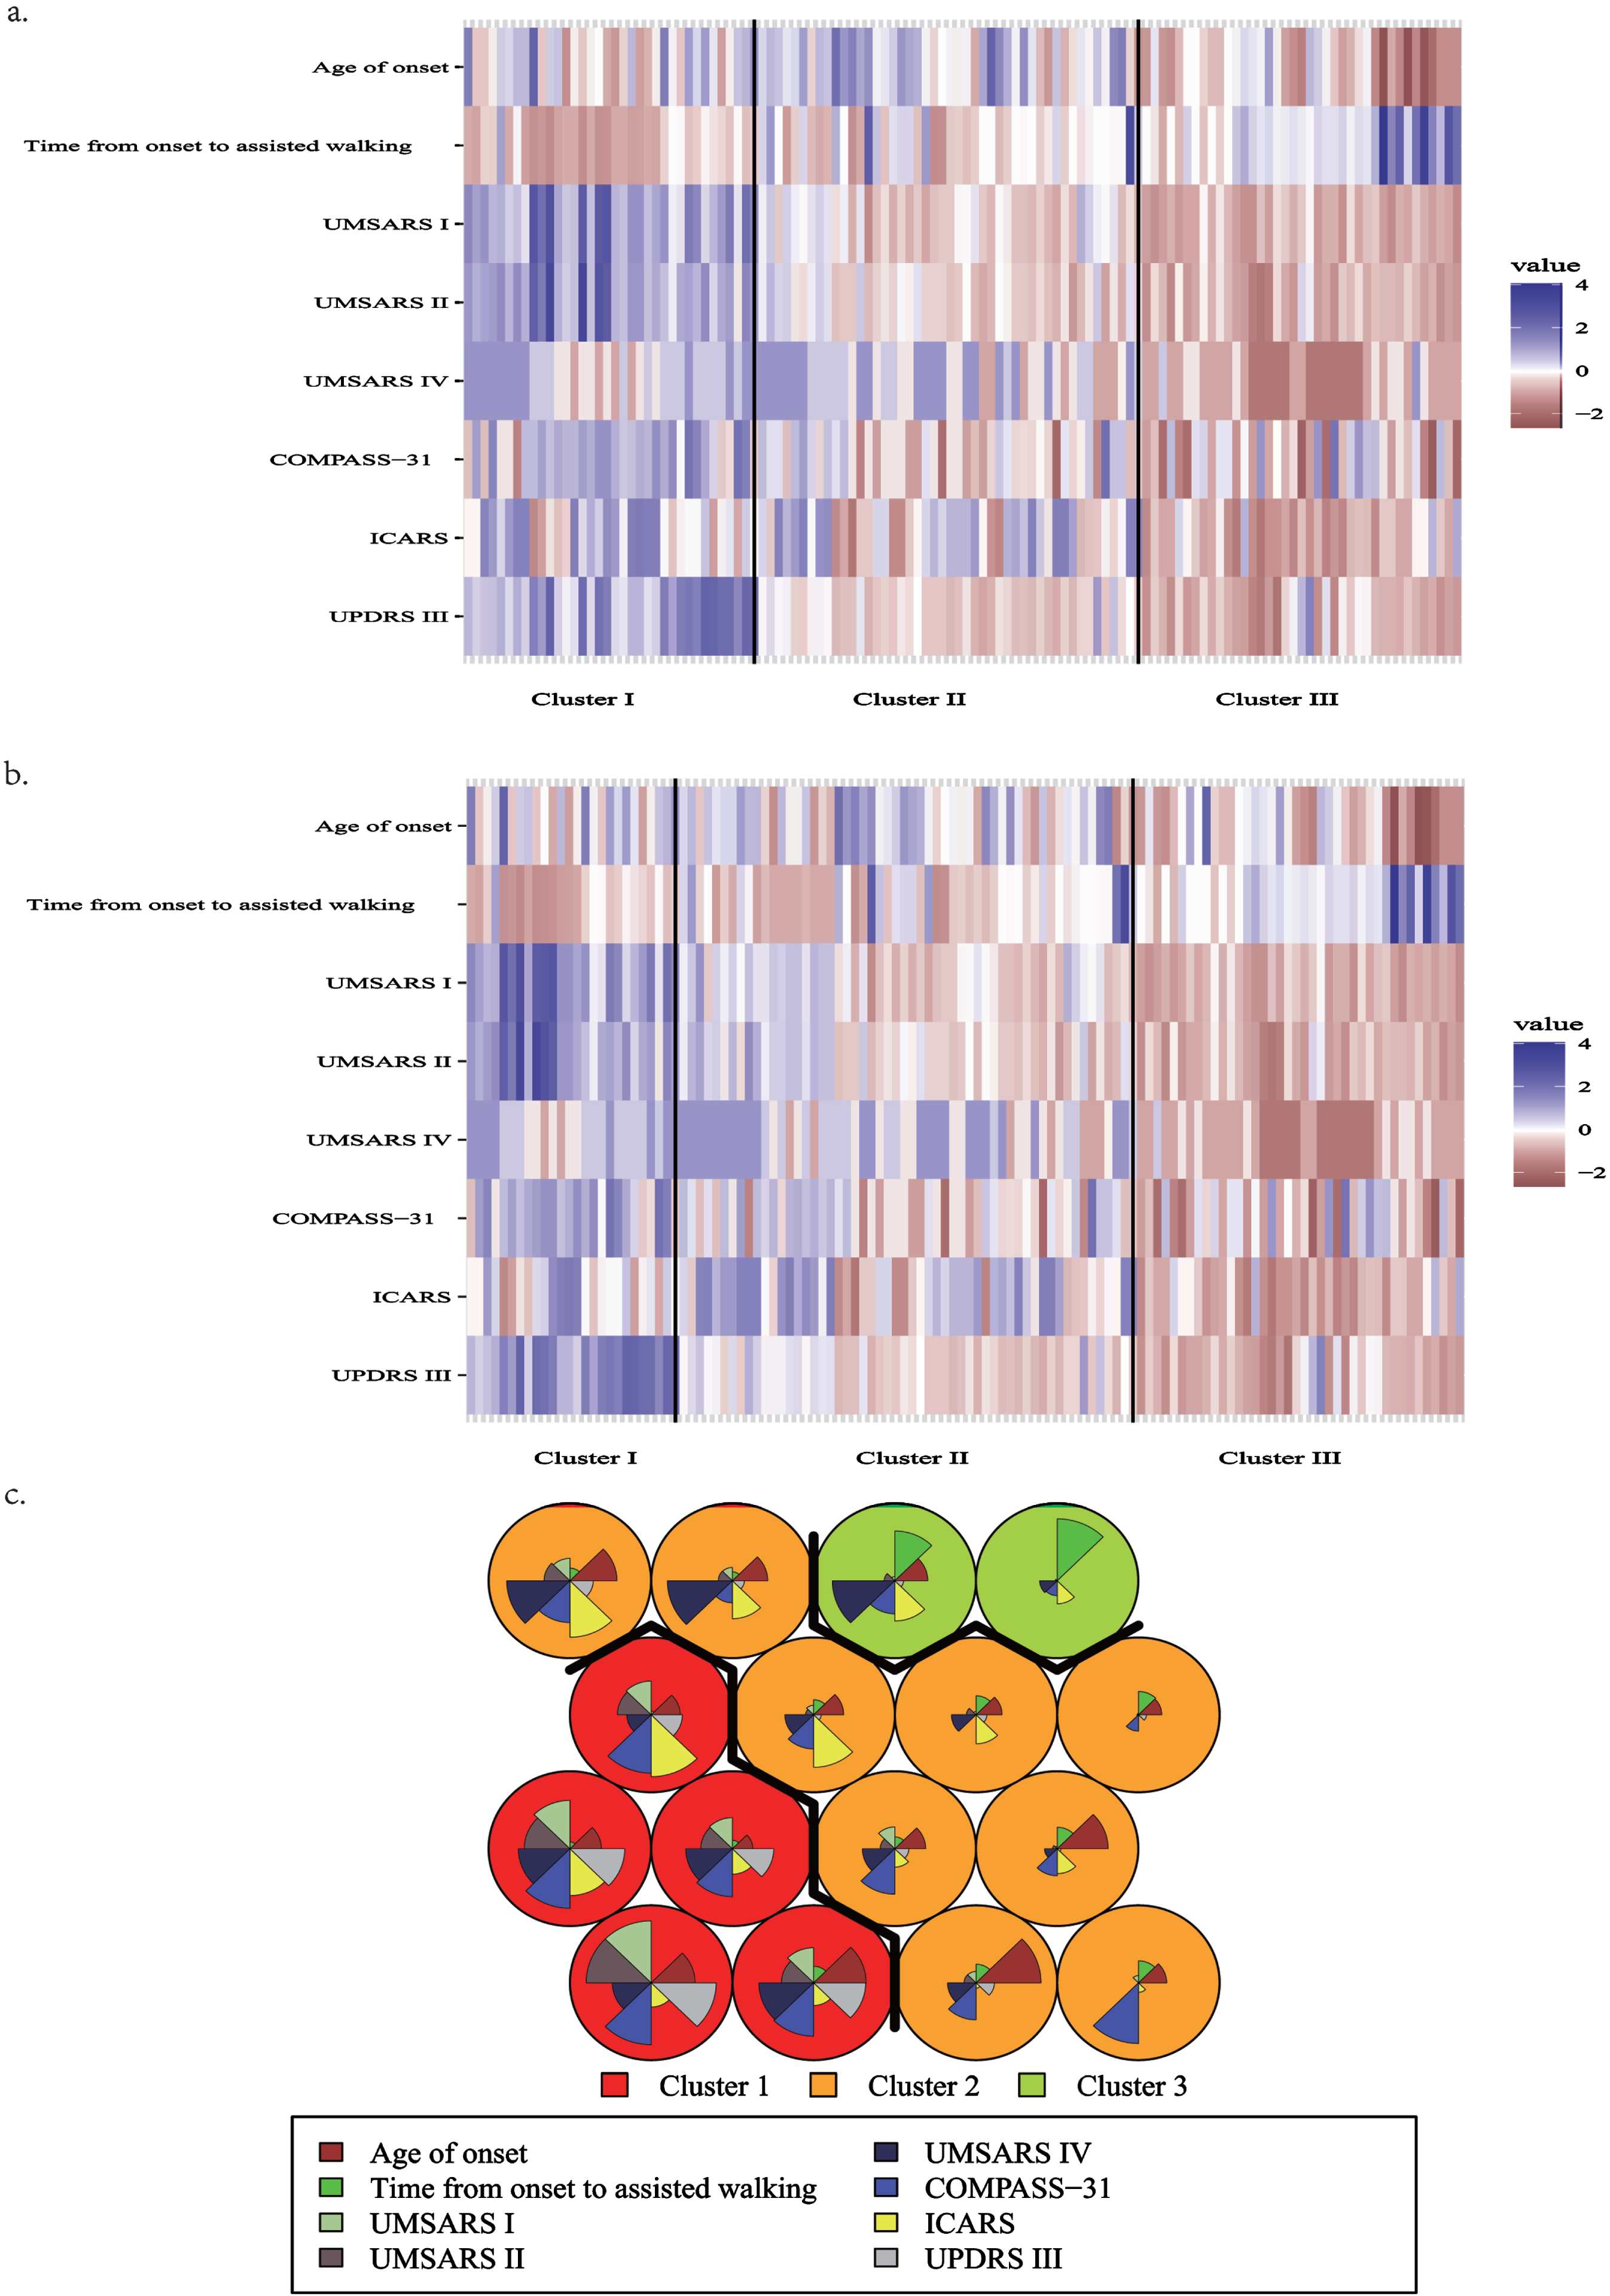
The planar visualization of three cluster method was shown in Fig. 1.
Fig. 1
Diagram of clustering results. The plot is constructed based on the Z-score calculated for each variable within the cluster. The Z-score signifies the standardized value of each variable. a) the result of K-means. b) the result of PAM. The color blue represents a higher score, while red indicates a lower score, and white denotes a value falling in between. The magnitude of color difference directly corresponds to the extent of disparity observed between the subtypes. c) the result of SOM, cluster 1: red background; cluster 2: orange background; cluster 3: green background. Within each circle, different colors of sectors represent different variables, and the area of each sector indicates the magnitude of the corresponding variable. Specifically, larger areas correspond to higher values of the variable.
Additionally, this study examined the distribution characteristics of levodopa preparation efficacy and red flag signs among the three clusters of results. The findings indicate no significant statistical difference in the efficacy of levodopa preparations among the three clustering groups. However, 4 red flag signs demonstrated statistically significant differences between the groups. Rapid progression within three years of motor onset and moderate-to-severe postural instability exhibited distinct distribution patterns among the three clusters. Moreover, the positive rate of moderate-to-severe postural instability within three years of motor onset was over 85% in Cluster 1. Cluster 1 also showed a positive rate of rapid progression within three years of motor onset exceeding 50%, while Cluster 3 showed a positive rate of less than 10%. The K-means analysis showed that cluster 3 had an incidence of severe speech impairment within 3 years of motor onset that was below 10%, which was significantly lower compared to cluster 1 and 2 (p = 0.003). Conversely, PAM results demonstrated that cluster 2 had a higher positive rate (42.9%) of severe speech impairment within 3 years of motor onset compared to cluster 1 and 3 (p < 0.05). In the case of SOM, cluster 3 had a significantly higher incidence of cold and discolored hands and feet compared to clusters 1 and 2 (p = 0.008). Detailed results are presented in Supplementary Table 3.
Table 6 presents a comparative analysis of the three clustering methods. Cluster 1 demonstrated the highest stability among the three methods, and there were no statistically significant differences in any of the variables. In cluster 2, there were differences in age, UMSARS score, ICARS score, and S&E score between groups. Overall, the scores of cluster 2, clustered by SOM method, were lower than those of the other two groups. Statistical differences were found between the groups in terms of onset to assisted walking, onset to catheterization, and UMSARS IV in cluster 3 SOM. Cluster 3 SOM was classified as more conservative due to longer time from onset to assisted walking and time from onset to catheterization or diaper dependence, as well as more severe UMSARS IV. In general, the results of the three clustering methods were generally stable.
Table 6A
Comparison of three clustering methods in cluster 1
| Cluster1 | K-means | PAM | SOM | p |
| n | 36 | 26 | 33 | |
| Gender (male, %) | 17 (47.2) | 13 (50.0) | 18 (54.5) | NS |
| Age | 59.12 (6.91) | 60.32 (7.22) | 59.20 (7.23) | NS |
| Age at onset | 56.43 (6.98) | 57.71 (7.10) | 56.41 (7.18) | NS |
| Time from onset to assisted walking (MEDIAN [P25, P75]) | 24.00 [19.75, 37.00] | 31.00 [18.25, 37.75] | 24.00 [20.00, 37.00] | NS |
| Time from onset to catheterization or diaper dependence (MEDIAN [P25, P75]) | 24.00 [17.00, 46.38] | 21.50 [13.00, 41.25] | 24.00 [17.00, 36.00] | NS |
| Duration of motor symptoms combined with non-motor symptoms (MEDIAN [P25, P75]) | 12.00 [5.50, 18.00] | 13.00 [6.25, 18.00] | 12.00 [6.00, 18.00] | NS |
| Motor symptoms onsetn (%) | 13 (36.1) | 9 (34.6) | 12 (36.4) | NS |
| P-Typesn (%) | 18 (50.0) | 16 (61.5) | 18 (54.5) | |
| UMSARS I (MEDIAN [P25, P75]) | 29.50 [26.00, 34.75] | 32.00 [28.25, 38.50] | 30.00 [26.00, 37.00] | NS |
| UMSARS II (MEDIAN [P25, P75]) | 31.50 [28.75, 36.00] | 33.00 [30.25, 36.75] | 31.00 [28.00, 36.00] | NS |
| UMSARS IV (MEDIAN [P25, P75]) | 3.00 [2.00, 4.00] | 3.00 [2.25, 4.00] | 3.00 [2.00, 4.00] | NS |
| COMPASS-31 | 63.61 (16.85) | 66.65 (16.06) | 66.12 (14.37) | NS |
| ICARS | 53.50 [43.00, 79.50] | 47.00 [40.75, 58.75] | 47.00 [40.00, 70.00] | NS |
| UPDRS III | 47.50 [39.00, 63.75] | 60.50 [44.50, 68.00] | 51.00 [39.00, 66.00] | NS |
| HAMA | 14.14 (6.31) | 14.27 (6.13) | 14.51 (6.54) | NS |
| HAMD | 14.50 [8.50, 21.25] | 14.50 [9.25, 22.50] | 15.00 [9.00, 22.00] | NS |
| PSQI | 7.00 [3.00, 10.25] | 7.00 [3.25, 11.25] | 7.58 [4.00, 12.00] | NS |
| H-Y | 4.00 [3.00, 4.00] | 4.00 [3.00, 5.00] | 4.00 [3.00, 4.00] | NS |
| S&E | 30.00 [27.50, 40.00] | 30.00 [20.00, 40.00] | 30.00 [20.00, 40.00] | NS |
| Number of red flag signs (MEDIAN [P25, P75]) | 3.00 [2.00, 4.00] | 2.50 [2.00, 4.00] | 3.00 [2.00, 4.00] | NS |
| Positive imaging findings | 23 (63.9) | 17 (65.4) | 20 (60.6) | NS |
| Levodopa is effective | 13 (36.1) | 6 (23.1) | 10 (30.3) | NS |
Table 6B
Comparison of three clustering methods in cluster 2
| Cluster2 | K-means | PAM | SOM | p |
| n | 47 | 56 | 78 | NS |
| Gender (male, %) | 28 (59.6) | 30 (53.6) | 46 (59.0) | NS |
| Age | 62.80 (7.46) | 60.99 (7.19) | 59.19 (7.96) | 0.04 |
| Age at onset | 58.88 (6.53) | 57.24 (6.62) | 55.89 (7.32) | NS |
| Time from onset to assisted walking (MEDIAN [P25, P75]) | 47.00 [33.00, 58.50] | 39.00 [26.25, 52.67] | 48.00 [36.00, 57.00] | NS |
| Time from onset to catheterization or diaper dependence (MEDIAN [P25, P75]) | 48.00 [36.00, 61.50] | 48.00 [31.75, 60.00] | 48.00 [34.00, 59.75] | NS |
| Duration of motor symptoms combined with non-motor symptoms (MEDIAN [P25, P75]) | 16.00 [11.00, 36.00] | 14.00 [8.75, 27.00] | 12.50 [5.00, 34.50] | NS |
| Motor symptoms onsetn (%) | 18 (38.3) | 21 (37.5) | 27 (34.6) | NS |
| P-Typesn (%) | 20 (42.6) | 21 (37.5) | 37 (47.4) | NS |
| UMSARS I (MEDIAN [P25, P75]) | 17.00 [13.68, 21.00] | 19.50 [14.00, 22.50] | 15.00 [12.00, 20.00] | 0.004 |
| UMSARS II (MEDIAN [P25, P75]) | 17.00 [15.00, 21.50] | 19.00 [16.00, 26.00] | 16.50 [12.78, 20.00] | 0.002 |
| UMSARS IV (MEDIAN [P25, P75]) | 3.00 [2.00, 4.00] | 3.00 [2.00, 4.00] | 2.00 [1.00, 3.00] | <0.01 |
| COMPASS-31 | 45.45 (16.43) | 47.84 (16.79) | 44.34 (19.37) | NS |
| ICARS | 56.00 [33.00, 73.50] | 62.00 [35.75, 78.75] | 34.50 [20.25, 67.00] | <0.01 |
| UPDRS III | 24.00 [21.00, 28.50] | 25.00 [21.75, 33.00] | 22.50 [18.25, 29.00] | NS |
| HAMA | 12.61 (6.66) | 12.78 (6.60) | 13.12 (6.23) | NS |
| HAMD | 13.00 [8.50, 15.00] | 13.00 [8.00, 17.25] | 13.00 [9.00, 16.75] | NS |
| PSQI | 8.00 [2.50, 14.00] | 7.50 [1.75, 11.58] | 7.00 [1.00, 10.00] | NS |
| H-Y | 3.00 [2.75, 4.00] | 3.00 [3.00, 4.00] | 3.00 [2.00, 3.75] | NS |
| S&E | 60.00 [35.00, 75.00] | 50.00 [30.00, 70.00] | 70.00 [40.00, 80.00] | 0.02 |
| Number of red flag signs (MEDIAN [P25, P75]) | 2.00 [1.50, 4.00] | 3.00 [2.00, 4.00] | 2.00 [1.00, 3.00] | NS |
| Positive imaging findings | 38 (80.9) | 44 (78.6) | 58 (74.4) | NS |
| Levodopa is effective | 15(31.9) | 20(35.7) | 24(30.8) | NS |
Table 6C
Comparison of three clustering methods in cluster 3
| Cluster3 | K-means | PAM | SOM | p |
| n | 39 | 40 | 11 | NA |
| Gender (male, %) | 24 (61.5) | 26 (65.0) | 5 (45.5) | NA |
| Age | 53.88 (6.29) | 54.93 (7.78) | 55.55 (8.69) | NA |
| Age at onset | 49.52 (7.21) | 50.60 (8.29) | 46.27 (9.22) | NA |
| Time from onset to assisted walking (MEDIAN [P25, P75]) | 57.00 [49.00, 72.00] | 57.00 [48.00, 67.00] | 120.00 [102.00, 138.15] | <0.01 |
| Time from onset to catheterization or diaper dependence (MEDIAN [P25, P75]) | 53.00 [34.00, 73.50] | 52.00 [35.00, 67.00] | 115.00 [102.00, 135.50] | <0.01 |
| Duration of motor symptoms combined with non-motor symptoms (MEDIAN [P25, P75]) | 24.00 [7.00, 41.00] | 24.00 [8.00, 40.00] | 85.00 [45.50, 108.00] | NA |
| Motor symptoms onsetn (%) | 10 (25.6) | 11 (27.5) | 2 (18.2) | NA |
| P-Typesn (%) | 22 (56.4) | 23 (57.5) | 5 (45.5) | NA |
| UMSARS I (MEDIAN [P25, P75]) | 12.00 [10.00, 14.00] | 12.00 [10.00, 14.00] | 11.00 [8.50, 12.00] | NA |
| UMSARS II (MEDIAN [P25, P75]) | 13.00 [9.50, 15.50] | 12.50 [9.75, 15.25] | 14.00 [12.00, 14.00] | NA |
| UMSARS IV (MEDIAN [P25, P75]) | 1.00 [0.00, 1.00] | 1.00 [0.00, 1.00] | 2.00 [1.00, 4.00] | <0.01 |
| COMPASS-31 | 40.57 (22.73) | 39.91 (22.41) | 33.45 (18.69) | NA |
| ICARS | 22.00 [13.50, 33.00] | 22.00 [13.75, 33.00] | 44.00 [33.00, 61.50] | NA |
| UPDRS III | 18.00 [12.27, 24.50] | 17.50 [12.40, 24.25] | 18.00 [15.50, 18.00] | NA |
| HAMA | 13.14 (5.92) | 13.19 (6.09) | 10.18 (5.47) | NA |
| HAMD | 13.00 [9.00, 17.43] | 12.50 [8.75, 16.25] | 11.00 [8.50, 15.50] | NA |
| PSQI | 7.00 [1.50, 9.87] | 7.00 [2.00, 9.81] | 8.00 [2.50, 13.00] | NA |
| H-Y | 2.50 [2.00, 3.00] | 2.50 [2.00, 3.00] | 2.50 [2.00, 3.00] | NA |
| S&E | 80.00 [75.00, 90.00] | 80.00 [77.50, 90.00] | 80.00 [60.00, 80.00] | NA |
| Number of red flag signs (MEDIAN [P25, P75]) | 2.00 [1.00, 3.00] | 2.00 [1.00, 2.25] | 3.00 [1.00, 3.00] | NA |
| Positive imaging findings | 28 (71.8) | 28 (70.0) | 11 (100.0) | NA |
| Levodopa is effective | 10 (25.6) | 12 (30.0) | 4 (36.4) | NA |
DISCUSSION
This study categorized MSA patients into three distinct clusters based on clinical characteristics, and these clusters exhibited variations in disease progression and severity, providing valuable insights for understanding and managing MSA.
A total of 122 patients were included in this statistic, with a mean age of onset of 55.16±7.84 years and a male-to-female ratio of 1.3 : 1, with a higher prevalence in males. The proportion of patients with the Parkinsonian subtype (60 cases) and the cerebellar subtype (62 cases) was generally equal, which deviates from previous reports from Japan, where the cerebellar subtype was more common than the Parkinsonian subtype. All the patients were from mainland China, primarily from the central and western regions. This geographical distribution may be related to differences in the patients’ natural environment and dietary habits. The majority of MSA patients presented with nonmotor symptoms at onset (66.4%). The present study revealed that patients with MSA exhibit signs of mild anxiety and depression, as indicated by the average HAMA score of 13.23±6.31 and the average HAMD score of 13.46±6.89, respectively. Therefore, interventions may be necessary to address these emotional concerns. Additionally, the median number of red flag signs was 2, suggesting that the clinical manifestations of MSA are atypical, making it challenging to differentiate MSA from other diseases such as Parkinson’s disease and hereditary ataxia. Atrophy of cerebellum was the most common positive finding on MRI, but it was not highly specific for the diagnosis of MSA.
The results obtained from two of the three clustering methods, namely, K-means and PAM, possess greater clinical relevance and interpretability. The K-means results showed that Cluster 1 exhibited an average onset age of 56.43 years, with an age range spanning from 45 to 74 years, thus signifying a middle-aged to elderly onset demographic. The distribution of onset age between Cluster 1 and Cluster 2 was not significantly different, although Cluster 1 displayed a more rapid progression rate than Cluster 2, as evidenced by the time from onset to assisted walking and time from onset to catheterization or diaper dependence. Additionally, Cluster 1 exhibited higher scores on the UMSARS I, UMSARS II, UMSARS IV, COMPASS-31, and UPDRS III scales compared to Cluster 2. This suggests that MSA patients belonging to Cluster 1 tended to exhibit poorer daily living abilities and motor function, greater overall disability, and more pronounced autonomous nervous system dysfunction and Parkinson’s symptoms than their Cluster 2 counterparts.
Cluster 3 displayed an average age of onset of 49.52 years, a total of 13 patients (33.33%) showed symptoms before the age of 45, while all the patients presented symptoms prior to the age of 65. Thus, the onset of symptoms in Cluster 3 primarily occurs in individuals of middle age. The progression of the disease was slow, with median times to assisted walking and catheterization both exceeding five years. Among the three groups, Cluster 3 exhibited the mildest disability level, as well as the lowest UMSARS I, UMSARS II, UMSARS IV, COMPASS-31, ICARS, and UPDRS III scores. A previous European cohort study showed that patients with pathologically confirmed YOMSA survived 11.1 years (SD = 3.2), which is longer than the previously reported mean survival of patients with MSA. This evidence indicates that a younger age of MSA onset is associated with longer survival.
According to the characteristics, we named the three subtypes. Cluster 1, characterized by mid-to-late onset, rapid progression and severe clinical symptoms, was named the aggressive progression subtype (MSA-AP). Cluster 2, also featuring mid-to-late onset, moderate progression and moderate severity of clinical symptoms, was named the typical subtype (MSA-T). Finally, Cluster 3, with early-to-mid onset, slow progression and mild clinical symptoms, was named the early-onset slow progression subtype (MSA-ESP). An epidemiological study conducted in Hokkaido, Japan, revealed that the prognosis worsened with increasing age of onset [24], which is consistent with the aggressive progression subtype.
The PAM clustering results were roughly the same as the K-means results and will not be repeated here. According to each group of features, Cluster 2, characterized by mid-to-late onset, moderate progression and moderate severity of clinical symptoms, was identified as MSA-T. Cluster 3, characterized by early-to-mid onset, slow progression and mild clinical symptoms, was identified as MSA-ESP. Finally, Cluster 1, characterized by mid-to-late onset, rapid progression and severe clinical symptoms, was identified as MSA-AP.
The SOM clustering results can also be classified into the same 3 subtypes by clinical characteristics. Unlike the results of the first two methods, the aggressive progression subtype did not have prominent ataxia symptoms, which was reflected in the ICARS score.
The results of K-means showed that 50% of the patients in Cluster 1 had atrophy of putamen, which was much higher than that in the other two groups. The “hot cross bun” sign stage of Cluster 3 was lower than that of Cluster1. PAM results were basically consistent with K-means results. SOM results showed that 45.5% of the patients in Cluster 1 had atrophy of putamen, which was higher than that in Cluster 2. The three clustering results showed that the incidence of atrophy of cerebellum was the highest, and there was no difference in the distribution among the three subtypes in K-means and PAM. The incidence of atrophy of cerebellum in Cluster 3 in SOM is 100%, which is higher than that in Cluster 1, which may be related to the small sample size of Cluster 3. It has been shown that an increase in the “hot cross bun” sign stage may be associated with an increased likelihood of disability in MSA-C, but not MSA-P cases, which is consistent with the trend in our study. Taken together, we believed that atrophy of putamen represented a faster rate of progression and a worse prognosis. Atrophy of cerebellum was the most common lesion in MSA, but it was not related to the severity of MSA. Higher “Hot cross bun” sign stage might be positively correlated with the severity of symptoms, but further studies with large samples were needed to confirm this.
The distribution of the red flag sign suggests that if the patient had moderate to severe postural instability within 3 years of motor onset or rapid progression within 3 years of motor onset, then this patient may belong to MSA-AP. severe speech impairment within 3 years of motor onset suggests that the patient may belong to MSA-T or MSA-AP. The presence of cold discolored hands and feet suggests that the patient may have MSA-ESP. This may have some guiding significance for doctors in clinical work.
To explore the importance of clinical characteristics in defining clusters, we performed regression analyses targeting the clustering results of k-means. Based on the PCA results, we included time from onset to assisted walking, age at onset, UPDRS III, ICRAS, HAMA, duration of motor symptoms combined with non-motor symptoms, PSQI and number of red flag signs to construct the multivariate logistic regression equation, the detailed results are shown in Table 7. We found statistically significant associations between cluster membership and time from onset to assisted walking (OR = 0.910, 95% CI 0.840– 0.986, p < 0.05), age at onset (OR = 0.801, 95% CI 0.646– 0.993, p < 0.05), and UPDRS3 scores (OR = 1.433, 95% CI 1.187– 1.731, p < 0.01). However, the patient’s age at onset (OR = 0.694, 95% CI 0.579– 0.831, p < 0.01) and ICRAS score (OR = 0.899, 95% CI 0.851– 0.950, p < 0.01) were both statistically significant factors in determining whether they belonged to cluster3. These results suggest that a longer time from onset to assisted walking is associated with a lower likelihood of the patient belonging to MSA-AP. Although older age at onset is not a unique feature of MSA-AP, the onset age of MSA-T may be slightly higher than that of MSA-AP. Additionally, patients with a higher age at onset are less likely to have MSA-AP and more likely to have MSA-T. The prominence of parkinsonism symptoms in MSA-AP is indicated by a higher UPDRS III. The ICRAS score is inversely proportional to the likelihood of the patient belonging to MSA-ESP. Therefore, the ataxia symptoms of MSA-ESP should not be too prominent.
Table 7
Multivariate Logistic regression based on K-means results
| Cluster | Variables | p | OR | OR 95% CI | |
| Lower limits | Upper limits | ||||
| 1 | Time from onset to assisted walking | 0.022 | 0.910 | 0.840 | 0.986 |
| Age at onset | 0.043 | 0.801 | 0.646 | 0.993 | |
| UPDRS III | 0.000 | 1.433 | 1.187 | 1.731 | |
| ICRAS | 0.096 | 1.067 | 0.989 | 1.151 | |
| HAMA | 0.944 | 0.993 | 0.814 | 1.211 | |
| Duration of motor symptoms combined with non-motor symptoms | 0.149 | 1.020 | 0.993 | 1.049 | |
| PSQI | 0.274 | 0.908 | 0.763 | 1.080 | |
| Number of red flag signs | 0.694 | 0.845 | 0.366 | 1.952 | |
| 3 | Time from onset to assisted walking | 0.093 | 1.036 | 0.994 | 1.081 |
| Age at onset s | 0.000 | 0.694 | 0.579 | 0.831 | |
| UPDRS III | 0.262 | 0.944 | 0.854 | 1.044 | |
| ICRAS | 0.000 | 0.899 | 0.851 | 0.950 | |
| HAMA | 0.069 | 1.151 | 0.989 | 1.340 | |
| Duration of motor symptoms combined with non-motor symptoms | 0.647 | 0.995 | 0.972 | 1.018 | |
| PSQI | 0.779 | 0.978 | 0.836 | 1.144 | |
| Number of red flag signs | 0.140 | 0.673 | 0.398 | 1.138 | |
The reference category is cluster 2.
Limitations
Our study has certain limitations. First, the delay in time and strictness of the criteria may have resulted in the exclusion of MSA patients in the early stages of the disease, and only those in the mid-to-late stages of the disease were included. The follow-up period of 3 years was not long enough to use death as an important endpoint. Moreover, the poor compliance of patients during follow-up made it difficult to conduct complex scale evaluations. Only a few patients came to the hospital during the follow-up period, while the rest were followed up over the phone. In addition, the second consensus criterion for MSA has a positive predictive value of 86% [25], and the patients in this article were not pathologically confirmed, with the possibility of misdiagnosis. To minimize such errors, we limited patients to those who had received a diagnosis of MSA from three neurologists at the same time. It should be noted that the new diagnostic criteria for MDS published in 2022 were not adopted as many cases had already been diagnosed earlier. Furthermore, the diagnostic criteria for 2022 were not yet available. Therefore, patients were treated using Gilman’s diagnostic criteria in 2008. Gilman’s 2008 diagnostic criteria are used in this article to ensure data accuracy.
In summary, we explored the clinical subtypes of MSA using cluster analysis and identified three subtypes: MSA-AP, MSA-T, and MSA-ESP. Compared to the traditional classification method, this approach offers the advantage of providing insight into disease onset, progression rate, and severity, all of which are critical factors for patient prognosis. We hope this classification can provide a reference for clinicians to develop reasonable treatment and management strategies for different subtypes. However, given the complex clinical manifestations of MSA and the overlap of multiple symptoms, the sample size of this study is relatively small and may not yet be sufficient for a comprehensive classification of MSA subtypes. Further research with large-scale, multicenter studies is needed to refine the clinical classification. Due to geographic and cultural differences, we were unable to perform pathologic biopsies in these patients to analyze whether each subtype has a specific pathologic basis. If we can find differences between subtypes at the pathological and physiological levels, we will present more accurate and reliable MSA subtypes in the future.
ACKNOWLEDGMENTS
We would like to thank all the medical staff in the Department of Neurology of Xijing Hospital, Xi ‘an Central Hospital and Xi ‘an No.3 Hospital for their support in the recruitment of patients for this study.
FUNDING
The authors have no funding to report.
CONFLICT OF INTEREST
The authors have no conflict of interest to report.
DATA AVAILABILITY
The data are not being shared because the study has not been completed.
SUPPLEMENTARY MATERIAL
[1] The supplementary material is available in the electronic version of this article: https://dx.doi.org/10.3233/JPD-230344.
REFERENCES
[1] | Fanciulli A , Wenning GK ((2015) ) Multiple-system atrophy. N Engl J Med 372: , 249–263. |
[2] | Ramli N , Nair SR , Ramli NM , Lim SY ((2015) ) Differentiating multiple-system atrophy from Parkinson’s disease. Clin Radiol 70: , 555–564. |
[3] | Pascual J , Pazos A , Del OE , Figols J , Leno C , Berciano J ((1991) ) Presynaptic parkinsonism in olivopontocerebellar atrophy: Clinical, pathological, and neurochemical evidence. Ann Neurol 30: , 425–428. |
[4] | Gilman S , Low P , Quinn N , Albanese A , Ben-Shlomo Y , Fowler C , Kaufmann H , Klockgether T , Lang A , Lantos P , Litvan I , Mathias C , Oliver E , Robertson D , Schatz I , Wenning G ((1998) ) Consensus statement on the diagnosis of multiple system atrophy. American Autonomic Society and American Academy of Neurology. Clin Auton Res 8: , 359–362. |
[5] | Tandon R , Pradhan S ((2015) ) Autonomic predominant multiple system atrophy in the context of Parkinsonian and cerebellar variants. Clin Neurol Neurosurg 130: , 110–113. |
[6] | Low PA , Reich SG , Jankovic J , Shults CW , Stern MB , Novak P , Tanner CM , Gilman S , Marshall FJ , Wooten F , Racette B , Chelimsky T , Singer W , Sletten DM , Sandroni P , Mandrekar J ((2015) ) Natural history of multiple system atrophy in the USA: A prospective cohort study. Lancet Neurol 14: , 710–719. |
[7] | Batla A , De Pablo-Fernandez E , Erro R , Reich M , Calandra-Buonaura G , Barbosa P , Balint B , Ling H , Islam S , Cortelli P , Volkmann J , Quinn N , Holton JL , Warner TT , Bhatia KP ((2018) ) Young-onset multiple system atrophy: Clinical and pathological features. Mov Disord 33: , 1099–1107. |
[8] | Koga S , Cheshire WP , Tipton PW , Driver-Dunckley ED , Wszolek ZK , Uitti RJ , Graff-Radford NR , van Gerpen JA , Dickson DW ((2021) ) Clinical features of autopsy-confirmed multiple system atrophy in the Mayo Clinic Florida brain bank. Parkinsonism Relat Disord 89: , 155–161. |
[9] | Batla A , Stamelou M , Mensikova K , Kaiserova M , Tuckova L , Kanovsky P , Quinn N , Bhatia KP ((2013) ) Markedly asymmetric presentation in multiple system atrophy. Parkinsonism Relat Disord 19: , 901–905. |
[10] | Gilman S , Wenning GK , Low PA , Brooks DJ , Mathias CJ , Trojanowski JQ , Wood NW , Colosimo C , Durr A , Fowler CJ , Kaufmann H , Klockgether T , Lees A , Poewe W , Quinn N , Revesz T , Robertson D , Sandroni P , Seppi K , Vidailhet M ((2008) ) Second consensus statement on the diagnosis of multiple system atrophy. Neurology 71: , 670–676. |
[11] | Wenning GK , Stankovic I , Vignatelli L , Fanciulli A , Calandra Buonaura G , Seppi K , Palma JA , Meissner WG , Krismer F , Berg D , Cortelli P , Freeman R , Halliday G , Höglinger G , Lang A , Ling H , Litvan I , Low P , Miki Y , Panicker J , Pellecchia MT , Quinn N , Sakakibara R , Stamelou M , Tolosa E , Tsuji S , Warner T , Poewe W , Kaufmann H ((2022) ) The Movement Disorder Society Criteria for the Diagnosis of Multiple System Atrophy. Mov Disord 37: , 1131–1148. |
[12] | Pellecchia MT , Stankovic I , Fanciulli A , Krismer F , Meissner WG , Palma JA , Panicker JN , Seppi K , Wenning GK ((2020) ) Can autonomic testing and imaging contribute to the early diagnosis of multiple system atrophy? A systematic review and recommendations by the Movement Disorder Society Multiple System Atrophy Study Group. Mov Disord Clin Pract 7: , 750–762. |
[13] | Zhu S , Deng B , Huang Z , Chang Z , Li H , Liu H , Huang Y , Pan Y , Wang Y , Chao YX , Chan LL , Wu YR , Tan EK , Wang Q ((2021) ) Hot cross bun is a potential imaging marker for the severity of cerebellar ataxia in MSA-C. NPJ Parkinsons Dis 7: , 15. |
[14] | Wenning GK , Tison F , Seppi K , Sampaio C , Diem A , Yekhlef F , Ghorayeb I , Ory F , Galitzky M , Scaravilli T , Bozi M , Colosimo C , Gilman S , Shults CW , Quinn NP , Rascol O , Poewe W ((2004) ) Development and validation of the Unified Multiple System Atrophy Rating Scale (UMSARS). Mov Disord 19: , 1391–1402. |
[15] | Sletten DM , Suarez GA , Low PA , Mandrekar J , Singer W ((2012) ) COMPASS 31: A refined and abbreviated Composite Autonomic Symptom Score. Mayo Clin Proc 87: , 1196–1201. |
[16] | Tison F , Yekhlef F , Balestre E , Chrysostome V , Quinn N , Wenning GK , Poewe W ((2002) ) Application of the International Cooperative Ataxia Scale rating in multiple system atrophy. Mov Disord 17: , 1248–1254. |
[17] | Goetz CG , Tilley BC , Shaftman SR , Stebbins GT , Fahn S , Martinez-Martin P , Poewe W , Sampaio C , Stern MB , Dodel R , Dubois B , Holloway R , Jankovic J , Kulisevsky J , Lang AE , Lees A , Leurgans S , LeWitt PA , Nyenhuis D , Olanow CW , Rascol O , Schrag A , Teresi JA , van Hilten JJ , LaPelle N ((2008) ) Movement Disorder Society-sponsored revision of the Unified Parkinson’s Disease Rating Scale (MDS-UPDRS): Scale presentation and clinimetric testing results. Mov Disord 23: , 2129–2170. |
[18] | Maier W , Buller R , Philipp M , Heuser I ((1988) ) The Hamilton Anxiety Scale: Reliability, validity and sensitivity to change in anxiety and depressive disorders. J Affect Disord 14: , 61–68. |
[19] | Broen MP , Moonen AJ , Kuijf ML , Dujardin K , Marsh L , Richard IH , Starkstein SE , Martinez-Martin P , Leentjens AF ((2015) ) Factor analysis of the Hamilton Depression Rating Scale in Parkinson’s disease. Parkinsonism Relat Disord 21: , 142–146. |
[20] | Goetz CG , Poewe W , Rascol O , Sampaio C , Stebbins GT , Counsell C , Giladi N , Holloway RG , Moore CG , Wenning GK , Yahr MD , Seidl L ((2004) ) Movement Disorder Society Task Force report on the Hoehn and Yahr staging scale: Status and recommendations. Mov Disord 19: , 1020–1028. |
[21] | (1990) Partitioning Around Medoids (Program PAM). Finding Groups in Data, 68–125. |
[22] | Lloyd S ((1982) ) Least squares quantization in PCM. IEEE Trans Inf Theory 28: , 129–137. |
[23] | ((2007) ) Kohonen network. Scholarpedia 2: , 1568. |
[24] | Sakushima K , Nishimoto N , Nojima M , Matsushima M , Yabe I , Sato N , Mori M , Sasaki H ((2015) ) Epidemiology of multiple system atrophy in Hokkaido, the Northernmost Island of Japan. The Cerebellum 14: , 682–687. |
[25] | Osaki Y , Ben-Shlomo Y , Lees AJ , Wenning GK , Quinn NP ((2009) ) A validation exercise on the new consensus criteria for multiple system atrophy. Mov Disord 24: , 2272–2276. |


