
Altered Outer Retinal Structure, Electrophysiology and Visual Perception in Parkinson’s Disease
Abstract
Background:
Visual biomarkers of Parkinson’s disease (PD) are attractive as the retina is an outpouching of the brain. Although inner retinal neurodegeneration in PD is well-established this has overlap with other neurodegenerative diseases and thus outer retinal (photoreceptor) measures warrant further investigation.
Objective:
To examine in a cross-sectional study whether clinically implementable measures targeting outer retinal function and structure can differentiate PD from healthy ageing and whether these are sensitive to intraday levodopa (L-DOPA) dosing.
Methods:
Centre-surround perceptual contrast suppression, macular visual field sensitivity, colour discrimination, light-adapted electroretinography and optical coherence tomography (OCT) were tested in PD participants (n = 16) and controls (n = 21). Electroretinography and OCT were conducted before and after midday L-DOPA in PD participants, or repeated after ∼2 hours in controls.
Results:
PD participants had decreased center-surround contrast suppression (p < 0.01), reduced macular visual field sensitivity (p < 0.05), color vision impairment (p < 0.01) photoreceptor dysfunction (a-wave, p < 0.01) and photoreceptor neurodegeneration (outer nuclear layer thinning, p < 0.05), relative to controls. Effect size comparison between inner and outer retinal parameters showed that photoreceptor metrics were similarly robust in differentiating the PD group from age-matched controls as inner retinal changes. Electroretinography and OCT were unaffected by L-DOPA treatment or time.
Conclusions:
We show that outer retinal outcomes of photoreceptoral dysfunction (decreased cone function and impaired color vision) and degeneration (i.e., outer nuclear layer thinning) were equivalent to inner retinal metrics at differentiating PD from healthy age-matched adults. These findings suggest outer retinal metrics may serve as useful biomarkers for PD.
INTRODUCTION
Parkinson’s disease (PD) is the most common movement disorder of the developed world [1] and is estimated to affect 10 million people worldwide [2]. Clinical diagnosis of PD remains difficult [3, 4] and requires specialist neurological assessment of motor symptoms to determine whether an individual meets the UK Brain Bank Diagnosis Criteria [5] or Movement Disorder Society criteria [6]. Current treatment of PD largely involves dopamine replacement therapies, most commonly levodopa (L-DOPA), as well as dopamine agonist drugs [7, 8] typically prescribed as multiple doses taken at regular time intervals each day [9].
Although PD is largely characterized by its motor symptoms, non-motor symptoms such as changes in autonomic [10, 11], olfactory [12, 13], and visual [14–16] function occur years before motor symptom onset and are gaining interest as alternative prodromal biomarkers for PD [17]. Moreover, exploring non-motor symptoms can complement and advance our understanding of brain dysfunction in neurodegenerative conditions like PD [18, 19].
Given the eye and brain’s shared embryological origins [20], many groups have sought to characterize visual and retinal changes that occur with PD progression. Up to 80% of people with PD report experiencing some type of dysfunction or loss in vision [21]. Changes in color vision [22–25], contrast sensitivity [26, 27] and light-adaptation [28–30] associated with dopamine deficiency [31–33] have been documented in the prodromal and early stages of PD [16, 34].
The retina is an opportune location by which changes in structure and function can be non-invasively monitored and used to indicate cortical health and/or neurodegenerative disease status [35]. Accordingly, a retinal locus of injury has been inferred for visual symptoms reported in patients, based on reports of retinal thinning measured using optical coherence tomography (OCT) [36–38] and functional deficits measured using electrophysiology (reduced and/or delayed electroretinography, ERG, responses) [39–42] in PD. To consider the potential for a retinal locus, this study explores retinal structure (imaging), function (ERG) and psychophysical measures of visual pathway function in people with established, and medicated for, PD. We also address limitations of previous literature by considering the acute effects of intraday L-DOPA treatment on retinal function and structure following partial washout conditions.
MATERIALS AND METHODS
Ethics approval was obtained by The University of Melbourne Human Research Ethics Committee (HREC number: 1852662.5) and the study was conducted in adherence to the 1975 Declaration of Helsinki. Written informed consent was provided by all participants. The local PD advocacy group (https://www.fightparkinsons.org.au/) provided feedback on the project and assisted in advertising the project to the Parkinson’s community.
Participants
A total of 37 participants (Table 1) took part in this pilot study, which assessed people living with PD (n = 16) and age-matched controls (n = 21). All participants underwent an eye screening assessment by an optometrist to ensure normal ocular health and suitability for pupil dilation. Subjective refraction was performed using a standardized protocol with an Early Treatment Diabetic Retinopathy Study chart at 4 m. Participants were included in the study if their best corrected visual acuity in the tested eye was better than or equal to 6/12 (0.50 equivalent), refractive error was within±6.00D sphere and less than – 2.00D cylinder and intraocular pressure (measured by rebound tonometry: Icare, Vantaa, Finland) was within normal limits (10–21 mm Hg) [43].
Table 1
Table1
| PD Participants | Control Participants | p | |
| Number, n | 16 | 21 | – |
| Age, y, mean (range) | 61 (41–79) | 57 (41–85) | 0.27 |
| Female (%) | 7 (44%) | 14 (67%) | 0.20 |
| Best corrected visual acuity, mean (SD) | 0.97±0.18 | 1.11±0.19 | 0.038 |
| Intraocular pressure, mmHg, mean (SD) | 12±3 | 15±3 | 0.038 |
| Disease duration, y, mean (SD) | 5±3 | – | – |
| Medication | |||
| LEDD (mg) | 485±47 | 0±0 | < 0.0001 |
| Clinical PD diagnosis | 16 (100%) | 0 (0%) | < 0.0001 |
| Sleep disturbance | 3 (19%) | 0 (0%) | 0.07 |
| Anxiety | 3 (19%) | 0 (0%) | 0.07 |
| Depression | 2 (13%) | 1 (5%) | 0.57 |
| Blood pressure | 3 (19%) | 5 (24%) | > 0.9999 |
| Cholesterol | 2 (13%) | 6 (29%) | 0.42 |
| Heart problems | 3 (19%) | 1 (5%) | 0.63 |
| Arthritis | 1 (6%) | 0 (0%) | 0.43 |
SD, standard deviation; PD, Parkinson’s disease, LEDD, Levodopa equivalent daily dose.
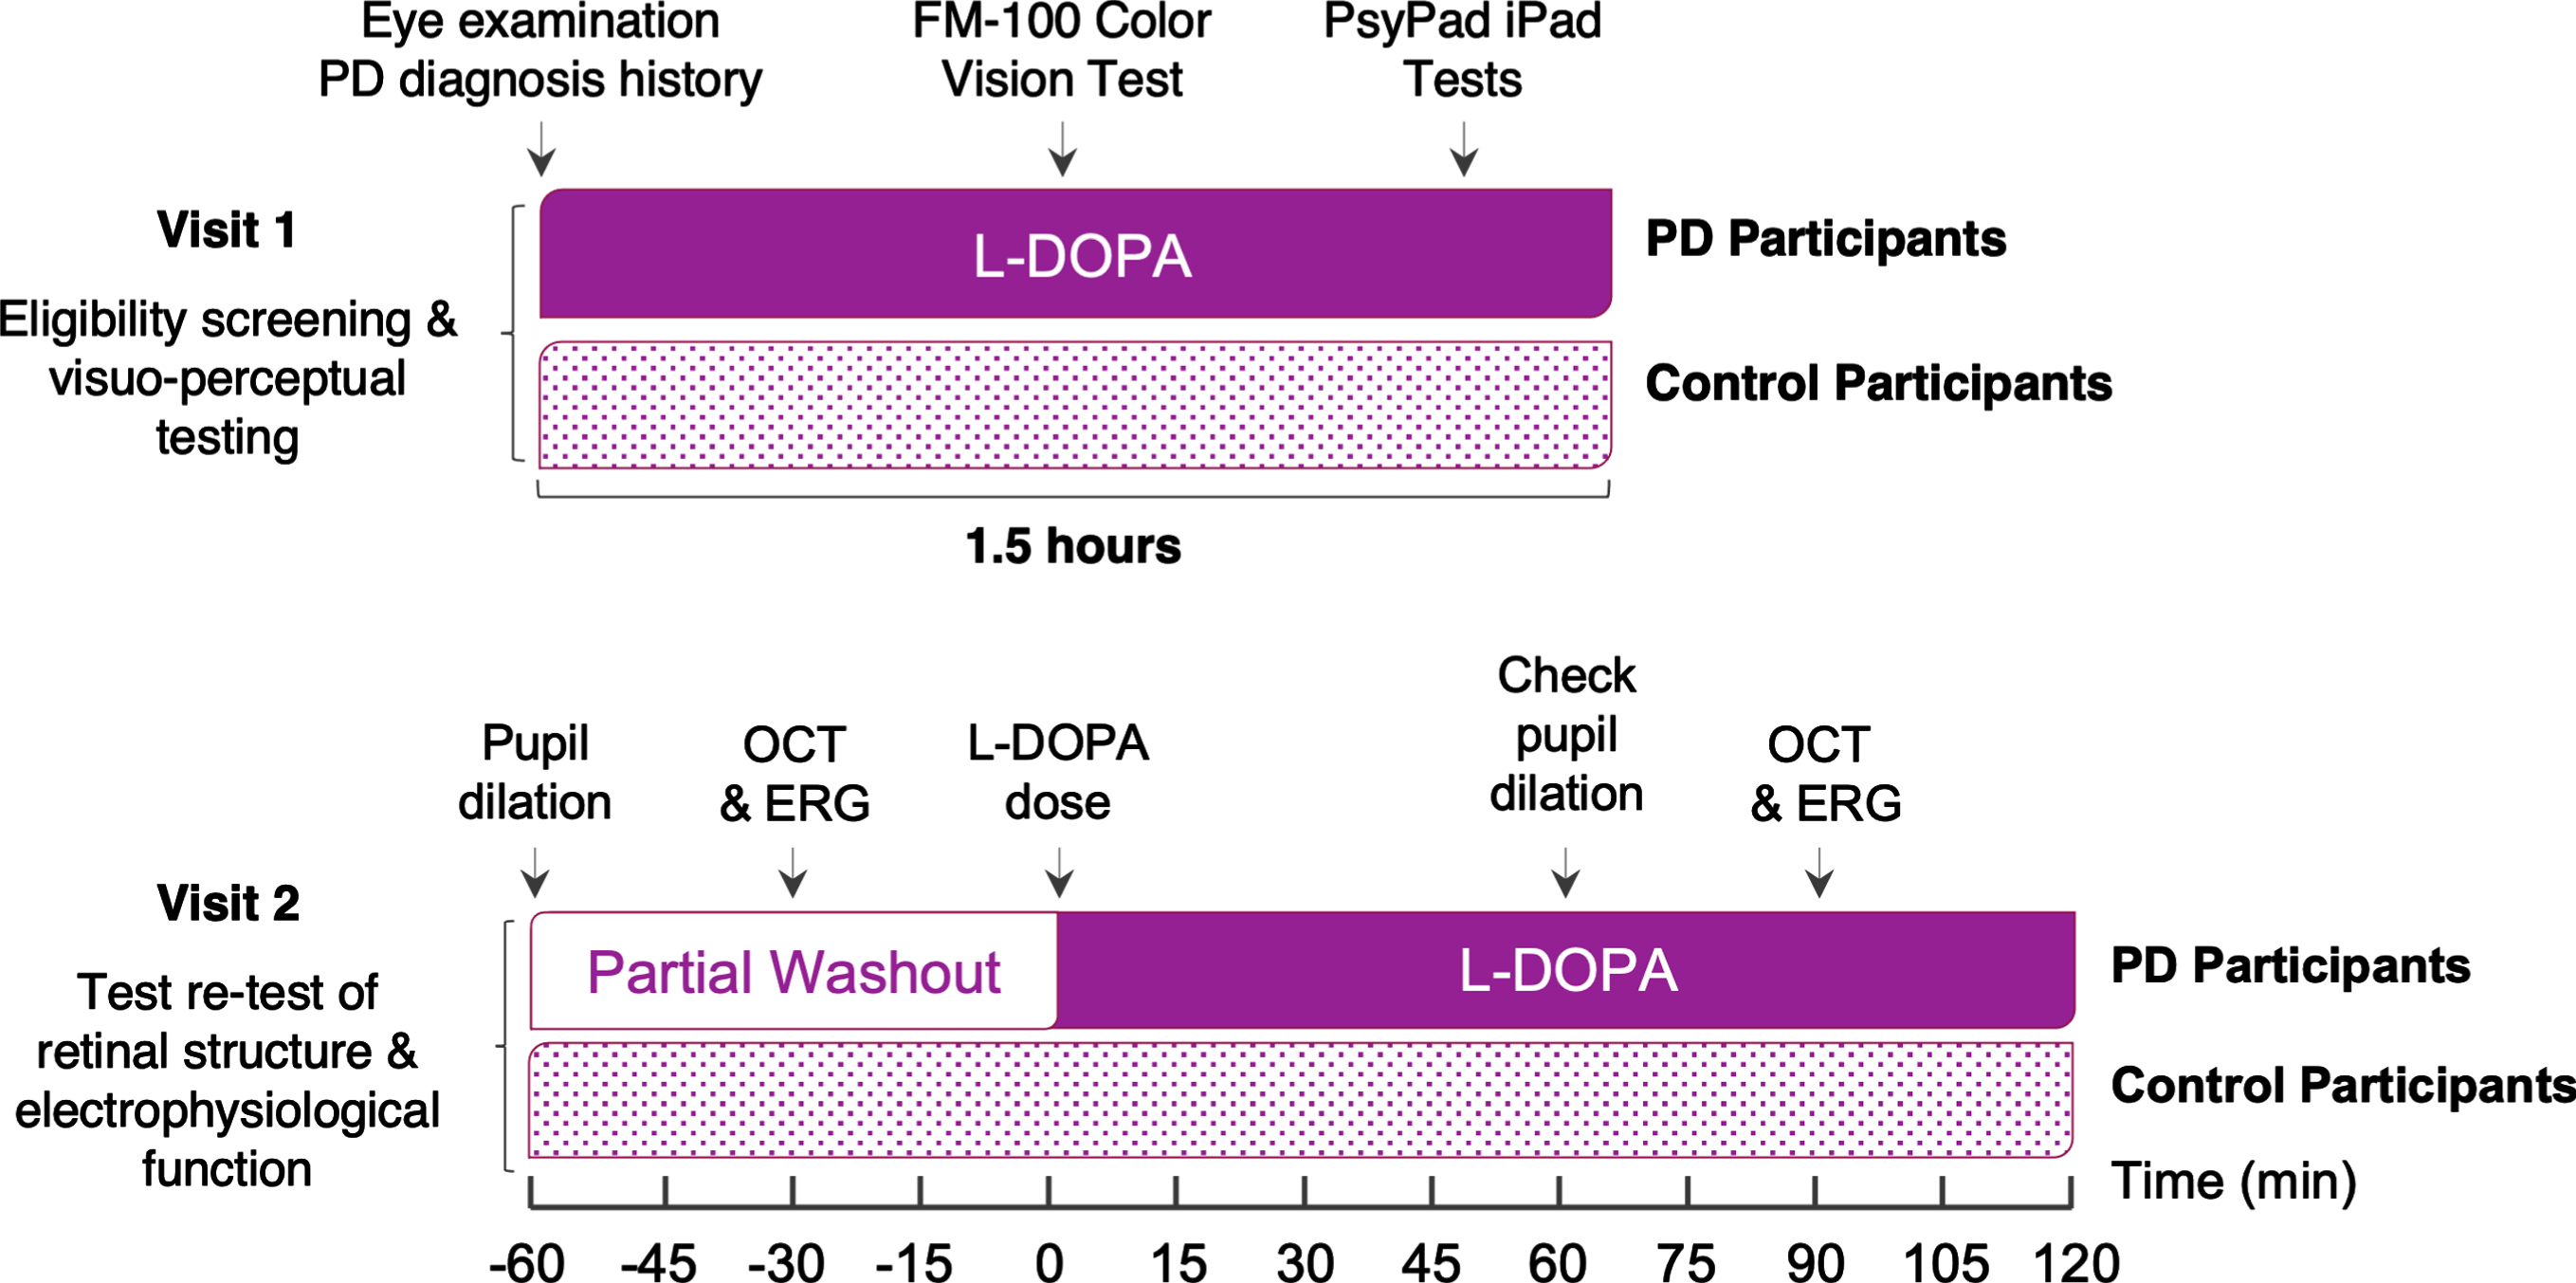
Exclusion criteria included glaucoma, diabetes mellitus, age-related macular degeneration, retinal detachment, previous ocular surgery or trauma, corneal pathologies, and non-Parkinson’s neurological conditions (e.g., Alzheimer’s disease, multiple sclerosis, or epilepsy). The study was conducted over two visits. The first visit consisted of an eye screening assessment, collection of PD diagnosis history, and perceptual center-surround contrast suppression, visual field and color vision tests. The second visit (conducted approximately one week after the initial visit) evaluated retinal structure and electrophysiological function over a 3-hour period. Participants in the PD group self-reported neurological confirmation of PD diagnosis and all were prescribed a L-DOPA medication, with a full history of current medications taken. Only PD participants who were prescribed some type of daily dopamine replacement therapy (e.g., L-DOPA + benserazide or L-DOPA + carbidopa) were included in this study as retinal outcomes were designed to compare relative ‘pre-/partial washout’ and ‘post-/L-DOPA’ phases of L-DOPA treatment, as shown in Fig. 1. PD participants took their first and mid-morning dose as usual and baseline retinal assessments were conducted just before their midday dose of L-DOPA. To assess test-retest intrasession variability and the effect of L-DOPA on retinal structure and function, OCT and ERG were repeated 1 h after PD participants’ midday dose (see Fig. 1) to target L-DOPA’s pharmacokinetic peak.
Fig. 1
Study Experimental Design. PD, Parkinson’s disease; OCT, optical coherence tomography; ERG, electroretinography; L-DOPA, levodopa. The timeline of each visit depicts L-DOPA status of Parkinson’s disease participants during visual assessments.
Procedures
Visual perception
Visual perceptual tests (macular visual field sensitivity and center-surround perceptual contrast suppression) were conducted using the open-access platform PsyPad 2.7 [44] on an iPad 2 (Apple, California, USA) tablet device operating on iOS 10.3.4 (1024×768-pixel resolution, 256 bits per pixel, 60 Hz, max luminance 344.5 cd/m2) with ‘auto-brightness’ disabled and screen brightness set to maximum luminance. The best eye (i.e., better visual acuity) or a randomly selected eye in the case of equivalent acuity was chosen for visual perceptual assessment and all subsequent retinal tests. All tasks were performed monocularly (aided by refractive correction, if applicable) in a room with room lights turned off. Prior to participants completing the tablet-based tasks, the researcher explained each task with the help of the illustrations shown in Fig. 2. Participants then performed at least one short practice test to familiarize themselves with each task and adapted to the ambient illumination and screen luminance for approximately 1 to 2 minutes before completing the visual perceptual tests in a blocked order design (either center-surround perceptual contrast suppression tests or visual field testing first).
Fig. 2
Example stimuli used in the visuo-perceptual tasks. A) Two circularly windowed grating stimuli oriented at 90° to determine contrast matching thresholds (when the two stimuli appeared perceptually of the same contrast) for the no surround task. B) The center-surround stimulus (left) and center-only stimulus (right) to measure the effect of perceptual surround suppression. C) Locations and size of the 0.43° radius stimuli used to measure macular visual field sensitivity at discrete locations within the central (2°) visual field, while the participant fixated on the central fixation cross. The touchscreen buttons (3.4×3.4 or 5×5 deg of visual angle) are indicated by the grey squares at the bottom corners of the screen which observers tapped to register their response.

Centre-surround perceptual contrast suppression
Centre-surround perceptual contrast suppression was measured using two 2-alternative forced choice tasks: a no-surround and center-surround contrast matching task, at a working distance of 40 cm as described previously [45]. For the no-surround contrast matching task (Fig. 2A), a fixed-contrast reference stimulus consisting of drifting sine gratings (40% Michelson contrast, spatial frequency 2 c/deg; drift rate 2 deg/s, 500 ms duration) in a circular envelope (0.67 deg radius) was presented on the left-hand side of a grey background (mean luminance 172 cd/m2). On the right-hand side, an identical stimulus was presented, except that its contrast was varied according to two interleaved 1-down-1-up staircases designed to converge on the point of subjective equality. The purpose of the no-surround task was to determine the matching contrast for a center target stimulus alone, and to check participants’ ability to make contrast discrimination judgments. For the center-surround task (Fig. 2B), the stimuli were identical to the no surround task, except that one target was now embedded within a surround annulus (outer circumference: 4 deg radius, inner circumference: 0.67 deg radius, 95% contrast). Stimuli for both tasks were presented for 500 ms and observers were instructed to choose the central target (left or right) that appeared higher in contrast. Once a response was registered, the next set of stimuli was presented after 500 ms. Staircases terminated after four reversals and individual thresholds were calculated as the mean of the last two reversals of both staircases. Runs that did not have any reversals were discarded.
Macular visual field sensitivity
Macular visual field sensitivity [defined in decibels (dB)] was measured at 12 locations within 2° of central fixation (Fig. 2C), as previously detailed [46]. This task was performed without pupillary dilation as pupil size does not significantly influence measurements of luminance increment sensitivity in the foveal region [47]. Observers maintained a working distance of 50 cm and fixated on a central white cross at 0° within a fixation ring (3 deg radius) throughout the duration of the test. White circular stimuli (0.43 deg radius) at specific luminance levels across a range of 36 dB (1.52 to 317.50 cd/m2) with 2 dB increments were randomly presented on a uniform black background (1.27 cd/m2 luminance) for 200 ms. Threshold sensitivity was determined by interleaved 4–2 staircases with two reversals at each location, with the final threshold estimate of macular visual field sensitivity taken as the mean of the two reversals across all 12 locations.
FM-100 color discrimination
The Farnsworth-Munsell 100 (FM-100) hue test was used to assess color discrimination, to return information regarding general color vision performance as well as deficits in the red-green and blue-yellow axes [48]. The test was conducted binocularly, with habitual near correction under standardized lighting conditions in a customized viewing booth that was compliant with international illumination standards for color vision testing [49]. Classical test error scores [50, 51] were calculated using the WEB-based scoring software for the FM-100 hue test designed and developed by Béla Török (http://www.torok.info/fm100/) [52, 53] and used for analysis.
Optical coherence tomography
Retinal imaging was captured by spectral-domain optical coherence tomography on a Spectralis HRA + OCT (Heidelberg Engineering, Heidelberg, Germany). The pupil was dilated using 1 drop of tropicamide 0.5% (Mydriacyl, Alcon Laboratories). Participants used their undilated eye to fixate on an external white light (22 cm away) which was dimmed by a transparent black film filter (< 0.5 cd/m2). A macular volume scan (8.1×8.1×1.9 mm) sampling 61 horizontal B-scans (each consisting of 768 A-scans [3.87μm axial vs 9.8μm lateral resolution]) was then taken (Fig. 3A). Scans with an image quality of less than 25 dB (e.g., due to large motion artifacts) were discarded and repeated where possible.
Fig. 3
Example macular OCT scan. A) A macular volume scan with an Early Treatment Diabetic Retinopathy Study [ETDRS] grid overlaid for retinal layer thickness profile analysis. B) Corresponding cross section [green line on panel A] illustrating the automatic segmentation of retinal layers: retinal nerve fiber layer, RNFL; ganglion cell inner plexiform layer, GCIPL; inner nuclear layer, INL; outer plexiform layer, OPL; outer nuclear layer, ONL and total retinal thickness, TRT. TRT is a measurement that spans from the inner limiting membrane (ILM) to the outer limiting membrane (OLM). Scale bar, 200μm.
![Example macular OCT scan. A) A macular volume scan with an Early Treatment Diabetic Retinopathy Study [ETDRS] grid overlaid for retinal layer thickness profile analysis. B) Corresponding cross section [green line on panel A] illustrating the automatic segmentation of retinal layers: retinal nerve fiber layer, RNFL; ganglion cell inner plexiform layer, GCIPL; inner nuclear layer, INL; outer plexiform layer, OPL; outer nuclear layer, ONL and total retinal thickness, TRT. TRT is a measurement that spans from the inner limiting membrane (ILM) to the outer limiting membrane (OLM). Scale bar, 200μm.](https://content.iospress.com:443/media/jpd/2024/14-1/jpd-14-1-jpd230293/jpd-14-jpd230293-g003.jpg)
The Heidelberg Eye Explorer 2 OCT reader plugin (Heyex, Heidelberg Engineering) was used for OCT thickness profile analysis. Automatic segmentation of all retinal layers (Fig. 3B, retinal nerve fiber layer, RNFL; ganglion cell layer, GCL; inner plexiform layer, IPL; inner nuclear layer, INL; outer plexiform layer, OPL; outer nuclear layer, ONL; retinal pigment epithelium, RPE) and total retinal thickness (TRT) was conducted using the Heidelberg Eye Explorer 2 software. Screening of segmentation errors was then undertaken, and any identified errors were manually corrected by a single investigator. Combined averaged thickness values (global total of 1–, 2–and 3–mm rings) from the Early Treatment Diabetic Retinopathy Study grid, centered on the fovea (Fig. 3A), was used for analysis. Parameters including standard clinical inner retinal metrics (ganglion cell inner plexiform layer, GCIPL = GCL + IPL) as well as middle (INL) and outer (ONL) nuclear layers were reported for comparison.
Full-field electroretinography
Following OCT imaging, monocular full-field photopic ERG was performed using the portable handheld RETeval visual electrodiagnostic device (LKC Technologies, Maryland, USA). The device delivers specifically calibrated light stimuli to the eye via a 60 mm diameter Ganzfeld dome buffered by a soft eyecup. ERG responses were recorded using disposable Sensor Strip (LKC Technologies) electrodes which self-adhere upon contact to the skin and integrate active (positive), ground and inactive (negative) reference leads into a single array. After the skin below the eye was cleaned with Nuprep (a mild dermabrasive exfoliant gel) followed by a 70% isopropyl alcohol wipe, the disposable skin electrode was placed 2 mm below the lower lid margin on the inferior orbital rim and lined up directly under the pupil center. A 10-minute period of light adaptation to a background light of 30 cd/m2 (850 Td) was then initiated. To maintain stable eye position, participants were asked to fixate on a central red light inside the dome, which was monitored via a live capture feed by the in-built infrared camera.
After light adaptation, light stimuli consisting of short (≤4 ms) flashes (85 Td.s) on a white background (850 Td.s) were used to stimulate the retina. Equivalent to the International Society for Clinical Electrophysiology of Vision standard stimuli for photopic flash and flicker ERG [54], fifty flashes were delivered at a frequency of 2 Hz, followed by flicker stimuli delivered at 28.3 Hz, respectively. Pupil size was tracked in real-time by the device which adjusted the luminance (cd.s/m2) of each flash to account for any variation in pupil size according to the following formula: photopic flash luminance (cd.s/m2)×pupil area (mm2) = photopic flash retinal illuminance (Td.s). Flash ERG a-wave, b-wave and photopic negative response (PhNR) parameters (amplitude, μV and time, ms) and flicker cyclic parameters (amplitude, μV and time, ms) were extracted and analyzed.
Data and statistical analysis
Statistical comparisons between groups (PD versus healthy age-matched controls) were made using Prism 8 software (GraphPad Software Inc., San Diego, CA, USA). All data are expressed as group mean±standard error of the mean (SEM) unless stated otherwise. A ROUT (Robust regression and OUTlier) test was used to identify any possible outliers which were excluded from analysis. To compare gender/medication and mean differences between and PD and control participant groups, a Fisher’s exact test and two-tailed unpaired Student’s t-tests were used, respectively. To compare test-retest retinal outcomes before and after L-DOPA medication, two-way repeated measures analysis of variance (ANOVA) with Sidak’s correction for post hoc multiple comparisons or two-tailed paired Student’s t-tests were used. In instances where data drop-out occurred, a mixed-effects model was used for comparison between groups. An alpha of 0.05 was used to determine statistical significance.
RESULTS
Visual perception and color vision are affected in Parkinson’s disease
Typically, when two contrast patterns are presented side-by-side, observers are able to match the perceived contrast using their contrast discrimination ability. There was no difference in the ability for those with PD and controls to perceptually match the contrast of the striped pattern without a surround (unpaired t-test, p = 0.92, Fig. 4A). However, the addition of a surrounding pattern of higher contrast typically results in reduction of the perceived contrast of the central target [55], herein referred to as perceptual center-surround suppression. With the surround, PD participants perceived the center target to be higher in contrast compared with the control group (unpaired t-test, p = 0.0075, d = 0.97, Fig. 4B), indicating a relative reduction in center-surround perceptual contrast suppression.
Fig. 4
Comparison of visual perceptual measures and color vision performance between control and Parkinson’s disease participants. Perceived contrast (%) for the no surround task (A) and center-surround task (B), macular visual field sensitivity (C, decibels, dB) and FM-100 colour vision (CV) total test error scores (D, arbitrary unit, AU). Parkinson’s disease (PD) participants exhibited dysfunctional center surround contrast perception, reduced macular visual field (VF) sensitivity and poorer diffuse color discrimination (as indicated by higher test error scores) when compared to control participants. Grey data dots denote control group data and purple data dots denote PD group data. All data shown, mean±SEM; *p < 0.05 for PD effect on unpaired Student’s t-test analyses; grey shaded area, 95% CI of control group mean.
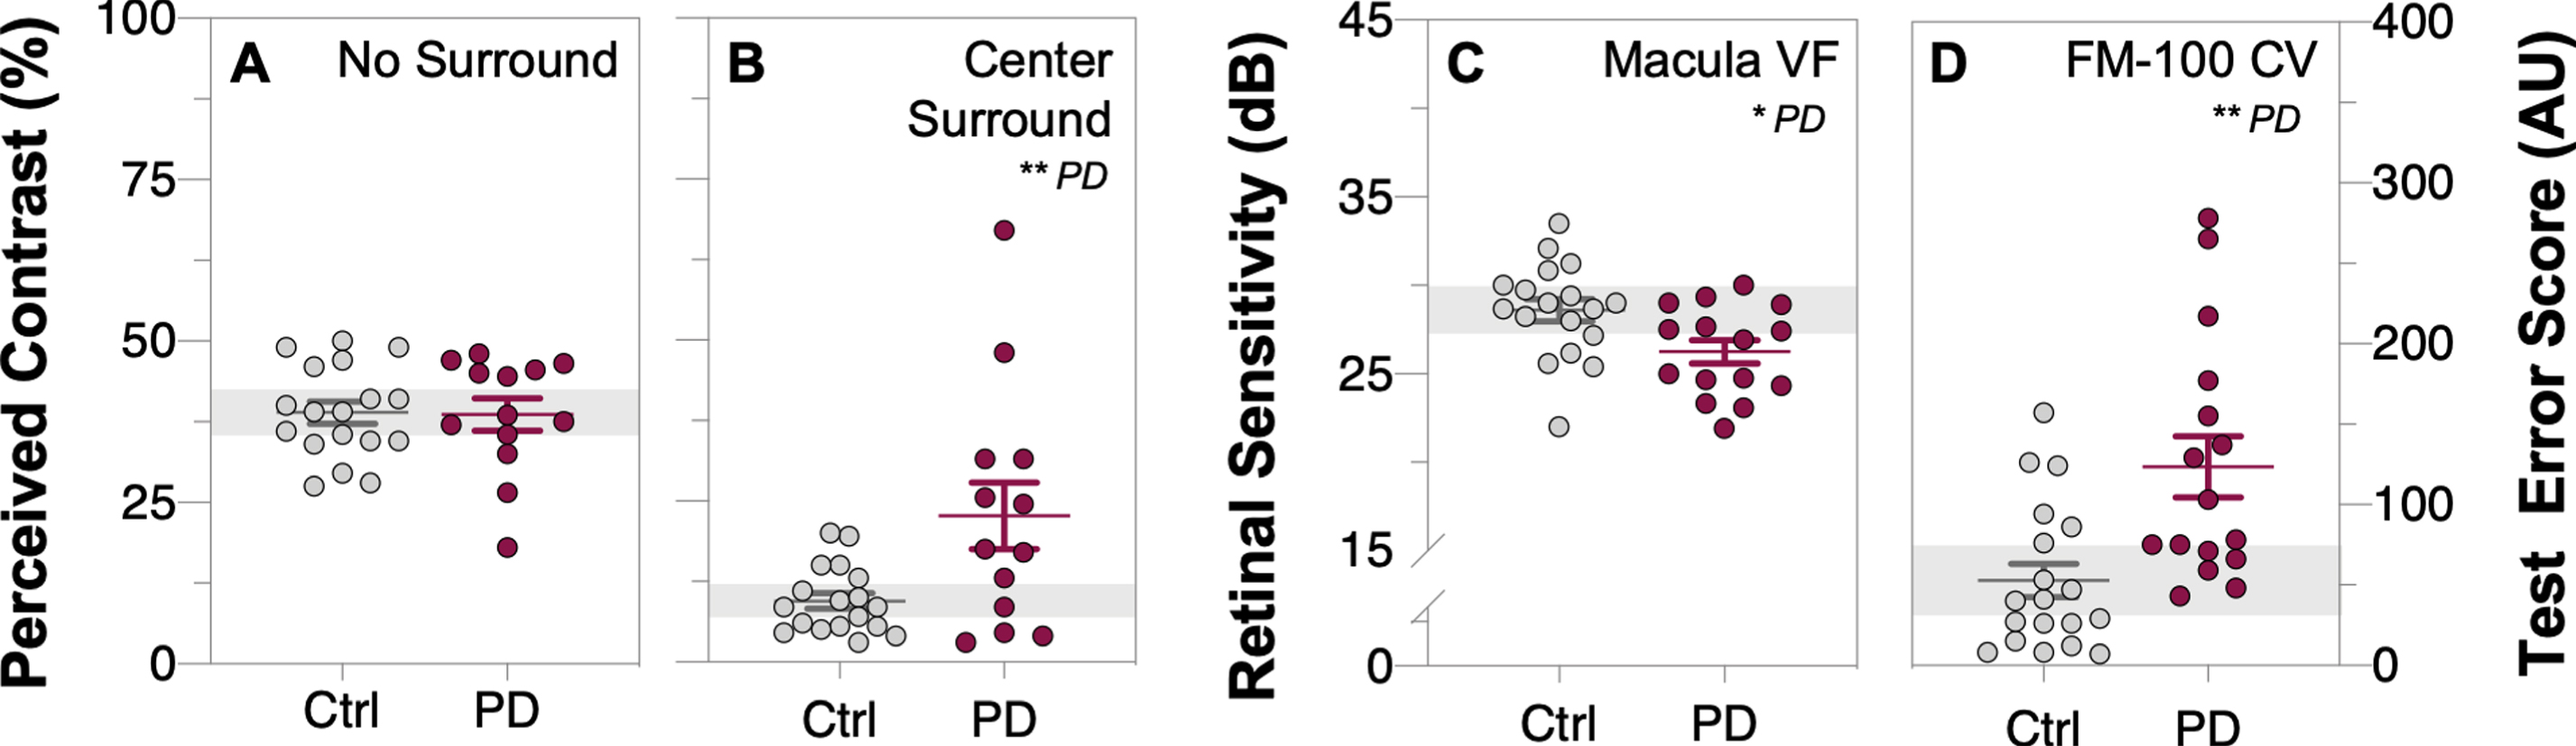
PD participants had lower macular visual field sensitivity (unpaired t-test, p = 0.016, d = 0.89, Fig. 4C) relative to controls. Analysis of FM-100 hue test results revealed those with PD exhibited poorer color discrimination (Fig. 4D) as indicated by higher test error scores on the FM-100 hue test (classical method: unpaired t-test, p = 0.0017, d = 1.13).
Retinal structure is altered in Parkinson’s disease
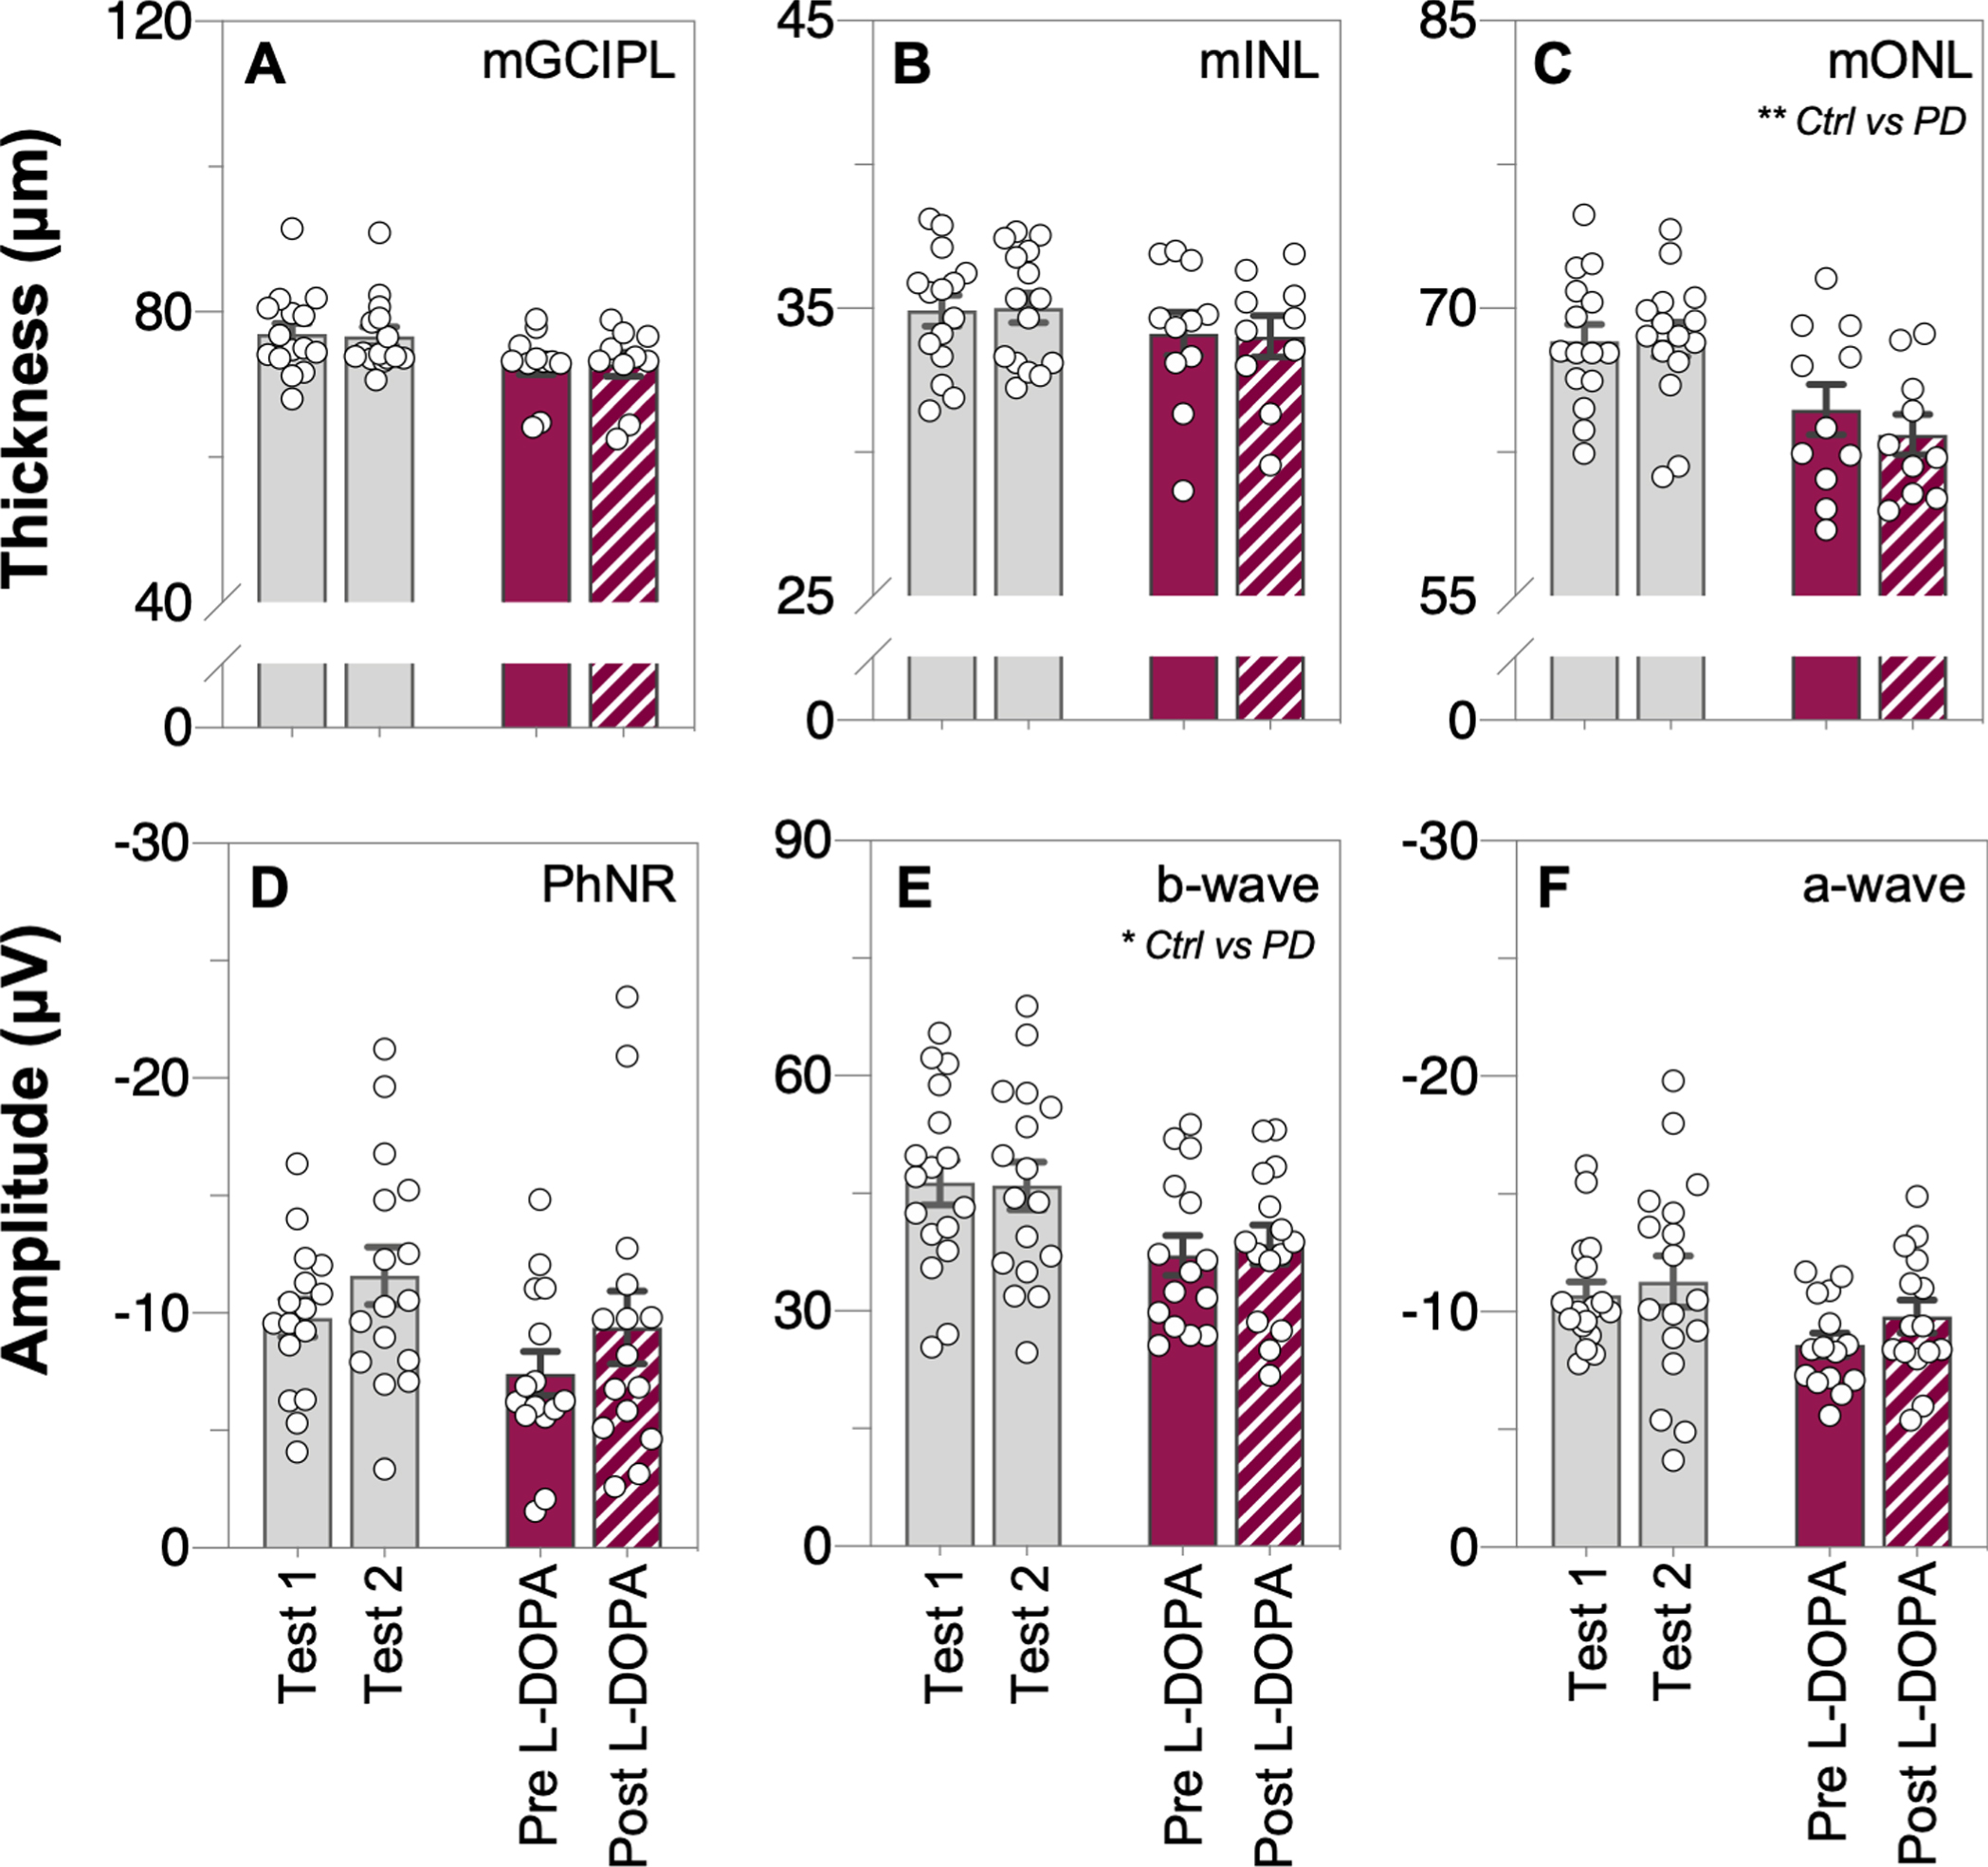
From the macular OCT scans, outer nuclear layer thinning (mONL, unpaired t-test, p = 0.028, d = 0.91, Fig. 5C) was observed in PD participants compared to controls, and the ganglion cell inner plexiform layer was also lower in PD compared with controls however this difference did not reach statistical significance (mGCIPL, unpaired t-test, p = 0.054, d = 0.82, Fig. 5A). OCT retinal layer thickness measurements did not change across time in control participants nor after L-DOPA treatment in PD participants (two-way ANOVA, mGCIPL: F(1, 23) = 0.11, p = 0.74, Fig. 6A; mINL: F(1, 23) = 0.46, p = 0.51, Fig. 6B; mONL: F(1, 23) = 0.79, p = 0.38, Fig. 6C).
Fig. 5
Comparison of inner and outer retinal layer thicknesses and function between control and Parkinson’s disease participants before L-DOPA treatment (i.e., first OCT/ERG measurement of both groups). Raw macular thickness values of the: ganglion cell inner plexiform layer, mGCIPL (A); inner nuclear layer, mINL (B) and outer nuclear layer, mONL (C) as measured by optical coherence tomography (OCT). Light-adapted electroretinogram (ERG) photopic negative response (PhNR, D), b-wave (E) and a-wave (F) amplitudes, respectively. Thinning in the mONL and smaller a-wave and b-wave amplitudes were observed in Parkinson’s disease (PD) participants compared to control participants. Grey data dots denote control group data and purple data dots denote Parkinson’s disease group data. All data shown, mean±SEM; *p < 0.05 and/or **p < 0.01 for PD effect on unpaired Student’s t-test analyses; grey shaded area, 95% CI of control group mean.
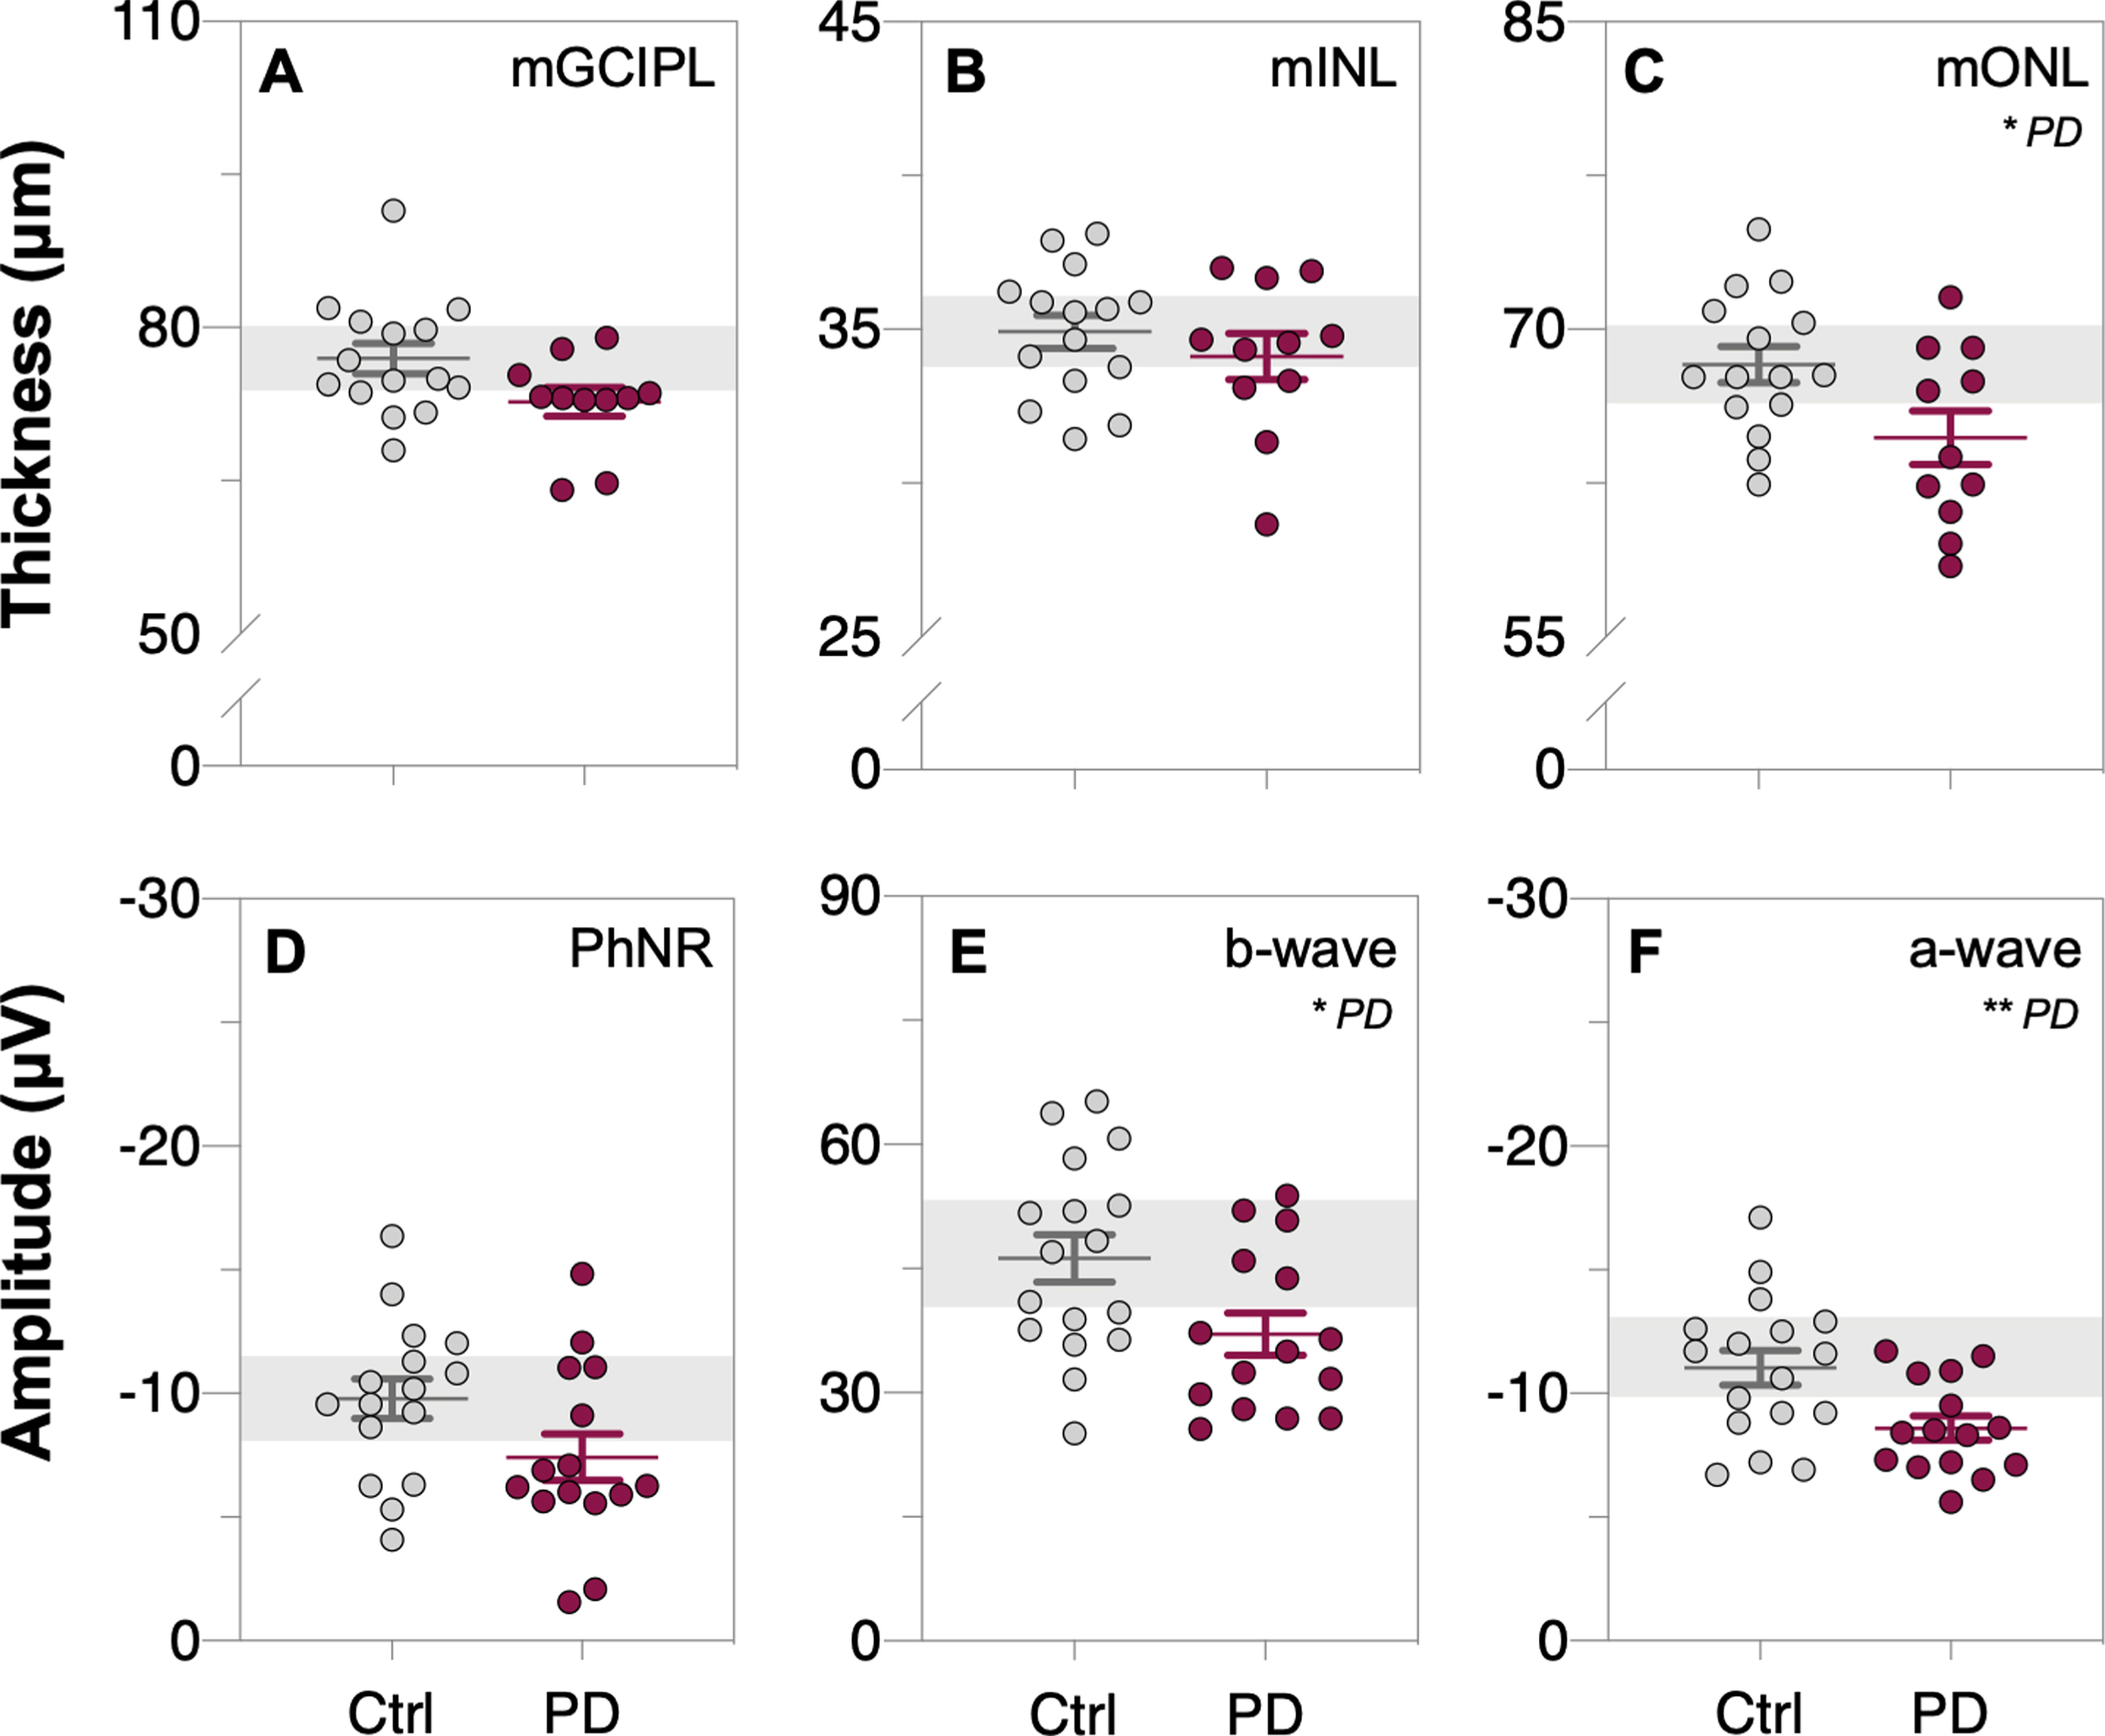
Fig. 6
Comparison of inner and outer retinal layer thicknesses and function across time, prior to and after L-DOPA treatment. Raw macular thickness values of the: ganglion cell inner plexiform layer, mGCIPL (A); inner nuclear layer, mINL (B) and outer nuclear layer, mONL (C) as measured by optical coherence tomography (OCT). Light-adapted electroretinogram (ERG) photopic negative response (PhNR, D), b-wave (E) and a-wave (F) amplitudes, respectively. No interaction effects were found in any of these OCT or ERG parameters. Grey bars denote control group data and purple bars denote Parkinson’s disease group data. All data shown, mean±SEM, analyzed by two-way repeated measures analysis of variance (ANOVA) or mixed-effects model.
Reduced retinal function in Parkinson’s disease
Full-field light-adapted flash and flicker ERG was used to assess retinal function in participants. Attenuated photoreceptoral (a-wave amplitude, unpaired t-test, p = 0.0094, d = 0.98, Fig. 5F) and bipolar cell (b-wave amplitude, unpaired t-test, p = 0.024, d = 0.86, Fig. 5E) function was detected in PD participants compared to controls. All ERG parameters in the control group remained stable across time (Fig. 6D-F). No interaction effect was found between the two groups with time or L-DOPA treatment for any of the ERG parameters (two-way ANOVA; PhNR: F(1, 29) = 0.01, p = 0.93, Fig. 6D; b-wave: F(1, 30) = 0.42, p = 0.52, Fig. 6E; a-wave: F(1, 30) = 0.27, p = 0.61, Fig. 6F).
DISCUSSION
We aimed to compare visual performance and retinal outcomes within a pilot cohort of PD participants and healthy age-matched controls to determine whether changes in outer retinal function and structure better differentiate PD from healthy aging than inner retinal metrics. We found that participants with PD perceive color and contrast differently to control participants. We additionally observed retinal thinning as well as reduced retinal function and macular sensitivity in this cohort of PD participants. While retinal function after L-DOPA treatment following complete washout conditions has been previously reported, we demonstrated that intraday oral dosing of L-DOPA does not affect test-retest measures of retinal function and structure following partial washout conditions.
Visual processing is compromised in Parkinson’s disease
Altered color vision has been a well-established biomarker of PD that can be detected years before the onset of motor symptoms [15, 16]. Some studies have observed color vision impairment in the protan and deutan (red–green) axes in PD patients [56] whilst others have found the greatest deficit in the tritan (blue–yellow) axis [22, 57]. PD participants in our study had poorer color vision discrimination than age-matched control participants as indicated by higher test error scores (Fig. 4D). While color vision abnormalities in PD may reflect both retinal and cortical dysfunction, our observed concomitant changes in outer retinal structure suggest that damage to photoreceptors, in particular cones and their communication to bipolar cells (b-wave attenuation), is present in PD. We did not find a common color vision axis deficit that was shared across our sample size of PD participants. As such, future assessments in larger, more diverse study cohorts employing more sophisticated means of assessing color vision (i.e., computer calibrated programs that can detect subtle changes in each axis) may provide us with greater insight into the type, extent, and severity of color vision deficiencies that is experienced in PD.
In addition to color vision changes, multiple studies have reported changes in visual processing [58–60] including altered contrast discrimination in PD patients as measured by contrast sensitivity Pelli-Robson charts [61]. We extend these studies to demonstrate that those with PD exhibited weaker perceptual center-surround contrast suppression (Fig. 4B) compared to controls. This novel finding is consistent with decreased inhibition, a potential indicator of disease-related changes in central neurotransmitter modulation [62, 63]. Perceptual surround modulation of perceived contrast arises from both intraocular and interocular visual mechanisms, with psychophysical responses showing good agreement with functional magnetic resonance imaging activity in the primary visual cortex [64, 65]. As such, our findings suggest that altered visual processing manifested through compromised color vision and center-surround contrast perception occurs both at a retinal and cortical level in PD.
Inner and outer retinal thinning occur in Parkinson’s disease
To our knowledge, this is the first study to investigate retinal thickness before and after a single dose L-DOPA. Numerous studies have established that structural changes to inner retinal layers occur in PD [37, 38, 66]. The magnitude of inner retinal thinning in the current study is comparable to the broader literature, despite it not reaching significance (p = 0.054). More specifically, a meta-analysis using the same GCIPL metric across 10 papers found a mean difference (95% CI) between control and PD groups of –3.17 (–5.07, –1.26) μm [37] which is comparable to the mean difference in this study, –3.89μm. Similarly, the outer nuclear layer thinning found in the current study had a mean difference of –4.00μm mirroring previous papers –4.04 (–9.48, –1.39) μm albeit across only 3 studies [67–69]. Thinning of the ONL has also been reported in recent studies which also used similar volumetric OCT scans [69–71]. In contrast, older studies which segment a single B-scan did not report significant ONL thinning [68, 72–74]. The current study extends these findings and shows the effect size of GCIPL, a common inner retinal metric, is similar to outer retinal structure (ONL) and function measures. Given mounting postmortem evidence of inner retinal alpha-synuclein deposits in PD patients [75–78], our finding of ganglion cell layer thinning may be driven by alpha-synuclein-related neurodegeneration. Additionally, in light of emerging evidence of photoreceptor vulnerability in PD [30, 79] due to increased photooxidative stress [80] and decreased dopaminergic innervation [81], our finding of outer nuclear layer thinning especially at the macular region implies that cone photoreceptors may be preferentially affected by pathological neurodegeneration seen in PD.
As for the effect of time and levodopa status on OCT assessment, we found that intraday L-DOPA treatment does not change outer retinal thickness in our PD participant group and that all repeated OCT measurements across both groups remained stable over time (Fig. 6A-C). As such, we demonstrate that both inner and outer retinal thinning occur in PD which may be indicative of local PD pathophysiological changes and that these do not fluctuate with intraday L-DOPA dosing.
Decreased retinal function and sensitivity manifests in Parkinson’s disease
In this study, we evaluate for the first time the acute effect of L-DOPA treatment on light-adapted retinal responses. Echoing clinical reports of attenuated full-field ERG responses in PD patients [82, 83], our PD participants showed reduced photoreceptor (a-wave, Fig. 5F) and bipolar cell (b-wave, Fig. 5E) cone responses relative to age-matched controls. Given our observations of outer nuclear layer thinning, the reduced light-adapted retinal function observed here is likely driven by cone photoreceptor degeneration and its downstream effects.
While we expected intraday L-DOPA to have an acute ameliorative effect on ERG responses in line with previous clinical reports from complete washout pharmacodynamics studies [39, 41, 42], we did not observe this in our study. No interaction effect was found between the two groups across time for any of the ERG parameters (Fig. 6D-F). As such, we show that single dose L-DOPA treatment following partial washout conditions do not affect repeated light-adapted retinal responses as measured by handheld ERG.
Furthermore, participants with PD in this study showed decreased macular sensitivity compared to age-matched controls (Fig. 4C). Reduced macular sensitivity may serve as a functional correlate to our observations of retinal layer thinning within the macular region in this cohort of PD participants. This is in agreement with Cesareo et al. (2021) [69] who found decreased differential light sensitivity with microperimetry in PD patients compared with controls.
Study limitations and future directions
The current study relied on self-reported PD diagnosis, with all PD participants reporting clinical diagnosis by a neurologist and all taking PD medications with a levodopa equivalent daily dose of 485±47 mg (range 288 mg to 850 mg; see dataset for individual details). Future studies would benefit from confirmation that PD diagnostic criteria were met (i.e., UK Brain Bank Diagnosis or Movement Disorder Society criteria) and Hoehn and Yahr staging. In addition to PD-related therapeutics all other concurrent medications were also noted and were not significantly different between control and PD groups (summarized in Table 1, raw data within dataset).
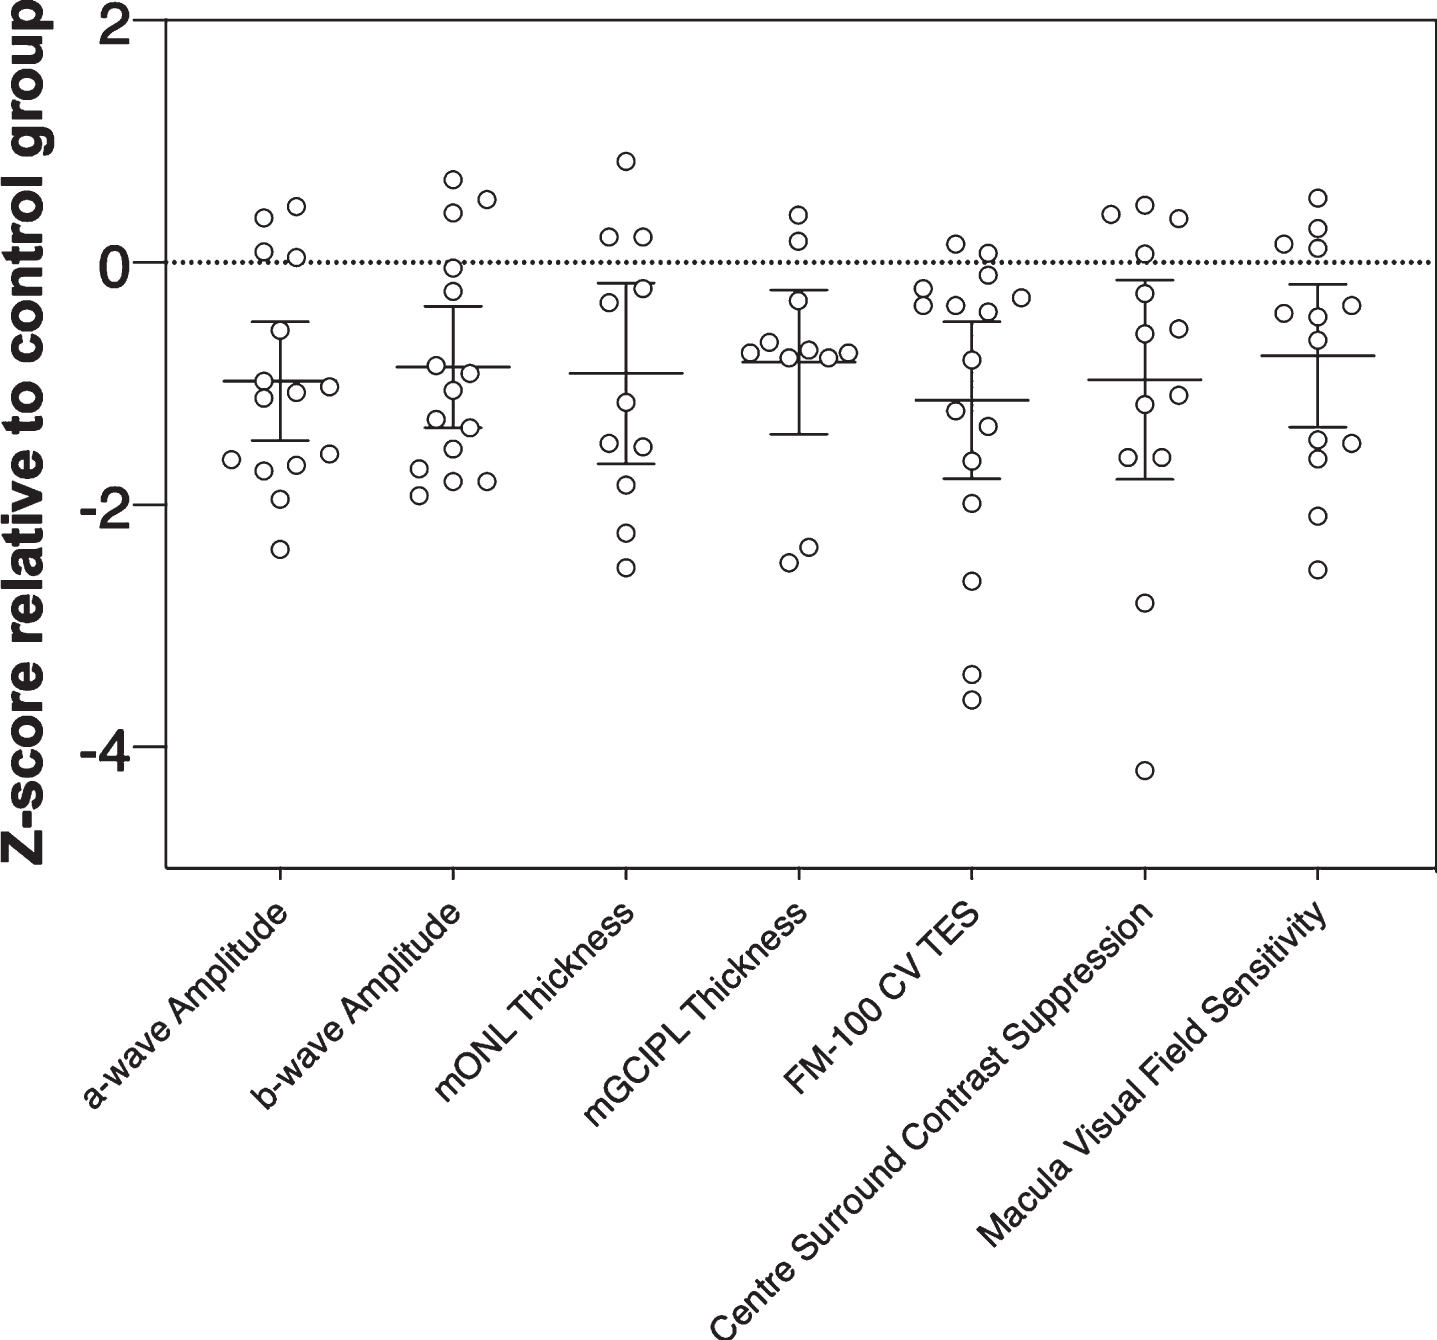
Our z-score analysis (Fig. 7) showed that all visual/retinal parameters for this small PD cohort returned similar effect sizes (F(3.621, 43.45) = 0.20, p = 0.93). Nevertheless, outer retinal metrics of function and structure (e.g., a-wave amplitude and mONL thickness), which return similar z-scores but show less overlap with other neurodegenerative conditions like Alzheimer’s disease and glaucoma would be more useful as PD biomarkers than inner retinal metrics (e.g., mGCIPL or mGCC thickness) [84]. Studies with larger cohorts will help elucidate the relative strength and sensitivity/specificity of outer retinal/visual biomarkers in PD detection for example in high-risk populations and in differentiating diverse patient cohorts and disease stages from healthy ageing. Considering that there is evidence to suggest visual changes in PD can precede motor deficits years before symptom onset [15, 16], the current findings lay the foundation for future studies to investigate if these specific changes occur in identified prodromal populations such as patients living with rapid eye movement (REM) sleep behavior disorder [85–87].
Fig. 7
Magnitude of inter-group effects across different key parameters in Parkinson’s disease participants. Z-scores were calculated relative to the control group using pooled standard deviation across both groups. Negative z-scores indicate Parkinson’s disease participants had smaller ERG amplitudes (a-wave, b-wave), thinner retinal layer thickness (mONL, mGCIPL), poorer color vision (CV, FM-100 test error score, TES), weaker center surround perceptual contrast suppression and reduced macular visual field sensitivity relative to the control group mean. Error bars are the 95% confidence limits of the mean.
Due to consideration for subject comfort and time constraints, we were unable to assess the effect of intraday L-DOPA treatment on visual performance outcome measures in this study. Given dopaminergic neuromodulatory effects on retinal function [31, 39, 41], further investigations under complete (i.e., overnight experiment design targeting OFF and ON L-DOPA status) and/or partial washout conditions are warranted. Limitations exist in uniformity of partial wash-out conditions given the range of L-DOPA medications that PD participants receive (see individual participant data within dataset). However, this replicates a real-world scenario of assessing retinal function and structure within an intraday L-DOPA dosing in a group of participants with levodopa equivalent daily dose of 485±47 mg. Further studies are required to determine whether this is the case at differing stages of PD severity. It would also be important to keep in mind the potential for L-DOPA related improvement in motor/manual dexterity to influence visual performance measurements undertaken with subjective testing.
Conclusions
In summary, this study characterizes the changes in visual performance and retinal structure and function in the same people with PD compared to healthy age-matched controls. We show that people living with PD show altered color vision, weaker contrast perception inhibition, outer retinal thinning and decreased retinal function and macular sensitivity. We also show that intraday doses of L-DOPA do not affect retinal outcome measures as assessed by optical coherence tomography and electroretinography. Considering the similarity in effect size between outer and inner retinal metrics, the former may be better suited for differentiating PD as outer retinal changes show less overlap with other age-related neurodegenerative conditions. Thus, targeting measures of outer retinal structure and function may be of significant value in Parkinson’s disease.
ACKNOWLEDGMENTS
The authors would like to thank the participants who generously volunteered their time to take part in this study and Fight Parkinson’s (https://www.fightparkinsons.org.au/) for their involvement in advertising and recruiting subjects for this study.
FUNDING
This research was funded by Australian Research Council Linkage grants (LP160100126), as well as funding through Melbourne Neuroscience Institute Interdisciplinary Seed Fund, Melbourne Research Fellowship, Melbourne Neuroscience Institute Fellowship, Melbourne School of Health Sciences Seed Funding and John Landman PhD Scholarship.
CONFLICT OF INTEREST
CN and BB are joint investigators on an Australian Research Council Linkage grant LP160100126 with AstraZeneca Neuroscience and Biogen Inc. AM has received research funding support from Heidelberg Engineering (GmBH) who manufacture the Spectralis OCT. No conflicts of interest, financial or otherwise, are declared by the other authors.
DATA AVAILABILITY
The authors confirm that adherence to data availability policies including making materials, data, and associated protocols promptly available to readers without undue qualifications in material transfer agreements. The complete dataset of this study can be found here: https://doi.org/10.26188/24138420.v1.
REFERENCES
[1] | Bloem BR , Okun MS , Klein C ((2021) ) Parkinson’s disease. Lancet 397: , 2284–2303. |
[2] | Prasad EM , Hung S-Y ((2021) ) Current therapies in clinical trials of Parkinson’s disease: a 2021 update. Pharmaceuticals (Basel) 14: , 717. |
[3] | Tolosa E , Garrido A , Scholz SW , Poewe W ((2021) ) Challenges in the diagnosis of Parkinson’s disease. Lancet Neurol 20: , 385–397. |
[4] | Adler CH , Beach TG , Hentz JG , Shill HA , Caviness JN , Driver-Dunckley E , Sabbagh MN , Sue LI , Jacobson SA , Belden CM , Dugger BN ((2014) ) Low clinical diagnostic accuracy of early vs advanced Parkinson disease: clinicopathologic study. Neurology 83: , 406–412. |
[5] | Reichmann H ((2010) ) Clinical criteria for the diagnosis of Parkinson’s disease. Neurodegener Dis 7: , 284–290. |
[6] | Postuma RB , Berg D , Stern M , Poewe W , Olanow CW , Oertel W , Obeso J , Marek K , Litvan I , Lang AE , Halliday G , Goetz CG , Gasser T , Dubois B , Chan P , Bloem BR , Adler CH , Deuschl G ((2015) ) MDS clinical diagnostic criteria for Parkinson’s disease. Mov Disord 30: , 1591–1601. |
[7] | Lane EL ((2019) ) L-DOPA for Parkinson’s disease-a bittersweet pill. Eur J Neurosci 49: , 384–398. |
[8] | Brooks DJ ((2000) ) Dopamine agonists: their role in the treatment of Parkinson’s disease. J Neurol Neurosurg Psychiatry 68: , 685–689. |
[9] | Armstrong MJ , Okun MS ((2020) ) Diagnosis and treatment of Parkinson disease: a review. JAMA 323: , 548–560. |
[10] | Fanciulli A , Wenning GK ((2021) ) Autonomic failure: a neglected presentation of Parkinson’s disease. Lancet Neurol 20: , 781–782. |
[11] | Sharabi Y , Vatine GD , Ashkenazi A ((2021) ) Parkinson’s disease outside the brain: targeting the autonomic nervous system. Lancet Neurol 20: , 868–876 . |
[12] | Doty RL ((2012) ) Olfactory dysfunction in Parkinson disease. Nat Rev Neurol 8: , 329–339. |
[13] | Haehner A , Hummel T , Hummel C , Sommer U , Junghanns S , Reichmann H ((2007) ) Olfactory loss may be a first sign of idiopathic Parkinson’s disease. Mov Disord 22: , 839–842. |
[14] | Nowacka B , Lubiński W , Honczarenko K , Potemkowski A , Safranow K ((2014) ) Ophthalmological features of Parkinson disease. Med Sci Monit 20: , 2243–2249. |
[15] | Armstrong RA ((2008) ) Visual signs and symptoms of Parkinson’s disease. Clin Exp Optom 91: , 129–138. |
[16] | Weil RS , Schrag AE , Warren JD , Crutch SJ , Lees AJ , Morris HR ((2016) ) Visual dysfunction in Parkinson’s disease. Brain 139: , 2827–2843. |
[17] | Postuma RB , Berg D ((2016) ) Advances in markers of prodromal Parkinson disease. Nat Rev Neurol 12: , 622–634. |
[18] | Guidoboni G , Sacco R , Szopos M , Sala L , Verticchio Vercellin AC , Siesky B , Harris A ((2020) ) Neurodegenerative disorders of the eye and of the brain: a perspective on their fluid-dynamical connections and the potential of mechanism-driven modeling. Front Neurosci 14: , 566428. |
[19] | Nguyen CTO , Acosta ML , Di Angelantonio S , Salt TE ((2021) ) Editorial: Seeing beyond the eye: the brain connection. Front Neurosci 15: , 719717. |
[20] | Sinn R , Wittbrodt J ((2013) ) An eye on eye development. Mech Dev 130: , 347–358. |
[21] | Davidsdottir S , Cronin-Golomb A , Lee A ((2005) ) Visual and spatial symptoms in Parkinson’s disease. Vision Res 45: , 1285–1296. |
[22] | Regan BC , Freudenthaler N , Kolle R , Mollon JD , Paulus W ((1998) ) Colour discrimination thresholds in Parkinson’s disease: results obtained with a rapid computer-controlled colour vision test. Vision Res 38: , 3427–3431. |
[23] | Oh Y-S , Kim J-S , Chung S-W , Song I-U , Kim Y-D , Kim Y-I , Lee K-S ((2011) ) Color vision in Parkinson’s disease and essential tremor. Eur J Neurol 18: , 577–583. |
[24] | Büttner T , Kuhn W , Müller T , Patzold T , Heidbrink K , Przuntek H ((1995) ) Distorted color discrimination in “de novo” parkinsonian patients. Neurology 45: , 386–387. |
[25] | Müller T , Kuhn W , Büttner T , Przuntek H ((1999) ) Colour vision abnormalities and movement time in Parkinson’s disease. Eur J Neurol 6: , 711–715. |
[26] | Bulens C , Meerwaldt JD , van der Wildt GJ , Keemink CJ ((1986) ) Contrast sensitivity in Parkinson’s disease. Neurology 36: , 1121–1125. |
[27] | Mestre D , Blin O , Serratrice G , Pailhous J ((1990) ) Spatiotemporal contrast sensitivity differs in normal aging and Parkinson’s disease. Neurology 40: , 1710–1714. |
[28] | Bodis-Wollner I ((2009) ) Retinopathy in Parkinson disease. J Neural Transm (Vienna) 116: , 1493–1501. |
[29] | Bodis-Wollner I , Miri S , Glazman S ((2014) ) Venturing into the no-man’s land of the retina in Parkinson’s disease. Mov Disord 29: , 15–22. |
[30] | Archibald NK , Clarke MP , Mosimann UP , Burn DJ ((2009) ) The retina in Parkinson’s disease. Brain 132: , 1128–1145. |
[31] | Witkovsky P ((2004) ) Dopamine and retinal function. Doc Ophthalmol 108: , 17–40. |
[32] | Indrieri A , Pizzarelli R , Franco B , De Leonibus E ((2020) ) Dopamine, alpha-synuclein, and mitochondrial dysfunctions in parkinsonian eyes. Front Neurosci 14: , 567129. |
[33] | McMahon DG , Iuvone PM , Tosini G ((2014) ) Circadian organization of the mammalian retina: from gene regulation to physiology and diseases. Prog Retin Eye Res 39: , 58–76. |
[34] | Urwyler P , Nef T , Killen A , Collerton D , Thomas A , Burn D , McKeith I , Mosimann UP ((2014) ) Visual complaints and visual hallucinations in Parkinson’s disease. Parkinsonism Relat Disord 20: , 318–322. |
[35] | Nguyen CTO , Hui F , Charng J , Velaedan S , van Koeverden AK , Lim JKH , He Z , Wong VHY , Vingrys AJ , Bui BV , Ivarsson M ((2017) ) Retinal biomarkers provide “insight” into cortical pharmacology and disease. Pharmacol Ther 175: , 151–177. |
[36] | Huang L , Wang C , Wang W , Wang Y , Zhang R ((2021) ) The specific pattern of retinal nerve fiber layer thinning in Parkinson’s disease: a systematic review and meta-analysis. J Neurol 268: , 4023–4032. |
[37] | Huang L , Zhang D , Ji J , Wang Y , Zhang R ((2021) ) Central retina changes in Parkinson’s disease: a systematic review and meta-analysis. J Neurol 268: , 4646–4654. |
[38] | Zhou W-C , Tao J-X , Li J ((2021) ) Optical coherence tomography measurements as potential imaging biomarkers for Parkinson’s disease: A systematic review and meta-analysis. Eur J Neurol 28: , 763–774. |
[39] | Ellis C , Allen T , Marsden C , Ikeda H ((1987) ) Electroretinographic abnormalities in idiopathic Parkinson’s disease and the effect of levodopa administration. Clin Vis Sci 1: , 347–355. |
[40] | Gottlob I , Schneider E , Heider W , Skrandies W ((1987) ) Alteration of visual evoked potentials and electroretinograms in Parkinson’s disease. Electroencephalogr Clin Neurophysiol 66: , 349–357. |
[41] | Jaffe MJ , Bruno G , Campbell G , Lavine RA , Karson CN , Weinberger DR ((1987) ) Ganzfeld electroretinographic findings in parkinsonism: untreated patients and the effect of levodopa intravenous infusion. J Neurol Neurosurg Psychiatry 50: , 847–852. |
[42] | Peppe A , Stanzione P , Pierelli F , De Angelis D , Pierantozzi M , Bernardi G ((1995) ) Visual alterations in de novo Parkinson’s disease: pattern electroretinogram latencies are more delayed and more reversible by levodopa than are visual evoked potentials. Neurology 45: , 1144–1148. |
[43] | Martin XD ((1992) ) Normal intraocular pressure in man. Ophthalmologica 205: , 57–63. |
[44] | Turpin A , Lawson DJ , McKendrick AM ((2014) ) PsyPad: a platform for visual psychophysics on the iPad. J Vis 14: , 16. |
[45] | McKendrick AM , Chan YM , Vingrys AJ , Turpin A , Badcock DR ((2018) ) Daily vision testing can expose the prodromal phase of migraine. Cephalalgia 38: , 1575–1584. |
[46] | Adams M , Ho CYD , Baglin E , Sharangan P , Wu Z , Lawson DJ , Luu CD , Turpin A , McKendrick AM , Guymer RH ((2018) ) Home monitoring of retinal sensitivity on a tablet device in intermediate age-related macular degeneration. Transl Vis Sci Technol 7: , 32. |
[47] | Wood JM , Wild JM , Bullimore MA , Gilmartin B ((1988) ) Factors affecting the normal perimetric profile derived by automated static threshold LED perimetry. I. Pupil size. Ophthalmic Physiol Opt 8: , 26–31. |
[48] | Farnsworth D ((1943) ) The Farnsworth-Munsell 100-Hue and Dichotomous Tests for color vision. J Opt Soc Am 33: , 568–578. |
[49] | Lakowski R ((1969) ) Theory and practice of colour vision testing: a review: 2. Br J Ind Med 26: , 265–288. |
[50] | Verriest G , Van Laethem J , Uvijls A ((1982) ) A new assessment of the normal ranges of the Farnsworth-Munsell 100-hue test scores. Am J Ophthalmol 93: , 635–642. |
[51] | Kinnear PR , Sahraie A ((2002) ) New Farnsworth-Munsell 100 hue test norms of normal observers for each year of age 5-22 and for age decades 30-70. Br J Ophthalmol 86: , 1408–1411. |
[52] | Zahiruddin K , Banu S , Dharmarajan R , Kulothungan V , Vijayan D , Raman R , Sharma T ((2010) ) Effect of illumination on colour vision testing with Farnsworth-Munsell 100 Hue Test: customized colour vision booth versus room illumination. Korean J Ophthalmol 24: , 159–162. |
[53] | Laeng B , Brennen T , Elden A , Gaare Paulsen H , Banerjee A , Lipton R ((2007) ) Latitude-of-birth and season-of-birth effects on human color vision in the Arctic. Vision Res 47: , 1595–1607. |
[54] | McCulloch DL , Marmor MF , Brigell MG , Hamilton R , Holder GE , Tzekov R , Bach M ((2015) ) ISCEV Standard for full-field clinical electroretinography (2015 update). Doc Ophthalmol 130: , 1–12. |
[55] | Chubb C , Sperling G , Solomon JA ((1989) ) Texture interactions determine perceived contrast. Proc Natl Acad Sci U S A 86: , 9631–9635. |
[56] | Silva MF , Faria P , Regateiro FS , Forjaz V , Januário C , Freire A , Castelo-Branco M ((2005) ) Independent patterns of damage within magno-, parvo- and koniocellular pathways in Parkinson’s disease. Brain 128: , 2260–2271. |
[57] | Haug BA , Kolle RU , Trenkwalder C , Oertel WH , Paulus W ((1995) ) Predominant affection of the blue cone pathway in Parkinson’s disease. Brain 118 (Pt 3): , 771–778. |
[58] | Weil RS , Schwarzkopf DS , Bahrami B , Fleming SM , Jackson BM , Goch TJC , Saygin AP , Miller LE , Pappa K , Pavisic I , Schade RN , Noyce AJ , Crutch SJ , O’Keeffe AG , Schrag AE , Morris HR ((2018) ) Assessing cognitive dysfunction in Parkinson’s disease: An online tool to detect visuo-perceptual deficits. Mov Disord 33: , 544–553. |
[59] | Vanegas MI , Blangero A , Galvin JE , Di Rocco A , Quartarone A , Ghilardi MF , Kelly SP ((2019) ) Altered dynamics of visual contextual interactions in Parkinson’s disease. NPJ Parkinsons Dis 5: , 13. |
[60] | Flowers KA , Robertson C ((1995) ) Perceptual abnormalities in Parkinson’s disease: top-down or bottom-up processes? Perception 24: , 1201–1221. |
[61] | Polo V , Satue M , Rodrigo MJ , Otin S , Alarcia R , Bambo MP , Fuertes MI , Larrosa JM , Pablo LE , Garcia-Martin E ((2016) ) Visual dysfunction and its correlation with retinal changes in patients with Parkinson’s disease: an observational cross-sectional study. BMJ Open 6: , e009658. |
[62] | Nguyen BN , Ramakrishnan B , Narayanan A , Hussaindeen JR , McKendrick AM ((2023) ) Perceptual center-surround contrast suppression in adolescence. Invest Ophthalmol Vis Sci 64: , 14. |
[63] | Nguyen BN , Chan YM , Bode S , McKendrick AM ((2020) ) Orientation-dependency of perceptual surround suppression and orientation decoding of centre-surround stimuli are preserved with healthy ageing. Vision Res 176: , 72–79. |
[64] | Zenger-Landolt B , Heeger DJ ((2003) ) Response suppression in v1 agrees with psychophysics of surround masking. J Neurosci 23: , 6884–6893. |
[65] | Pitchaimuthu K , Nguyen BN , McKendrick AM ((2017) ) Aging alters intraocular but not interocular foveal center surround contrast suppression. J Vis 17: , 16. |
[66] | Wagner SK , Romero-Bascones D , Cortina-Borja M , Williamson DJ , Struyven RR , Zhou Y , Patel S , Weil RS , Antoniades CA , Topol EJ , Korot E , Foster PJ , Balaskas K , Ayala U , Barrenechea M , Gabilondo I , Schapira AH , Khawaja AP , Patel PJ , Rahi JS , Denniston AK , Petzold A , Keane PA , for UK Biobank Eye & Vision Consortium ((2023) ) Retinal optical coherence tomography features associated with incident and prevalent Parkinson disease. Neurology 101: , e1581–e1593. |
[67] | Roth NM , Saidha S , Zimmermann H , Brandt AU , Isensee J , Benkhellouf-Rutkowska A , Dornauer M , Kühn AA , Müller T , Calabresi PA , Paul F ((2014) ) Photoreceptor layer thinning in idiopathic Parkinson’s disease. Mov Disord 29: , 1163–1170. |
[68] | Müller A-K , Blasberg C , Südmeyer M , Aktas O , Albrecht P ((2014) ) Photoreceptor layer thinning in parkinsonian syndromes. Mov Disord 29: , 1222–1223. |
[69] | Cesareo M , Di Marco E , Giannini C , Di Marino M , Aiello F , Pisani A , Pierantozzi M , Mercuri NB , Nucci C , Mancino R ((2021) ) The retinal posterior pole in early Parkinson’s disease: a fundus perimetry and SD-OCT study. Clin Ophthalmol 15: , 4005–4014. |
[70] | Chorostecki J , Seraji-Bozorgzad N , Shah A , Bao F , Bao G , George E , Gorden V , Caon C , Frohman E , Bhatti MT , Khan O ((2015) ) Characterization of retinal architecture in Parkinson’s disease. J Neurol Sci 355: , 44–48. |
[71] | Unlu M , Gulmez Sevim D , Gultekin M , Karaca C ((2018) ) Correlations among multifocal electroretinography and optical coherence tomography findings in patients with Parkinson’s disease. Neurol Sci 39: , 533–541. |
[72] | Garcia-Martin E , Larrosa JM , Polo V , Satue M , Marques ML , Alarcia R , Seral M , Fuertes I , Otin S , Pablo LE ((2014) ) Distribution of retinal layer atrophy in patients with Parkinson disease and association with disease severity and duration. Am J Ophthalmol 157: , 470–478.e2. |
[73] | Albrecht P , Müller A-K , Südmeyer M , Ferrea S , Ringelstein M , Cohn E , Aktas O , Dietlein T , Lappas A , Foerster A , Hartung H-P , Schnitzler A , Methner A ((2012) ) Optical coherence tomography in parkinsonian syndromes. PLoS One 7: , e34891. |
[74] | Schneider M , Müller H-P , Lauda F , Tumani H , Ludolph AC , Kassubek J , Pinkhardt EH ((2014) ) Retinal single-layer analysis in Parkinsonian syndromes: an optical coherence tomography study. J Neural Transm (Vienna) 121: , 41–47. |
[75] | Di Pippo M , Fragiotta S , Di Staso F , Scuderi L , Abdolrahimzadeh S ((2023) ) The role of alpha-synuclein deposits in Parkinson’s disease: a focus on the human retina. Int J Mol Sci 24: , 4391. |
[76] | Bodis-Wollner I , Kozlowski PB , Glazman S , Miri S ((2014) ) α-synuclein in the inner retina in parkinson disease. Ann Neurol 75: , 964–966. |
[77] | Ortuño-Lizarán I , Beach TG , Serrano GE , Walker DG , Adler CH , Cuenca N ((2018) ) Phosphorylated α-synuclein in the retina is a biomarker of Parkinson’s disease pathology severity. Mov Disord 33: , 1315–1324. |
[78] | Beach TG , Carew J , Serrano G , Adler CH , Shill HA , Sue LI , Sabbagh MN , Akiyama H , Cuenca N , Arizona Parkinson’s Disease Consortium ((2014) ) Phosphorylated α-synuclein-immunoreactive retinal neuronal elements in Parkinson’s disease subjects. Neurosci Lett 571: , 34–38. |
[79] | Zhang Y , Zhang X , Yue Y , Tian T ((2022) ) Retinal degeneration: a window to understand the origin and progression of Parkinson’s disease? Front Neurosci 15: , 799526. |
[80] | Chang K-H , Chen C-M ((2020) ) The role of oxidative stress in Parkinson’s disease. Antioxidants (Basel) 9: , 597. |
[81] | Ortuño-Lizarán I , Sánchez-Sáez X , Lax P , Serrano GE , Beach TG , Adler CH , Cuenca N ((2020) ) Dopaminergic retinal cell loss and visual dysfunction in Parkinson disease. Ann Neurol 88: , 893–906. |
[82] | Netser R , Demmin DL , Dobkin R , Goldstein A , Roché M , Netser Zernik A , Silverstein SM ((2021) ) Flash electroretinography parameters and Parkinson’s disease. J Parkinsons Dis 11: , 251–259. |
[83] | Mello LGM , Paraguay IBB , Andrade T de S , Rocha AA do N , Barbosa ER , Oyamada MK , Monteiro MLR ((2022) ) Electroretinography reveals retinal dysfunction in Parkinson’s disease despite normal high-resolution optical coherence tomography findings. Parkinsonism Relat Disord 101: , 90–95. |
[84] | Doustar J , Torbati T , Black KL , Koronyo Y , Koronyo-Hamaoui M ((2017) ) Optical coherence tomography in Alzheimer’s disease and other neurodegenerative diseases. Front Neurol 8: , 701. |
[85] | Jin H , Zhang J-R , Shen Y , Liu C-F ((2017) ) Clinical significance of REM sleep behavior disorders and other non-motor symptoms of parkinsonism. Neurosci Bull 33: , 576–584. |
[86] | Postuma RB , Lang AE , Massicotte-Marquez J , Montplaisir J ((2006) ) Potential early markers of Parkinson disease in idiopathic REM sleep behavior disorder. Neurology 66: , 845–851. |
[87] | Postuma RB , Iranzo A , Hu M , Högl B , Boeve BF , Manni R , Oertel WH , Arnulf I , Ferini-Strambi L , Puligheddu M , Antelmi E , Cochen De Cock V , Arnaldi D , Mollenhauer B , Videnovic A , Sonka K , Jung K-Y , Kunz D , Dauvilliers Y , Provini F , Lewis SJ , Buskova J , Pavlova M , Heidbreder A , Montplaisir JY , Santamaria J , Barber TR , Stefani A , St Louis EK , Terzaghi M , Janzen A , Leu-Semenescu S , Plazzi G , Nobili F , Sixel-Doering F , Dusek P , Bes F , Cortelli P , Ehgoetz Martens K , Gagnon J-F , Gaig C , Zucconi M , Trenkwalder C , Gan-Or Z , Lo C , Rolinski M , Mahlknecht P , Holzknecht E , Boeve AR , Teigen LN , Toscano G , Mayer G , Morbelli S , Dawson B , Pelletier A ((2019) ) Risk and predictors of dementia and parkinsonism in idiopathic REM sleep behaviour disorder: a multicentre study. Brain 142: , 744–759. |


