
Disease Progression of Data-Driven Subtypes of Parkinson’s Disease: 5-Year Longitudinal Study from the Early Parkinson’s Disease Longitudinal Singapore (PALS) Cohort
Abstract
Background:
The detailed trajectory of data-driven subtypes in Parkinson’s disease (PD) within Asian cohorts remains undisclosed.
Objective:
To evaluate the motor, non-motor symptom (NMS) progression among the data-driven PD clusters.
Methods:
In this 5-year longitudinal study, NMS scale (NMSS), Hospital Anxiety Depression Scale (HADS), and Epworth sleepiness scale (ESS) were carried out annually to monitor NMS progression. H& Y staging scale, MDS-UPDRS part III motor score, and postural instability gait difficulty (PIGD) score were assessed annually to evaluate disease severity and motor progression. Five cognitive standardized scores were used to assess detailed cognitive progression. Linear mixed model was performed to assess the annual progression rates of the longitudinal outcomes.
Results:
Two hundred and six early PD patients, consisting of 43 patients in cluster A, 98 patients in cluster B and 65 subjects in cluster C. Cluster A (severe subtype) had significantly faster progression slope in NMSS Domain 3 (mood/apathy) score (p = 0.01), NMSS Domain 4 (perceptual problems) score (p = 0.02), NMSS Domain 7 (urinary) score (p = 0.03), and ESS Total Score (p = 0.04) than the other two clusters. Cluster A also progressed significantly in PIGD score (p = 0.04). For cognitive outcomes, cluster A deteriorated significantly in visuospatial domain (p = 0.002), while cluster C (mild subtype) deteriorated significantly in executive domain (p = 0.04).
Conclusions:
The severe cluster had significantly faster progression, particularly in mood and perceptual NMS domains, visuospatial cognitive performances, and postural instability gait scores. Our findings will be helpful for clinicians to stratify and pre-emptively manage PD patients by developing intervention strategies to counter the progression of these domains.
INTRODUCTION
Parkinson’s disease (PD) is a heterogeneous multisystem neurodegenerative disorder presenting remarkable variations in subtype and prognosis. The key features of PD are tremor, rigidity, bradykinesia, and postural instability and gait disorder. Various non-motor symptoms (NMS) are being recognized increasingly [1, 2]. PD subtype investigation has been prioritized to one of the top three areas in PD clinical research [3].
Data-driven subtyping could categorize the disease phenotype in a less biased way by taking into account multidimensional variables. Numerous clinical assessments such as motor and NMS features were most often selected for data-driven subtyping [4, 5]. It could be more accurate for data-driven subtyping if biological markers were also incorporated, as biological markers provide more objective information compared to clinical variables. We previously identified three data-driven PD clusters by including clinical assessments and genetic risk scores. The PD clusters were found to have marked differences in clinical features and blood-based biomarkers [6].
Data-driven PD subtypes were found to have distinct prognosis before. A study delineated three PD clusters and found that diffuse malignant cluster had a more rapid motor, cognitive progression, and greater decline in the global composite outcome [4, 7]. Another study identified four clusters from two UK cohorts and found that cluster with symmetrical motor signs, poor olfaction, cognition, and postural hypotension demonstrated fast motor progression [8]. However, these studies did not provide detailed assessments of NMS and cognitive progression in their data-driven PD subtypes, which would be useful to holistically understand the disease course and guide PD management. In addition, the progression profile of data-driven subtypes in Asian cohort remains unknown.
In the current 5-year longitudinal study, the comprehensive progression profile from the perspective of non-motor, motor and cognitive domains were evaluated among the data-driven PD clusters that was published previously [6]. The primary aim of the study was to examine the NMS overall progression as assessed by NMSS total score. The secondary aim was to explore NMSS domain scores, motor, and cognition progression.
METHODS
Study population
In this prospective study, 206 PD patients were enrolled from the Early Parkinson’s disease Longitudinal Singapore (PALS) cohort according to the inclusion and exclusion criteria [9] in which all the PD patients were recruited within 1 year of diagnosis. The current study was conducted in two movement disorder outpatient clinics in Singapore. All the subjects have provided the written informed consent. They were followed up annually and the final visit was up to 5 years. The study has been approved by SingHealth Centralized Institutional Review Board (CIRB) with Ref 2019/2433.
Data collection
Comprehensive progression profiles of PD clusters including NMS, motor, and cognitive domains were evaluated prospectively. The clinical assessments were collected during patients’ on period. Demographic data were attained from all subjects as well. Levodopa-equivalent daily dose (LEDD) was calculated by Standardized formula [10].
Non-motor symptom scale (NMSS) was used to evaluated the overall NMS burden [11], which contains nine domains (cardiovascular domain, sleep/fatigue, mood/apathy, perceptual problems/halluci-nations, attention/memory, gastrointestinal, urinary, sexual function and miscellaneous). In addition, Hospital Anxiety Depression Scale (HADS) and Epworth sleepiness scale (ESS) were used to evaluate mood and daytime sleepiness.
Movement Disorder Society-Unified Parkinson’s Disease Rating Scale (MDS-UPDRS) part III motor score, postural instability gait difficulty (PIGD) score, tremor score and Modified Hoehn and Yahr (H& Y) staging scale were used to examine motor progression and disease severity [12]. Cognitive progression was assessed from 5 cognitive domains (executive, visuospatial, memory, working & attention, language). Specifically, Frontal Assessment Battery (FAB) [13] total score and Fruit Fluency were used in Executive domain; Repeatable Battery for the Assessment of Neuropsychological Status (RBANS) [14] judgment of Line Orientation and Rey-Osterrieth Complex Figure Test (ROCF) [15] copy total score were performed to evaluate visuospatial domain; Alzheimer Disease Assessment Scale (ADAS)-cog delayed recall score and ROCF delayed recall total score for memory domain; Digit Span Backward and Symbol Span total score for Attention and working memory domain; Boston Naming Test (BNT) total score and Wechsler Adult Intelligence Scale-Fourth Edition (WAIS-IV)-Similarities for Language domain. The cognitive domain scores were calculated by using the average of the standardized score (Z-score) of two neuropsychological tests within the same domain [16, 17].
Statistical analysis
The process of deriving of data-driven PD clusters was conducted using Python Software version 3. Seventeen variables, including Age of diagnosis, Polygenic Risk Score, Number of patients having significant blood pressure (BP) drop, MDS-UPDRS Part II score, MDS-UPDRS Part III score, tremor score, PIGD score, MDS-UPDRS Part I score, ESS Total Score, HADS Anxiety Total score, HADS Depression Total score, The REM Sleep Behavior Disorder Single-Question Screen (RBD1Q), five cognitive domain scores (Memory, Visuospatial, Attention, Language, and Executive), were selected based on expert opinion and contemporary evidence [7]. All variable measurements were standardized using Z-scores for the cluster analysis. Agglomerative hierarchical clustering with Euclidean distance calculation was employed. We opted for the three-cluster solution due to a more balanced data distribution and enhanced clinical interpretation.
SAS OnDemand for Academics (SAS Institute Inc. 2014. SAS® OnDemand for Academics: User’s Guide. Cary, NC) was used for data processing and statistical analysis. Continuous variables were described by mean and standard deviation (SD) or median with first and third quartile, where appropriate. Categorical variables were summarized using frequencies and percentages. One-way analysis of variance (ANOVA) or Kruskal-Wallis test (depending on normality assumption) was performed to compare continuous variables among different clusters, while Fisher’s exact test or Pearson Chi square test (where appropriate) was carried out to compare the categorical variables among different clusters. Normality assumption was evaluated using Q-Q plots (visual inspection), no major deviation from normality assumption was observed.
Linear mixed model adjusting for potential confounders (age, sex, education years) was used to examine the trend of longitudinal outcomes from baseline to follow-up visits (where visit-year, i.e., 1,2, 3, …, was included as time-axis) among PD clusters. The disease progression slopes among PD clusters were estimated via random intercept and slope model with un-structured covariance matrix and residual pseudo likelihood estimation method. Normality assumption was assessed visually via quantile-quantile (QQ) plot on the standardized residuals. The disease progression slopes, evaluated by the interaction term of cluster x time, were reported as adjusted beta coefficient and 95% confidence intervals. All secondary outcomes in the study are exploratory with no prior hierarchical difference. Significance level was set at p < 0.05.
RESULTS
Demographic and clinical features of patients
In total, 206 PD patients were included, comprising of 43 patients in cluster A (severe subtype in motor, NMS, and cognition), 98 patients in cluster B (cognitive impairment dominant subtype with mild NMS), and 65 subjects in cluster C (mild subtype and young age of onset). All participants were assessed prospectively over a 5-year period. At baseline, there were no significant differences in the ethnicity, sex among the three clusters (Table 1). The patient dropout during follow-up visits is shown in Supplementary Table 1.
Table 1
Patients’ demographic features at baseline
| Baseline demographics | Cluster A | Cluster B | Cluster C | †p |
| severe cluster | intermediate | mild cluster | ||
| n=43 | n=98 | n=65 | ||
| Sex: male | 29(67%) | 56 (57%) | 37 (57%) | 0.46 |
| Age of diagnosis (y) | 69.6±7.9 | 63.6±7.4 | 59.4±9.7 | <0.001* |
| LEDD at baseline | 205.5±103.5 | 211.3±142.3 | 162.5±147.8 | 0.089 |
| LEDD at year 5 | 450.4±124.7 | 435.9±136.7 | 408.6±103.8 | 0.173 |
| BMI (kg/m2) | 23.83±3.37 | 23.36±3.26 | 22.36±3.10 | 0.440 |
| DM (%) | 12 (28%) | 15 (15%) | 8 (12%) | 0.10 |
| Gout (%) | 2 (5%) | 3 (3%) | 3 (5%) | 0.72 |
| DM medication (%) | 11 (26%) | 15 (15%) | 8 (12%) | 0.18 |
LEDD, levodopa equivalent daily dose; BMI, body mass index; DM, diabetes mellitus. Continuous variables were described by mean and standard deviation (SD); Categorical variables reported as frequency (%). †One-way analysis of variance (ANOVA) was performed to compare continuous variables among different clusters, while Chi-square or Fisher exact test (where appropriate) for categorical variables.
Longitudinal progression of motor, NMS, and cognitive functions
Primary outcome (NMSS total score): The NMS overall progression was our primary aim of the study. We found that cluster A (severe cluster) exhibited faster progression rate in NMSS total score compared to the other two clusters although the difference did not attain statistical significance (cluster A B C: 6.77, 2.85, 2.02, p = 0.18) (Table 2, Fig. 1).
Table 2
Comparison of non-motor progression rates among different clusters
| Longitudinal outcomes | Slope estimate (95% CI) | †p | ||
| Cluster A | Cluster B | Cluster C | ||
| NMSS total score | 6.77 (4.34, 10.69) | 2.85 (1.21, 4.43) | 2.02 (–0.4, 2.95) | 0.18 |
| NMSSD1 score (cardiovascular) | –0.05 (–0.39, 0.31) | 0.13 (–0.07, 0.3) | 0.15 (–0.07, 0.33) | 0.73 |
| NMSSD2 score (sleep/fatigue) | 0.77 (–0.22, 1.56) | 0.59 (0.12, 1.04) | 0.57 (0.09, 1.07) | 0.99 |
| NMSSD3 score (mood/apathy) | 3.63 (1.64, 3.76) | 0.67 (–0.11, 0.96) | 0.68 (–0.11, 1.02) | 0.01* |
| NMSSD4 score (perceptual problems) | 0.57 (0.41, 1.12) | 0.08 (–0.13, 0.3) | –0.12 (–0.32, 0.15) | 0.02* |
| NMSSD5 score (attention/memory) | – 0.12 (–0.7, 0.47) | 0.1 (–0.2, 0.4) | 0.01 (–0.31, 0.33) | 0.78 |
| NMSSD6 score (gastrointestinal) | 1.38 (0.67, 2.05) | 0.48 (0.12, 0.83) | 0.47 (0.09, 0.86) | 0.06 |
| NMSSD7 score (urinary) | 0.51 (–0.46, 1.92) | 1.10 (0.45, 1.67) | –0.27 (–0.95, 0.34) | 0.03* |
| NMSSD8 score (sexual function) | –0.06 (–0.57, 0.44) | –0.08 (–0.35, 0.19) | –0.32 (–0.61, –0.03) | 0.44 |
| NMSSD9 score (miscellaneous) | 1.25 (0.41, 2.08) | 0.22 (–0.21, 0.66) | 0.28 (–0.18, 0.75) | 0.09 |
| HADS anxiety total | 0.70 (0.28, 1.05) | 0.15 (–0.05, 0.35) | 0.06 (–0.16, 0.26) | 0.06 |
| HADS depression total | 0.62 (0.2, 1.03) | 0.38 (0.17, 0.59) | 0.27 (0.05, 0.5) | 0.35 |
| ESS total score | –0.54 (–1.12, 0.07) | 0.05 (–0.28, 0.33) | 0.36 (0.03, 0.67) | 0.04* |
NMSS, Non-motor symptom scale; HADS, Hospital Anxiety Depression Scale; ESS, Epworth sleepiness scale. † Longitudinal linear mixed model was performed to compare the progression slopes of non-motor outcomes among three PD clusters; Analysis has been adjusted for age of diagnosis, sex, and education year.
Fig. 1
Progression of non-motor functions among PD clusters. NMSS, non-motor symptom scale; NMSS domain 3 (mood/apathy); NMSS domain 4 (perceptual problems); NMSS domain 7 (urinary); HADS, Hospital Anxiety Depression Scale; ESS, Epworth sleepiness scale. Longitudinal linear mixed model was performed to compare the progression slopes of non-motor outcomes among three PD clusters; Analysis has been adjusted for age of diagnosis, sex, and education year. (i) Progression rate in NMSS total score in cluster A B C were 6.77, 2.85, 2.02, p = 0.18; (ii) Progression rate in NMSS Domain 3(mood/apathy) score in cluster A B C were 3.63, 0.67, 0.68, p = 0.01; (iii) Progression rate in NMSS Domain 4(perceptual problems /hallucinations) score in cluster A B C were 0.57, 0.08, –0.12, p = 0.02; (iv) Progression rate in NMSS Domain 7 (urinary) score in cluster A B C were 0.51, 1.10, –0.27, p = 0.03; (v) Progression rate in HADS Anxiety Total score in cluster A B C were 0.70, 0.15, 0.06, p = 0.06; (vi) Progression rate in ESS Total Score in cluster A B C were – 0.54, 0.05, 0.36,p = 0.04.
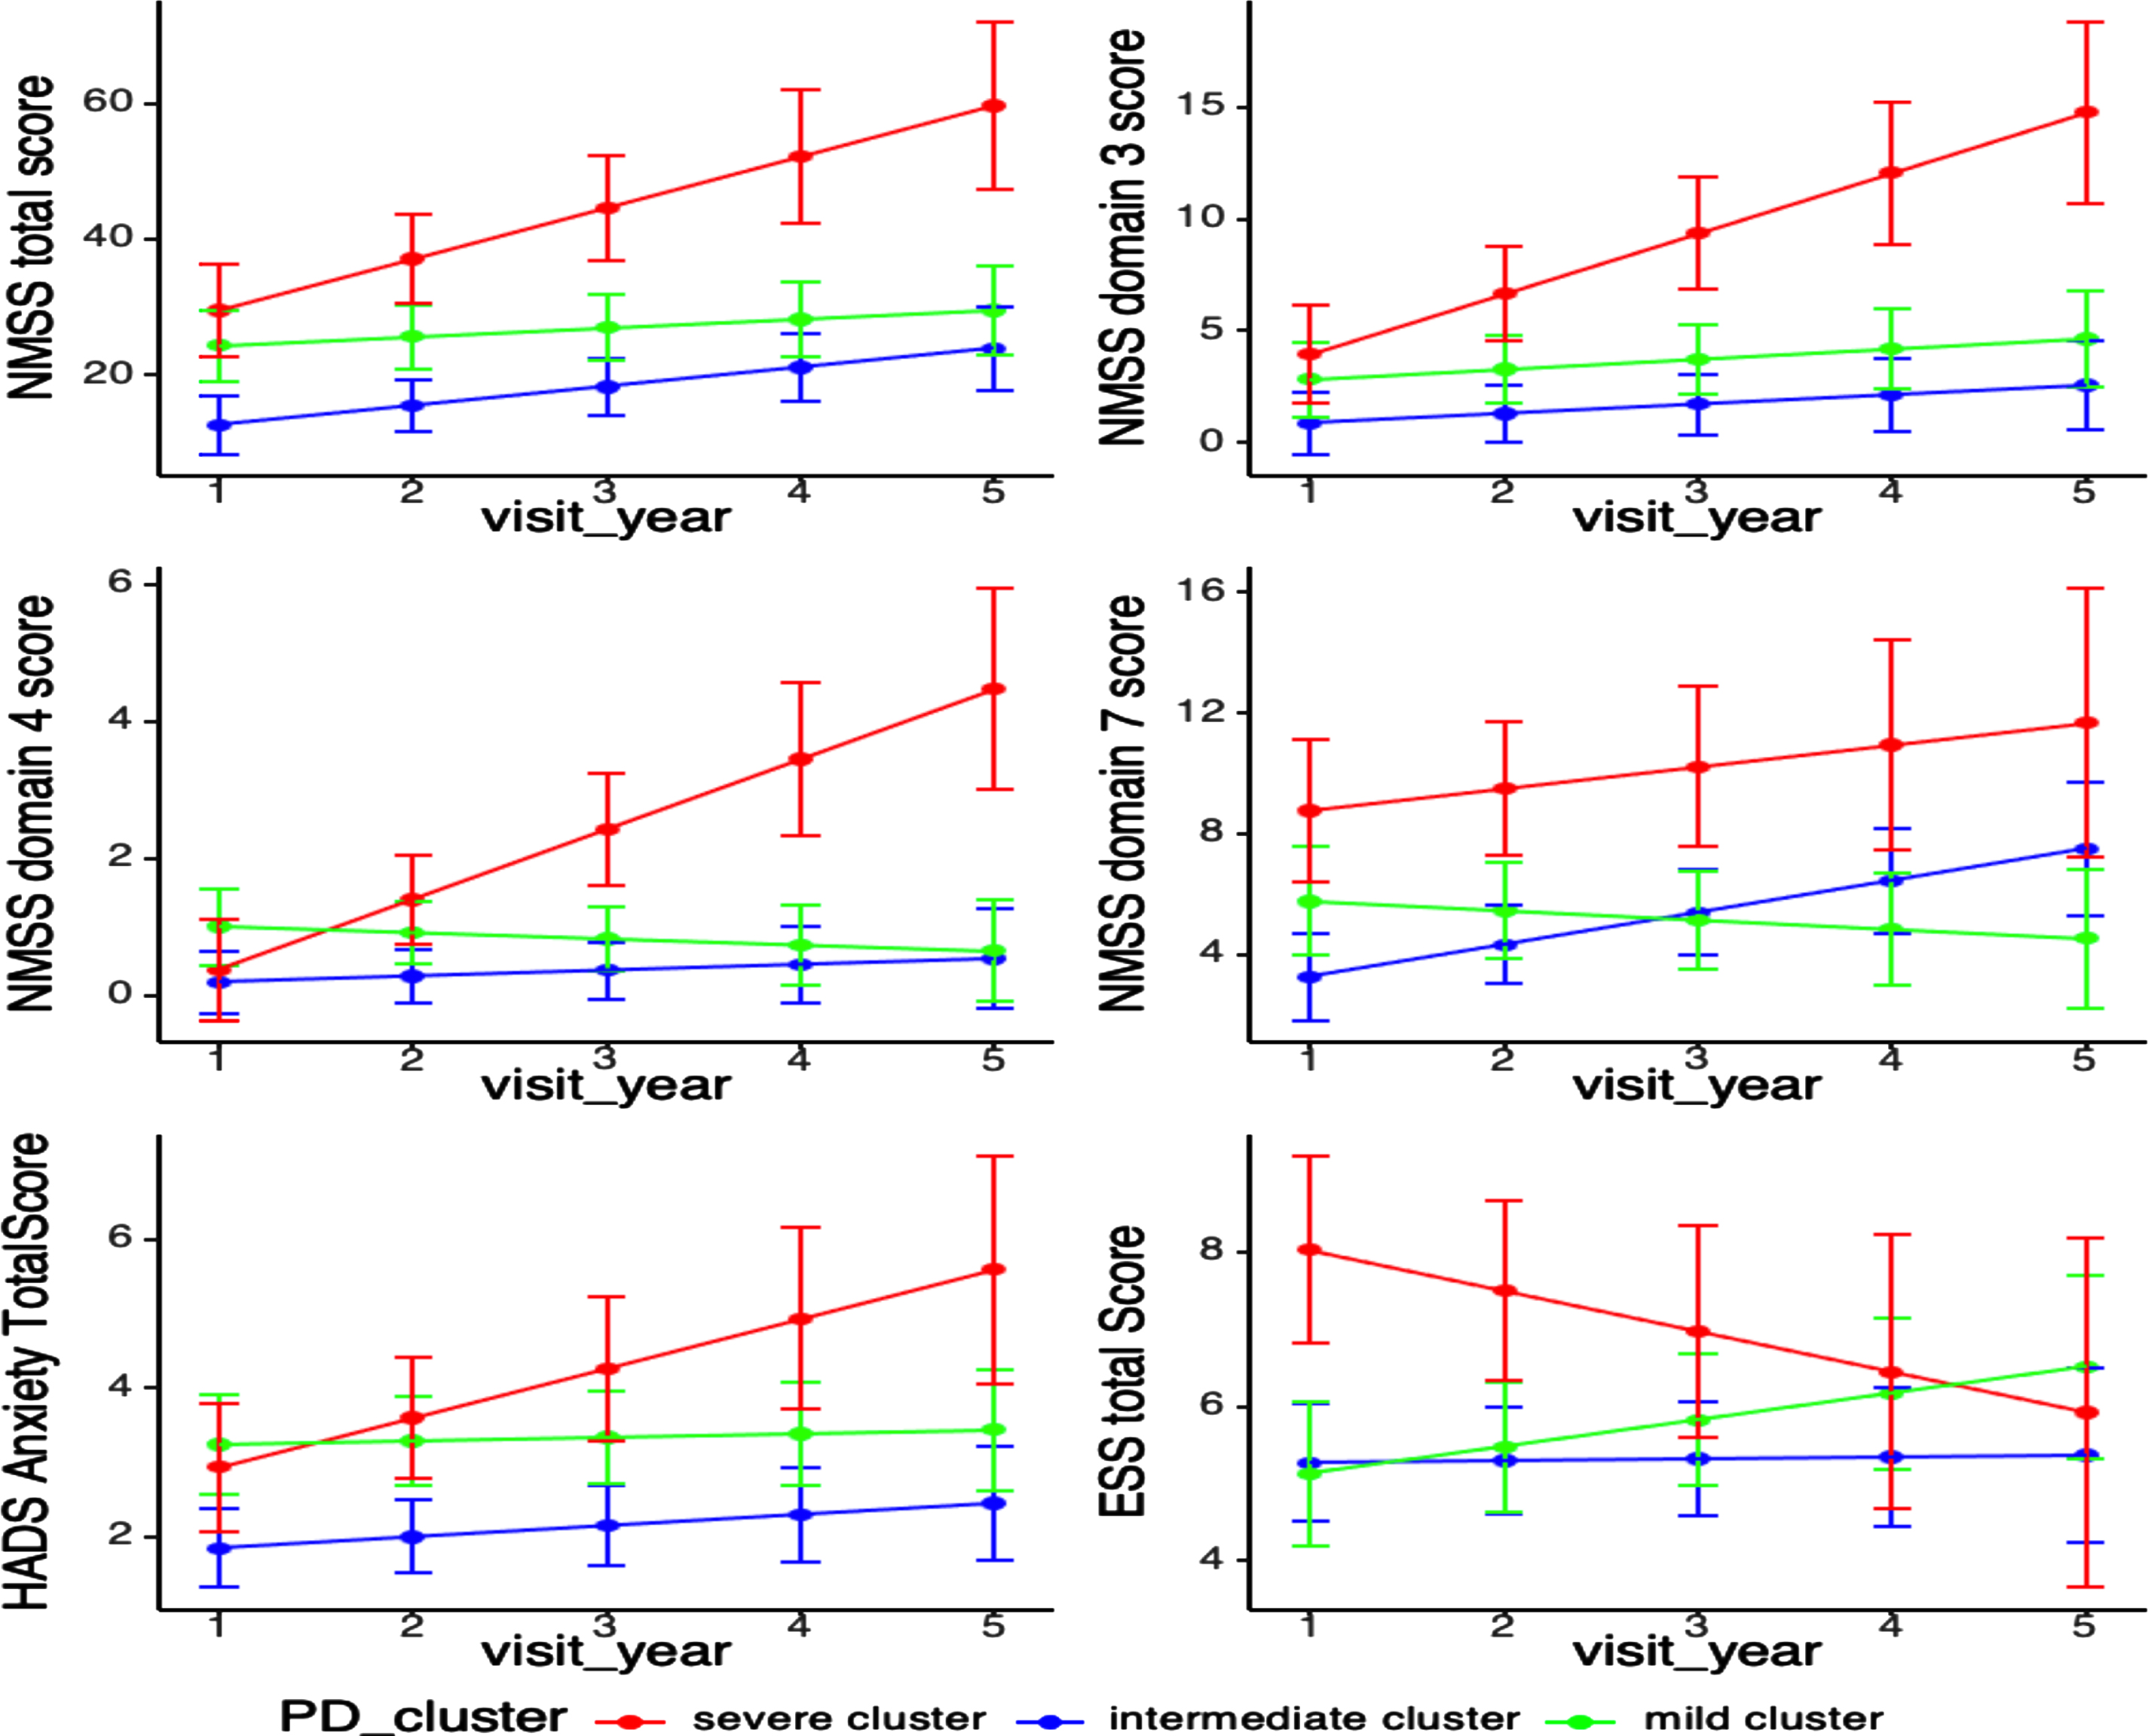
Secondary outcome (NMSS domains, motor, cognition scores): As for NMS progression, cluster A (severe cluster) deteriorated significantly in NMSS Domain 3 (mood/apathy) score (cluster A B C: 3.63, 0.67, 0.68, p = 0.01), NMSS Domain 4 (perceptual problems) score (cluster A B C: 0.57, 0.08, –0.12, p = 0.02), and significantly decreased in Epworth sleepiness scale (ESS) Total Score (cluster A B C: –0.54, 0.05, 0.36, p = 0.04) after adjusting for age of diagnosis, sex and education years. Cluster C (mild cluster) progressed significantly slower in NMSS Domain 7 (urinary) score (cluster A B C: 0.51, 1.10, –0.27, p = 0.03) (Table 2, Fig. 1).
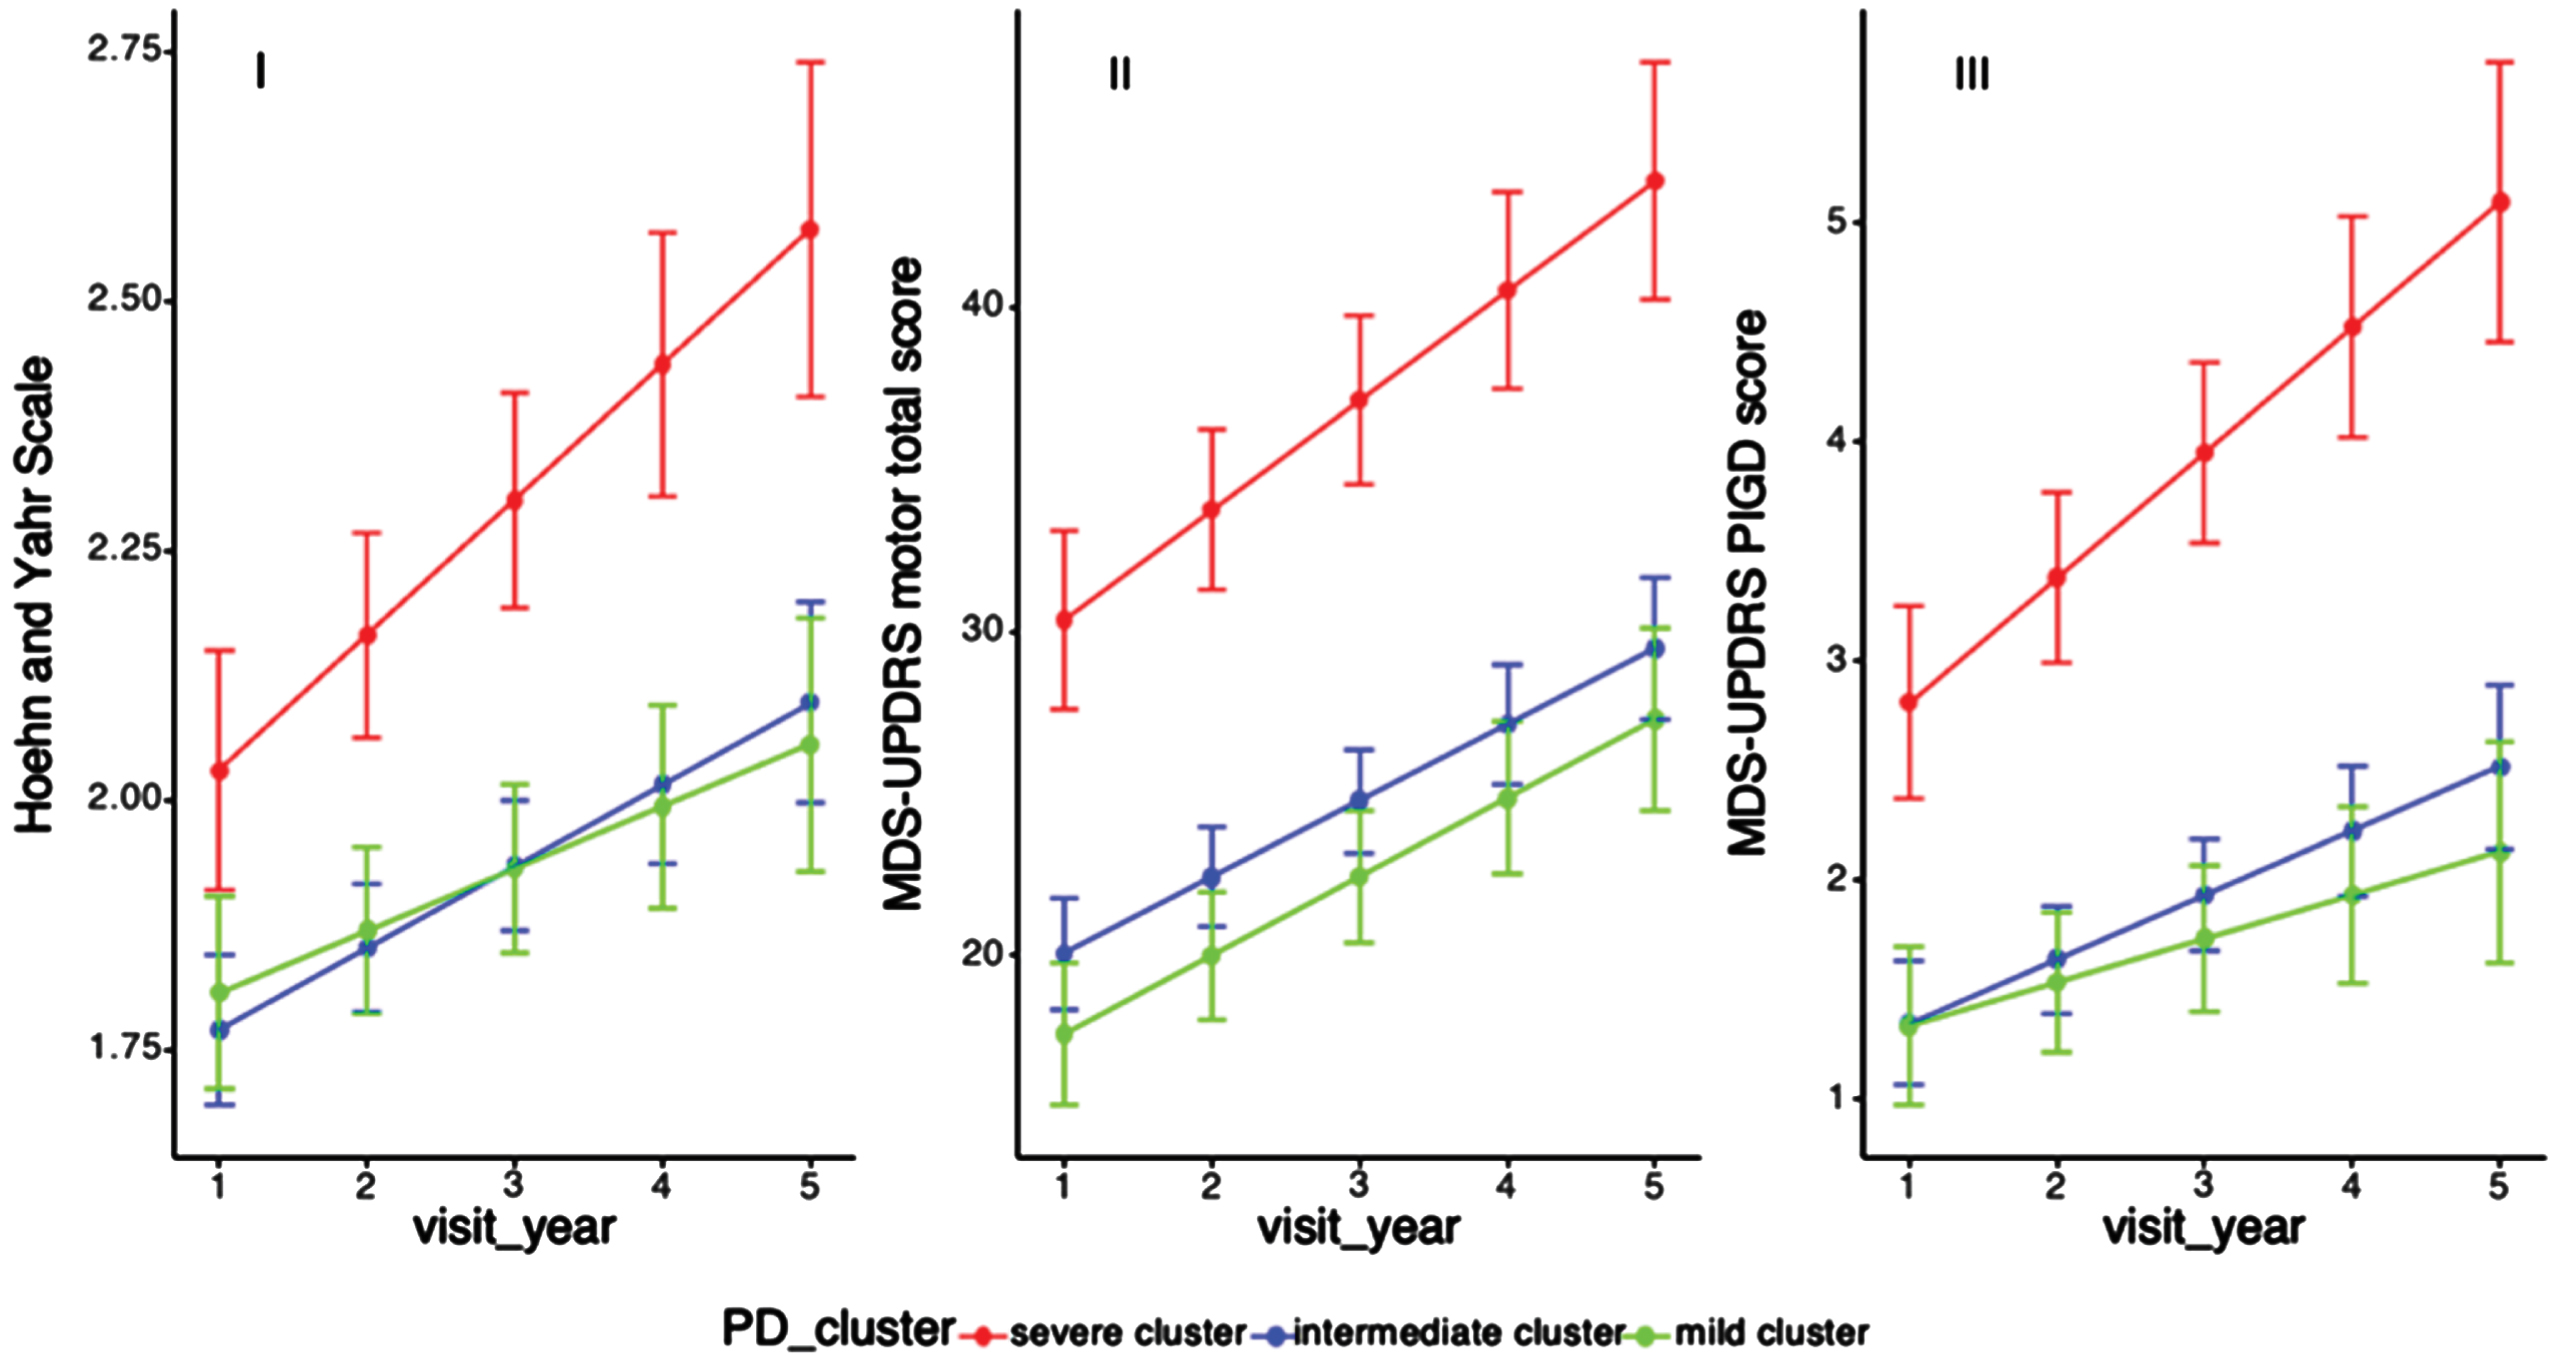
With regard to motor progression, cluster A showed a more rapid progression in H& Y and UPDRS motor scores, but these did not reach statistical significance, while cluster B and C had similar motor progression (cluster A B C: 0.13, 0.08, 0.07, p = 0.28; 3.15, 2.49, 2.66, p = 0.59). Of note, patients in cluster A had a significantly faster progression slope of PIGD score than the other two clusters after adjusting for age of diagnosis, sex, and education years (cluster A B C: 0.39, 0.30, 0.22, p = 0.04) (Table 3, Fig. 2).
Table 3
Comparison of motor progression rates among different clusters
| Longitudinal outcomes | Slope estimate (95% CI) | †p | ||
| Cluster A | Cluster B | Cluster C | ||
| H & Y scale | 0.13 (0.09, 0.18) | 0.08 (0.05, 0.11) | 0.07 (0.02, 0.1) | 0.28 |
| MDS-UPDRS motor score | 3.15 (2.41, 4.36) | 2.49 (1.76, 2.95) | 2.66 (1.69, 3.17) | 0.59 |
| PIGD score | 0.39 (0.39, 0.75) | 0.30 (0.18, 0.4) | 0.22 (0.05, 0.34) | 0.04* |
| Tremor score | –0.02 (–0.35, 0.34) | 0.26 (0.02, 0.44) | 0.22 (– 0.07, 0.5) | 0.57 |
MDS-UPDRS, Movement Disorder Society-Unified Parkinson’s Disease Rating Scale; H & Y scale, Modified Hoehn and Yahr staging scale; PIGD, postural instability and gait difficulty. Cluster A is severe cluster, cluster B is intermediate cluster and cluster C is mild cluster. †Longitudinal linear mixed model was performed to compare the progression slopes of motor outcomes among three PD clusters; Analysis has been adjusted for age of diagnosis, sex, and education year.
Fig. 2
Progression of motor functions among PD clusters. H& Y, Modified Hoehn and Yahr staging scale; MDS-UPDRS, Movement Disorder Society-Unified Parkinson’s Disease Rating Scale; PIGD, Postural Instability and gait difficulty. Longitudinal linear mixed model was performed to compare the progression slopes of motor outcomes among three PD clusters; Analysis has been adjusted for age of diagnosis, sex, and education year. (i) Progression slopes of H& Y score in cluster A B C were 0.13, 0.08, 0.07, p = 0.06 (p = 0.28); (ii) Progression slopes of UPDRS motor score in cluster A B C were 3.38, 2.35, 2.43, p = 0.19 (3.15, 2.49, 2.66, p = 0.59); (iii) Progression slopes of PIGD score in cluster A B C were 0.39, 0.30, 0.22, p = 0.01, p = 0.04.
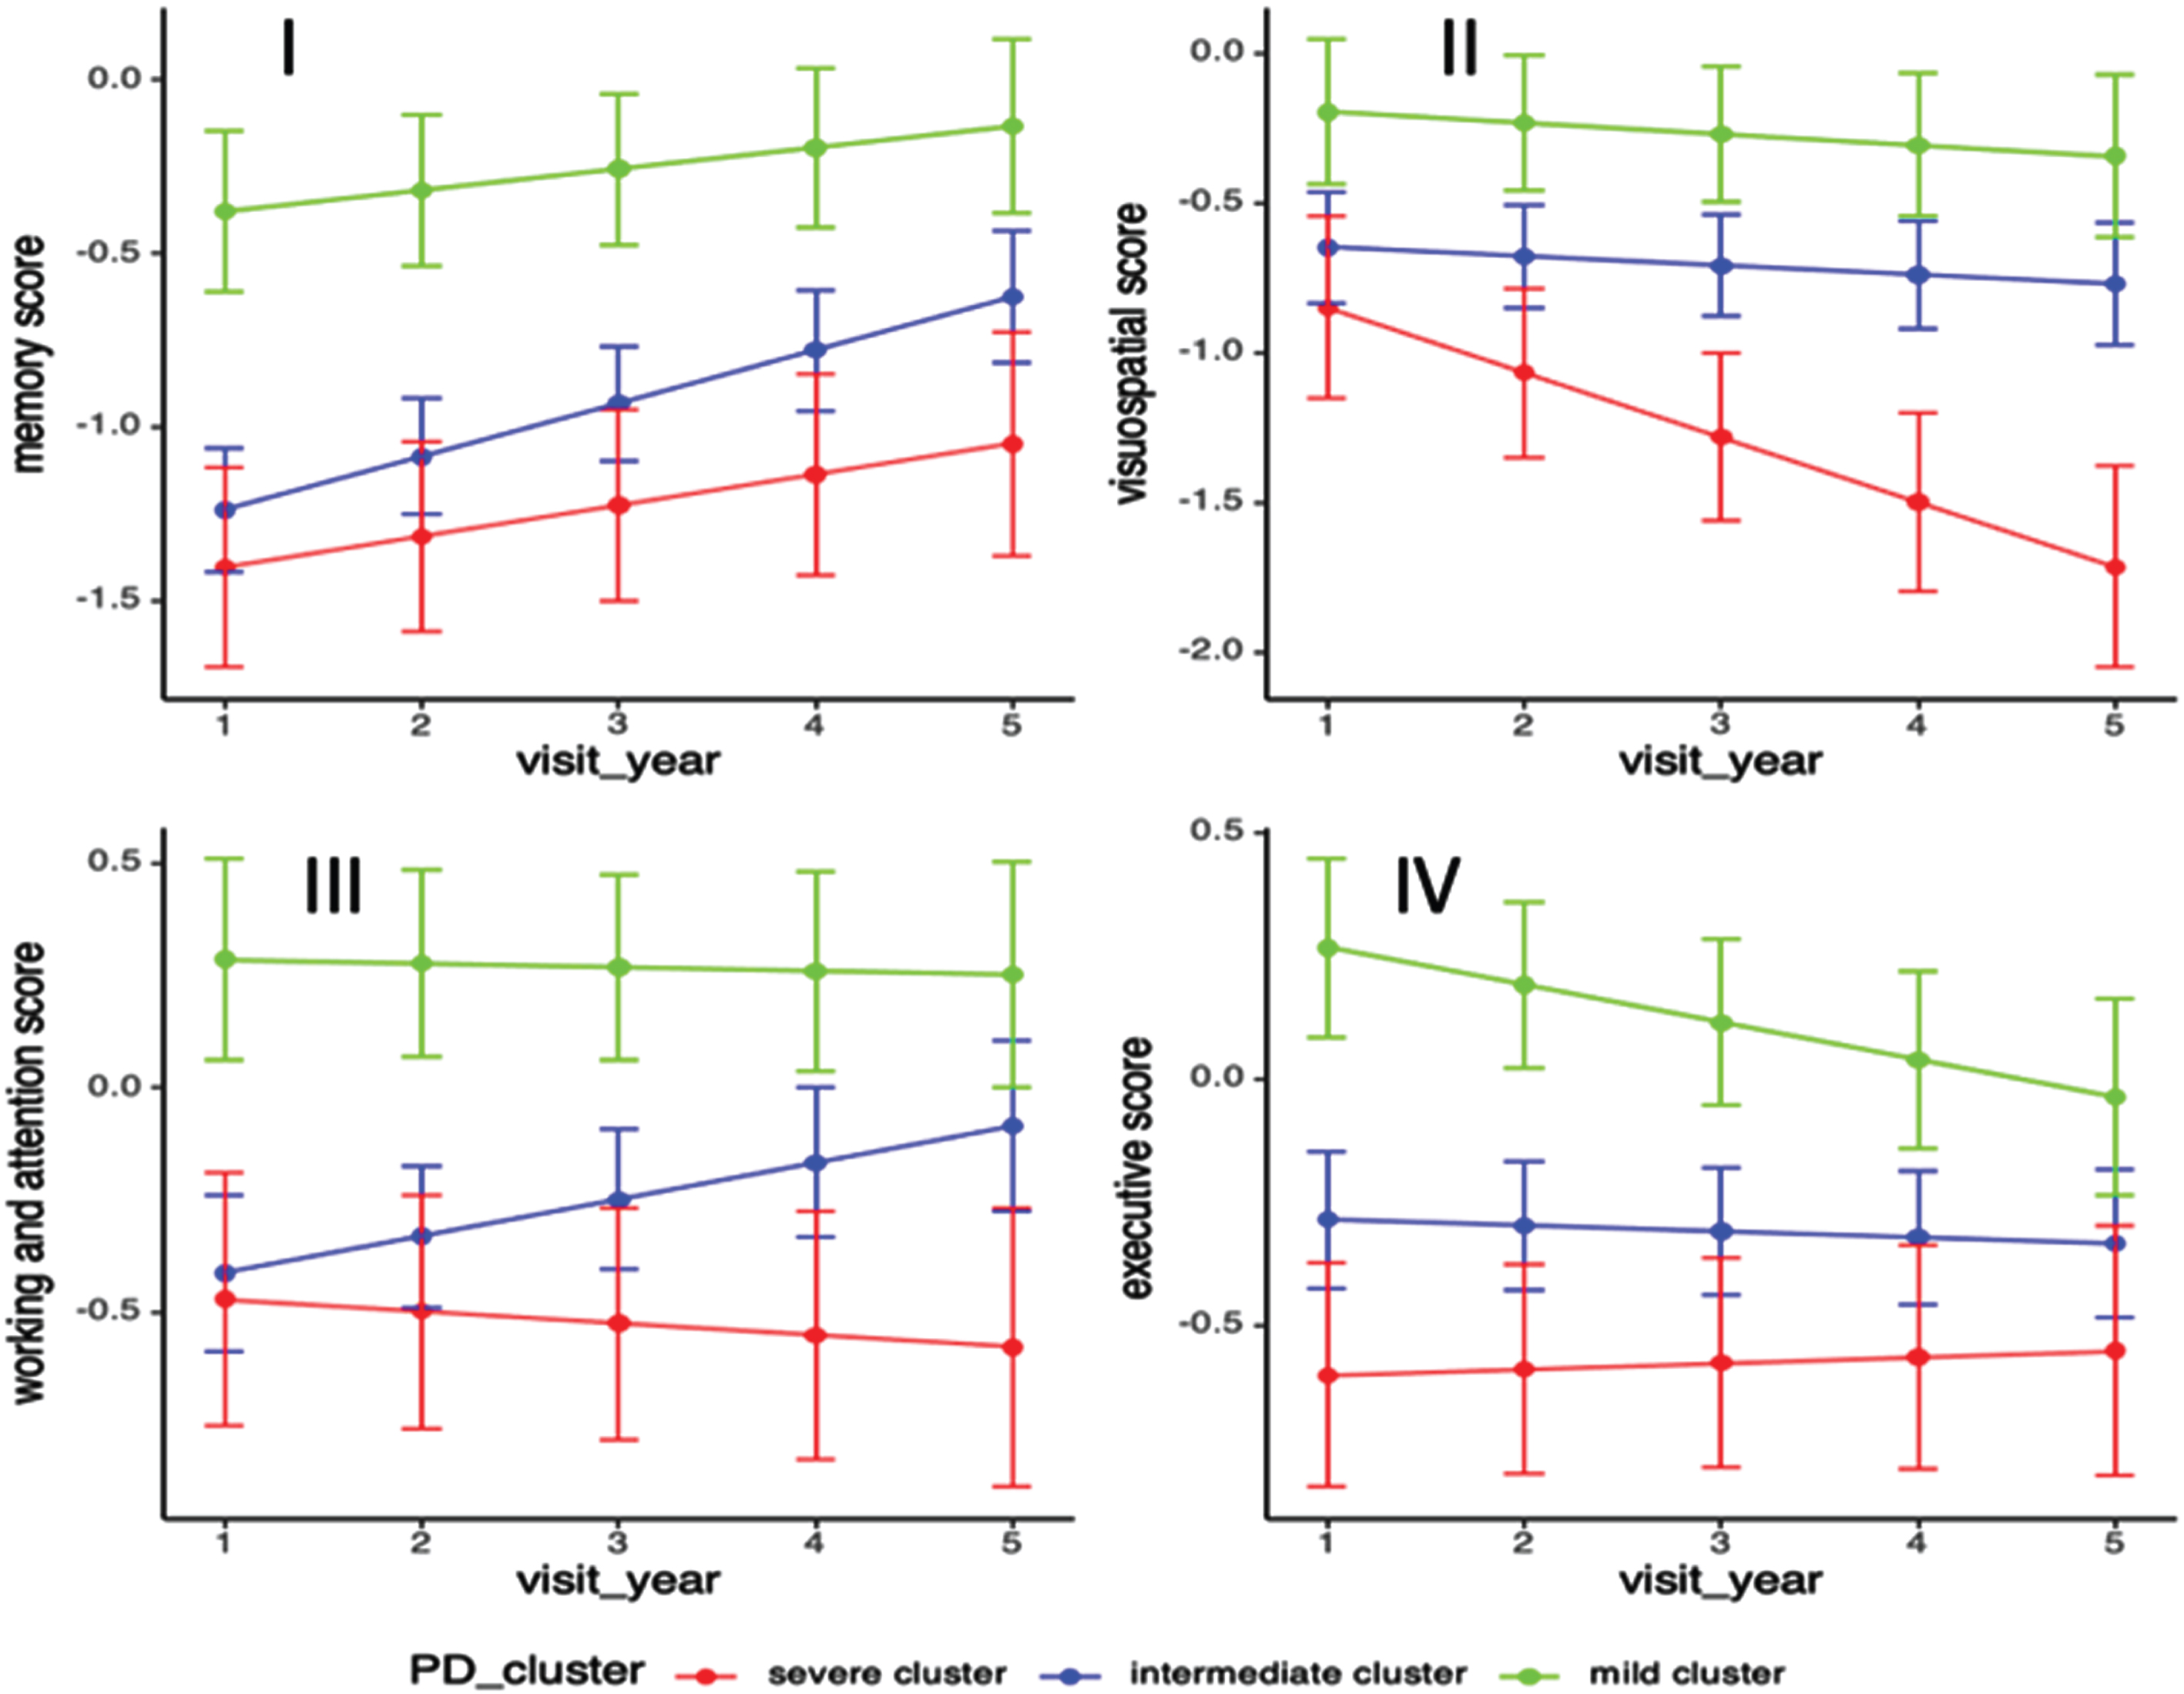
In terms of cognitive progression, cluster A deteriorated significantly in the visuospatial domain (cluster A B C: –0.23, –0.03, –0.04, p = 0.002) while cluster C had significantly decrease in executive domain score after adjusting for age of diagnosis, sex, and education years (cluster A B C: 0.01, –0.01, –0.08, p = 0.04). Compared to the other two clusters, cluster B (intermediate cluster) had significant increase in memory (cluster A B C: 0.09, 0.15, 0.07, p = 0.04) and working & attention domain scores (cluster A B C: –0.03, 0.08, –0.02, p = 0.04) (Table 4, Fig. 3).
Table 4
Comparison of cognitive progression rates among different clusters
| Longitudinal outcomes | Slope estimate (95% CI) | †p | ||
| Cluster A | Cluster B | Cluster C | ||
| Memory domain | 0.09 (0.02, 0.15) | 0.15 (0.11, 0.19) | 0.07 (0.01, 0.11) | 0.04* |
| Visuospatial domain | –0.23 (–0.3, –0.14) | –0.03 (–0.08, 0.02) | –0.04 (–0.10, 0.03) | 0.002* |
| Working & attention domain | –0.03 (–0.13, 0.03) | 0.08 (0.01, 0.11) | –0.02 (–0.12, 0.00) | 0.04* |
| Executive domain | 0.01 (–0.04, 0.07) | –0.01 (–0.05, 0.02) | –0.07 (–0.12, –0.03) | 0.04* |
| Language domain | –0.02 (–0.09, 0.03) | 0.05 (0.00, 0.08) | –0.01 (–0.06, 0.04) | 0.18 |
†Longitudinal linear mixed model was performed to compare the progression slopes of cognitive outcomes among three PD clusters; Analysis has been adjusted for age of diagnosis, sex, and education year.
Fig. 3
Progression of standardized cognitive domain scores among PD clusters. Longitudinal linear mixed model was performed to compare the progression slopes of cognitive outcomes among three PD clusters; Analysis has been adjusted for age of diagnosis, sex, and education year. (i) Progression rate in memory domain in cluster A B C were 0.09, 0.15, 0.07, p = 0.04; (ii) Progression rate in visuospatial domain score in cluster A B C were –0.23, –0.03, –0.04, p = 0.0018; (iii) Progression rate in working & attention domain score in cluster A B C were –0.03, 0.08, –0.02, p = 0.04; (iv) Progression rate in executive domain score in cluster A B C were 0.01, –0.01, –0.08, p = 0.04.
DISCUSSION
We assessed the comprehensive disease progression profiles among the data-driven PD clusters in the 5-year prospective study. Despite having similar disease duration, the three clusters demonstrated different progression in the various domains. Patients in cluster A (severe cluster in motor, NMS, and cognition) deteriorated significantly in NMSS Domain 3 (mood/apathy) score, NMSS Domain 4 (perceptual problems) score, PIGD score, and significantly decreased in daytime sleepiness. For cognitive progression, the severe cluster exhibited a faster decline in visuospatial domain, whereas patients in cluster C (mild subtype and young age of onset) experienced significantly faster decline in the executivedomain.
To our best knowledge, this is the first longitudinal study investigating detailed NMS progression amongst data-driven PD clusters. While the severe cluster demonstrated a faster progression in NMSS total score, the disparity did not reach statistical significance, possibly attributable to a constrained sample size. However, within the severe cluster, several subdomains of the NMSS and other non-motor symptom scales exhibited a significantly faster progression. Firstly, the severe cluster exhibited a notable reduction in the progression slope of the ESS Total Score. Previous studies have indicated that the manifestation of depressed mood can be associated with a decrease in excessive daytime sleepiness [18]. In addition, increased perceptual problems or hallucinations may play a role in diminishing daytime sleepiness within the severe cluster. Our findings align with this pattern, as we observed a decrease in daytime sleepiness concurrent with elevated scores in NMSS Domain 3 (mood/apathy) and NMSS Domain 4 (perceptual problems) in the severe cluster.
Previous studies have reported that PD patients with visuospatial and visuo-perceptual deficits were correlated with cortical thinning in posterior regions using structural magnetic resonance imaging [19, 20]. It is worthwhile to delve further into the examination of cortical volume in posterior regions among patients within the severe cluster. Furthermore, dysautonomia may also play a role in NMS progression as Cluster C (mild cluster) had more benign progression in NMSS Domain 7 (urinary) than the other two clusters. These findings should alert clinicians to proactively screen patients belonging to the severe cluster for mood problems, dysautonomic symptoms, and perceptual problems such as hallucinations, and to actively manage these problems to prevent them from progressing.
In our study, the severe cluster had a more rapid motor progression, which was in line with the previous studies [4, 7]. In the severe cluster, significantly faster progression rate of PIGD score was found, indicating that the PIGD score maybe the important contributor to worse motor prognosis. The estimated progression rates of UPDRS motor score and H& Y score were higher in the severe cluster but not statistically significant when compared to the other two clusters. The non-significance may be due to a limited sample size as significant differences were found in these two outcomes when 2-cluster approach was analyzed (severe vs. mild-intermediate (intermediate cluster and mild cluster were combined as one group, results not shown). Different response to medication might affect motor progression. However, the impact of medication or response to medication on motor progression in the current study is minimal as the LEDD among different clusters were not significantly different at both year 1 and year 5 (Table 1).
As for cognitive progression, previous studies reported that PD patients with cognitive impairment that mainly involved in deficit of visuospatial domain are likely to progress faster to dementia while PD subjects with disturbance in executive or memory domain would remain more stable over time [21, 22]. In our study, the severe cluster experienced worse progression in the visuospatial domain while the mild cluster had faster progression in the executive domain, which was in line with the previous findings. Different pathways might be involved in the cognitive evolution. The ‘dual syndrome hypothesis’ suggests that visuospatial deficits are more related to choline depletion in the posterior loop, while executive impairments are more associated with dopamine depletion in the fronto-striatal circuit [23]. Taking into account the current evidence, the severe cluster correlates well with the posterior loop hypothesis while the mild cluster associates with the fronto-striatal circuit hypothesis. PD patients with visuospatial disturbances was found to be modulated by the Microtubule Associated Protein Tau (MAPT) genotype whereas PD patients characterized with executive disturbances was modulated by catechol-O-methyltransferase (COMT) genotype [21, 22]. It would be useful for further studies to genotype these clusters to further validate this hypothesis.
There are various strengths of our study. First, this is a 5-year prospective study that comprehensively evaluated the progression of data-driven PD clusters, that included detailed NMSS and neuropsychological assessments. Second, our PD patients were recruited from homogeneous early PD cohort, in which the data-driven clustering were unlikely driven by different disease durations. However, some limitations of the study should be noted. First, there is unavoidable participants attrition of the cohort as PD is a progressive degenerative disorder and patients would drop out due to increasing dependency. However, dropout rate among three clusters has been compared and the result was insignificant (Supplementary Table 3), which indicates that the attrition may not be linked to the progression outcomes of different subtypes. Second, non-linearity association was not carried out given the small sample size and limited number of time points. Third, it is important to acknowledge the exploratory nature of this study, particularly in the context of exploring the NMSS domain and cognitive progression. It is advisable to seek external validation of the progression spectrum among data-driven PD subtypes by conducting studies in other cohorts with larger sample sizes.
In conclusion, the three PD clusters demonstrated different progression patterns. The severe cluster had significantly faster progression, particularly in mood and perceptual NMS domains, visuospatial cognitive performances, and postural instability gait scores. Our findings will be helpful for clinicians to stratify and pre-emptively manage PD patients with different subtypes by developing intervention strategies to counter the progression of these domains.
ACKNOWLEDGMENTS
We would like to thank all participants and their families for their support of the PALS study, and also neurologists from the National Neuroscience Institute, Singapore for referring their patients for the study.
FUNDING
This study was supported by the Singapore Ministry of Health’s National Medical Research Council under its Open Fund Large Collaborative Grant (MOH-OFLCG18May-0002).
CONFLICT OF INTEREST
The authors have no conflict of interest to report.
DATA AVAILABILITY
The datasets generated during and/or analyzed during the current study are not publicly available due to ethical restrictions but are available from the corresponding author on reasonable request.
All codes for data analysis associated with the current submission are available from the corresponding author on reasonable request.
SUPPLEMENTARY MATERIAL
[1] The supplementary material is available in the electronic version of this article: https://dx.doi.org/10.3233/JPD-230209.
REFERENCES
[1] | Jellinger KA ((2012) ) Neuropathology of sporadic Parkinson’s disease: Evaluation and changes of concepts. Mov Disord 27: , 8–30. |
[2] | Gjerloff T , Fedorova T , Knudsen K , Munk OL , Nahimi A , Jacobsen S , Danielsen EH , Terkelsen AJ , Hansen J , Pavese N , Brooks DJ , Borghammer P ((2015) ) Imaging acetylcholinesterase density in peripheral organs in Parkinson’s disease with 11C-donepezil PET. Brain 138: , 653–663. |
[3] | Sieber BA , Landis S , Koroshetz W , Bateman R , Siderowf A , Galpern WR , Dunlop J , Finkbeiner S , Sutherland M , Wang H , Lee VM , Orr HT , Gwinn K , Ludwig K , Taylor A , Torborg C , Montine TJ , Parkinson’s Disease 2014: Advancing Research, Improving Lives Conference Organizing Committee ((2014) ) Prioritized research recommendations from the National Institute of Neurological Disorders and Stroke Parkinson’s Disease 2014 conference. Ann Neurol 76: , 469–472. |
[4] | Fereshtehnejad SM , Romenets SR , Anang JB , Latreille V , Gagnon JF , Postuma RB ((2015) ) New clinical subtypes of Parkinson disease and their longitudinal progression: A prospective cohort comparison with other phenotypes. JAMA Neurol 72: , 863–873. |
[5] | van Rooden SM , Heiser WJ , Kok JN , Verbaan D , van Hilten JJ , Marinus J ((2010) ) The identification of Parkinson’s disease subtypes using cluster analysis: A systematic review. Mov Disord 25: , 969–978. |
[6] | Deng X , Saffari SE , Liu N , Xiao B , Allen JC , Ng SYE , Chia N , Tan YJ , Choi X , Heng DL , Lo YL , Xu Z , Tay KY , Au WL , Ng A , Tan EK , Tan LCS ((2022) ) Biomarker characterization of clinical subtypes of Parkinson disease. NPJ Parkinsons Dis 8: , 109. |
[7] | Fereshtehnejad SM , Zeighami Y , Dagher A , Postuma RB ((2017) ) Clinical criteria for subtyping Parkinson’s disease: Biomarkers and longitudinal progression. Brain 140: , 1959–1976. |
[8] | Lawton M , Ben-Shlomo Y , May MT , Baig F , Barber TR , Klein JC , Swallow DMA , Malek N , Grosset KA , Bajaj N , Barker RA , Williams N , Burn DJ , Foltynie T , Morris HR , Wood NW , Grosset DG , Hu MTM ((2018) ) Developing and validating Parkinson’s disease subtypes and their motor and cognitive progression. J Neurol Neurosurg Psychiatry 89: , 1279–1287. |
[9] | Huang X , Ng SY , Chia NS , Acharyya S , Setiawan F , Lu ZH , Ng E , Tay KY , Au WL , Tan EK , Tan LC ((2018) ) Serum uric acid level and its association with motor subtypes and non-motor symptoms in early Parkinson’s disease: PALS study. Parkinsonism Relat Disord 55: , 50–54. |
[10] | Tomlinson CL , Stowe R , Patel S , Rick C , Gray R , Clarke CE ((2010) ) Systematic review of levodopa dose equivalency reporting in Parkinson’s disease. Mov Disord 25: , 2649–2653. |
[11] | Chaudhuri KR , Martinez-Martin P , Brown RG , Sethi K , Stocchi F , Odin P , Ondo W , Abe K , Macphee G , Macmahon D , Barone P , Rabey M , Forbes A , Breen K , Tluk S , Naidu Y , Olanow W , Williams AJ , Thomas S , Rye D , Tsuboi Y , Hand A , Schapira AH ((2007) ) The metric properties of a novel non-motor symptoms scale for Parkinson’s disease: Results from an international pilot study. Mov Disord 22: , 1901–1911. |
[12] | Stebbins GT , Goetz CG , Burn DJ , Jankovic J , Khoo TK , Tilley BC ((2013) ) How to identify tremor dominant and postural instability/gait difficulty groups with the movement disorder society unified Parkinson’s disease rating scale: Comparison with the unified Parkinson’s disease rating scale. Mov Disord 28: , 668–670. |
[13] | Chong MS , Lim WS , Chan SP , Feng L , Niti M , Yap P , Yeo D , Ng TP ((2010) ) Diagnostic performance of the chinese frontal assessment battery in early cognitive impairment in an Asian population. Dement Geriatr Cogn Disord 30: , 525–532. |
[14] | Randolph C , Tierney MC , Mohr E , Chase TN ((1998) ) The Repeatable Battery for the Assessment of Neuropsychological Status (RBANS): Preliminary clinical validity. J Clin Exp Neuropsychol 20: , 310–319. |
[15] | Fastenau PS , Denburg NL , Hufford BJ ((1999) ) Adult norms for the Rey-Osterrieth Complex Figure Test and for supplemental recognition and matching trials from the Extended Complex Figure Test. Clin Neuropsychol 13: , 30–47. |
[16] | Deng X , Saffari SE , Ng SYE , Chia N , Tan JY , Choi X , Heng DL , Xu Z , Tay KY , Au WL , Liu N , Ng A , Tan EK , Tan LCS ((2022) ) Blood lipid biomarkers in early Parkinson’s disease and Parkinson’s disease with mild cognitive impairment. J Parkinsons Dis 12: , 1937–1943. |
[17] | Lee CK , Collinson SL , Feng L , Ng TP ((2012) ) Preliminary normative neuropsychological data for an elderly chinese population. Clin Neuropsychol 26: , 321–334. |
[18] | Ataide M , Franco CMR , Lins OG ((2014) ) Daytime sleepiness in Parkinson’s disease: Perception, influence of drugs, and mood disorder. Sleep Disord 2014: , 939713. |
[19] | Garcia-Diaz AI , Segura B , Baggio HC , Marti MJ , Valldeoriola F , Compta Y , Bargallo N , Uribe C , Campabadal A , Abos A , Junque C ((2018) ) Structural brain correlations of visuospatial and visuoperceptual tests in Parkinson’s disease. J Int Neuropsychol Soc 24: , 33–44. |
[20] | Garcia-Diaz AI , Segura B , Baggio HC , Uribe C , Campabadal A , Abos A , Marti MJ , Valldeoriola F , Compta Y , Bargallo N , Junque C ((2018) ) Cortical thinning correlates of changes in visuospatial and visuoperceptual performance in Parkinson’s disease: A 4-year follow-up. Parkinsonism Relat Disord 46: , 62–68. |
[21] | Williams-Gray CH , Evans JR , Goris A , Foltynie T , Ban M , Robbins TW , Brayne C , Kolachana BS , Weinberger DR , Sawcer SJ , Barker RA ((2009) ) The distinct cognitive syndromes of Parkinson’s disease: 5 year follow-up of the CamPaIGN cohort. Brain 132: , 2958–2969. |
[22] | Wojtala J , Heber IA , Neuser P , Heller J , Kalbe E , Rehberg SP , Storch A , Linse K , Schneider C , Graber S , Berg D , Dams J , Balzer-Geldsetzer M , Hilker-Roggendorf R , Oberschmidt C , Baudrexel S , Witt K , Schmidt N , Deuschl G , Mollenhauer B , Trenkwalder C , Liepelt-Scarfone I , Spottke A , Roeske S , Wullner U , Wittchen HU , Riedel O , Dodel R , Schulz JB , Reetz K ((2019) ) Cognitive decline in Parkinson’s disease: The impact of the motor phenotype on cognition. J Neurol Neurosurg Psychiatry 90: , 171–179. |
[23] | Kehagia AA , Barker RA , Robbins TW ((2013) ) Cognitive impairment in Parkinson’s disease: The dual syndrome hypothesis. Neurodegener Dis 11: , 79–92. |


