
Altered Functional Connectivity of the Subthalamic Nucleus in Parkinson’s Disease: Focus on Candidates for Deep Brain Stimulation
Abstract
Background:
The hypothesis that the effectiveness of deep brain stimulation (DBS) in Parkinson’s disease (PD) would be related to connectivity dysfunctions between the site of stimulation and other brain regions is growing.
Objective:
To investigate how the subthalamic nucleus (STN), the most frequently used DBS target for PD, is functionally linked to other brain regions in PD patients according to DBS eligibility.
Methods:
Clinical data and resting-state functional MRI were acquired from 60 PD patients and 60 age- and sex-matched healthy subjects within an ongoing longitudinal project. PD patients were divided into 19 patients eligible for DBS and 41 non-candidates. Bilateral STN were selected as regions of interest and a seed-based functional MRI connectivity analysis was performed.
Results:
A decreased functional connectivity between STN and sensorimotor cortex in both PD patient groups compared to controls was found. Whereas an increased functional connectivity between STN and thalamus was found in PD patient groups relative to controls. Candidates for DBS showed a decreased functional connectivity between bilateral STN and bilateral sensorimotor areas relative to non-candidates. In patients eligible for DBS, a weaker STN functional connectivity with left supramarginal and angular gyri was related with a more severe rigidity and bradykinesia whereas a higher connectivity between STN and cerebellum/pons was related to poorer tremor score.
Conclusion:
Our results suggest that functional connectivity of STN varies among PD patients eligible or not for DBS. Future studies would confirm whether DBS modulates and restores functional connectivity between STN and sensorimotor areas in treated patients.
INTRODUCTION
Parkinson’s disease (PD) is a progressive neurodegenerative disorder characterized by motor signs and symptoms including resting tremor, rigidity, bradykinesia, as well as non-motor manifestations involving autonomic, behavioral, and cognitive systems [1]. Motor and non-motor alterations have been related to a progressive and widespread involvement of the cortico-basal ganglia-thalamo-cortical network [2]. Several treatments, including medications, surgery, and rehabilitative therapies, are currently available to help relieve signs and symptoms and to improve quality of life [1].
Deep brain stimulation (DBS) has become a well-established therapy for PD and few treatments are as effective as DBS for controlling the troubling motor signs and symptoms such as tremor and levodopa-induced dyskinesia, with a consequent positive impact on patients’ quality of life [3–5]. However, the exact mechanism underlying the efficacy of the stimulation remains unknown. The subthalamic nucleus (STN), which is part of the basal ganglia circuit, is one of the preferred targets for DBS of PD patients showing great clinical benefits on motor signs and symptoms. Neuroanatomical tracer, electrophysiological and structural brain connectivity investigations suggest that the STN is divided into three different parts [6, 7]: 1) the sensorimotor area, the largest part encompassing the dorso-lateral two-thirds of the STN; 2) the associative area, located in the ventrolateral STN; and 3) the limbic area, located at the medial tip of the STN [7, 8]. Even when accurate surgical targeting and selective stimulation of the STN motor area is performed, the therapeutic benefits of STN-DBS can vary among PD patients. Therefore, the hypothesis that the effectiveness of DBS would be related to connectivity dysfunctions of the site of the stimulation with other brain regions is being debated. In this instance, how these network alterations differ among PD patients is unknown.
Several resting state (RS) functional magnetic resonance imaging (fMRI) studies described how PD alters the functional brain organization providing new hypotheses about PD physiopathology and treatments response [9, 10]. More recently, RS fMRI studies demonstrated that brain functional connectivity identifies different clinical clusters of PD and correlates with motor and cognitive severity [11–18]. In a previous study, we investigated connectivity networks in PD patients eligible or not for DBS, suggesting that advanced fMRI techniques (graph analysis and connectomics) might represent a powerful approach to help clinicians establish the correct indication to DBS in PD. In detail, candidates for DBS were characterized by occipital hyperconnectivity and/or basal ganglia-sensorimotor hypoconnectivity along with progressively increased connectivity between basal ganglia and sensorimotor areas and decreased connectivity in the posterior regions [17]. However, in that study basal ganglia did not involve the bilateral STN and therefore they were not investigated [17].
Against this background, we examined functional connectivity between STN and other brain regions in two groups of PD patients: candidates for DBS (before undergoing surgery) and cases with comparable disease duration and stage but not meeting the criteria to undergo DBS treatment. We then sought to determine whether STN-brain network differs between the two groups and if connectivity alterations are related to the severity of specific signs and symptoms.
MATERIALS AND METHODS
Subjects and group definition
One hundred-fifty-four patients with idiopathic PD [19] were prospectively recruited at the Clinic of Neurology, Faculty of Medicine, University of Belgrade, Serbia, within the framework of an ongoing longitudinal project involving clinical, cognitive/behavioral and brain MRI evaluations (performed yearly for a maximum of four years). For the purpose of the present analysis, clinical and cognitive/behavioral longitudinal data were used to identify patients who became eligible or not for surgery over the follow-up, whereas the baseline brain MRI scans (acquired at study entry) were analyzed to investigate STN networks alterations between groups before developing clinical criteria for surgery. As previously reported [17], patients were excluded if they had: disease duration less than four years at study entry (according to the Earlystim trial) [3, 5], severe dementia [20], acute psychosis or major depression with suicidal ideation (due to their absolute contraindication for DBS treatment) [21], severe cerebrovascular disorders or intracranial masses on routine MRI, and incomplete MRI or motion artifacts during the scan. Subsequently, according to motor symptoms and signs, general clinical information, levodopa equivalent daily dosage (LEDD) [22] and cognitive and behavioral data, the PD population was divided in two groups: 1) patients eligible for DBS if they suffered from troublesome dyskinesia and/or severe motor fluctuations causing reduced quality of life despite medications adjustment, and/or refractory marked tremor over four years of follow-up; 2) patients who did not meet the criteria to undergo DBS surgery over the follow-up [17]. According to inclusion and exclusion criteria, 60 patients were enrolled in the study (19 candidates and 41 non-candidates for DBS). Notably, the framework for the selection of PD patients who became candidates for DBS over time was already described [17], as we used the same cohorts of PD patients for the purpose of this study.
Sixty age- and sex-matched healthy controls without neurological and psychiatric disorders were also recruited and underwent clinical, cognitive and MRI assessments.
The study received approval from the ethics committee on human experimentation of Faculty of Medicine –University of Belgrade (No. 175090). Written informed consent was obtained from all patients participating in the study.
Clinical evaluation
An experienced neurologist performed clinical assessments. Patients were examined in ON state (i.e., period when the dopaminergic medication is working, and symptoms are well controlled). Demographic, general clinical, and family data (age, sex, education, handedness, age at onset, side of onset, PD duration, medications, and family history) were obtained using a semi-structured interview. LEDD was calculated [22]. Disease severity was defined using the Hoehn and Yahr (HY) stage score [23]. The Unified PD Rating Scale (UPDRS) [24] was used to evaluate non-motor symptoms (UPDRS I), motor symptoms (UPDRS II), motor signs (UPDRS III), and motor complications (UPDRS IV). UPDRS III rigidity, tremor, and bradykinesia sub-scores were also calculated. The presence of dyskinesia and motor fluctuations was evaluated according to the UPDRS IV sub-scores. Neuropsychological and behavioral assessment are reported in the Supplementary Material.
MRI acquisition
Brain MRI scans were obtained for both PD patients and healthy controls on the same 1.5 Tesla Philips Achieva system machine (Philips Medical Systems, Best, the Netherlands). Patients were scanned 90–120 min after their regular morning dopaminergic therapy administration (ON state). The following MRI sequences were obtained: 1) Dual-Echo Turbo Spin-Echo (repetition time [TR] = 3125 ms, echo time [TEs] = 20/100 ms, echo train length [ETL] = 6,44 axial slices, thickness = 3.0 mm, matrix size = 256×247, field of view [FOV] = 240×232 mm2; voxel size = 0.94×0.94×3 mm, in-plane sensitivity encoding [SENSE] parallel reduction factor, 1.5), 2) three-dimensional (3D) sagittal T1-weighted Turbo-Field-Echo (TR = 7.1 ms, TE = 3.3 ms, inversion time = 1000 ms, flip angle = 8°, matrix size = 256×256×180, FOV = 256×256 mm2, section thickness = 1 mm, voxel size = 1×1×1 mm), and 3) gradient-echo echo planar imaging for RS fMRI (TR = 3000 ms, TE = 35 ms, flip angle = 90°, matrix size = 128×128, FOV = 240×240 mm2, voxel size = 1.88×1.88×4 mm, slice thickness = 4 mm, 200 sets of 30 contiguous axial slices). For the latter sequence, participants were instructed to remain motionless, to keep their eyes closed, not to fall asleep, and not to think about anything.
Resting-state fMRI preprocessing and seed-based functional connectivity analysis
MRI analysis was performed at the Neuroimaging Research Unit, IRCCS Ospedale San Raffaele, Milan, Italy, by two experienced observers. Methodological framework for the MRI analysis is summarized in Fig. 1.
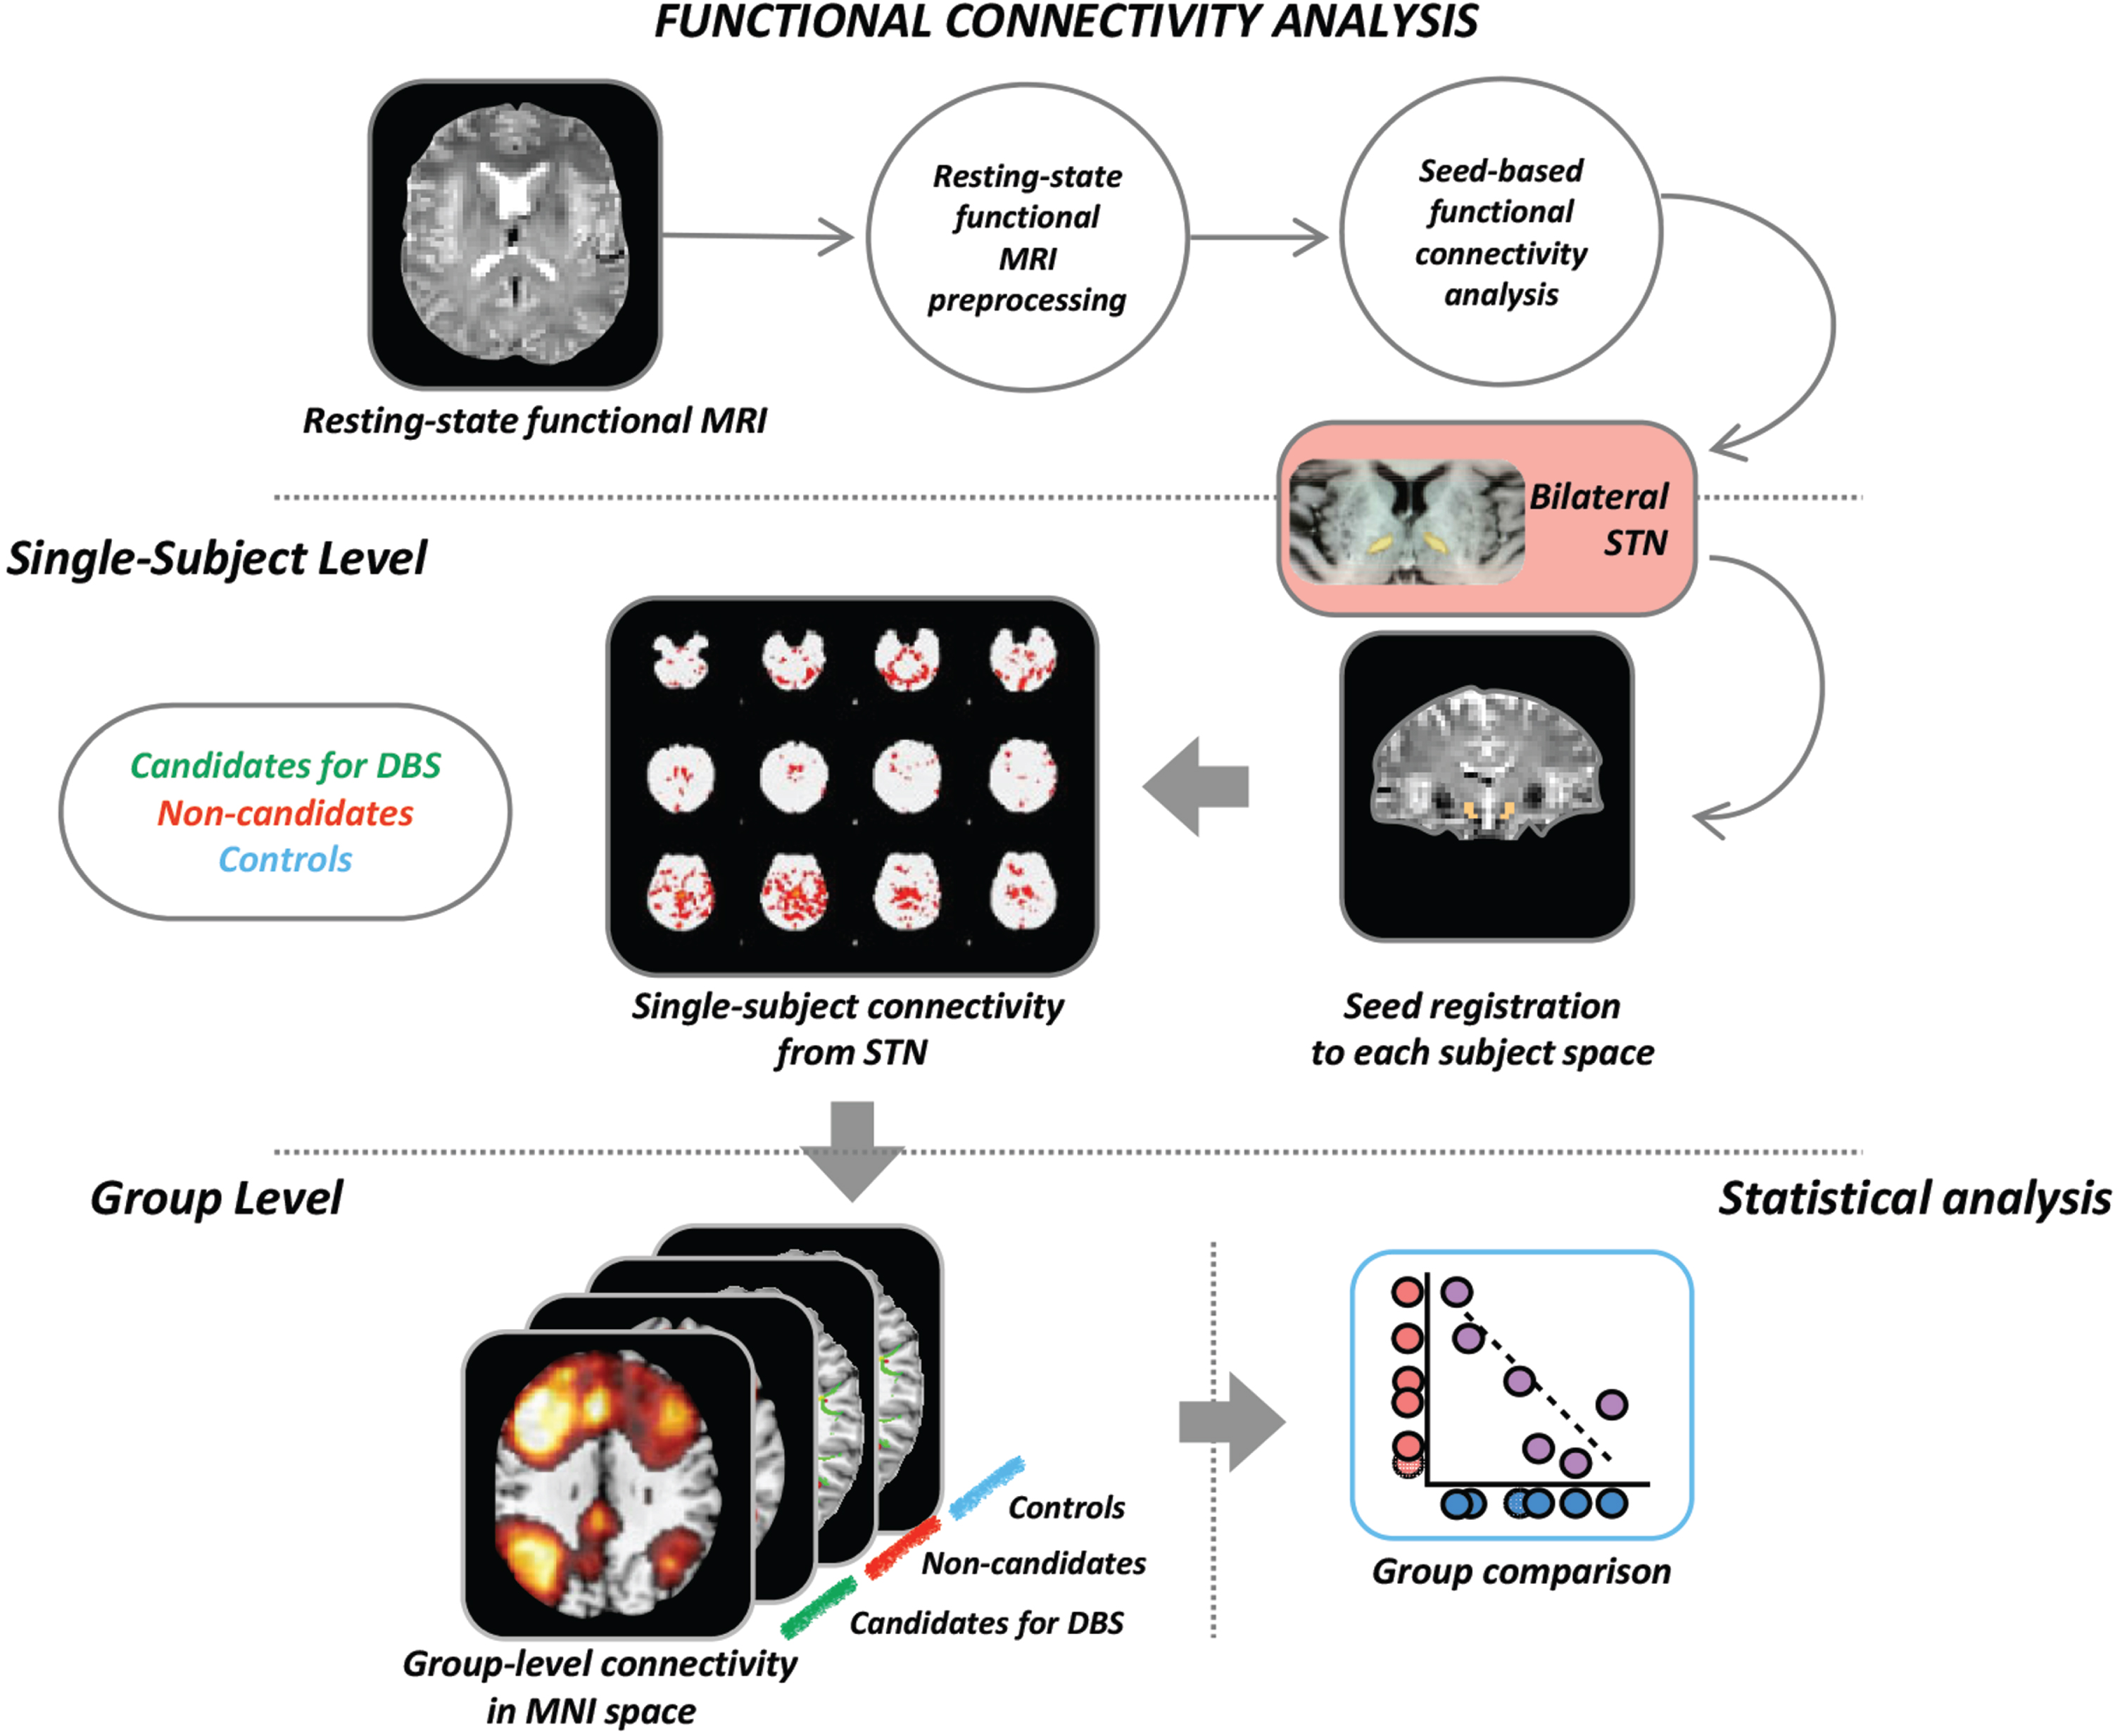
Fig. 1
Schematic representation of the procedure for the seed-based resting state functional connectivity. Each seed of interest (in the figure an example is provided for the bilateral STN) was defined in MNI space and moved to each subject’s native space. From each seed, mean time-series were extracted and subject-level maps of all positively and negatively predicted voxels for each regressor were obtained. Subject-level maps were finally registered to the MNI standard template and were ready for the statistical analysis. Here we provide the illustrative example of analysis: seed-based functional connectivity was investigated in each patient group (candidates or not for DBS) versus the matched group of controls using a general linear model which includes the group as independent factor. DBS, candidates for deep brain stimulation; MRI, magnetic resonance imaging; STN, subthalamic nucleus.
RS fMRI data processing was carried out using the FMRIB software library (FSLv5.0) [25]. First, T1-weighted images were skull stripped using the Brain Extraction Tool and segmented in gray matter (GM), white matter, and cerebrospinal fluid maps using the FMRIB’s Automated Segmentation Tool. Resulting images were registered into the RS fMRI native space of each subject through a 12 degree of freedom linear affine transformation using FMRIB’s Linear Image Registration Tool. The first four volumes of the fMRI data were removed to reach complete magnet signal stabilization. The following FSL-standard preprocessing pipeline was applied: 1) motion correction using MCFLIRT; 2) high-pass temporal filtering (lower frequency: 0.01 Hz); 3) spatial smoothing (Gaussian Kernel of FWHM 6 mm); 4) single-session independent component analysis-based automatic removal of motion artifacts (ICA_AROMA) to identify those independent components (ICs) representing motion related artifacts. This method calculates a set of spatial and temporal discriminative features and, according to them, exploits a classification procedure to identify ICs representing motion artifacts. Finally, ICs classified as motion-related were removed from the fMRI dataset by means of linear regression. RS fMRI data set (‘clean’ from motion-related ICs) were co-registered to the participant’s 3D T1-weighted TFE image using affine boundary-based registration as implemented in FLIRT [26] and subsequently transformed to the Montreal Neurological Institute (MNI) 152 standard space with 4 mm isotropic resolution using non-linear registration through FNIRT [27]. Pre-processed RS fMRI data for each subject were temporally concatenated across participants to create a single 4D data set.
Then, individual RS fMRI images were processed using MELODIC (Multivariate Exploratory Linear Optimized Decomposition into Independent Components; version 3.10; http://www.fmrib.ox.ac.uk/fsl/melodic/) [28]. Left and right STN were selected as seeds and were defined in the MNI space in WFU PickAtlas (toolbox of SPM12), moved to each subject native space trough non-linear and affine registrations, and visually inspected in the individual brains by neuroimaging experts. Seed-based RS-FC was then performed using a 2-step regression analysis as implemented in the FMRIB software library (FSLv5). First, time series of white matter, cerebrospinal fluid, and whole brain volumes in RS fMRI native space were extracted from the preprocessed and denoised data and their effects were regressed out using the FMRI Expert Analysis Tool. Seed mean time-series were then calculated. The output of this step is represented by subject-level maps of all positively and negatively predicted voxels for each regressor. Subject-level maps were registered to the MNI standard template to enter the statistical analysis.
Statistical analysis
Demographic and clinical data
Demographic, clinical (motor and non-motor), and cognitive data were compared between groups using ANOVA models or Chi-square test. p values were Bonferroni-corrected for multiple comparisons at p < 0.05. All statistical analyses were performed using R Statistical Software (version 4.0.3; R Foundation for Statistical Computing, Vienna, Austria).
Seed-based resting-state functional connectivity
Between-group differences were tested using the FMRIB’s Local Analysis of Mixed Effects (FLAME), which allows multi-level modeling for RS fMRI group analysis. Functional connectivity was investigated between groups using a general linear model which includes all groups as independent factors (healthy controls, PD candidates for DBS, PD non-candidates for DBS), and age and sex variables as covariates. Analysis between candidates or not for DBS was also adjusted for LEDD and clinical variables which were found to be different between PD groups at baseline. Corrections for multiple comparisons were carried out at cluster level using Gaussian random field theory, z > 2.3; cluster significance: p < 0.05, corrected [29]. Moreover, we tested the correlation between clinical motor signs (UPDRS III total and subscores) and STN functional connectivity performing a second-level GLM-based analysis including both groups of PD patients. Analysis was adjusted for age, sex and LEDD. Results were considered significant at cluster-level FWE corrected p < 0.05.
RESULTS
Demographic and clinical features
Nineteen PD patients were eligible for DBS, whereas 41 patients did not meet the criteria to undergo surgery, as previously described [17]. Patients were considered eligible for DBS according to the following clinical indications: medication-resistant tremor in 4/19 patients (21.05%), motor fluctuations and dyskinesia impairing quality of life in 11/19 patients (57.9%), and medication-resistant tremor and dyskinesia in the remaining 4/19 patients (21.05%).
Demographic and clinical characteristics of the study sample are described in Table 1. The three groups were matched for age and sex. Both patient groups had lower education and worse behavioral/cognitive performances compared to healthy controls (Table 1 and Supplementary Table 1). Patients eligible for DBS over time and those not eligible did not differ in terms of education, age at onset, PD duration, site of onset, and HY score. At baseline, the UPDRS total, part II, part III, and part IV scores were already worse in candidates versus non-candidates for DBS (Table 1). Cognitive and behavioral features were similar between the two PD groups (Supplementary Table 1). Over the follow-up, both PD groups showed motor clinical progression (UPDRS total, part II, part III, part IV) and increased LEDD. The clinical longitudinal changes were previously reported [17].
Table 1
Demographic and clinical features of Parkinson’s disease patients and healthy controls
| Variables | HC | Candidates for DBS | Non-candidates | p: Candidates for DBS vs. HC | p: Non-candidates vs. HC | p: Candidates for DBS vs. Non-candidates |
| N | 60 | 19 | 41 | – | – | – |
| Age at MRI (y) | 61.79±8.98 (46.14–77.72) | 61.09±7.32 (48.86–73.59) | 61.96±6.38 (49.09–82.95) | 1.00 | 1.00 | 1.00 |
| Sex (men/women) | 29 (48.33)/31 (51.67) | 11 (57.9)/8 (42.1) | 25 (61)/16 (39) | 0.32 | 0.15 | 0.52 |
| Education (y) | 13.52±2.57 (8.00–16.00) | 11.21±3.06 (4–16) | 12.34±2.31 (8–17) | 0.003 | 0.01 | 0.35 |
| Handedness (right/left/both) | 46 (92) 4 (8) 0 (0) | 18 (94.7) 1 (5.3) 0 (0) | 36 (87.8) 4 (9.8) 1 (2.4) | 0.58 | 0.50 | 0.64 |
| Age at onset (y) | – | 52.05±7.94 (42.0–64.0) | 54.63±6.45 (43.0–71.0) | – | – | 0.19 |
| Disease duration (y) | – | 8.94±5.55 (4.28–23.93) | 7.42±3.65 (4.00–16.86) | – | – | 0.24 |
| Family history (no/yes) | – | 16 (84.2) 3 (15.8) | 34 (82.9) 7 (17.1) | – | – | 0.61 |
| Side of onset (right/left/both) | – | 12 (63.2)/7 (36.8)/0 (0) | 25 (61.0)/15 (36.6)/1 (2.4) | – | – | 0.79 |
| Hoehn &Yahr | – | 2.32±0.74 (1–3) | 1.94±0.60 (1–3) | – | – | 0.19 |
| UPDRS Total | – | 65.00±17.59 (28–90) | 49.66±17.35 (15–79) | – | – | 0.002 |
| UPDRS I Total | – | 3.84±3.97 (0–12) | 3.27±2.99 (0–12) | – | – | 0.54 |
| UPDRS II Total | – | 14.21±4.66 (3–21) | 10.39±4.49 (1–20) | – | – | 0.004 |
| UPDRS III Total | – | 43.68±14.36 (14–62) | 34.71±13.34 (12–55) | – | – | 0.02 |
| UPDRS IV Total | – | 3.26±2.51 (0–9) | 1.29±1.69 (0–6) | – | – | 0.01 |
| Levodopa equivalent dose (mg) | – | 882.63±398.59 (0–1530) | 679.15±322.42 (0–1140) | – | – | 0.07 |
Values are reported as mean±standard deviation (range) or absolute and percentage frequency (%) for continuous and categorical variables, respectively. Differences between Parkinson’s disease patients and healthy controls and between Parkinson’s disease groups were assessed using ANOVA models (for continuous demographic and general clinical variables) and Chi-square test (for all categorical variables). p values were adjusted for multiple comparisons at p < 0.05. DBS, Deep Brain Stimulation; Candidates for DBS, Patients eligible for DBS; HC, healthy controls; Non-candidates, patients not eligible for DBS; PD, Parkinson’s disease; UPDRS, Unified Parkinson’s Disease Rating Scale.
Seed-based resting state functional connectivity
PD candidates for DBS vs. healthy controls
Compared to controls, patients eligible for DBS showed reduced functional connectivity between bilateral STN and 1) bilateral primary, premotor and supplementary motor cortex, 2) bilateral primary and sensory association cortex, and 3) right Broca’s area and supramarginal gyrus (Fig. 2, Table 2). On the other hand, candidates for DBS showed an increased functional connectivity between bilateral STN and bilateral thalamus and globus pallidus (Fig. 2, Table 2).
Fig. 2
Seed-based functional connectivity analysis. Resting-state functional connectivity of the bilateral STN seed region among PD groups and healthy controls. Results are overlaid on the Montreal Neurological Institute template in neurological convention, displayed at p < 0.05 family wise error corrected for multiple comparisons (with age and sex variables as covariates), implementing the threshold-free cluster enhancement. Colored bar represents Z values.
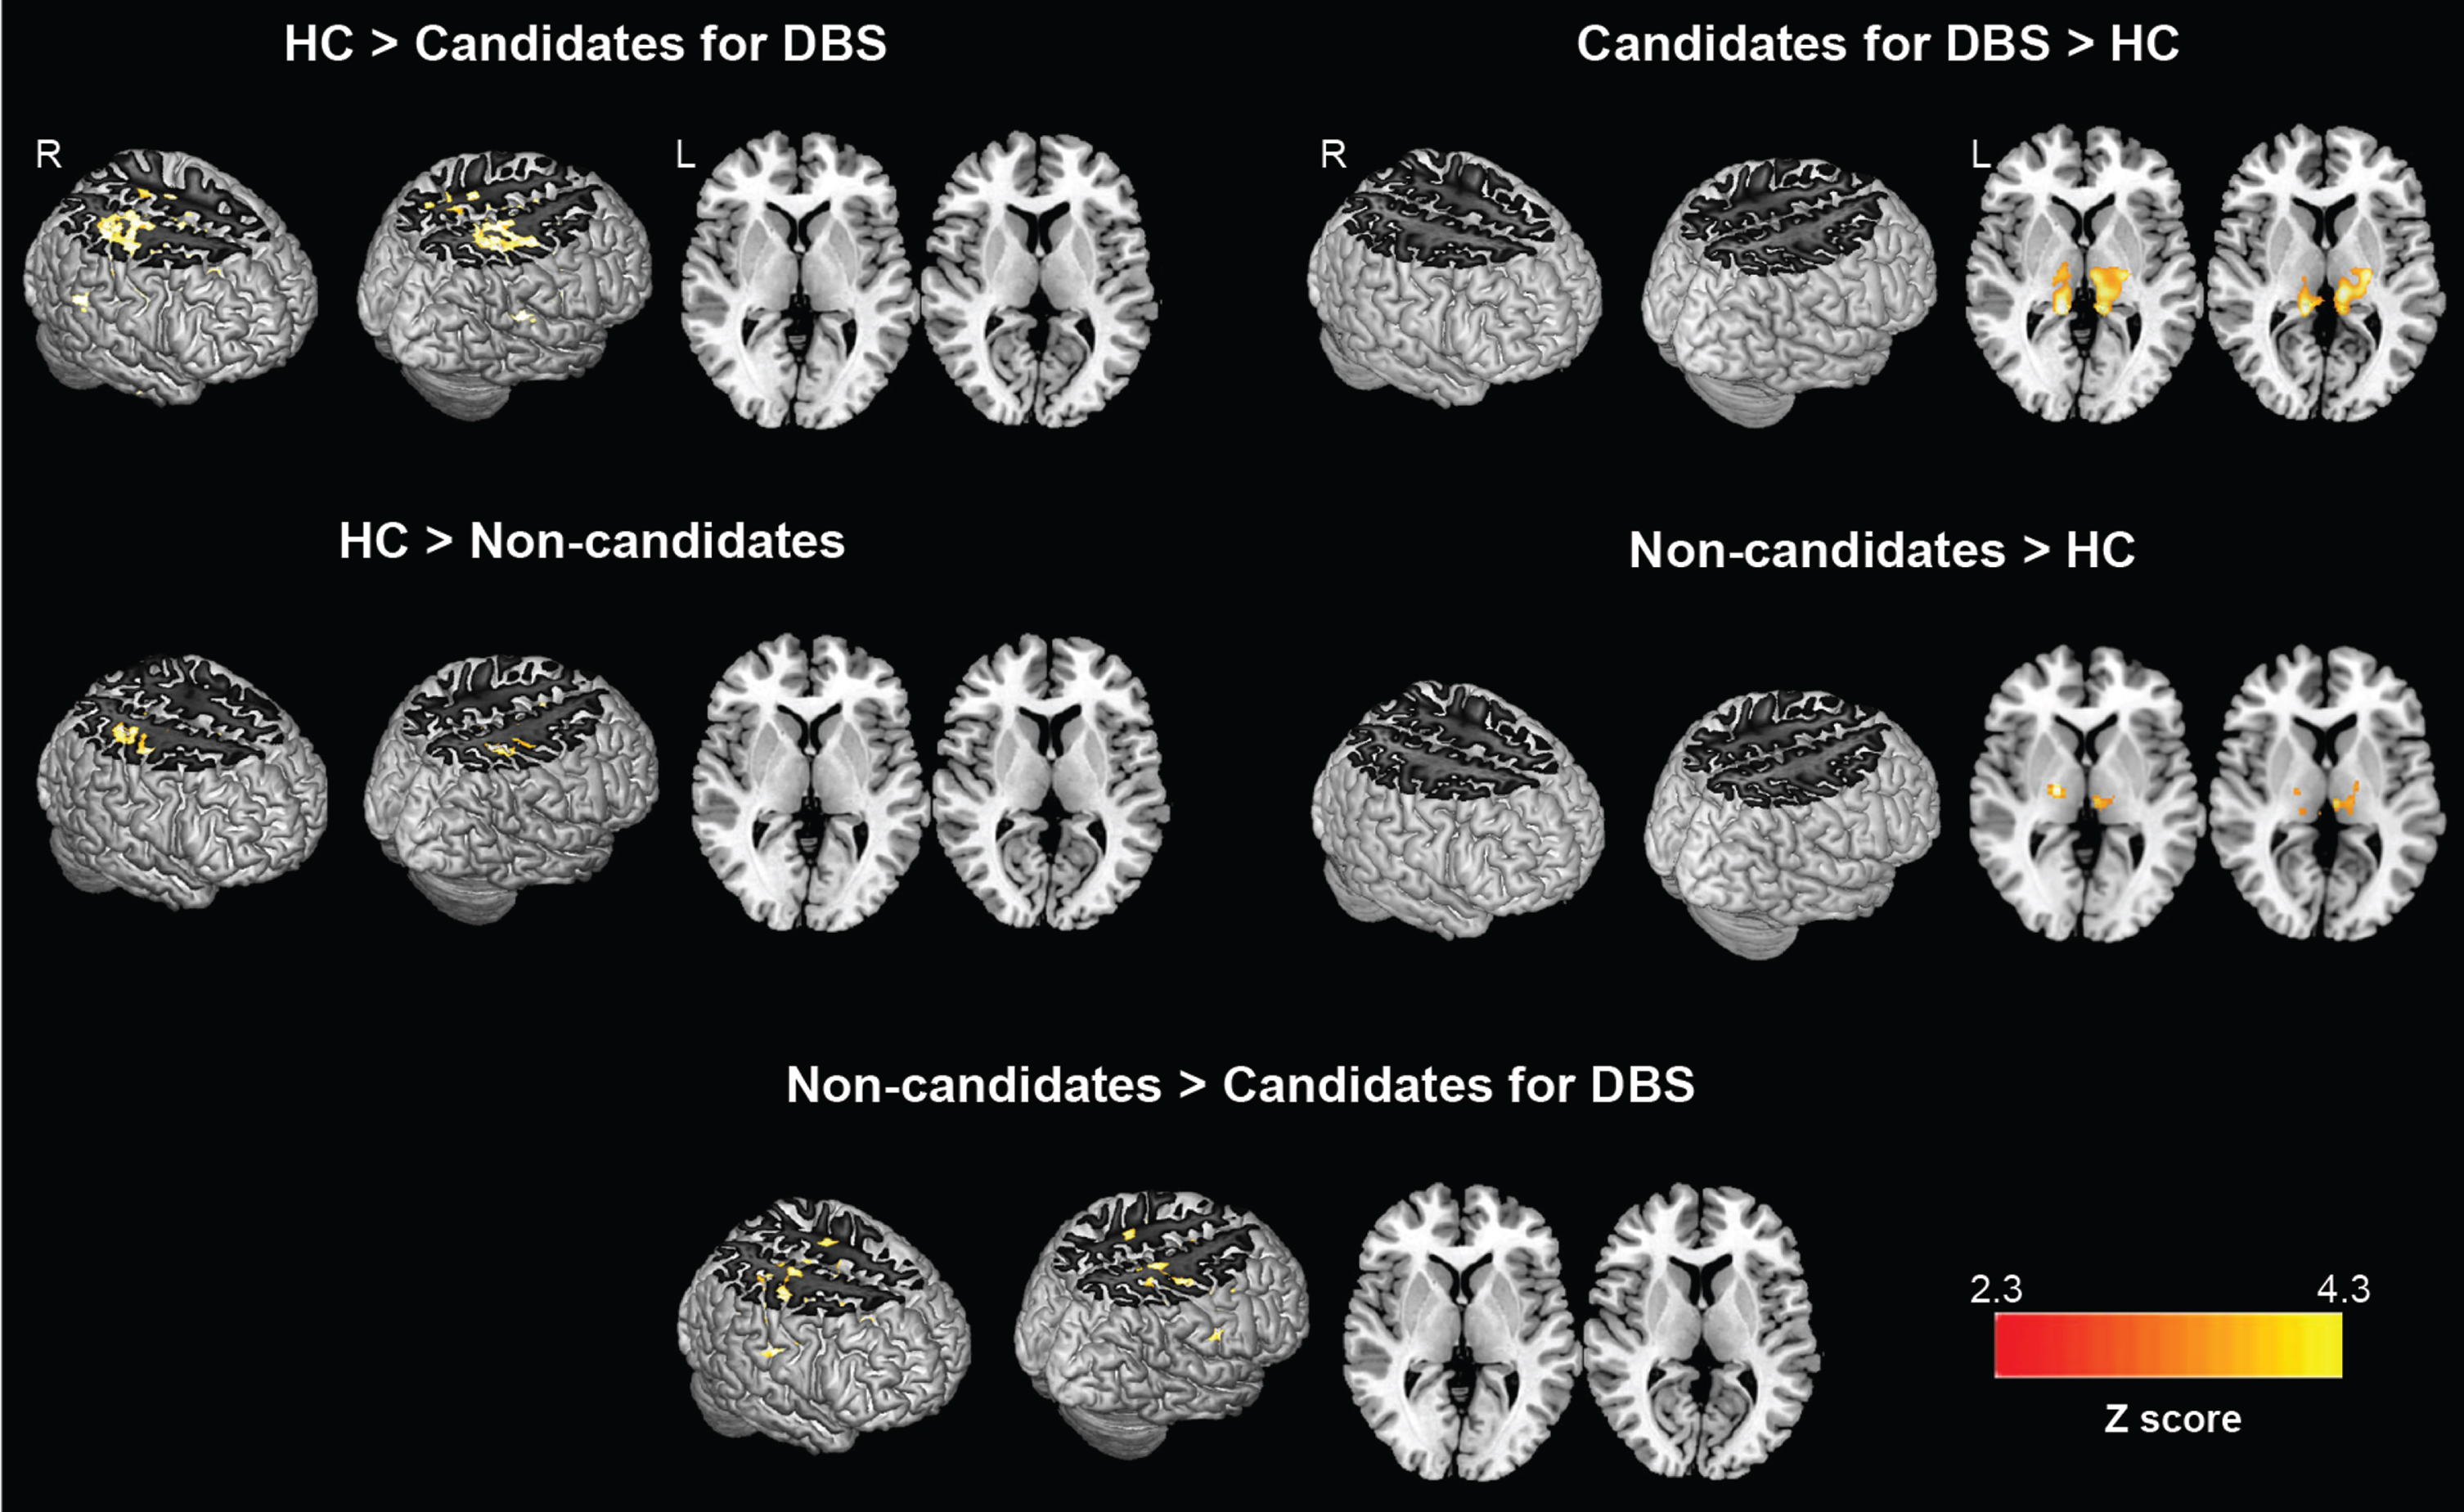
Table 2
Comparisons of seed-based functional connectivity between groups
| ↑↓FC | Areas | Z | x | y | z | BA |
| ↓ FC in DBS | R premotor-supplementary motor | 4.44 | 43 | –11 | 32 | 6 |
| candidates vs. | R sensory association | 4.44 | 26 | –38 | 56 | 5 |
| healthy controls | R primary sensory | 4.43 | 28 | –41 | 54 | 1 |
| L primary sensory | 4.34 | –62 | –12 | 22 | 1 | |
| L primary motor | 4.34 | –50 | –10 | 12 | 4 | |
| R primary motor | 4.27 | 36 | –22 | 54 | 4 | |
| L sensory association | 4.23 | –27 | –38 | 56 | 5 | |
| L premotor-supplementary motor | 4.22 | –50 | –6 | –12 | 6 | |
| R inferior temporal gyrus | 4.1 | 54 | –10 | –34 | 20 | |
| R supramarginal gyrus | 4.07 | 38 | –34 | 44 | 40 | |
| R Broca triangle | 3.67 | 42 | 20 | 10 | 45 | |
| ↑ FC in DBS | L thalamus | 4.09 | –6 | –16 | 0 | – |
| candidates vs. | R thalamus | 4.08 | 13 | –32 | 4 | – |
| healthy controls | L thalamus | 3.75 | –10 | –28 | 6 | – |
| L globus pallidus | 3.53 | –24 | –16 | 6 | – | |
| R globus pallidus | 3.41 | 23 | –9 | –6 | – | |
| ↓ FC in DBS | R premotor-supplementary motor | 3.96 | 36 | 1 | 30 | 6 |
| non-candidates vs. | L premotor-supplementary motor | 3.90 | –2 | 1 | 50 | 6 |
| healthy controls | L primary sensory | 3.55 | –64 | –14 | 22 | 1 |
| L primary motor | 3.49 | –42 | –12 | 18 | 4 | |
| R primary sensory | 3.47 | 29 | –37 | 50 | 1 | |
| R primary motor | 3.41 | 41 | –17 | 51 | 4 | |
| ↑ FC in DBS | R thalamus | 3.55 | 16 | –14 | 0 | – |
| non-candidates vs. | L thalamus | 3.07 | –4 | –16 | 0 | – |
| healthy controls | ||||||
| ↓ FC in DBS | R premotor-supplementary motor | 4.48 | 43 | –3 | 38 | 6 |
| candidates vs. | R primary sensory | 4.31 | 56 | –22 | 32 | 1 |
| non-candidates for DBS | R supramarginal gyrus | 4.29 | 58 | –18 | 20 | 40 |
| L premotor-supplementary motor | 4.40 | –50 | –6 | 12 | 6 | |
| L primary motor | 3.98 | –61 | –3 | 22 | 4 |
Coordinates (x, y, z) are in Montreal Neurological Institute (MNI) space. Results are shown at p < 0.05, family wise error (FWE) corrected for multiple comparisons implementing the threshold-free cluster enhancement, adjusting for age, sex and LEDD (the latter only between PD groups comparison). BA, Brodmann area; DBS, Deep brain stimulation; FC, Functional connectivity; L, left; R, right.
PD non-candidates for DBS vs. healthy controls
Relative to healthy controls, patients not eligible for DBS showed a reduced functional connectivity between bilateral STN and bilateral primary motor and somatosensory cortices (Fig. 2, Table 2). Furthermore, non-candidates for DBS showed an increased functional connectivity between bilateral STN and bilateral thalamus (Fig. 2, Table 2).
PD candidates vs. non-candidates for DBS
Patients eligible for DBS showed a decreased functional connectivity between bilateral STN and bilateral motor and somatosensory cortices, between bilateral STN and right supramarginal gyrus when compared to non-candidates for surgery (Fig. 2, Table 2). Since the motor signs and symptoms already differed between PD groups at baseline, analysis between candidates and non-candidates for DBS adding UPDRS total, part II, part III and part IV as covariates was performed and showed similar results to those obtained in the analysis without UPDRS correction (Supplementary Figure 1).
Correlation analysis
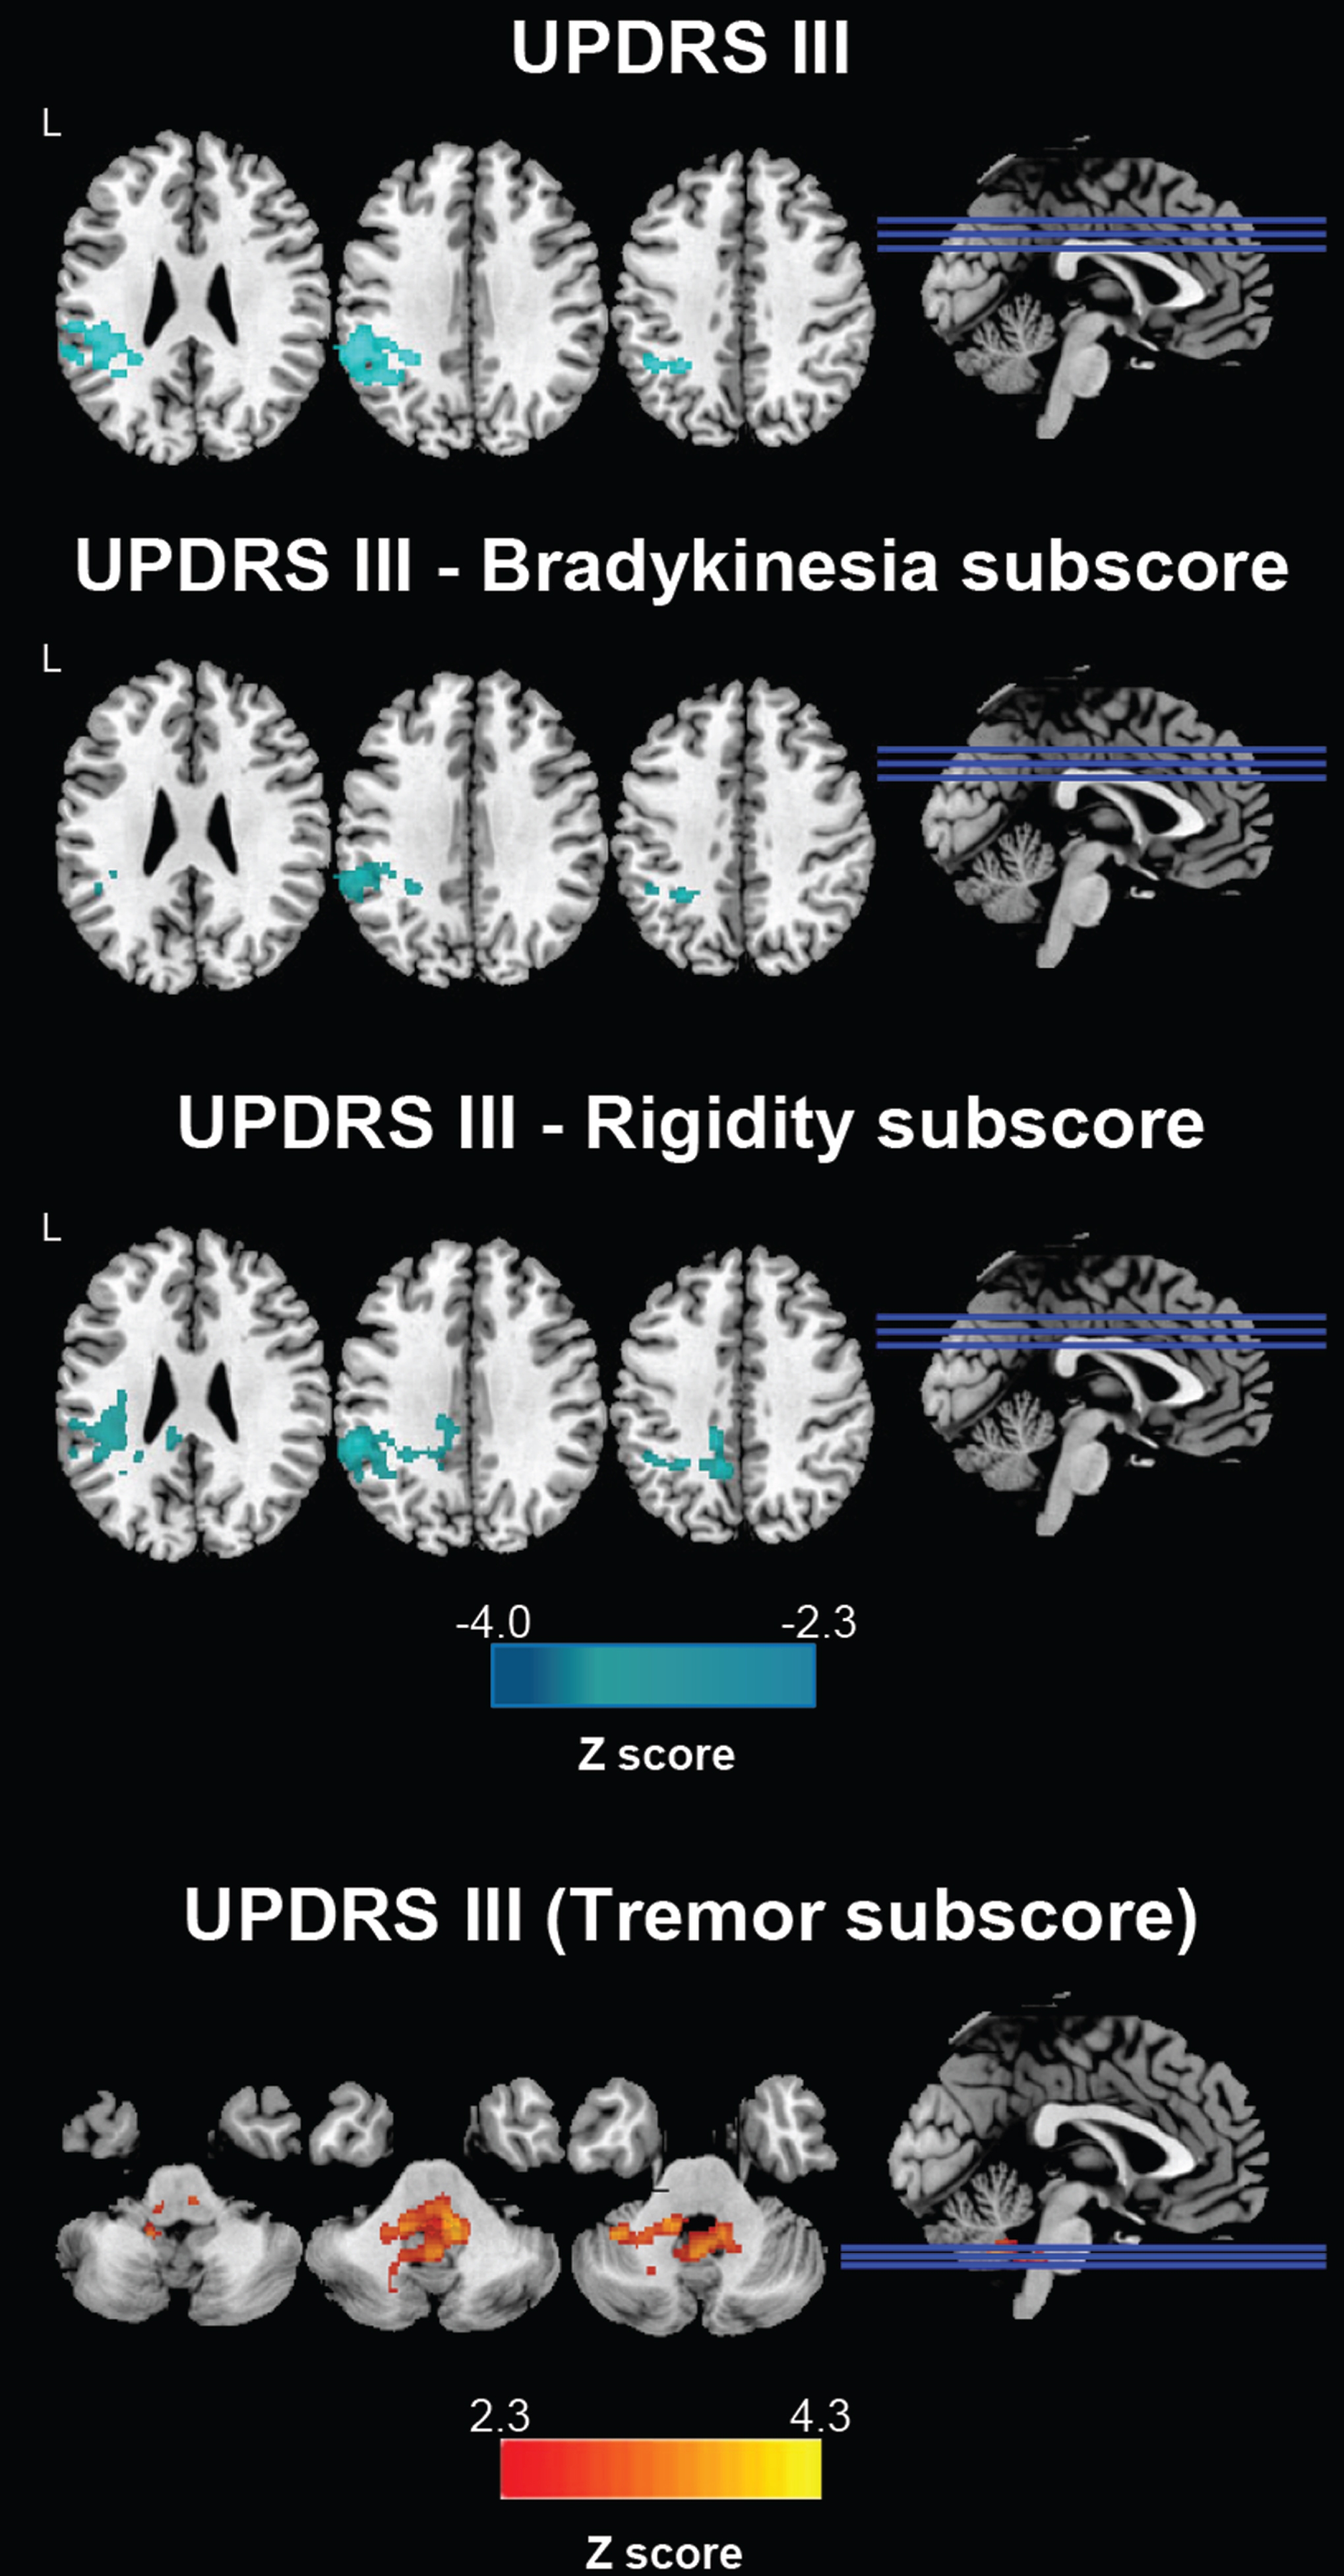
In patients eligible for DBS, a significant negative correlation was found between total UPDRS-III score and functional connectivity between bilateral STN and left supramarginal and angular gyrus (Fig. 3). Considering the UPDRS-III subscores, Fig. 3 shows that UPDRS-III bradykinesia and UPDRS-III rigidity were negatively related to functional connectivity between bilateral STN and left supramarginal and angular gyrus; on the contrary, UPDRS-III tremor subscore was positively related to functional connectivity between bilateral STN and cerebellum and pons (Fig. 3). No relation between clinical and fMRI data were found in PD patients not eligible for DBS.
Fig. 3
Correlations between STN functional connectivity and UPDRS-III scores in PD candidates for DBS. Clusters showing significant correlation between STN functional connectivity and UPDRS III values are marked in blue (Z negative correlation) and red (Z positive correlation) colors. DBS, candidates for deep brain stimulation; STN, subthalamic nucleus.
DISCUSSION
RS fMRI is a valuable measure of disease progression and will hopefully provide biomarkers to monitor functional brain network changes in PD, as well as in other neurological disorders [9]. In our previous study [17], the segmentation of gray matter according to Desikan atlas [30] did not involve bilateral STN, whereas bilateral thalamus, caudate, putamen, and globus pallidus were included in the basal ganglia. In that study we carried out a longitudinal whole brain analysis through graph analysis and connectomics. We evaluated properties of brain nodes connected by edges to identify the topological organization of brain network at study entry and over time in PD patients eligible or not for DBS, in order to find out brain network differences between groups and to look into identifying an early predictive biomarker of indication to DBS. We first made a whole brain analysis as it avoids a strong a priori selection-bias in the seed definition, which limits findings to functionally connected areas rather than looking at the whole brain level.
In this paper, since the hypothesis that the effectiveness of DBS in PD is related to connectivity dysfunctions between the site of the stimulation and other brain regions is growing [31], we looked at the specific functional connectivity between bilateral STN and the rest of the brain to determine if it differs between the two groups and if connectivity alterations are related to the severity of specific signs and symptoms. The following main findings were observed: 1) decreased bilateral STN-bilateral sensorimotor cortex functional connectivity in both PD groups relative to controls; 2) increased connectivity between bilateral STN and bilateral thalamus in both patients eligible or not for DBS compared to controls (albeit with lower Z-scores connectivity levels in patients not eligible for DBS); 3) decreased functional connectivity between bilateral STN and bilateral sensorimotor cortex in candidates for DBS relative to those patients not eligible for surgery.
STN is a crucial component of basal ganglia pathways that mediates inhibitory output from basal ganglia to cortical sensorimotor areas [32]. It is well known, given previous neurophysiological studies and the basal ganglia pathway, that compared to healthy controls PD patients have an abnormal increased STN neuronal activity, which results in excessive inhibitory outflow from the basal ganglia to the cortex [32]. Furthermore, neurophysiological studies showed that STN neuronal activity changes according to the off- or on-status of the patients. In more detail, intraoperative local field potential recordings from the STN of patients undergoing DBS (off-status) confirmed a strong oscillatory activity, mainly in the beta band (13–35 Hz) [33]; on the contrary, STN beta activity was reduced both under levodopa and DBS activity (on-status) [34].
To date, few RS fMRI studies have explored STN functional connectivity in healthy subjects and PD patients [6, 32, 35, 36]. In healthy subjects, STN was predominantly functionally linked to subcortical structures, frontal cortex, temporal cortex, and cerebellum [6]. Increased functional connectivity of STN with sensorimotor cortex was observed in off-medication PD patients relative to controls, whereas no changes or reduced functional connectivity were reported in on-medication cases compared to controls [32, 35, 36].
In line with neurophysiological studies and previous fMRI results from PD patients in on-status, we found a reduced functional connectivity between STN and sensorimotor cortex in both PD patients eligible or not for DBS compared to controls (with lower z scores in the former PD group) in association with an increased functional connectivity between STN and thalamus/globus pallidus (with higher z scores in the former PD group). The decreased functional connectivity between STN and sensorimotor cortex in patients eligible for surgery relative to non-candidates for neurostimulation could be secondary to the worse response to dopaminergic therapy in the former group (supported by the presence of more severe motor signs and symptoms in the group of DBS candidates who required a slightly higher LEDD).
Importantly, in patients eligible for DBS motor signs severity correlated with the decreased functional connectivity between STN and somatosensory association cortex. Indeed, in candidates for DBS, we observed that increased UPDRS III total, and UPDRS III bradykinesia and rigidity subscores, were related to decreased functional connectivity between bilateral STN and left supramarginal and angular gyri. Similar results were already reported by Mathys et al. [35], who explored the relationship between the severity of PD-related motor symptoms and STN functional connectivity with other brain regions. These findings are not surprising as the inferior parietal lobe is a sensorimotor associative area that plays an important role in the integration of spatial and temporal sensory inputs, being involved in the perception of space and limb location and in controlling postures and gestures [37, 38]. Inferior parietal cortex is also identified as a key region for executive functions such as movement planning and organization and motor inhibition, which are usually altered in PD patients [39, 40]. Interestingly, electrophysiological evidence suggested that STN DBS in PD patients induced a decreased cortico-cortical synchronization of sensorimotor areas that was associated with improvement of motor signs [37, 41].
We also found that a more severe tremor (higher UPDRS III tremor subscore) was related with an increased functional connectivity between STN and cerebellum/pons in patients eligible for DBS. Our results further support the well-known hypothesis that the cerebellum is deeply involved in tremor generation in PD as the dentate-rubro-thalamo-cortical network dysfunction is one of the main causes of tremor symptom [18]. In addition, the peduncolopontine nucleus, located in the dorso-lateral portion of the ponto-mesenchephalic tegmentus, is a potential target for DBS therapy in PD, as it has been shown to improve tremor and more recently gait, freezing, and falls [42, 43]. However, the evidence supporting such an effect is still minimal. Development of pedunculopontine nucleus DBS to become a reliable, established therapy would likely require a prospective multicenter study [43].
This study is not without limitations. First, the sample size is relatively small and is not homogeneous between PD groups; further studies with a larger patient population are needed to verify and support our results. Secondly, PD patients were assessed in on-status. Even if without statistically significant difference between groups, LEDD was slightly higher in candidates for DBS. However, our analysis accounted for LEDD correction. Thirdly, we used a 1.5 T MRI scanner, which is characterized by a lower BOLD signal-to-noise ratio compared with higher field scanners. Fourth, the difference in connectivity among PD groups could simply be a reflection of UPDRS severity. Candidates for DBS met the criteria for neurostimulation treatment precisely because their motor characteristics, which already differed from the other group of patients at study entry, continued to get worse over time despite medication adjustment. Therefore, we definitely compared a group of patients with more severe motor signs, crucial feature to candidate PD patients for DBS, to the other group with similar demographic features, disease stage, and duration. However, an analysis between candidates and non-candidates for DBS adding UPDRS total, part II, part III, and part IV as covariates was performed and showed similar results to those obtained from the analysis without UPDRS correction (Supplementary Figure 1). Furthermore, patients selected as candidates for DBS did not undergo surgery at this stage. Future analyses with the investigated functional networks and postoperative clinical outcomes would be imperative.
CONCLUSIONS
To conclude, our results showed that STN functional connectivity varies among PD patients candidate or not for DBS and is related to the severity of motor signs and symptoms in the former group. Our findings also confirm the basal ganglia circuitry disfunction in PD and support the hypothesis that DBS may work by modulating and restoring connectivity between basal ganglia and sensorimotor areas. Future studies would be crucial to understand how DBS modulates and restores functional connectivity between STN and sensorimotor areas in treated patients.
ACKNOWLEDGMENTS
The authors thank the patients and their families for the time and effort they dedicated to the research. This work was supported by the Ministry of Education, Science, and Technological Development of the Republic of Serbia [grant number #175090] and the Italian Ministry of Health [grant number # RF-2018-12366746].
CONFLICT OF INTEREST
L. Albano was a recipient of the Lars Leksell Fellowship.
F. Agosta is Section Editor of Neuroimage: Clinical; has received speaker honoraria from Biogen Idec, Roche, Italfarmaco and Zambon; and receives or has received research supports from the Italian Ministry of Health, the Italian Ministry of University and Research, Arisla (Fondazione Italiana di Ricerca per la SLA), Fondation Recherche Alzheimer (France) and the European Research Council.
S. Basaia, C. Cividini, E. Sarasso, I Stankovic, V. Markovic, P. Mortini declare no competing interests.
T. Stojkovic and E. Stefanova have received Alzheimer Association grant for Promoting Diversity, from 2018 and honoraria from Actavis.
A. Tomic has received honoraria for serving as a consultant to and on the advisory board of Univar BV.
V.S. Kostic has received speaker honoraria from Roche and Alkaloid and receives research supports from the Swiss Pharm and Serbian Ministry of Education, Science, and Development and Serbian Academy of Sciences and Art.
M. Filippi is Editor-in-Chief of the Journal of Neurology, Associate Editor of Human Brain Mapping, Associate Editor of Radiology, and Associate Editor of Neurological Sciences; received compensation for consulting services from Alexion, Almirall, Biogen, Merck, Novartis, Roche, Sanofi; speaking activities from Bayer, Biogen, Celgene, Chiesi Italia SpA, Eli Lilly, Genzyme, Janssen, Merck-Serono, Neopharmed Gentili, Novartis, Novo Nordisk, Roche, Sanofi, Takeda, and TEVA; participation in Advisory Boards for Alexion, Biogen, Bristol-Myers Squibb, Merck, Novartis, Roche, Sanofi, Sanofi-Aventis, Sanofi-Genzyme, Takeda; scientific direction of educational events for Biogen, Merck, Roche, Celgene, Bristol-Myers Squibb, Lilly, Novartis, Sanofi-Genzyme; and receives research support from Biogen Idec, Merck-Serono, Novartis, Roche, Italian Ministry of Health, and Fondazione Italiana Sclerosi Multipla..
DATA AVAILABILITY
The dataset used and analyzed during the current study will be made available by the corresponding author upon request to qualified researchers (i.e., affiliated to a university or research institution/hospital).
SUPPLEMENTARY MATERIAL
[1] The supplementary material is available in the electronic version of this article: http://dx.doi.org/10.3233/JPD-230005.
REFERENCES
[1] | Poewe W , Seppi K , Tanner CM , Halliday GM , Brundin P , Volkmann J , Schrag AE , Lang AE ((2017) ) Parkinson disease. Nat Rev Dis Primers 3: , 17013. |
[2] | McGregor MM , Nelson AB ((2019) ) Circuit mechanisms of Parkinson’s disease. Neuron 101: , 1042–1056. |
[3] | Schuepbach WM , Rau J , Knudsen K , Volkmann J , Krack P , Timmermann L , Halbig TD , Hesekamp H , Navarro SM , Meier N , Falk D , Mehdorn M , Paschen S , Maarouf M , Barbe MT , Fink GR , Kupsch A , Gruber D , Schneider GH , Seigneuret E , Kistner A , Chaynes P , Ory-Magne F , Brefel Courbon C , Vesper J , Schnitzler A , Wojtecki L , Houeto JL , Bataille B , Maltete D , Damier P , Raoul S , Sixel-Doering F , Hellwig D , Gharabaghi A , Kruger R , Pinsker MO , Amtage F , Regis JM , Witjas T , Thobois S , Mertens P , Kloss M , Hartmann A , Oertel WH , Post B , Speelman H , Agid Y , Schade-Brittinger C , Deuschl G , EARLYSTIM Study Group ((2013) ) Neurostimulation for Parkinson’s disease with early motor complications. N Engl J Med 368: , 610–622. |
[4] | Follett KA , Weaver FM , Stern M , Hur K , Harris CL , Luo P , Marks WJ Jr., Rothlind J , Sagher O , Moy C , Pahwa R , Burchiel K , Hogarth P , Lai EC , Duda JE , Holloway K , Samii A , Horn S , Bronstein JM , Stoner G , Starr PA , Simpson R , Baltuch G , De Salles A , Huang GD , Reda DJ , CSP 468 Study Group ((2010) ) Pallidal versus subthalamic deep-brain stimulation for Parkinson’s disease. N Engl J Med 362: , 2077–2091. |
[5] | Lhommee E , Wojtecki L , Czernecki V , Witt K , Maier F , Tonder L , Timmermann L , Halbig TD , Pineau F , Durif F , Witjas T , Pinsker M , Mehdorn M , Sixel-Doring F , Kupsch A , Kruger R , Elben S , Chabardes S , Thobois S , Brefel-Courbon C , Ory-Magne F , Regis JM , Maltete D , Sauvaget A , Rau J , Schnitzler A , Schupbach M , Schade-Brittinger C , Deuschl G , Houeto JL , Krack P , group Es ((2018) ) Behavioural outcomes of subthalamic stimulation and medical therapy versus medical therapy alone for Parkinson’s disease with early motor complications (EARLYSTIM trial): Secondary analysis of an open-label randomised trial. Lancet Neurol 17: , 223–231. |
[6] | Brunenberg EJ , Moeskops P , Backes WH , Pollo C , Cammoun L , Vilanova A , Janssen ML , Visser-Vandewalle VE , ter Haar Romeny BM , Thiran JP , Platel B ((2012) ) Structural and resting state functional connectivity of the subthalamic nucleus: Identification of motor STN parts and the hyperdirect pathway. PLoS One 7: , e39061. |
[7] | Hamani C , Saint-Cyr JA , Fraser J , Kaplitt M , Lozano AM ((2004) ) The subthalamic nucleus in the context of movement disorders. Brain 127: , 4–20. |
[8] | Temel Y , Blokland A , Steinbusch HW , Visser-Vandewalle V ((2005) ) The functional role of the subthalamic nucleus in cognitive and limbic circuits. Prog Neurobiol 76: , 393–413. |
[9] | Cerasa A , Novellino F , Quattrone A ((2016) ) Connectivity changes in Parkinson’s disease. Curr Neurol Neurosci Rep 16: , 91. |
[10] | Filippi M , Sarasso E , Agosta F ((2019) ) Resting-state functional MRI in parkinsonian syndromes. Mov Disord Clin Pract 6: , 104–117. |
[11] | Filippi M , Basaia S , Sarasso E , Stojkovic T , Stankovic I , Fontana A , Tomic A , Piramide N , Stefanova E , Markovic V , Kostic VS , Agosta F ((2021) ) Longitudinal brain connectivity changes and clinical evolution in Parkinson’s disease. Mol Psychiatry 26: , 5429–5440. |
[12] | Baggio HC , Sala-Llonch R , Segura B , Marti MJ , Valldeoriola F , Compta Y , Tolosa E , Junque C ((2014) ) Functional brain networks and cognitive deficits in Parkinson’s disease. Hum Brain Mapp 35: , 4620–4634. |
[13] | Suo X , Lei D , Li N , Cheng L , Chen F , Wang M , Kemp GJ , Peng R , Gong Q ((2017) ) Functional brain connectome and its relation to Hoehn and Yahr stage in Parkinson disease. Radiology 285: , 904–913. |
[14] | Filippi M , Elisabetta S , Piramide N , Agosta F ((2018) ) Functional MRI in idiopathic Parkinson’s disease. Int Rev Neurobiol 141: , 439–467. |
[15] | Filippi M , Spinelli EG , Cividini C , Agosta F ((2019) ) Resting state dynamic functional connectivity in neurodegenerative conditions: A review of magnetic resonance imaging findings. Front Neurosci 13: , 657. |
[16] | Younce JR , Campbell MC , Hershey T , Tanenbaum AB , Milchenko M , Ushe M , Karimi M , Tabbal SD , Kim AE , Snyder AZ , Perlmutter JS , Norris SA ((2021) ) Resting-state functional connectivity predicts STN DBS clinical response. Mov Disord 36: , 662–671. |
[17] | Albano L , Agosta F , Basaia S , Cividini C , Stojkovic T , Sarasso E , Stankovic I , Tomic A , Markovic V , Stefanova E , Mortini P , Kostic VS , Filippi M ((2022) ) Functional connectivity in Parkinson’s disease candidates for deep brain stimulation. NPJ Parkinsons Dis 8: , 4. |
[18] | Basaia S , Agosta F , Francia A , Cividini C , Balestrino R , Stojkovic T , Stankovic I , Markovic V , Sarasso E , Gardoni A , De Micco R , Albano L , Stefanova E , Kostic VS , Filippi M ((2022) ) Cerebro-cerebellar motor networks in clinical subtypes of Parkinson’s disease. NPJ Parkinsons Dis 8: , 113. |
[19] | Postuma RB , Berg D , Stern M , Poewe W , Olanow CW , Oertel W , Obeso J , Marek K , Litvan I , Lang AE , Halliday G , Goetz CG , Gasser T , Dubois B , Chan P , Bloem BR , Adler CH , Deuschl G ((2015) ) MDS clinical diagnostic criteria for Parkinson’s disease. Mov Disord 30: , 1591–1601. |
[20] | Emre M , Aarsland D , Brown R , Burn DJ , Duyckaerts C , Mizuno Y , Broe GA , Cummings J , Dickson DW , Gauthier S , Goldman J , Goetz C , Korczyn A , Lees A , Levy R , Litvan I , McKeith I , Olanow W , Poewe W , Quinn N , Sampaio C , Tolosa E , Dubois B ((2007) ) Clinical diagnostic criteria for dementia associated with Parkinson’s disease. Mov Disord 22: , 1689–1707; quiz 1837. |
[21] | Hamilton M ((1960) ) A rating scale for depression. J Neurol Neurosurg Psychiatry 23: , 56–62. |
[22] | Tomlinson CL , Stowe R , Patel S , Rick C , Gray R , Clarke CE ((2010) ) Systematic review of levodopa dose equivalency reporting in Parkinson’s disease. Mov Disord 25: , 2649–2653. |
[23] | Hoehn MM , Yahr MD ((1967) ) Parkinsonism: Onset, progression and mortality. Neurology 17: , 427–442. |
[24] | Movement Disorder Society Task Force on Rating Scales for Parkinson’s Disease ((2003) ) The Unified Parkinson’s Disease Rating Scale (UPDRS): Status and recommendations. Mov Disord 18: , 738–750. |
[25] | Barbey A , Aybek S ((2017) ) Functional movement disorders. Curr Opin Neurol 30: , 427–434. |
[26] | Greve DN , Fischl B ((2009) ) Accurate and robust brain image alignment using boundary-based registration. Neuroimage 48: , 63–72. |
[27] | Andersson J , Jenkinson M , Smith S (2007) FMRIBtechnical report TR07JA2. FMRIB Analysis Group of the University of Oxford. |
[28] | Beckmann CF , DeLuca M , Devlin JT , Smith SM ((2005) ) Investigations into resting-state connectivity using independent component analysis. Philos Trans R Soc Lond B Biol Sci 360: , 1001–1013. |
[29] | Worsley KJ , Marrett S , Neelin P , Vandal AC , Friston KJ , Evans AC ((1996) ) A unified statistical approach for determining significant signals in images of cerebral activation. Hum Brain Mapp 4: , 58–73. |
[30] | Desikan RS , Segonne F , Fischl B , Quinn BT , Dickerson BC , Blacker D , Buckner RL , Dale AM , Maguire RP , Hyman BT , Albert MS , Killiany RJ ((2006) ) An automated labeling system for subdividing the human cerebral cortex on MRI scans into gyral based regions of interest. Neuroimage 31: , 968–980. |
[31] | Albano L , Basaia S , Emedoli D , Balestrino R , Pompeo E , Barzaghi LR , Castellano A , Falini A , Iannaccone S , Mortini P , Filippi M , Agosta F (2023) Longitudinal brain functional connectivity changes induced by neurosurgical thalamotomy for tremor in Parkinson’s disease:Apreliminary study. J Neurol. doi: 10.1007/s00415-023-11705-2. |
[32] | Jia Q , Gao L , Zhang J , Wu T , Chan P ((2018) ) Altered functional connectivity of the subthalamic nucleus during self-initiated movement in Parkinson’s disease. J Neuroradiol 45: , 249–255. |
[33] | Kuhn AA , Williams D , Kupsch A , Limousin P , Hariz M , Schneider GH , Yarrow K , Brown P ((2004) ) Event-related beta desynchronization in human subthalamic nucleus correlates with motor performance. Brain 127: , 735–746. |
[34] | Kuhn AA , Kempf F , Brucke C , Gaynor Doyle L , Martinez-Torres I , Pogosyan A , Trottenberg T , Kupsch A , Schneider GH , Hariz MI , Vandenberghe W , Nuttin B , Brown P ((2008) ) High-frequency stimulation of the subthalamic nucleus suppresses oscillatory beta activity in patients with Parkinson’s disease in parallel with improvement in motor performance. J Neurosci 28: , 6165–6173. |
[35] | Mathys C , Caspers J , Langner R , Sudmeyer M , Grefkes C , Reetz K , Moldovan AS , Michely J , Heller J , Eickhoff CR , Turowski B , Schnitzler A , Hoffstaedter F , Eickhoff SB ((2016) ) Functional connectivity differences of the subthalamic nucleus related to Parkinson’s disease. Hum Brain Mapp 37: , 1235–1253. |
[36] | Shen B , Gao Y , Zhang W , Lu L , Zhu J , Pan Y , Lan W , Xiao C , Zhang L ((2017) ) Resting state fMRI reveals increased subthalamic nucleus and sensorimotor cortex connectivity in patients with Parkinson’s disease under medication. Front Aging Neurosci 9: , 74. |
[37] | Arnold Anteraper S , Guell X , Whitfield-Gabrieli S , Triantafyllou C , Mattfeld AT , Gabrieli JD , Geddes MR ((2018) ) Resting-state functional connectivity of the subthalamic nucleus to limbic, associative, and motor networks. Brain Connect 8: , 22–32. |
[38] | Tomic A , Agosta F , Sarasso E , Svetel M , Kresojevic N , Fontana A , Canu E , Petrovic I , Kostic VS , Filippi M ((2021) ) Brain structural changes in focal dystonia-what about task specificity? A multimodal MRI study. Mov Disord 36: , 196–205. |
[39] | Piramide N , Agosta F , Sarasso E , Canu E , Volonte MA , Filippi M ((2020) ) Brain activity during lower limb movements in Parkinson’s disease patients with and without freezing of gait. J Neurol 267: , 1116–1126. |
[40] | Sarasso E , Gardoni A , Piramide N , Volonte MA , Canu E , Tettamanti A , Filippi M , Agosta F ((2021) ) Dual-task clinical and functional MRI correlates in Parkinson’s disease with postural instability and gait disorders. Parkinsonism Relat Disord 91: , 88–95. |
[41] | Weiss D , Klotz R , Govindan RB , Scholten M , Naros G , Ramos-Murguialday A , Bunjes F , Meisner C , Plewnia C , Kruger R , Gharabaghi A ((2015) ) Subthalamic stimulation modulates cortical motor network activity and synchronization in Parkinson’s disease. Brain 138: , 679–693. |
[42] | Khan S , Gill SS , Mooney L , White P , Whone A , Brooks DJ , Pavese N ((2012) ) Combined pedunculopontine-subthalamic stimulation in Parkinson disease. Neurology 78: , 1090–1095. |
[43] | Thevathasan W , Debu B , Aziz T , Bloem BR , Blahak C , Butson C , Czernecki V , Foltynie T , Fraix V , Grabli D , Joint C , Lozano AM , Okun MS , Ostrem J , Pavese N , Schrader C , Tai CH , Krauss JK , Moro E , Movement Disorders Society PPN DBS Working Group in collaboration with the World Society for Stereotactic and Functional Neurosurgery ((2018) ) Pedunculopontine nucleus deep brain stimulation in Parkinson’s disease: A clinical review. Mov Disord 33: , 10–20. |


