
Mapping Relevance of Digital Measures to Meaningful Symptoms and Impacts in Early Parkinson’s Disease
Abstract
Background:
Adoption of new digital measures for clinical trials and practice has been hindered by lack of actionable qualitative data demonstrating relevance of these metrics to people with Parkinson’s disease.
Objective:
This study evaluated of relevance of WATCH-PD digital measures to monitoring meaningful symptoms and impacts of early Parkinson’s disease from the patient perspective.
Methods:
Participants with early Parkinson’s disease (N = 40) completed surveys and 1:1 online-interviews. Interviews combined: 1) symptom mapping to delineate meaningful symptoms/impacts of disease, 2) cognitive interviewing to assess content validity of digital measures, and 3) mapping of digital measures back to personal symptoms to assess relevance from the patient perspective. Content analysis and descriptive techniques were used to analyze data.
Results:
Participants perceived mapping as deeply engaging, with 39/40 reporting improved ability to communicate important symptoms and relevance of measures. Most measures (9/10) were rated relevant by both cognitive interviewing (70–92.5%) and mapping (80–100%). Two measures related to actively bothersome symptoms for more than 80% of participants (Tremor, Shape rotation). Tasks were generally deemed relevant if they met three participant context criteria: 1) understanding what the task measured, 2) believing it targeted an important symptom of PD (past, present, or future), and 3) believing the task was a good test of that important symptom. Participants did not require that a task relate to active symptoms or “real” life to be relevant.
Conclusion:
Digital measures of tremor and hand dexterity were rated most relevant in early PD. Use of mapping enabled precise quantification of qualitative data for more rigorous evaluation of new measures.
INTRODUCTION
Current clinical outcome measures do not perform well in people with early Parkinson’s disease (PD), and there is an urgent need to develop more sensitive measures to support development of new therapeutics [1, 2]. Digital health technologies (DHTs) can capture finer variations in symptoms across a range of neurological conditions and hold great potential for monitoring disease progression and responsiveness to treatment [3–5], which has led to increasing use in clinical trials [6–8].
Although capable of detecting symptoms at more granular levels than standard clinical monitoring methods [9–11], these resources remain underutilized [12], with poor understanding as to whether new technologies are capturing aspects of disease that are meaningful from the patient perspective— which is a key consideration in regulatory approval of new devices [13–16]. This has led to increased emphasis on need for patient centric approaches to developing digital outcome measures (i.e., prioritizing sensor features relevant to patients’ functioning in everyday life) [13], and recommendations to define meaningful aspects of health [17, 18]. However, pursuit of actionable patient experience data has proved challenging, with quantitative approaches being generally inadequate to capture the depth of personal experiences, and qualitative approaches lacking the consistency and precision needed to determine prevalence of perspectives and experiences [13]. This has resulted in difficulty connecting patient experiences to digital measures in a way that is useful, scalable, and translatable to other contexts [19]. Thus, new approaches for identifying meaningful aspects of health and relevance of potential monitoring technologies are needed to support the selection of endpoints for clinical trials [8, 13, 20]. This paper describes a mixed-methods study that utilized novel symptom mapping techniques to evaluate relevance of digital monitoring technology to people with early PD. The specific aims were to understand whether WATCH-PD smartphone and smartwatch measures were considered relevant to monitoring meaningful aspects of disease and disease progression from the patient perspective.
METHODS
Study background
This study was designed under guidance of the Critical Path for Parkinson’s Consortium, US Food & Drug Administration (FDA), industry and academic partners, and people with Parkinson’s. The study was conducted in follow up to the WATCH-PD (Wearable Assessments in The Clinic and at Home in PD) study [21], hereafter termed “parent study.” The WATCH-PD parent study was a 12-month multi-center observational trial that evaluated ability of smartwatch and smartphone applications to monitor PD symptoms and disease progression in people with early, untreated PD (≤2 years diagnosis, Hoehn & Yahr stage≤2). Eighty-two individuals with PD and 50 controls completed in-clinic visits at baseline, 1, 3, 6, 9, and 12 months, and in-home assessments of ten smartphone and smartwatch-based tasks related to motor and cognitive function (Table 1) bi-weekly for one year (IRB#00003002; NCT03681015).
Table 1
WATCH-PD digital measures evaluated for relevance from the patient perspective
| TASK NAME | DOMAIN MEASURED | ACTIONS REQUIRED TO PERFORM ASSESSMENT | PICTOGRAPH | |
| Smartwatch | Walking &Balance | Gait/balance | (1) Participant walks straight line for 1 minute. (2) Participant stands with arms at sides for 30 seconds. | 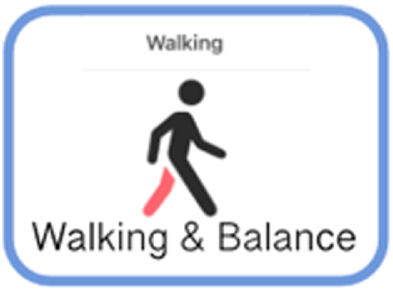 |
| Tremor Task | Tremor | (1) Participant rests hands in lap for 10 seconds. (2) Participant extends arms out in front for 10 seconds. | 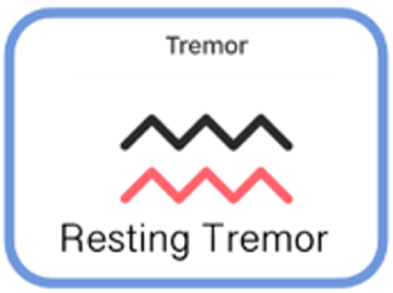 | |
| Smartphone Application | Finger Tapping | Fine motor | Participant performs rapid alternating finger movements by tapping two side-by-side targets using index and middle fingers. | 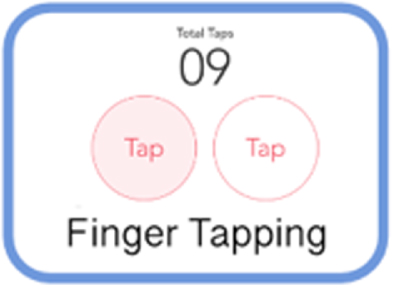 |
| Shape Rotation | Fine motor | Participant uses 1-2 fingers to move and rotate a pink object into the object outline as quickly as possible. | 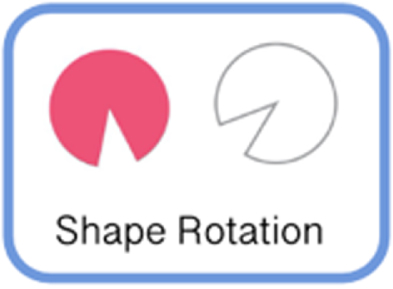 | |
| Verbal Articulation | Speech | Participants performs sustained phonation task 15 seconds. | 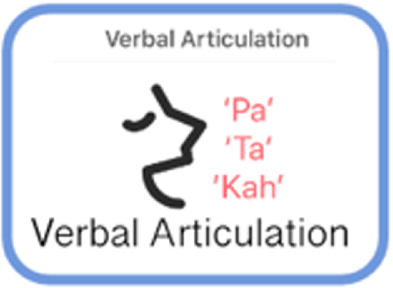 | |
| Visual Reading | Speech | Participants reads a series of sentences printed on the screen. |  | |
| Sustained Phonation | Speech | Participants repeats the syllables “pa ta ka,” for 15 seconds. | 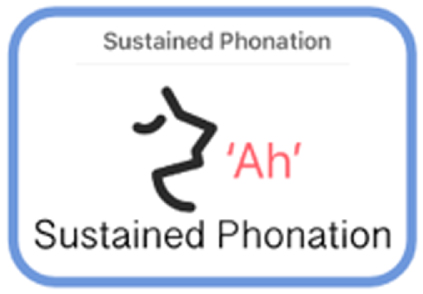 | |
| Digit Symbol Substitution | Thinking | Participant is presented with a symbol and must speak aloud the corresponding number from a key. | 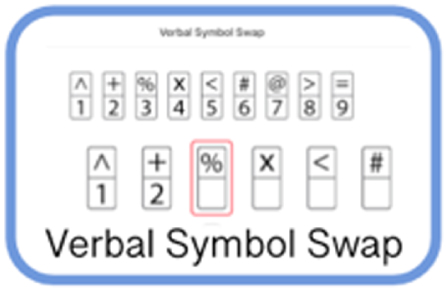 | |
| Visuo-Spatial Working Memory | Thinking | Participant is briefly shown four different colored boxes followed by a single, colored box and must indicate if the single box was in the previous set of four. | 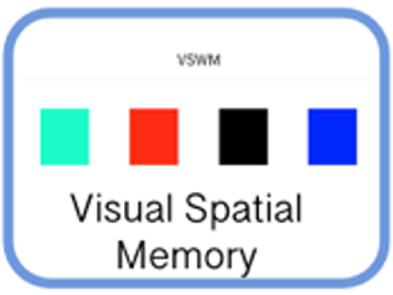 | |
| Trail Making Task | Thinking | Participant must trace a set of alpha-numeric dots as quickly and accurately as possible using the index finger of the dominant hand. | 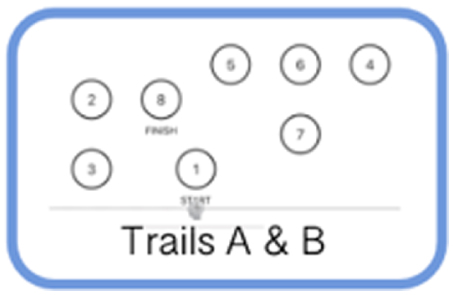 |
BrainBaseline application screenshots reprinted with permission from Clinical ink.
Setting, sample
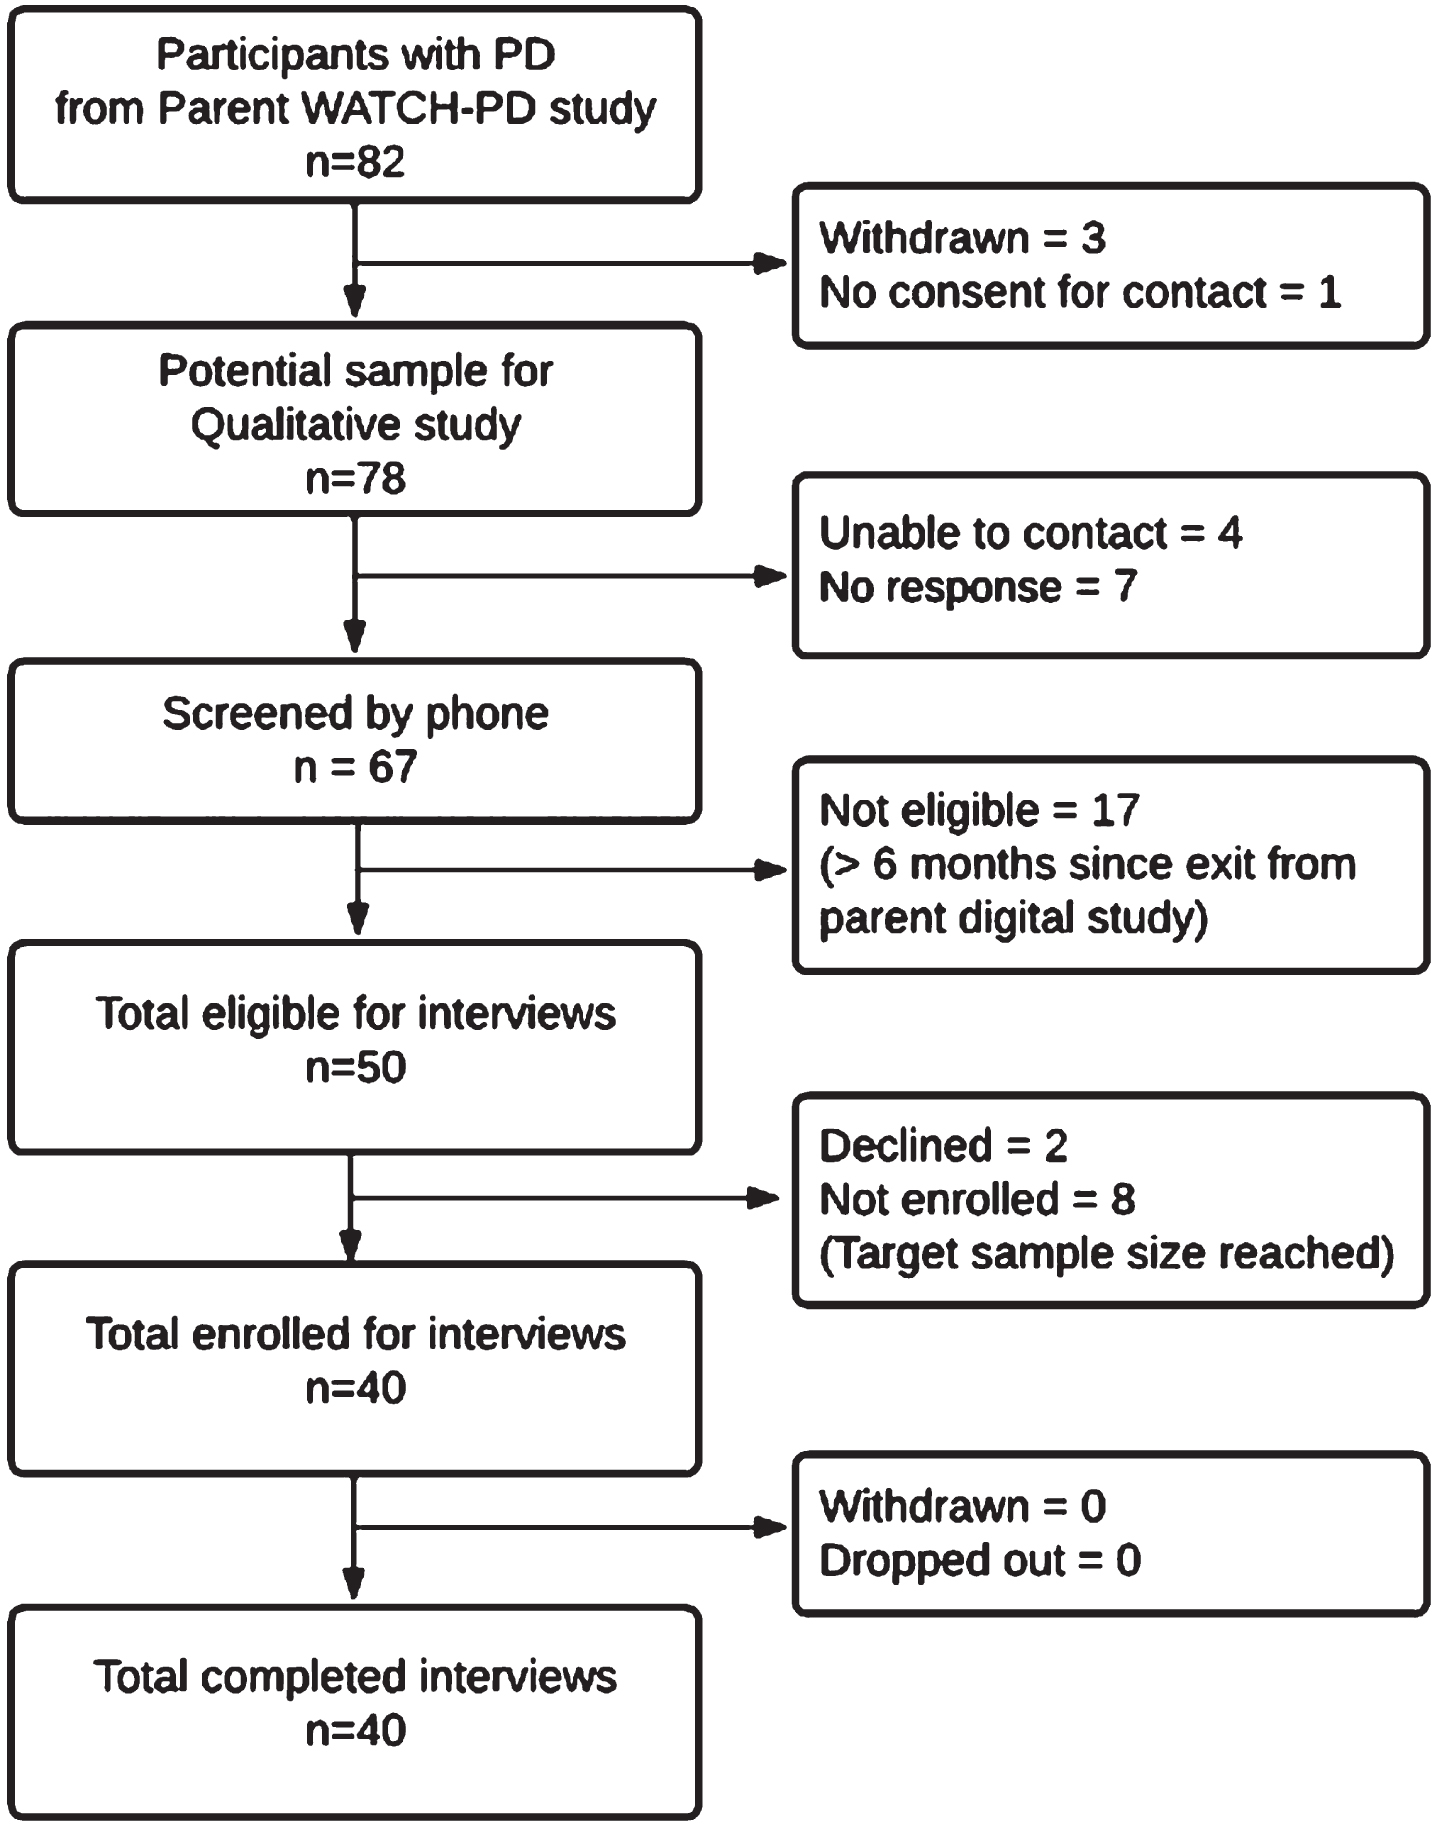
Individuals with PD who completed their final parent study visit within 6 months [22] were eligible to participate (N = 54) as depicted in the enrollment flowchart (Fig. 1). All non-white participants (N = 4) were solicited, with purposeful sampling to otherwise mirror parent study demographics. Participants were screened by phone and incentives were offered for participation ($50/survey; $75/interview). IRB approval (University of Rochester IRB# 00006429) and digital informed consent was obtained.
Fig. 1
WATCH-PD qualitative study participant enrollment diagram.
Data collection
A integrated mixed-methods design was used. This consisted of (A) a web-based survey of current PD symptoms and perceptions of WATCH-PD tasks (Appendix A), followed 1-week later by (B) a 90-minute online interview with 1) symptom mapping to identify meaningful symptoms and impacts of disease; 2) cognitive interviewing to generate content validity evidence for the WATCH-PD digital monitoring technology; 3) mapping of digital measures back to meaningful symptoms; and 4) mapping hypothesized symptoms of interest targeted by the digital measures.
Redcap survey [23, 24]
Demographic information was collected for gender, race/ethnicity, years since PD diagnosis, and any PD medication use, along with current PD symptoms and personal relevance of WATCH-PD digital measures, which were used as a starting point to inform the mapping process.
Online interviews
In-depth interviews were conducted with each participant by JM (white, female, PhD prepared nurse practitioner, unacquainted with participants, and unaffiliated with parent study) via Zoom video-conferencing, and were recorded with permission (years 2021— 2022). A semi-structured protocol was used (Appendix B).
Interview Part 1: Symptom mapping
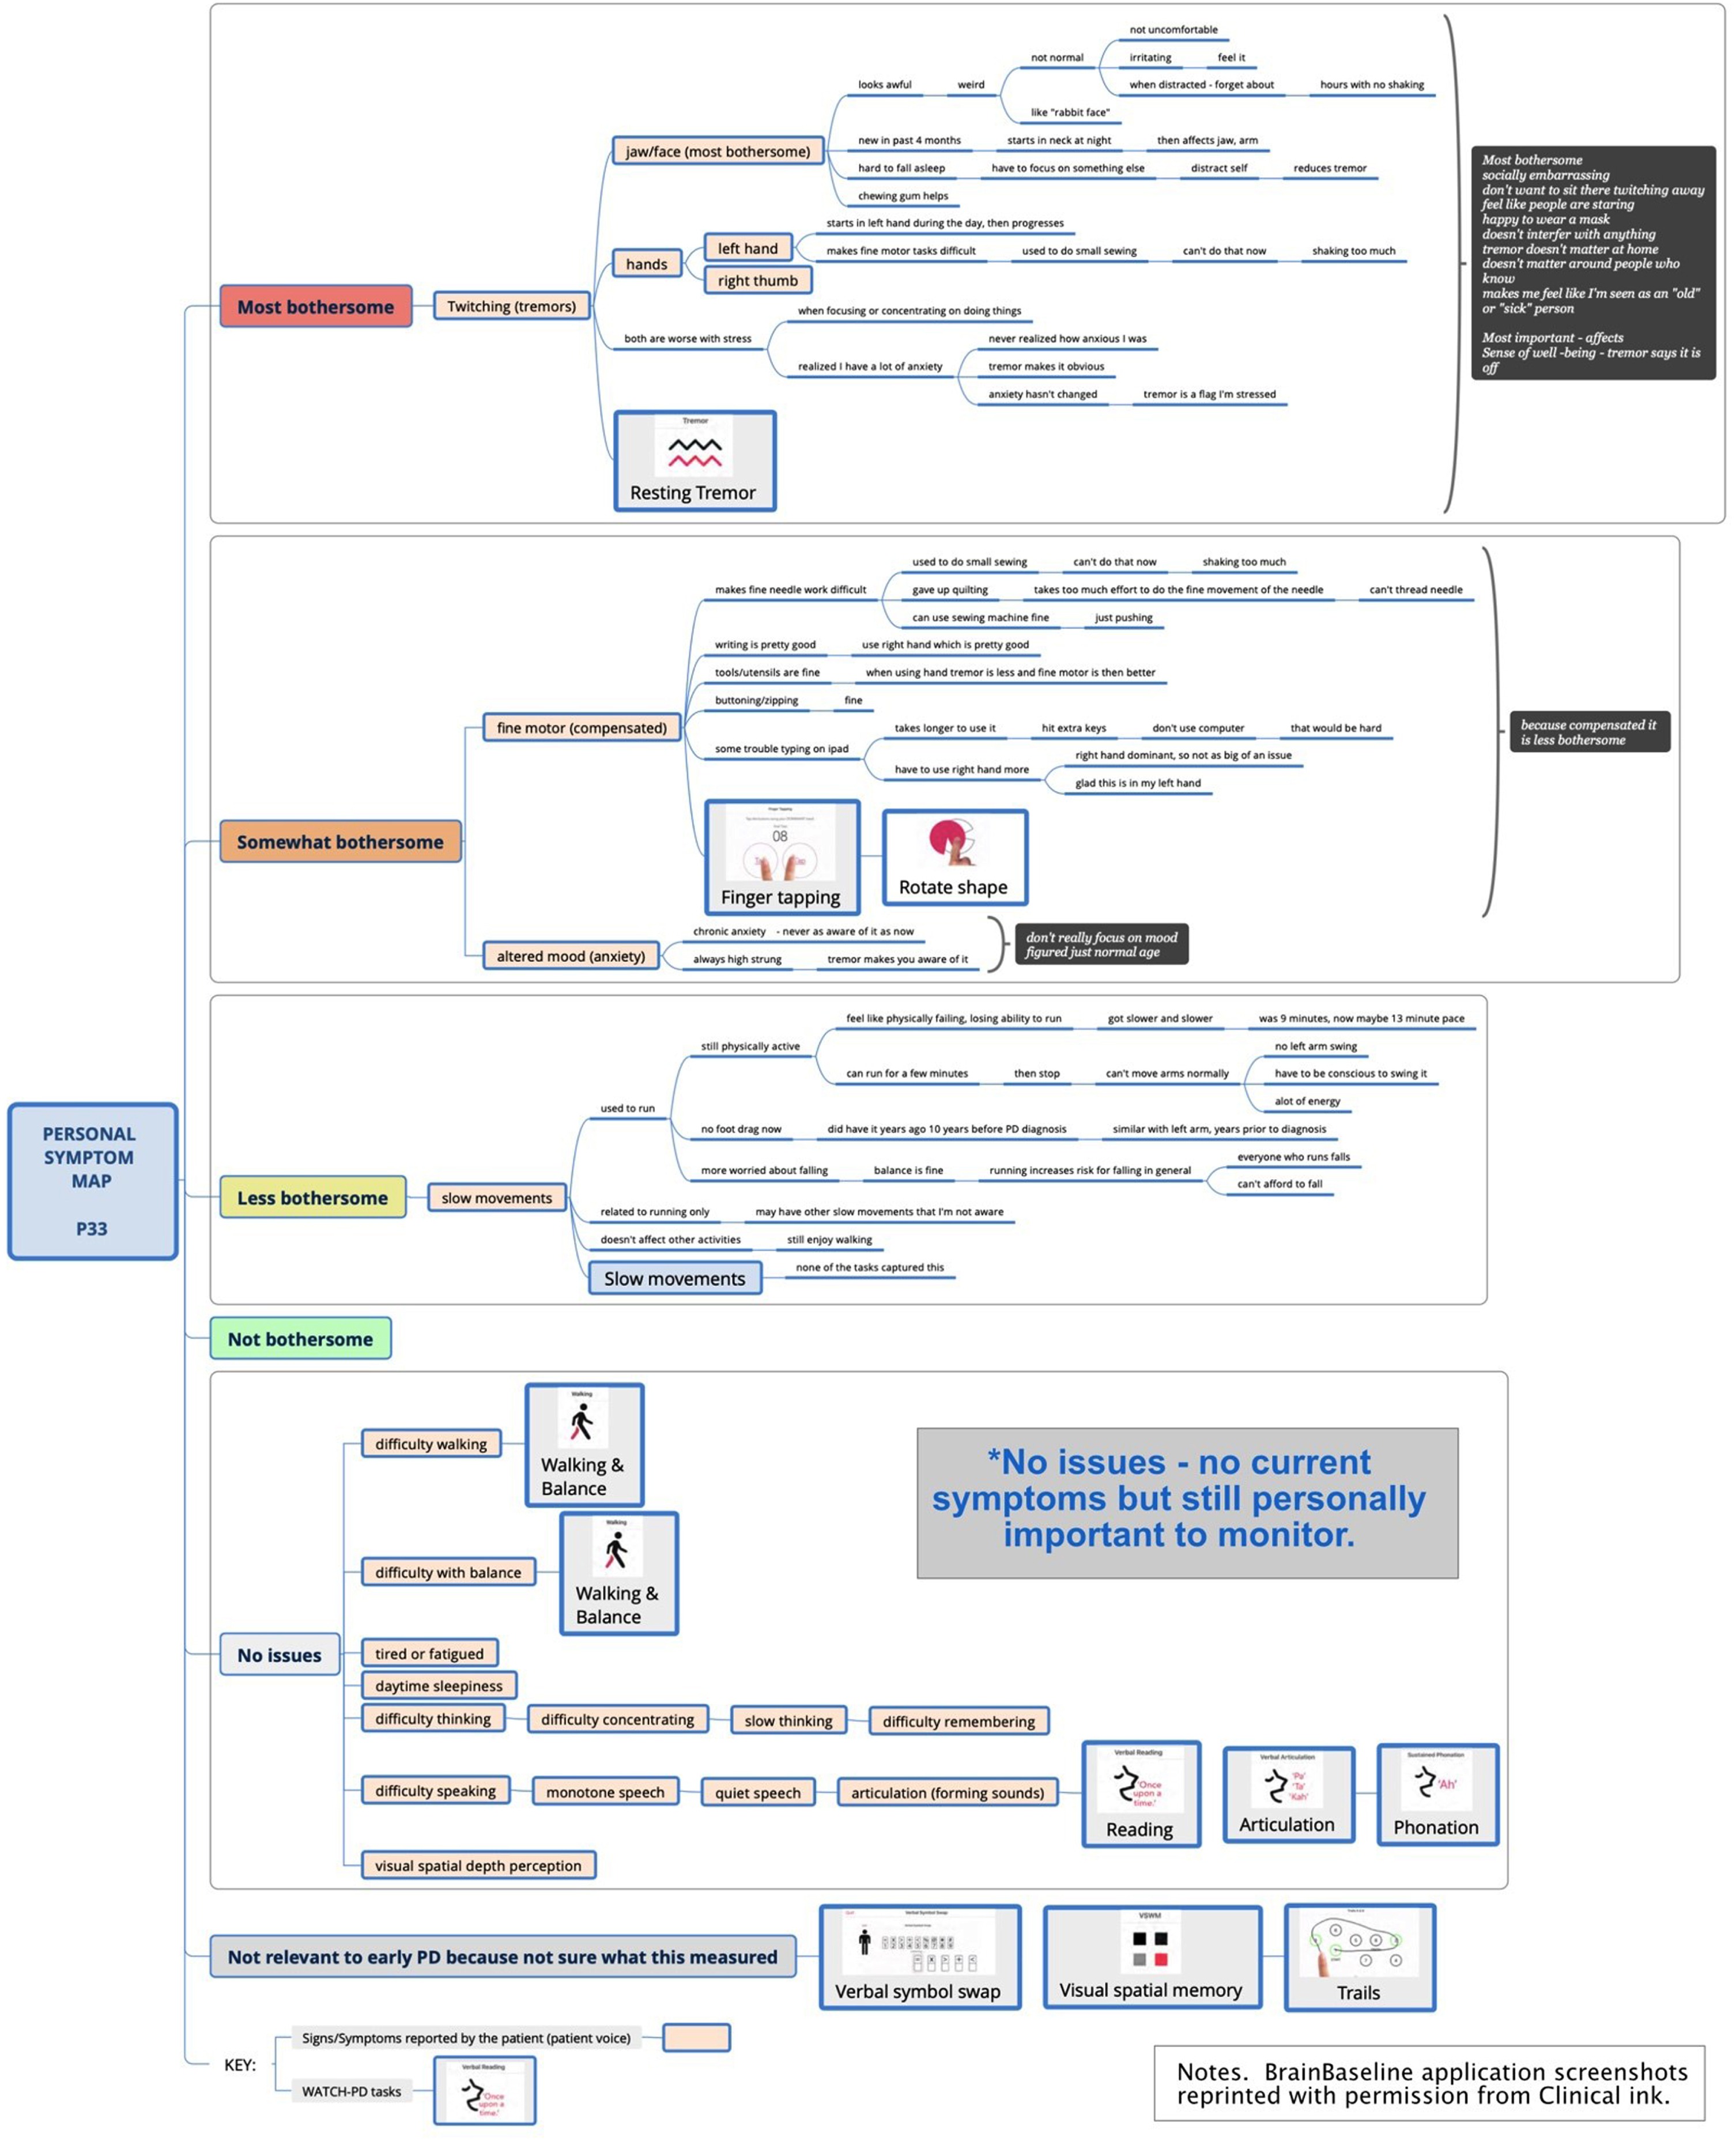
Part 1 focused on delineating symptoms and impacts of PD using new symptom mapping techniques. Symptom mapping (Fig. 2) is a digital extension of symptom-response card-sorting, which is a technique that has been successfully used in other chronic diseases to map symptom trajectories and self-management behaviors [25–27]. This qualitative technique enables participants to create an ordered visual representation (i.e., a “map”) of personal experiences using index cards to define symptoms and responses to or impacts of symptoms. For this study, mapping was accomplished using XmindTM software. Yellow nodes represented symptom “cards” and dependent line nodes represented impacts and details about symptoms [28]. Using screen sharing, the participant and interviewer jointly viewed and co-created the symptom map, with iterative discussion and revision to ensure the participant’s experience was represented accurately. A step-by-step diagram of the process is presented in Supplement A and Supplement B and summarized below.
Fig. 2
Sample symptom map.
Part 1, Step 1: Pre-interview map (preparation for interview)
Each participant’s survey responses were reviewed prior to the online interview and a preliminary map using the survey data was developed by the interviewer as a starting point for discussion. Self-reported symptoms (yellow nodes) were tentatively entered into a blank map with the following quantitative categories: “Most bothersome;” “Somewhat bothersome;” “A little bothersome;” “Not bothersome,” “No current issues but personally important,” and “Not relevant to early PD.”
Part 1, Step 2. Mapping spontaneously reported symptoms
At the start of the interview, participants were oriented to the mapping process and shown the baseline map. Building on this, participants were asked to describe in detail all personally meaningful symptoms of PD, including correcting or redefining any symptoms entered from the survey. As directed and approved by the participant, symptoms and supporting details were entered into the map using concise summaries.
Next, participants were asked to explain what made specific symptoms bothersome and how these affected them on a day-to-day basis, with details about impacts entered as dependent nodes. For example, a participant with difficulty walking might define this as insufficient foot lift, causing tripping on uneven surfaces, resulting in decreased ability to go hiking. When finished describing a symptom, participants were asked to review for correctness. Once validated, sections were collapsed to show only the symptom node to minimize information on the screen. As needed, symptom nodes could be reopened to add additional details, enabling iterative correction and revision.
Part 1, Step 3: Mapping probed symptoms not spontaneously reported
After exploring spontaneously reported symptoms and impacts, participants were asked about common PD symptoms not reported (i.e., difficulties with tremor, walking, balance, fine motor, speech, thinking, mood, daytime sleepiness, tiredness/fatigue, depth-perception). If these symptoms were not experienced, they were categorized as “No current issues” if considered personally important, or “Not relevant to early PD” based on the participant’s viewpoint. When finished, the map was collapsed to show only symptoms in list view, with supporting details and impacts hidden.
Part 1, Step 4: Reordering and ranking symptoms by bothersomeness
Next, participants were asked to review the condensed map to ensure all personally meaningful symptoms were reflected. Symptoms were then reordered by bothersomeness from top to bottom and rank ordered inside each bothersomeness category as directed by the participant.
Part 1, Step 5: Identifying most important and most bothersome symptoms
Lastly, participants were asked to indicate which symptoms were personally most important versus most bothersome to them, and to explain rationales for any differences. These high-priority symptoms were identified via “call-out” brackets highlighting symptoms and rationales. The final map was saved and duplicated for Part 3 of the interview.
Interview Part 2: Cognitive interviewing on WATCH-PD tasks
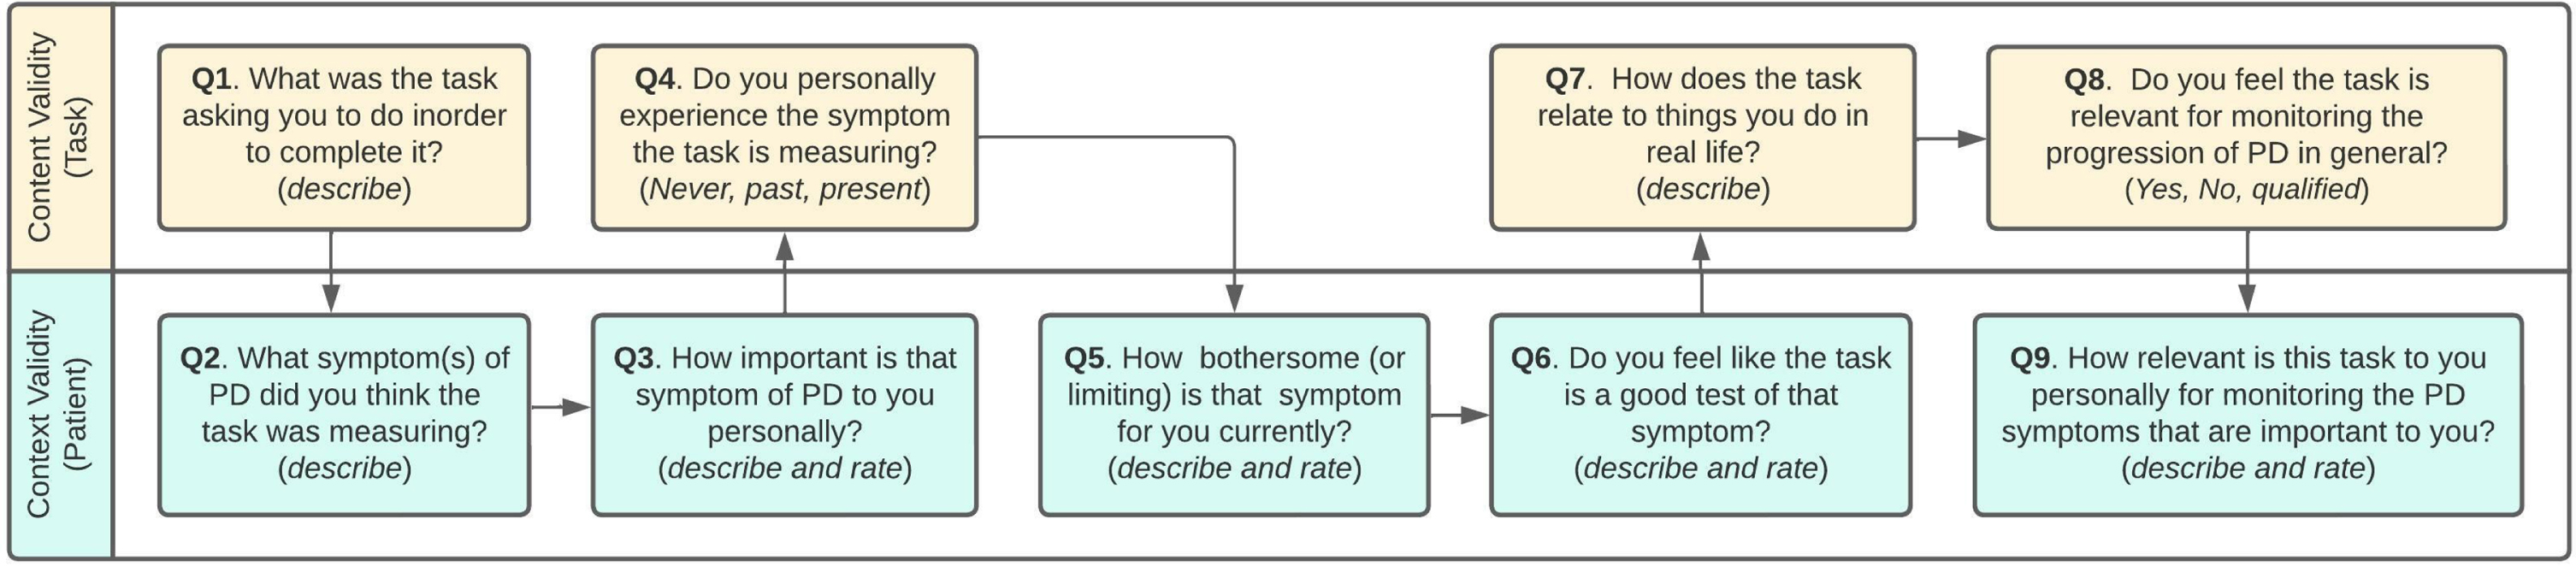
Following a brief break, the interviewer performed cognitive interviewing on 10 digital measures completed during the WATCH-PD study (Table 1). The participant was shown an image of each measure via screen-sharing and was asked four standardized questions. Questions were designed to assess 1) if the participant understood how to perform the measure correctly (Table 1. Actions required to perform assessment), 2) if the measure related to personally important symptoms of PD, 3) if the measure related to personal impacts and activities of daily living, and 4) if the participant believed the measure was relevant to monitoring the progression of their PD. Additional questions exploring general perceptions of the digital measures were included (Appendix B).
Interview Part 3: Mapping tasks back to personally important symptoms
Next, participants were asked to integrate a small pictograph of each measure into their personal map next to the symptom(s) they felt it was relevant to. This was used to confirm whether the task captured meaningful aspects of disease or corresponded with bothersome symptoms.
Interview Part 4: Mapping symptoms of interests to personal symptoms
Lastly, participants reviewed and integrated symptoms of interest the WATCH-PD tasks were intended to measure. This final step was used to confirm the extent to which symptoms of interest to the research team aligned with personally important symptoms for the patient. The interview concluded with closing questions and a final opportunity to review and modify the personal symptom map. Participants were emailed images of their personal symptom maps at the conclusion of the interview, if desired.
Data analysis
This study used COREQ criteria to guide reporting of qualitative findings.
Content coding [29]
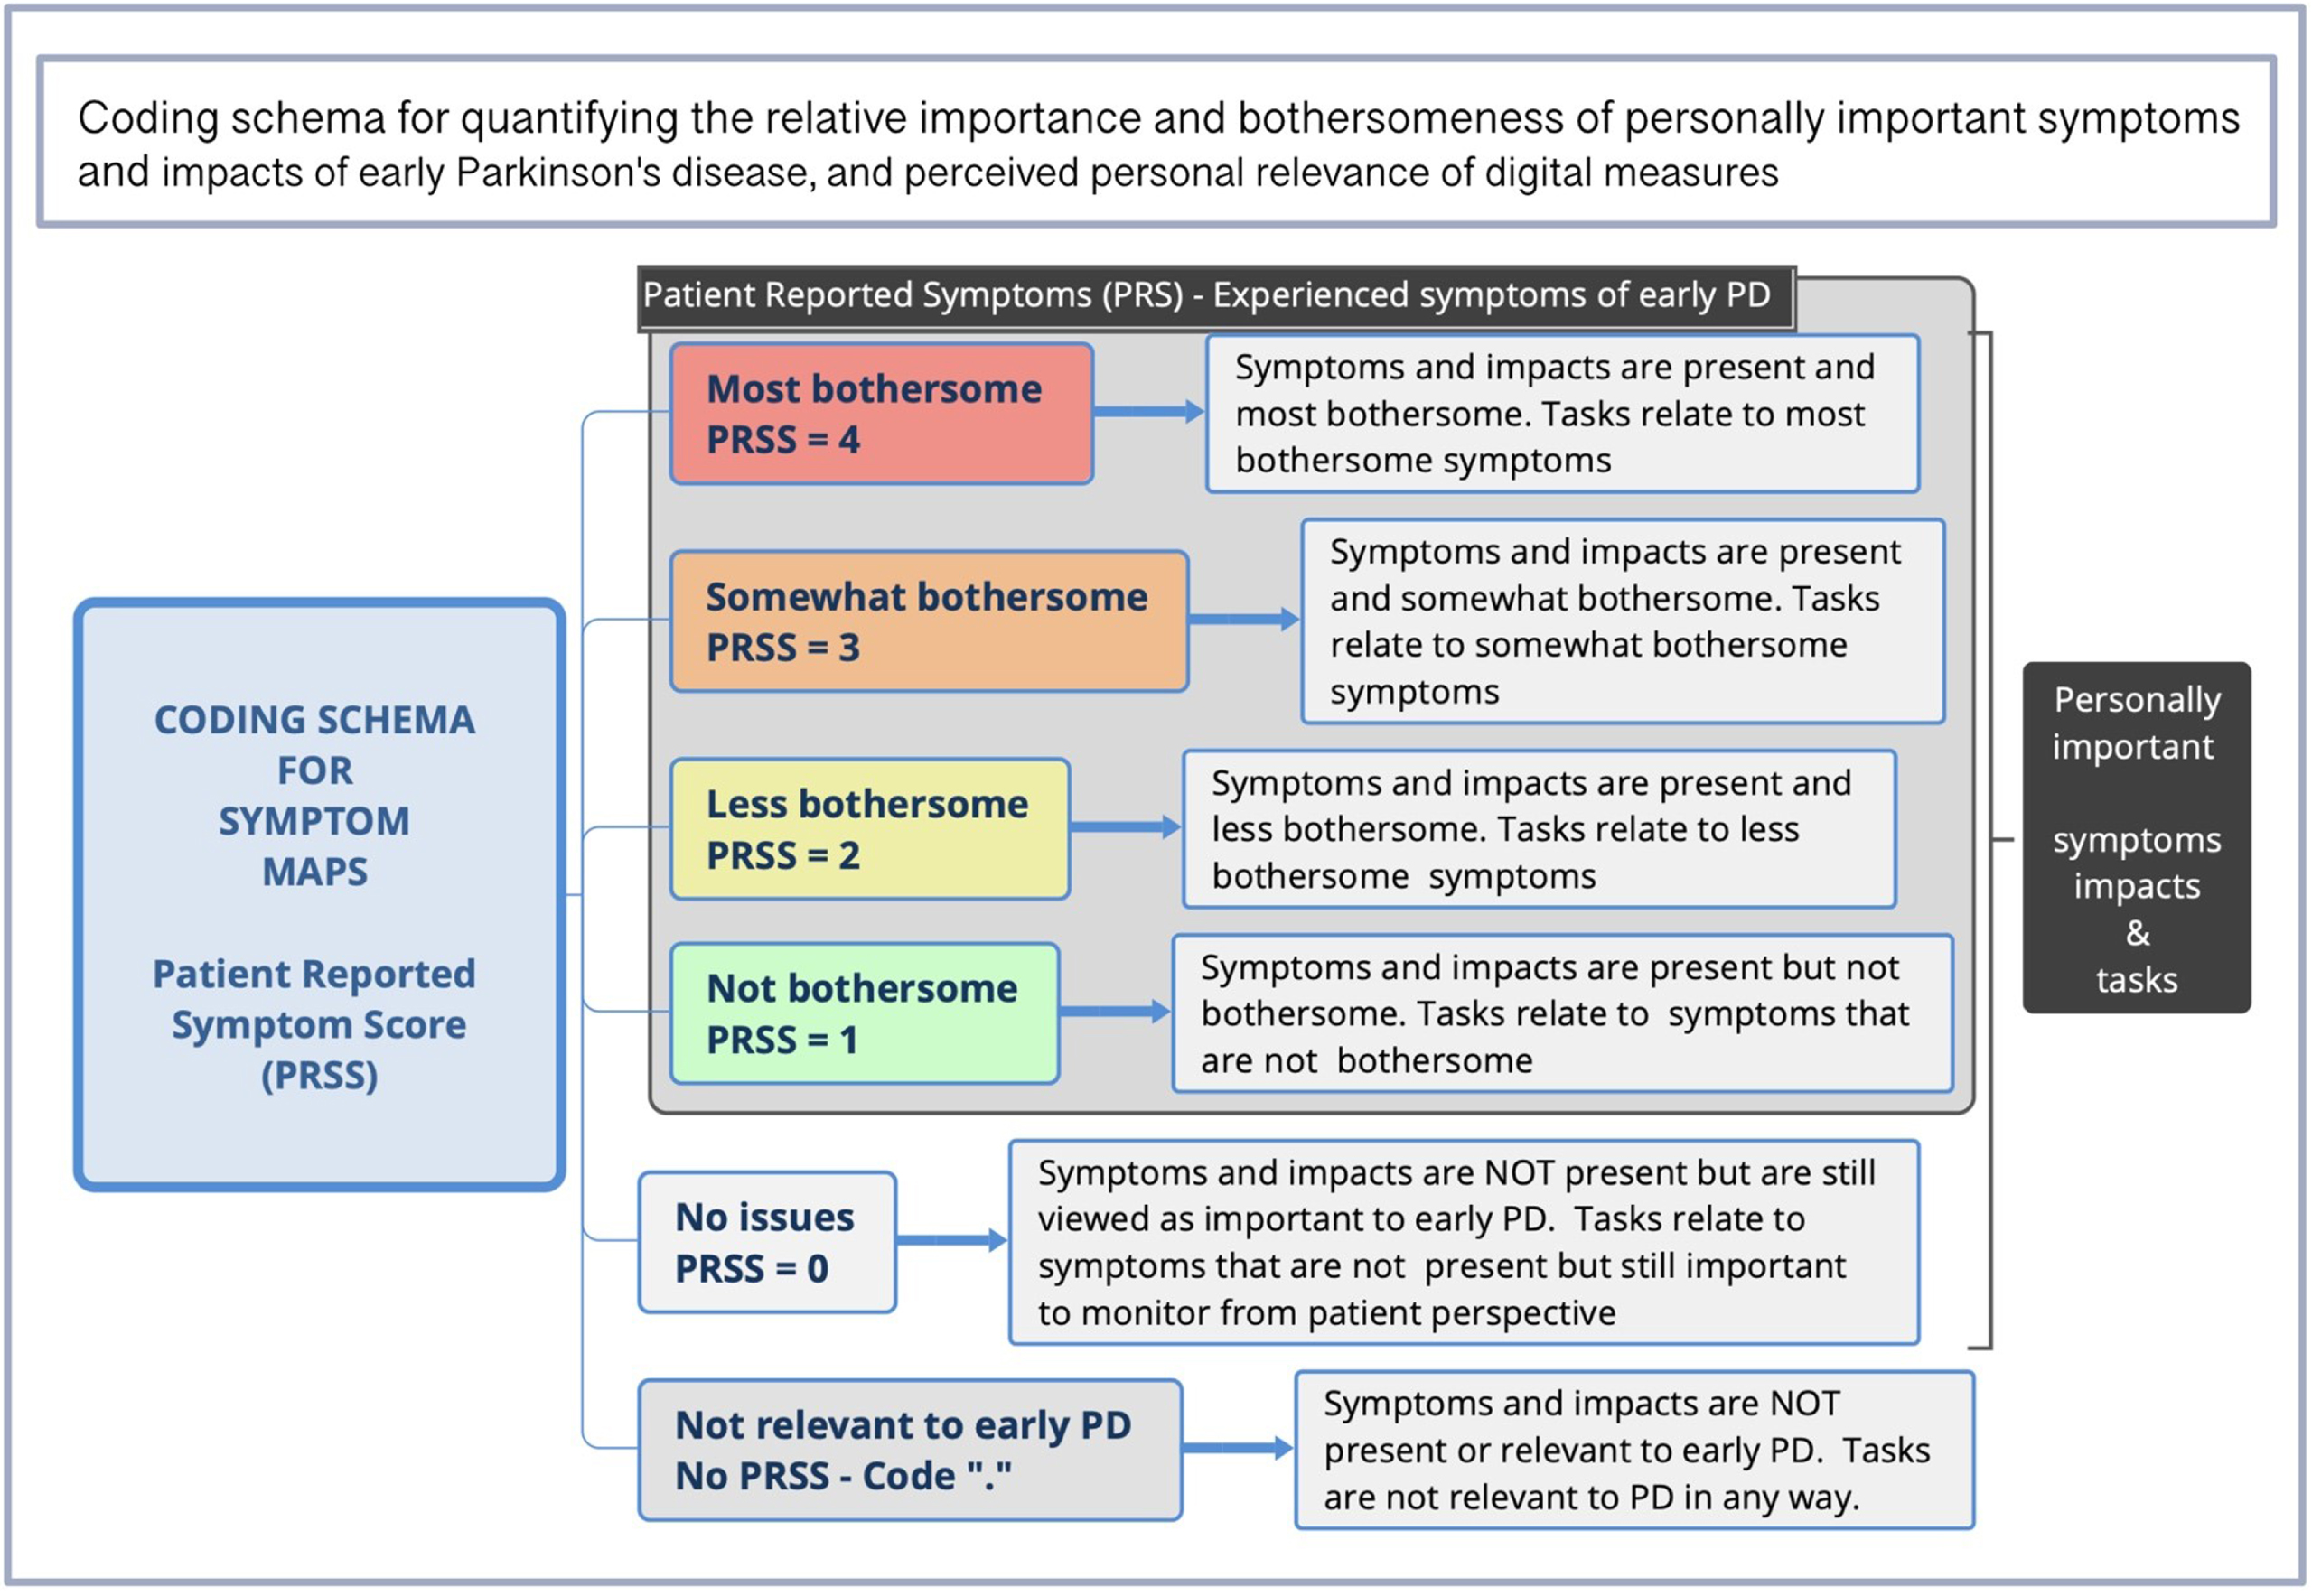
Coding was conducted by JM, PY, and RS (>97% convergence) as delineated in Table 2. Discrepancies were resolved by discussion with the analytic team who were diverse with regards to sex, age, race/ethnicity, background, and research expertise. Symptom maps were analyzed for types, frequencies, bothersomeness, and importance of symptoms and impacts, and association with digital measures. As seen in Fig. 3, each map level was assigned a Patient Reported Symptom Score (PRSS), representing the highest level of bothersomeness a symptom occurred at within a given map. Relevance of each digital measure was calculated based on association to symptoms. For example, if a participant placed the Tremor Task next to the symptom “Tremor” at the “most bothersome” position in the symptom map, it would be associated with a PRSS of 4. If associated with more than one symptom (e.g., Walking & Balance), digital measures were valued at the highest level they occurred at within a map and counted once per participant.
Table 2
Coding cycles for analysis of maps and interviews
| Cycle | Approach | Description | Purpose |
| 1 | Open coding for symptoms | Coding without a priori schema – items (symptom types, categories) are derived directly from what is present in the data. Spreadsheet – list of all symptoms. | To develop a comprehensive list of PD symptoms experienced in early disease |
| 2 | Content coding for symptoms | Re-coding of maps using derived symptom checklist from open coding to determine frequencies, with symptoms indicated as not present (“.") or present, using the Patient Reported Symptom Scores (PRSS) associated with each level in the map (range 1–4). Spreadsheet with participant identifiers as columns (i.e., P1, P2) and symptoms as rows. | To determine the percent of people experiencing each type of symptom along with perceived level bothersomeness. |
| 3 | Pattern coding of symptoms | Curation of individual symptoms into domains (logical conceptual groupings of symptoms) with comparison to the Staunton et al. conceptual model of early PD. Spreadsheet. | To derive domains for grouping symptoms in early PD |
| 4 | Open coding for impacts | Coding without a priori schema – items (symptom types, categories) are derived directly from what is present in the data. Spreadsheet – list of all impacts and contributing symptoms. | To develop a comprehensive list of impacts of PD in people with early disease |
| 5 | Content coding for impacts and contributing symptoms | Re-coding of maps with derived list of impacts to determine frequencies, with impacts symptoms underlying the impact indicated as indicated as present (+) or not present, (“.”) and symptoms identified as contributing to the impacted indicated as contributing (+) or not contributing “.” Spreadsheet with participant identifiers as columns (i.e., P1, P2), impacts as rows, and contributing symptoms as dependent rows for each impact. | To determine the percent of people experiencing each type of impact along with the commonly identified symptoms believed to be contributing to the impact. |
| 6 | Pattern coding of impacts | Curation of individual impacts into domains (logical conceptual groupings of impacts) with comparison to the Staunton et al. conceptual model of early PD. Spreadsheet. | To derive domains for groupings impacts in early PD |
| 7 | Content coding of maps for relevance of digital measures | Coding for relevance of WATCH-PD digital measures by association with personally important symptoms and impacts in the map (PRSS range 0–4 with “.” for not relevant). Spreadsheet with participant identifiers as columns (i.e., P1, P2) and tasks as rows. | To determine relevance of individual tasks, identify most relevant, least relevant, and mean relevance scores (PRSS) using mapping approach |
| 8 | Coding of transcripts for relevance of digital measures | Content coding of four standardized content validity questions for frequencies of: Yes, No, or a qualified answer that was neither yes or no. Spreadsheet with participant identifiers as columns (i.e., P1, P2) and standardized content validity items as rows. | To determine relevance of individual tasks using standard approach for comparison with mapping |
| 9 | Coding of transcripts for themes | Initial coding without a priori schema using Nvivo to identify recurrent ideas, followed by pattern coding with Xmind to identify conceptual clusters and develop themes. Themes derived from what is in the data. | To determine themes related to personally important symptoms and relevance of technology to monitoring meaningful aspects of health. |
| 10 | Coding of transcripts for Thematic prevalence | Final re-coding of transcripts to confirm thematic prevalence across all participants. Spreadsheet with participant identifiers as columns (i.e., P1, P2) and themes as rows. | To determine most prevalent themes |
Fig. 3
Coding schema for assessing relevance of digital measures to meaningful symptoms.
Statistical tests
Independent T-tests were used to assess for between group differences based on any/no PD medication use using SPSS28. Cramer’s V (effect size for Chi-square test of independence) was calculated to assess strength of relationship between cognitive interviewing and map ratings of relevance, with very strong relationship defined as > 0.25 [30]. Descriptive statistics were computed for survey items.
Rigor and validity
Data collection instruments and procedures were developed under advisement from the FDA and in collaboration with people with Parkinson’s disease (JC, JH). Two 90-min pretest interviews were conducted with people with PD prior to implementation, followed by observation of initial interviews to ensure consistency (RS). Data collection and analysis were performed by researchers unaffiliated with the parent study to minimize bias. Other measures to enhance validity included triangulated data collection, member-checking, peer-debriefing to refine emerging themes, use of multiple coders, and a formal audit trail [33]. Data saturation (i.e., point after which no new data was identified in subsequent interviews) was assessed in addition to stability ratings (point at which average of scores remained stable within +/–10% of the final mean) [34, 35]. Quotes throughout are presented with numeric identifiers to demonstrate representativeness.
RESULTS
Sample and Interview characteristics
Table 3 displays demographics comparative to the parent study. Recorded interviews lasted 102 min on average, with no substantive technological issues. Feasibility metrics and interview characteristics are presented in Supplement C. Data saturation for symptom types reported by > 10% of the sample was 100% by the 17th interview, and 100% for impacts by the 10th interview in this relatively homogenous sample (Supplement D). All major themes were observed within the first two interviews and measurable as expressed by the majority (>80%) by the 20th interview.
Table 3
Demographic characteristics of the sample comparative to the parent WATCH-PD study
| Sample n = 40 | Parent study (n = 82) | |
| Age, y | 63.9 (SD 8.8) | 63.3 (SD 9.4) |
| Female, n (%) | 19 (47.5%) | 36 (43.9%) |
| Race/ethnicity, n (%) | ||
| White | 37 (92.5%) | 78 (95.1%) |
| Asian | 3 (7.5%) | 3 (3.7%) |
| Not specified | – | 1 (1.2%) |
| Hispanic or Latino, n (%) | 1 (2.5%) | 3 (3.7%) |
| Education>12 y, n (%) | 40 (100.0%) | 78 (95.1%) |
| *PD duration, y | 2.1 (SD 0.9) | 0.8 (SD 0.6) |
| Taking medications for PD, n (%) | 16 (40.0%) | – |
*PD duration represents the time since diagnosis with Parkinson’s disease at time of parent vs. substudy data collection.
Cognitive interviewing: Content validity of WATCH-PD digital measures
Frequencies and percentages of positive demonstration of understanding and relevance of WATCH-PD tasks are shown in Table 4. With the exception of Finger Tapping (1/40 incorrect answer), all participants demonstrated they understood what each of the 10 tasks was asking them to do for completion. The task most relevant to personal PD symptoms by cognitive interviewing was Shape Rotation (87.5%), followed by Tremor (85%) and Finger Tapping (85%). Less than half of participants found Visual Spatial Memory (47.5%), Phonation (42.5%), Reading (37.5%), Articulation (37.5%), and Verbal Symbol Swap tasks (35%) to be relevant to personal PD symptoms. Most participants were able to provide examples of how each task related to activities in their daily life (range 59% [Visual Spatial Memory] to 97.5% [Walking & Balance]) and believed tasks were important for measuring the progression of PD (52.5— 97.5%). Excluding Visual Spatial Memory and Phonation, all other tasks (8/10) were definitively endorsed as personally relevant by greater than 85% of participants.
Table 4
Frequency and percentage of positive demonstration of understanding and relevance of WATCH-PD tasks during cognitive interviewing vs. mapping
| WATCH-PD Task | Understood what the WATCH-PD task was asking them to do in order to complete it | WATCH-PD task related to personal PD symptoms | WATCH-PD task related to tasks and activities in daily life | WATCH-PD task was important to measuring PD progression | WATCH-PD task was relevant to monitoring any personally important PD symptoms | Relevance of WATCH-PD tasks | Cramer’s V Correlationc |
| n/40 (%) = [yes] | n/40 (%) = [yes] | n/40 (%) = [yes] | n/40 (%) | % Agreement A:B | A:B | ||
| A. COGNITIVE INTERVIEWING | B. MAPPING | ||||||
| MOVEMENT | |||||||
| Walking and Balance Task | 40 (100%) | 26 (65%) | 39 (97.5%) | Yes = 38 (95%) No = 0 (0%) Qualifiedb = 2 (5%) | Yes = 37 (92.5%) | 37/40 (92.5%) | 0.397** |
| Resting Tremor Task | 40 (100%) | 34 (85%) | 32 (80%) | Yes = 39 (97.5%)No = 1 (2.5%) Qualified = 0 | Yes = 40 (100%)d | 39/40 (97.5%) | d |
| FINE COORDINATION | |||||||
| Finger Tapping Task | 39 (97.5%) | 34 (85%) | 32 (80%) | Yes = 37 (92.5%) No = 2 (5%) Qualified = 1 (2.5%) | Yes = 36 (90%) | 38/40 (95%) | 0.604 ** |
| Shape Rotation Task | 40 (100%) | 35 (87.5%) | 34 (85%) | Yes = 35 (87.5%)No = 3 (7.5%)Qualified = 2 (5%) | Yes = 37 (92.5%) | 37/40 (92.5%) | 0.589** |
| SPEECH | |||||||
| Verbal Reading Task | 40 (100%) | 15 (37.5%) | 36 (90%) | Yes = 35 (90%) No = 2 (5%) Qualified = 3 (7.5%) | Yes = 35 (87.5%) | 34/40(85%) | 0.457** |
| Sustained Phonation Task | 40 (100%) | 17 (42.5%) | 32 (82%)1 | Yes = 32 (87.5%) No = 3 (7.5%) Qualified = 5 (12.5%) | Yes = 33 (82.5%) | 29/40 (72.5%) | 0.340* |
| Verbal Articulation Task | 40 (100%) | 15 (37.5%) | 30 (75%) | Yes = 27 (67.5%)No = 5 (12.5%) Qualified = 8 (20%) | Yes = 34 (85%) | 29/40 (72.5%) | 0.474** |
| THINKING | |||||||
| Trails A&B Task | 40 (100%) | 23 (57.5%) | 25 (62.5%) | Yes = 34 (85%)No = 4 (10%) Qualified = 2 (5%) | Yes = 32 (80%) | 29/40(72.5%) | 0.486** |
| Verbal Symbol Swap Task | 40 (100%) | 14 (35%) | 33 (82.5%) | Yes = 33 (82.5%)No = 1 (2.5%) Qualified = 6 (15%) | Yes = 33 (82.5%) | 30/40(75%) | 0.301* |
| Visual/spatial Memory Task | 40 (100%) | 19 (47.5%) | 23 (59%)a | Yes = 21 (52.5%)No = 12 (30%)Qualified = 7 (17.5%) | Yes = 21 (52.5%) | 27/40(67.5%) | 0.462** |
aN = 39; bYes = definitive endorsement of relevance; No = definitive rejection of relevance; Qualified = marginal answer in which participant could not categorically endorse or reject personal relevance and gave a qualified answer (ex. “Yes, but only if they fixed the technical issues” or “No, but if I developed symptoms, I would want to monitor for it”). cCramer’s V is an effect size of Chi Square test of independence between categorical variables. Polychloric Correlation was not used due to non-normal distribution of data. dUnable to run Cramer V due to lack of heterogeneity in response to Tremor task on mapping. Cramer’s V effect sizes *>0.25 are considered to indicate a strong relationship and **>0.35 a very strong relationship (df = 2).
Symptom maps: Relevance of tasks to bothersome symptoms
As shown in Fig. 4 (Graph A), tasks that were most relevant to actively bothersome symptoms were the Tremor task (92.5%; relevant to tremor), Shape Rotation, Finger Tapping, (82.5%, 77.5% respectively; relevant to fine motor) and Trails A&B (65%; perceived as relevant to fine motor and thinking), Walking & Balance (55%; relevant to general mobility), and Verbal Symbol Swap (52.5%; relevant to cognitive function). Speaking tasks (Reading, Phonation, Articulation) and Visual Spatial Memory were less often relevant to active symptoms (<50%).
Fig. 4
Relevance of digital measures to monitoring personally important symptoms of early PD as elicited by mapping.
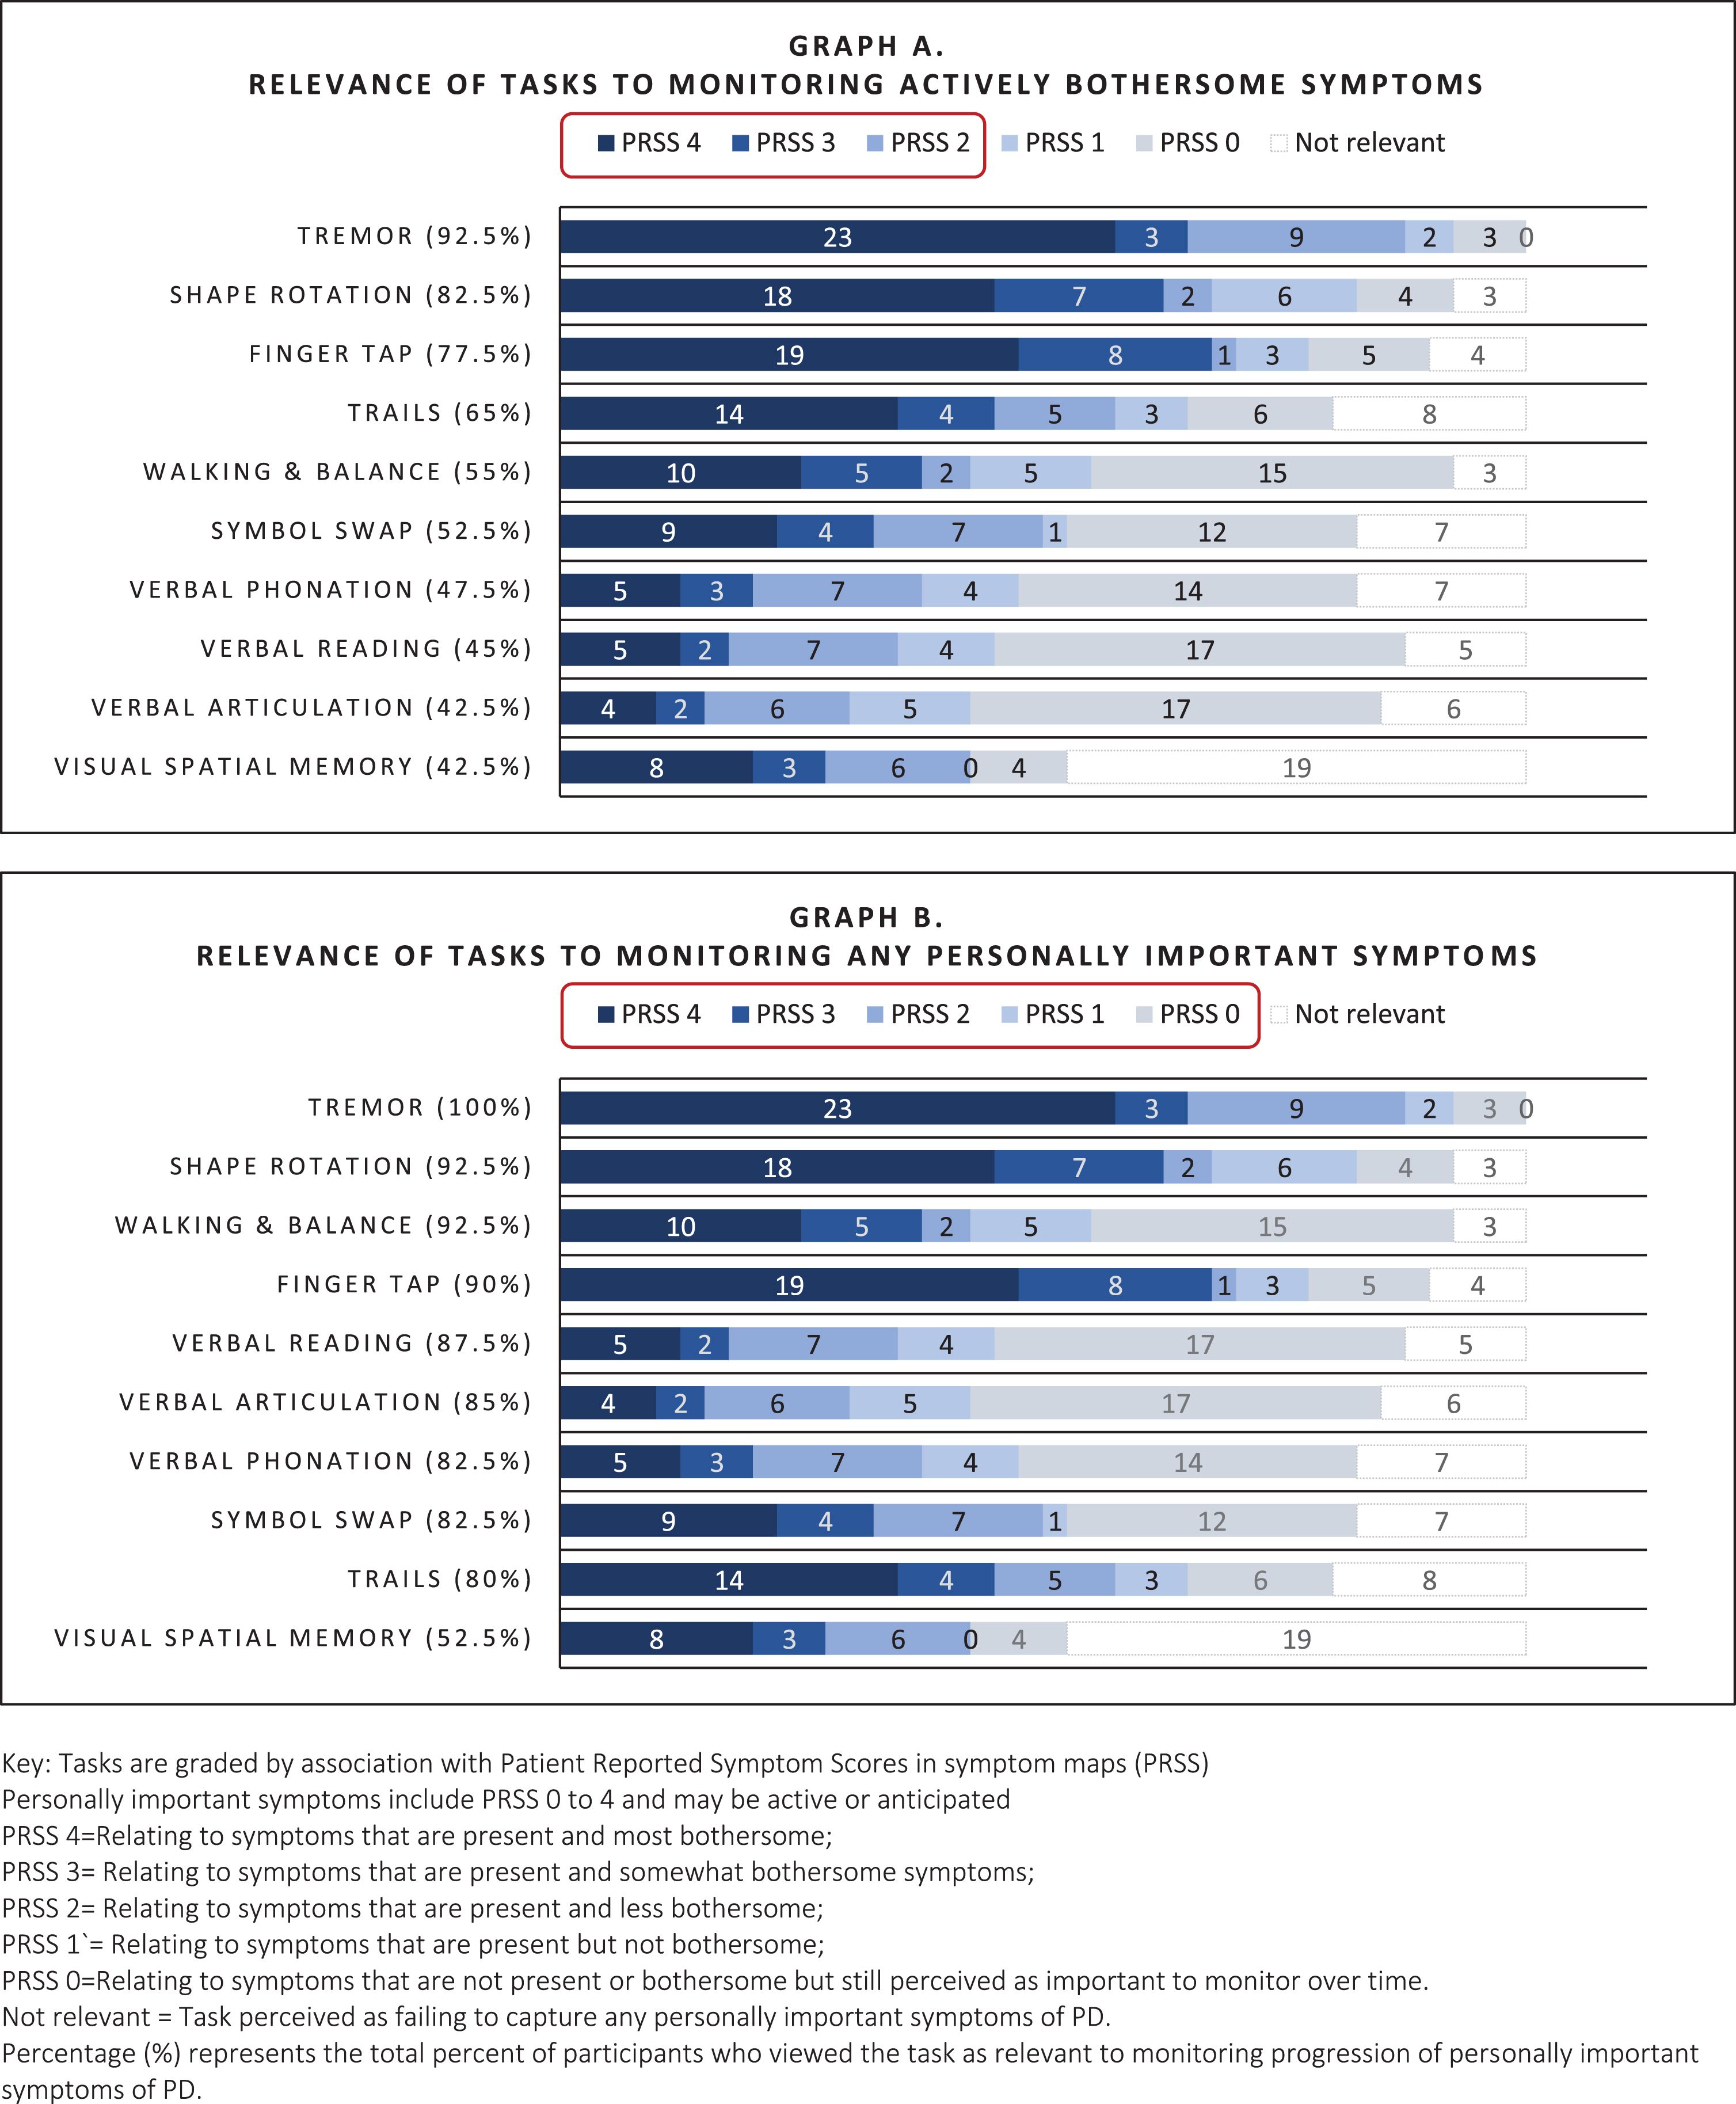
Symptom maps: Relevance of tasks to personally important symptoms
Personally important symptoms included symptoms that were past (resolved) present or anticipated (i.e., impactful symptoms that could occur in the future). For example, a participant who did not currently have difficulty with articulation might perceive tasks monitoring speech as relevant to an important future symptom, as seen here:
P6: I’m not experiencing slurring, but that [digital measure] could’ve picked up on that. I want to speak clearly... [and] I completely agreed with [testing] this ... I absolutely believe it’s valid.
P19: I don’t have an issue [with speech]. [But] I think the tasks are good to have, because a lot of people with Parkinson’s do have these issues. How would I know if I did without doing the task?
As shown in Fig. 4 (Graph B), all tasks, excluding Visual Spatial Memory, were rated as relevant for monitoring personally important symptoms to the majority (>80%). While speaking tasks often did not relate to actively bothersome symptoms, they were relevant to more than 80% of people as important future symptoms. Visual Spatial Memory was commonly criticized for being difficult to complete, causing frustration, and failing to measure symptoms specific to PD, and was therefore rated as relevant by fewer people (52.5%).
Correlations
As shown in Table 4, convergence between cognitive interviewing Q4 (relevance of task to monitoring progression of PD) and relevance to monitoring personally important symptoms rated by mapping was high (67.5 [Visual spatial Memory]— 97.5% [Tremor]) with evidence of strong association between ratings of relevance across all tasks (Cramer’s V > 0.25). Non-convergence increased if participants were unsure what the test measured or believed the test was technically flawed, with 50% nonconcordance accounted for by items where participants were unable to give a categorical response (yes/no) to assessment of relevance, as illustrated in these examples:
P18: “I don’t know [if it’s relevant], but “yes” if it’s about volume” [Phonation].
P16: “Yes” if it was designed properly [Visual Spatial Memory]
In these instances, participants often modified ratings of relevance between methods, suggesting that variability was due to ambiguity in perception of the task.
Summary of themes relating to relevance of measures
Three themes were identified relating to how participants perceived relevance of WATCH-PD measures for monitoring early PD. In general, participants felt that digital measures were meaningful and should be retained for monitoring if they reliably captured any important symptoms of PD— whether actively experienced or not (Themes 1 and 2). However, there was some concern about negative psychological impact related to frequent monitoring of PD symptoms (Theme 3).
Theme 1. Perceived relevance of digital measures was contingent on belief that the measure effectively evaluated an important PD symptom— regardless of whether the symptom was currently present or the measure related to activities in daily life.
Relevant measures fell into two categories: 1) those that appeared related to personal symptoms actively experienced and 2) those that appeared related to personally important symptoms of Parkinson’s not currently experienced by the participant (i.e., past or anticipated possible future symptoms of concern or common symptoms of PD). Supplement E presents a detailed delineation of the five criteria on which participants consistently based their evaluation of personal relevance of WATCH-PD measures during interviews (hereafter called “Participant Criteria”). In general, participants endorsed measures as relevant if three Participant Criteria were met— the individual believed 1) they understood what was being evaluated (purpose of measure), 2) the measure related to an important symptom of PD, and 3) the measure was a good test of the symptom. Often, WATCH-PD measures were considered relevant even when they did not relate to activities in daily life or were a personally experienced symptom, provided other Participant Criteria were met. Understanding what the measure required to complete it was not a referenced factor in personal relevance evaluations.
Some slight uncertainty was tolerated regarding what the measure was targeting (Participant Criteria 1), but if measures failed to satisfy Participant Criteria 2 and 3 (related to important PD symptoms and a good test), they were always deemed not relevant. For example, the Visual Spatial Memory was often viewed as not capturing a symptom specific to PD and was thus considered less relevant overall. However, participants indicated ambiguous measures could become relevant if data demonstrated ability to pick up subtle variations in important PD symptoms not apparent otherwise, as seen in the following quotes:
P3: I don’t know what they were measuring, so it’s hard for me to know whether it was related. If it is able to measure the things I care about, yes [it’s important]. It’s hard to know without seeing the data.
P5: I don’t feel like I have enough information [to decide if the measure is relevant]. ... It would be nice to see results ... [The digital measures could be] seeing things that I’m not.
Theme 2. Due to the variable, progressive, and uncertain nature of PD, people with early PD believe it can be important to measure aspects of disease and symptoms that they do not currently experience.
Many participants indicated that they believed it was important to measure common symptoms of PD even when they did not personally experience those symptoms (Criteria #5). Rationales were based on participant’s understanding that PD has wide variability in symptom expression and disease progression, and that new symptoms could onset at any point. Participants believed that digital measures had the potential to pick up subtle deficits and new symptoms at the earliest possible onset and felt that early detection was key to understanding and monitoring disease progression and developing better treatments. Furthermore, many reported being personally committed to partnering with researchers for the sake of themselves, family members who might later develop PD, and the broader benefit of society as a rationale for monitoring symptoms that were not yet present. This is illustrated in the following quotes with supporting data in Supplement F:
P24: It’s not so much what you have currently, it’s the progression. It’s about whether new symptoms develop and if those symptoms become more severe over time. ... Symptoms change, they get worse, or they suddenly show up, when you didn’t have it before.
P28: It’s a degenerative disease ... I think it’s important to measure all of these [symptoms].
Theme 3. Active monitoring can have negative emotional impact that affects sense of well-being and engagement with the digital measurement, particularly if challenging to perform.
Participants reported that when they perceived themselves as not performing well, they sometimes experienced negative emotional consequences, such as anxiety, stress, worry about disease progression, or sense of failure. For example:
P26: I felt like oh no, I can’t handle this. This is gonna make me feel so inadequate....After I was all done, I would go be depressed for an hour because it pointed out to me that I was having trouble with some of these things.
This sense of failure resulted in some participants being less willing to complete a task, approaching the activity with anxiety, finding ways to “game” the system to improve scores and sense of competence, and practicing to improve performance. Supporting data for this is presented in Supplement G, and is illustrated below:
P16: It caused me anxiety. By the end, people are just so frustrated they’ll tap any finger. They won’t care anymore.
P20: I tried to focus to the best of my ability, but it became frustrating, and I would just say, “oh, I’ll just hit match or no match ... I’ll just guess at that.”
P27: It motivated me to download [a different] app on my phone to try to get better at color recognition and [prove] that maybe my brain is not totally declined.
Conversely, when participants were able to perform easily at a level they felt was equivalent to a person without PD, they experienced a sense of relief and felt more positively about the digital measure and their PD state. For this reason, in addition to detecting symptom onset, many people preferred to retain items that measured important symptoms of PD not currently present, as seen here:
P28: If it was all hard, I might have dropped out, because you’re making me face this thing that’s really, really, really hard to face. [But if] I can do at least half the stuff well, and they’re measuring something to do with Parkinson’s... it’s reassuring. I need some pats on the back. Please don’t [take the easy tests out].
Participants’ perspectives of mapping
Table 5 presents representative quotes showing participant perceptions of the mapping process, which was strongly positive. Nearly all (39/40) reported that mapping enabled a more comprehensive discussion of their PD experiences. For example:
Table 5
Quotes showing participant experiences with symptom mapping
| ID | Quote |
| P1 | It’s really hard to describe to your kids, “How’s it going, Dad?” ... This maps that out. I haven’t thought about most bothersome to not bothersome to, “Well, what is it that bothers you?” This draws that out |
| P8 | I like this tool ... this has been very interesting ... Thank you for walking me through, I learned some things about myself. |
| P10 | I’m accustomed to this sort of diagraming and I found it useful. Will I be able to get a copy of this? |
| P11 | [This is] very good at quantifying, clarifying what I’m saying. I’m being very vague, but I’m appreciating that you’re able [to map it out] ... These are hard things to describe ... . I’m impressed that you’ve been able to quantify my vagueness and put it into some semblance of order. |
| P12 | It’s an awesome program [and] interesting to look at it this way. Can I get a copy? I wanna review it with my wife and see if I’ve missed anything. |
| P14 | It was easy. I’m impressed ... it would’ve been much harder to do on the phone. |
| P16 | This has been about as a detailed conversation that I’ve ever had with anybody about what goes on inside my head. |
| P26 | I’m impressed ... This has clarified my condition for me, laying it out like this. A lot of times, you want to avoid thinking about this and this sort of forces it, but in a fairly painless way ... it was an easy way to do it. |
| P27 | I learn and understand with visualization, so this actually brings it all to the forefront, makes it nice to see and understand. I like it. It puts it in perspective as to where I believe I am and the explanation. It’s sort of like, oh, this makes sense to me ... . absolutely recommend it. |
| P30 | I am a visual learner. I like to see things mapped out ... categorizing and making sense of it. |
| P31 | It really makes sense for me. ... . It’s a great snapshot of now. I would love to see this in two years and in two years from there, depending on progression. I’m a list organization type person. This is a great way for me to see things, to see me on paper. it was great that you had the survey to start with, but this was much easier. I think with surveys, you tend to just [answer] whatever. You’re not always— not truthful, it’s just you’re not quite sure ... This picture is a really good way of taking that survey and organizing my thoughts and putting it correctly. |
| P34 | Building the map together visually guided me without leading me. I’m impressed...It’s logical and ordered. |
| P36 | It’s really hard to track your symptoms in a way that shows what’s most important, what’s not, and why ... . I thought it was a really nice, clear, concise way of trying to describe what’s most important to [me] ... .A lot of times, when you try to tell people about your symptoms, they don’t really understand what you’re saying. [This is] very good way of trying to describe it in a way that you can tell exactly what it is. |
| P37 | I like it ... . I get to think more about how I’m feeling, what I’m going through ... I’m a visual person [so] it was much better seeing the screen. Then you can actually analyze what I’m talking about and ... Then I can see it to move it down to the right categories. |
| P38 | The map is useful— everything’s interconnected, and everything has its own value. The map is useful to understand this situation, but discussion gets to the root of the issue how individuals are struggling ... This is valuable as one of multiple approaches to understand the person. |
| P39 | ((participant with word finding issues))i think it was helpful. It ... helped make it easier to [see] where things belonged or what matched what ... it reaffirmed. It opens up everything. It’s like— here’s where I’m looking for a word ... A confirmation [to be able to see it]. |
P1: It’s really hard to describe ... I haven’t thought about most bothersome to not bothersome to, “Well, what is it that bothers you?” This draws that out.
While most indicated they enjoyed the interview (95%), two found the in-depth discussion distressing and were offered the option to discontinue the interview. Distress was precipitated by deep reflection and heightened awareness of physical or cognitive decline. As one woman stated:
P28: This is really hard for me to talk about... It’s distressing any time I think about this ...
Despite this, both elected to continue the interview and expressed positive perceptions of mapping. Of 40 participants, 95% (38/40) asked to receive copies of their maps, and several indicated that opportunity to receive the maps had been an incentive to study participation.
P37: I would love to have [the maps]. I feel like I’m in all these studies, but I’m like, “I have no results!” ... Until now.
DISCUSSION
This is the first study to use symptom mapping to explore relevance of digital measures for monitoring meaningful aspects of disease from the perspectives of people with early PD. Overall, nine of the ten WATCH-PD measures were rated as relevant by both cognitive interviewing and mapping methodologies (70–92.5% vs. 80–100% respectively; Table 4). However, only two related to current, bothersome symptoms for more than 80% of participants (Tremor, Shape Rotation). Yet, our data suggested that eliminating measures based on lack of current symptoms may not align with patient preferences. For instance, nearly all speech tests were considered relevant (>80%) despite few reporting symptoms in this area (<50%). Thus, assessment of common impactful symptoms might be warranted prior to onset to support early detection, trending, and treatment, as has been suggested elsewhere [36, 37].
We observed that “relevance” of digital measures was based on three person-centric criteria not commonly captured in traditional content validity assessments: 1) believing they understanding what was being measured, 2) believing it targeted an important symptom of PD (past, present, or future), and 3) believing the measure was a good test. Conversely, participants did not require a measure to mimic “real” life to be personally relevant. These findings highlight differences in participant vs. research perspectives and underscore regulatory recommendations to prioritize patient experiences in development of clinical outcome assessments [8, 15, 38, 39]. Thus, evaluation of context validity (i.e., the DHT experience from the participant perspective) [40] in conjunction with content validity from the research perspective may be needed to achieve measures that are truly fit-for-purpose. A proposed approach to assessment of future measures inclusive of both components is presented in Fig. 5. Movement towards standardized assessment can improve understanding of relevance for diverse contexts-of-use [41]. Greater transparency regarding disclosing the purpose and capabilities of monitoring technologies could also enhance perceived relevance for patients.
Fig. 5
Recommended approach to assessing the relevance of digital measures for monitoring meaningful symptoms of disease. Use of a consistent 0–10 rating scale for each rated item (i.e., 0 = not important at all; 10 = most important, etc.) could improve comparison across technologies and trials.
Other pragmatic considerations exist with regards to balancing the psychological impact of testing. Our data present a conundrum: the desire of people with early PD to proactively monitor for current and future symptoms versus the potential for increased anxiety and hypervigilance induced by artificial monitoring. In this study, when participants performed well, they felt better about themselves and their disease state. Conversely when they struggled to perform, they felt more depressed and anxious. Concerns for negative monitoring effects have been raised in other DHT studies [42] and observed with disease screening [43–46], but have not been previously reported with monitoring for neurodegenerative disorders. Some participants suggested that retaining “easy” activities helped offset negative psychological consequences. Yet PD is progressive, with potential for increasingly negative psychological impact of testing as disease duration increases. Thus, including “easy” measures could present a short-term solution but does not address the issue of psychological harm over time. Furthermore, discouragement associated with performing difficult activities could impact measurement validity as participants might alter the way that they engage in these tests, as was observed with the Visual-Spatial Memory task. Incorporating measures that allow for a sense of success along with measures that capture difficulties could improve engagement, perceptions of DHTs, and measurement accuracy by decreasing use of behaviors that falsely inflate positive outcomes. Alternately, use of passive monitoring could reduce hypervigilance and confounding behaviors [47, 48]. Further research is warranted to understand the implications of digital monitoring in progressive diseases.
A final major contribution of this study is the methodology for mapping symptoms to digital measures. We found the approach beneficial in several ways, including 1) increased data granularity; 2) improved ability to demonstrate meaningful connections between symptoms and measures; 3) greater participant engagement and reciprocity; and 4) enhanced rigor and validity. Actionable qualitative patient experience data is urgently needed to enable systematic identification of meaningful aspects of health [49], guide selection of endpoints relevant to disease progression, and inform development of future monitoring technology [50].
Mapping is unique compared to strategies previously employed to investigate clinical meaningfulness [13, 15, 17, 18]. It represents a shift from convergent mixed-methods (i.e., collection of qualitative and quantitative data in a sequentially informing manner) towards nested or hybrid approaches where qualitative data are collected within a measurable framework amenable to quantification. In this approach, participants not only described experiences, but were able to assist in organizing and interpreting data by ranking meaningfulness. This process of co-creation enhances rigor and validity through deep engagement, constant reflection, and iterative member checking [33], and enables individuals to be more active participants in the data generation process. Simply put, interviewing is primarily about “taking” words whereas mapping is primarily about “making” meaning. The difference lies in the act of intentional co-creation, where a shared understanding is crafted between two individuals in a transparent manner amenable to identifying and correcting misunderstandings, with the benefit of enhanced reciprocity in sharing maps back to participants. In short, mapping offers ample flexibility to paint the highly personalized picture essential to good qualitative research with sufficient structure to enable systematic analysis and quantification of findings.
Limitations of this study included use of a predominantly white, college educated, and technologically literate study sample. Limited access to Wi-Fi or computer could restrict use in lower income, rural, or elderly populations. People with more advanced disease progression, reduced reading and technological literacy, or cognitive or visual impairments might also find the mapping techniques more challenging, and relevance of the technologies evaluated here may be different for these groups. These factors should be considered to ensure equitable access, and further research is warranted in more diverse populations and to replicate approaches longitudinally.
In conclusion, the findings presented here contribute to understanding the relevance, risks, and benefits of digital measures to monitor symptoms of early PD from the participant perspective. We believe the approaches will translate across a range of chronic diseases and research objectives, enabling systematic assessment of meaningful symptoms and relevance of new monitoring technologies.
ACKNOWLEDGMENTS
The researchers thank the many individuals who contributed to this work. The content is based solely on the perspectives of the authors and do not necessarily represent the official views of the Critical Path Institute, the US FDA or other sponsors. BrainBaseline application screenshots reprinted with permission from Clinical ink.
FUNDING
This study was funded by Critical Path for Parkinson’s (CPP). The CPP 3DT initiative is funded by the Critical Path for Parkinson’s Consortium members including: Biogen; GSK; Takeda; Lundbeck; UCB Pharma; Roche; AbbVie and Merck, Parkinson’s UK, and the Michael J Fox Foundation. Critical Path Institute is supported by the Food and Drug Administration (FDA) of the U.S. Department of Health and Human Services (HHS). Critical Path Institute is supported by the Food and Drug Administration (FDA) of the U.S. Department of Health and Human Services (HHS) and is 54.2% funded by the FDA/HHS, totaling $13,239,950, and 45.8% funded by non-government source(s), totaling $11,196,634. The contents are those of the author(s) and do not necessarily represent the official views of, nor an endorsement by, FDA/HHS or the U.S. Government.
CONFLICT OF INTEREST
GTS is an employee of Rush University and has consulting and advisory board membership with honoraria for: Acadia Pharmaceuticals; Adamas Pharmaceuticals, Inc.; Biogen, Inc.; Ceregene, Inc.; CHDI Management, Inc.; the Cleveland Clinic Foundation; Ingenix Pharmaceutical Services (i3 Research); MedGenesis Therapeutix, Inc.; Neurocrine Biosciences, Inc.; Pfizer, Inc.; Tools-4-Patients; Ultragenyx, Inc.; and the Sunshine Care Foundation. He has received grants from and done research for: the National Institutes of Health, the Department of Defense, the Michael J. Fox Foundation for Parkinson’s Research, the Dystonia Coalition, CHDI, the Cleveland Clinic Foundation, the International Parkinson and Movement Disorder Society, and CBD Solutions, and has received honoraria from: the International Parkinson and Movement Disorder Society, the American Academy of Neurology, the Michael J. Fox Foundation for Parkinson’s Research, the FDA, the National Institutes of Health, and the Alzheimer’s Association. JC is Director of Digital Health Strategy at AbbVie and Industry Co-Director of CPP. TD is Executive Medical Director at Biogen. JH Is Senior Scientist, Patient Insights at H. Lundbeck A/S, Valby, Denmark. TS has served as a consultant for Acadia, Blue Rock Therapeutics, Caraway Therapeutics, Critical Path for Parkinson’s Consortium (CPP), Denali, General Electric (GE), Neuroderm, Sanofi, Sinopia, Sunovion, Roche, Takeda, MJFF, Vanqua Bio and Voyager. She served on the ad board for Acadia, Denali, General Electric (GE), Sunovion, Roche. She has served as a member of the scientific advisory board of Caraway Therapeutics, Neuroderm, Sanofi and UCB. She has received research funding from Biogen, Roche, Neuroderm, Sanofi, Sun Pharma, Amneal, Prevail, UCB, NINDS, MJFF, Parkinson’s Foundation. ERD has stock ownership in Grand Rounds, an online second opinion service, has received consultancy fees from 23andMe, Abbott, Abbvie, Amwell, Biogen, Clintrex, CuraSen, DeciBio, Denali Therapeutics, GlaxoSmithKline, Grand Rounds, Huntington Study Group, Informa Pharma Consulting, medical-legal services, Mednick Associates, Medopad, Olson Research Group, Origent Data Sciences, Inc., Pear Therapeutics, Prilenia, Roche, Sanofi, Shire, Spark Therapeutics, Sunovion Pharmaceuticals, Voyager Therapeutics, ZS Consulting, honoraria from Alzeimer’s Drug Discovery Foundation, American Academy of Neurology, American Neurological Association, California Pacific Medical Center, Excellus BlueCross BlueShield, Food and Drug Administration, MCM Education, The Michael J Fox Foundation, Stanford University, UC Irvine, University of Michigan, and research funding from Abbvie, Acadia Pharmaceuticals, AMC Health, BioSensics, Burroughs Wellcome Fund, Greater Rochester Health Foundation, Huntington Study Group, Michael J. Fox Foundation, National Institutes of Health, Nuredis, Inc., Patient-Centered Outcomes Research Institute, Pfizer, Photopharmics, Roche, Safra Foundation. JLA has received honoraria from Huntington Study Group, research support from National Institutes of Health, The Michael J Fox Foundation, Biogen, Safra Foundation, Empire Clinical Research Investigator Program, and consultancy fees from VisualDx.
TS is an Editorial Board Member of this journal but was not involved in the peer review
process nor had access to any information regarding its peer-review.
The following authors (JRM, RMS, MLTMM, PY, MC, JEC, SJR, MK, KWB, DS) have no conflict of interest to disclose.
DATA AVAILABILITY
Data are available to members of the Critical Path for Parkinson’s Consortium 3DT Initiative Stage 2. For those who are not a part of 3DT Stage 2, a proposal may be made to the WATCH-PD Steering Committee (via the corresponding author) for de-identified datasets.
SUPPLEMENTARY MATERIAL
[1] The supplementary material is available in the electronic version of this article: https://dx.doi.org/10.3233/JPD-225122.
REFERENCES
[1] | Regnault A , Boroojerdi B , Meunier J , Bani M , Morel T , Cano S ((2019) ) Does the MDS-UPDRS provide the precision to assess progression in early Parkinson’s disease? Learnings from the Parkinson’s progression marker initiative cohort. J Neurol 266: , 1927–1936. |
[2] | Zolfaghari S , Thomann AE , Lewandowski N , Trundell D , Lipsmeier F , Pagano G , Taylor KI , Postuma RB ((2022) ) Self-report versus clinician examination in early Parkinson’s disease. Mov Disord 37: , 585–597. |
[3] | Mantri S , Wood S , Duda JE , Morley JF ((2019) ) Comparing self-reported and objective monitoring of physical activity in Parkinson disease. Parkinsonism Relat Disord 67: , 56–59. |
[4] | Rovini E , Maremmani C , Cavallo F ((2017) ) How wearable sensors can support Parkinson’s disease diagnosis and treatment: A systematic review. Front Neurosci 11: , 555. |
[5] | Espay AJ , Hausdorff JM , Sanchez-Ferro A , Klucken J , Merola A , Bonato P , Paul SS , Horak FB , Vizcarra JA , Mestre TA , Reilmann R , Nieuwboer A , Dorsey ER , Rochester L , Bloem BR , Maetzler W , Movement Disorder Society Task Force on Technology ((2019) ) A roadmap for implementation of patient-centered digital outcome measures in Parkinson’s disease obtained using mobile health technologies. Mov Disord 34: , 657–663. |
[6] | Smuck M , Odonkor CA , Wilt JK , Schmidt N , Swiernik MA ((2021) ) The emerging clinical role of wearables: Factors for successful implementation in healthcare. NPJ Digit Med 4: , 45. |
[7] | Knight SR , Ng N , Tsanas A , McLean K , Pagliari C , Harrison EM ((2021) ) Mobile devices and wearable technology for measuring patient outcomes after surgery: A systematic review. NPJ Digit Med 4: , 157. |
[8] | USDHHS (2022) Patient-focused drug development: Methods to identify what is important to patients (Guidance for industry, food and drug administration staff, and other stakeholders). Retrieved from https://www.fda.gov/regulatory-information/search-fda-guidance-documents/patient-focused-drug-development-methods-identify-what-important-patients. |
[9] | Lo C , Arora S , Baig F , Lawton MA , El Mouden C , Barber TR , Ruffmann C , Klein JC , Brown P , Ben-Shlomo Y , de Vos M , Hu MT ((2019) ) Predicting motor, cognitive & functional impairment in Parkinson’s. Ann Clin Transl Neurol 6: , 1498–1509. |
[10] | Jha A , Menozzi E , Oyekan R , Latorre A , Mulroy E , Schreglmann SR , Stamate C , Daskalopoulos I , Kueppers S , Luchini M , Rothwell JC , Roussos G , Bhatia KP ((2020) ) The CloudUPDRS smartphone software in Parkinson’s study: Cross-validation against blinded human raters. NPJ Parkinsons Dis 6: , 36. |
[11] | Lipsmeier F , Taylor KI , Postuma RB , Volkova-Volkmar E , Kilchenmann T , Mollenhauer B , Bamdadian A , Popp WL , Cheng W-Y , Zhang Y-P , Wolf D , Schjodt-Eriksen J , Boulay A , Svoboda H , Zago W , Pagano G , Lindemann M ((2022) ) Reliability and validity of the Roche PD Mobile Application for remote monitoring of early Parkinson’s disease. Sci Rep 12: , 12081. |
[12] | Artusi CA , Imbalzano G , Sturchio A , Pilotto A , Montanaro E , Padovani A , Lopiano L , Maetzler W , Espay AJ ((2020) ) Implementation of mobile health technologies in clinical trials of movement disorders: Underutilized potential. Neurotherapeutics 17: , 1736–1746. |
[13] | Taylor KI , Staunton H , Lipsmeier F , Nobbs D , Lindemann M ((2020) ) Outcome measures based on digital health technology sensor data: Data- and patient-centric approaches. NPJ Digit Med 3: , 97. |
[14] | Port RJ , Rumsby M , Brown G , Harrison IF , Amjad A , Bale CJ ((2021) ) People with Parkinson’s disease: What symptoms do they most want to improve and how does this change with disease duration? J Parkinsons Dis 11: , 715–724. |
[15] | Morel T , Cleanthous S , Andrejack J , Barker RA , Blavat G , Brooks W , Burns P , Cano S , Gallagher C , Gosden L , Siu C , Slagle AF , Trenam K , Boroojerdi B , Ratcliffe N , Schroeder K ((2022) ) Patient experience in early-stage Parkinson’s disease: Using a mixed methods analysis to identify which concepts are cardinal for clinical trial outcome assessment. Neurol Ther 11: , 1319–1340. |
[16] | Staunton H , Kelly K , Newton L , Leddin M , Rodriguez-Esteban R , Chaudhuri KR , Weintraub D , Postuma RB , Martinez-Martin P ((2022) ) A patient-centered conceptual model of symptoms and their impact in early Parkinson’s disease: A qualitative study. J Parkinsons Dis 12: , 137–151. |
[17] | Goldsack JC , Coravos A , Bakker JP , Bent B , Dowling AV , Fitzer-Attas C , Godfrey A , Godino JG , Gujar N , Izmailova E , Manta C , Peterson B , Vandendriessche B , Wood WA , Wang KW , Dunn J ((2020) ) Verification, analytical validation, and clinical validation (V3): The foundation of determining fit-for-purpose for Biometric Monitoring Technologies (BioMeTs). NPJ Digit Med 3: , 55. |
[18] | CTTI, Clinical Trials Transformation Initiative, https://ctti-clinicaltrials.org/, Accessed 2022. |
[19] | USDHHS (2018) Patient-focused drug development: Collecting comprehensive and representative input. Retrieved from https://www.fda.gov/regulatory-information/search-fda-guidance-documents/patient-focused-drug-development-collecting-comprehensive-and-representative-input. |
[20] | van der Velden RMJ , Mulders AEP , Drukker M , Kuijf ML , Leentjens AFG ((2018) ) Network analysis of symptoms in a Parkinson patient using experience sampling data: An n=1 study. Mov Disord 33: , 1938–1944. |
[21] | Dorsey E, Wearable Assessments in the Clinic and Home in PD (WATCH-PD), https://clinicaltrials.gov/ct2/show/NCT03681015, |
[22] | Althubaiti A ((2016) ) Information bias in health research: Definition, pitfalls, and adjustment methods. J Multidiscip Healthc 9: , 211–217. |
[23] | Harris PA , Taylor R , Minor BL , Elliott V , Fernandez M , O’Neal L , McLeod L , Delacqua G , Delacqua F , Kirby J , Duda SN , Consortium RE ((2019) ) The REDCap consortium: Building an international community of software platform partners. J Biomed Inform 95: , 103208. |
[24] | Harris PA , Taylor R , Thielke R , Payne J , Gonzalez N , Conde JG ((2009) ) Research electronic data capture (REDCap)–a metadata-driven methodology and workflow process for providing translational research informatics support. J Biomed Inform 42: , 377–381. |
[25] | Mammen J , Norton S , Rhee H , Butz A ((2016) ) New approaches to qualitative interviewing: Development of a card sort technique to understand subjective patterns of symptoms and responses. Int J Nurs Stud 58: , 90–96. |
[26] | Mammen JR , Rhee H , Norton SA , Butz AM ((2017) ) Perceptions and experiences underlying self-management and reporting of symptoms in teens with asthma. J Asthma 54: , 143–152. |
[27] | Mammen JR , Turgeon K , Philibert A , Schoonmaker JD , Java J , Halterman J , Berliant MN , Crowley A , Reznik M , Feldman JM , Fortuna RJ , Arcoleo K ((2021) ) A mixed-methods analysis of younger adults’ perceptions of asthma, self-management, and preventive care: “This isn’t helping me none”. Clin Exp Allergy 51: , 63–77. |
[28] | Mammen JR , Mammen CR ((2018) ) Beyond concept analysis: Uses of mind mapping software for visual representation, management, and analysis of diverse digital data. Res Nurs Health 41: , 583–592. |
[29] | Hsieh HF , Shannon SE ((2005) ) Three approaches to qualitative content analysis. Qual Health Res 15: , 1277–1288. |
[30] | Akoglu H ((2018) ) User’s guide to correlation coefficients. Turk J Emerg Med 18: , 91–93. |
[31] | Ayres L , Kavanaugh K , Knafl KA ((2003) ) Within-case and across-case approaches to qualitative data analysis. Qual Health Res 13: , 871–883. |
[32] | Saldaña J ((2013) ) The Coding Manual for Qualitative Researchers, Sage,Washington, DC. |
[33] | Maxwell JA ((2012) ) Qualitative Research Design: An Interactive Approach,Sage, Thousand Oaks, CA. |
[34] | Guest G , Bunce A , Johnson L ((2005) ) How many interviews are enought?: An experiment with data saturation and variability. Field Methods 18: , 59–82. |
[35] | Hennink MM , Kaiser BN , Weber MB ((2019) ) What influences saturation? Estimating sample sizes in focus group research. Qual Health Res 29: , 1483–1496. |
[36] | van Halteren AD , Munneke M , Smit E , Thomas S , Bloem BR , Darweesh SKL ((2020) ) Personalized care management for persons with Parkinson’s disease. J Parkinsons Dis 10: , S11–S20. |
[37] | Bloem BR , Henderson EJ , Dorsey ER , Okun MS , Okubadejo N , Chan P , Andrejack J , Darweesh SKL , Munneke M ((2020) ) Integrated and patient-centred management of Parkinson’s disease: A network model for reshaping chronic neurological care. Lancet Neurol 19: , 623–634. |
[38] | Bhidayasiri R , Panyakaew P , Trenkwalder C , Jeon B , Hattori N , Jagota P , Wu YR , Moro E , Lim SY , Shang H , Rosales R , Lee JY , Thit WM , Tan EK , Lim TT , Tran NT , Binh NT , Phoumindr A , Boonmongkol T , Phokaewvarangkul O , Thongchuam Y , Vorachit S , Plengsri R , Chokpatcharavate M , Fernandez HH ((2020) ) Delivering patient-centered care in Parkinson’s disease: Challenges and consensus from an international panel. Parkinsonism Relat Disord 72: , 82–87. |
[39] | Sacks L , Kunkoski E ((2021) ) Digital health technology to measure drug efficacy in clinical trials for Parkinson’s disease: A regulatory perspective. J Parkinsons Dis 11: , S111–S115. |
[40] | Skinner CH ((2013) ) Contextual validity: Knowing what works is necessary, but not sufficient. School Psychol 67: , 14–21. |
[41] | USDHHS (2022) Patient-focused drug development: Selecting, Developing, or Modifying Fit-for-Purpose Clinical Outcome Assessments (Draft Guidance 3), https://www.fda.gov/regulatory-information/search-fda-guidance-documents/patient-focused-drug-development-selecting-developing-or-modifying-fit-purpose-clinical-outcome. |
[42] | Kanstrup AM , Bertelsen P , Jensen MB ((2018) ) Contradictions in digital health engagement: An activity tracker’s ambiguous influence on vulnerable young adults’ engagement in own health. Digit Health 4: , 2055207618775192. |
[43] | Oliveri S , Ferrari F , Manfrinati A , Pravettoni G ((2018) ) A systematic review of the psychological implications of genetic testing: A comparative analysis among cardiovascular, neurodegenerative and cancer diseases. Front Genet 9: , 624. |
[44] | Yang C , Sriranjan V , Abou-Setta AM , Poluha W , Walker JR , Singh H ((2018) ) Anxiety associated with colonoscopy and flexible sigmoidoscopy: A systematic review. Am J Gastroenterol 113: , 1810–1818. |
[45] | Yanes T , Willis AM , Meiser B , Tucker KM , Best M ((2019) ) Psychosocial and behavioral outcomes of genomic testing in cancer: A systematic review. Eur J Hum Genet 27: , 28–35. |
[46] | Gopie JP , Vasen HF , Tibben A ((2012) ) Surveillance for hereditary cancer: Does the benefit outweigh the psychological burden?–A systematic review. Crit Rev Oncol Hematol 83: , 329–340. |
[47] | Virbel-Fleischman C , Retory Y , Hardy S , Huiban C , Corvol JC , Grabli D ((2022) ) Body-worn sensors for Parkinson’s disease: A qualitative approach with patients and healthcare professionals. PLoS One 17: , e0265438. |
[48] | Encarna Micó-Amigo M , Bonci T , Paraschiv-Ionescu A , Ullrich M , Kirk C , Soltani A , Küderle A , Gazit E , Salis F , Alcock L , et al. ((2022) ) Assessing real-world gait with digital technology? Validation, insights and recommendations from the Mobilise-D consortium. Research Square https://doi.org/10.21203/rs.3.rs-2088115/v1. |
[49] | Mulders AEP , van der Velden RMJ , Drukker M , Broen MPG , Kuijf ML , Leentjens AFG ((2020) ) Usability of the experience sampling method in Parkinson’s disease on a group and individual level. Mov Disord 35: , 1145–1152. |
[50] | Wilson H , Dashiell-Aje E , Anatchkova M , Coyne K , Hareendran A , Leidy NK , McHorney CA , Wyrwich K ((2018) ) Beyond study participants: A framework for engaging patients in the selection or development of clinical outcome assessments for evaluating the benefits of treatment in medical product development. Qual Life Res 27: , 5–16. |

