
Effects of Very Low- and High-Frequency Subthalamic Stimulation on Motor Cortical Oscillations During Rhythmic Lower-Limb Movements in Parkinson’s Disease Patients
Abstract
Background:
Standard high-frequency deep brain stimulation (HF-DBS) at the subthalamic nucleus (STN) is less effective for lower-limb motor dysfunctions in Parkinson’s disease (PD) patients. However, the effects of very low frequency (VLF; 4 Hz)-DBS on lower-limb movement and motor cortical oscillations have not been compared.
Objective:
To compare the effects of VLF-DBS and HF-DBS at the STN on a lower-limb pedaling motor task and motor cortical oscillations in patients with PD and with and without freezing of gait (FOG).
Methods:
Thirteen PD patients with bilateral STN-DBS performed a cue-triggered lower-limb pedaling motor task with electroencephalography (EEG) in OFF-DBS, VLF-DBS (4 Hz), and HF-DBS (120-175 Hz) states. We performed spectral analysis on the preparatory signals and compared GO-cue-triggered theta and movement-related beta oscillations over motor cortical regions across DBS conditions in PD patients and subgroups (PDFOG–and PDFOG+).
Results:
Both VLF-DBS and HF-DBS decreased the linear speed of the pedaling task in PD, and HF-DBS decreased speed in both PDFOG–and PDFOG+. Preparatory theta and beta activities were increased with both stimulation frequencies. Both DBS frequencies increased motor cortical theta activity during pedaling movement in PD patients, but this increase was only observed in the PDFOG + group. Beta activity was not significantly different from OFF-DBS at either frequency regardless of FOG status.
Conclusion:
Results suggest that VL and HF DBS may induce similar effects on lower-limb kinematics by impairing movement speed and modulating motor cortical oscillations in the lower frequency band.
INTRODUCTION
Lower-extremity motor abnormalities are common in patients with Parkinson’s disease (PD) and frequently disabling. In addition to the common symptoms of bradykinesia, rigidity, and tremors in the lower extremities, as the disease progresses more than 50% of PD patients will exhibit problems maintaining postural stability and will develop freezing of gait (FOG), characterized by difficulty initiating and executing lower-limb movements [1, 2]. These lower-extremity motor symptoms can cause falls and affect the daily life of PD patients [3, 4]. Moreover, antiparkinsonian medications are less effective at treating gait-related impairment as the disease progresses [5–7]. Furthermore, while high-frequency (HF) deep brain stimulation (DBS) of basal ganglia nuclei including the subthalamic nucleus (STN) and globus pallidus pars internus (GPi) is an effective therapy for appendicular motor symptoms of PD including tremors, rigidity, and akinesia [8, 9], it is less effective in treating rhythmic lower-extremity motor abnormalities specific to walking [10, 11]. Recent evidence suggests that non-motor factors such as cognitive deficits, sleep disorders, and depression are associated with these lower-extremity motor abnormalities in PD [12–14], with electrophysiological and imaging studies suggesting disturbances in cortical and subcortical networks in these patients [15–17]. Overall, rhythmic lower-extremity motor dysfunction is a complex phenomenon that includes motor and non-motor factors as well as different brain networks.
Studies have shown that STN HF-DBS improves upper-limb movements and is associated with reduced beta oscillatory power in motor cortical and basal ganglia networks [18–21], and using a sensing neurostimulator, STN HF-DBS has been shown to reduce STN beta oscillations in a voltage-dependent manner during free walking [22]. However, the effects of STN-DBS on rhythmic lower-limb movements and cortical and subcortical oscillations have not been described in patients with PD and FOG in detail. Our previous study using electroencephalography (EEG) demonstrated reduced theta and increased beta power in the midfrontal region during a cue-based lower-limb pedaling motor task in non-DBS PD patients with FOG (PDFOG+) compared to patients without FOG (PDFOG–) and healthy controls [23]. In addition, abnormal low-frequency delta and theta oscillations in midfrontal regions were observed during motor and cognitive tasks in PDFOG- and PDFOG + patients compared to control subjects [24–26]. Increased STN beta power has also been noticed in PDFOG + compared to PDFOG–when walking on a treadmill machine and was correlated with FOG episodes [27], which suggests that propagation of increased beta power in cortical and subcortical networks may be associated with lower-extremity motor dysfunction. Altogether, these studies indicate the contribution of midfrontal cortical theta and beta oscillations in lower-limb movements that can represent both cognitive and motor systems required for proper gait. Therefore, it is crucial to study the effects of both low and high frequency STN-DBS on rhythmic lower-limb movements and motor cortical oscillations.
Based on these previous studies demonstrating altered beta oscillations in FOG, as well as our own previous work showing deficits in theta oscillations, we hypothesize that abnormal theta and beta oscillations in the motor cortical region underlie lower-limb motor dysfunction in PD. We tested our hypothesis by comparing the kinematic effects of VLF (in the theta frequency; 4 Hz) and HF (120–175 Hz)-DBS at the STN on a cue-triggered lower-limb pedaling motor task and examining motor cortical theta and beta oscillations in PD patients. Further, we examined the role of FOG by comparing the effects of VLF- and HF-DBS in PDFOG + and PDFOG–. Since STN HF-DBS is less effective at alleviating lower-limb motor dysfunction, we predicted no changes in cue-triggered movement-related motor cortical beta oscillations but modulation in cue-triggered theta oscillations compared to OFF-DBS.
MATERIALS AND METHODS
Participants, DBS parameters, and lower-limb motor task
A total of 13 participants were recruited for the study, including 6 people with PDFOG + and 7 people with PDFOG–. All participants were assessed by a neurologist to validate that they met the diagnostic criteria recommended by the United Kingdom PD Society Brain Bank criteria. All participants provided written informed consent and all experimental procedures were approved by the University of Iowa Institutional Review Board in accordance with the Declaration of Helsinki and the Ethics Committee on Human Research. All participants were implanted with DBS electrodes in the STN bilaterally using standard protocols and were tested with their usual anti-parkinsonian medication (see Supplementary Table 1 for each subject’s dosage) to reduce fall risk in PDFOG + participants and observe the DBS effects under real-world conditions. Participants were separated into FOG subgroups based on their responses to the FOG questionnaire [28, 29], with those having a value more than 0 for question 3 and a total score equal to or greater than 8 (max. 24) included in the PDFOG + subgroup [12, 24]. In addition, these participants confirmed that they had problems starting, stopping, and turning while walking. Portions of the data for this study were managed using REDCap electronic data capture tools hosted at the University of Iowa [30, 31]. Table 1 shows the demographic and clinical information of all participants in detail.
Table 1
Demographics and clinical scores
| PD | PDFOG– | PDFOG+ | PDFOG–vs. PDFOG + | |
| Independent t-test | ||||
| Gender (M/F) | 11/2 | 6/1 | 5/1 | – |
| Age (y) | 62.3±5.5 | 69.1±1.7 | 54.2±11.2 | 1.42 (0.18) |
| DD (y) | 9±1 | 7.6±1.1 | 10.7±1.6 | –1.66 (0.12) |
| LEDD (mg) | 949.4±207.2 | 1252.6±330.8 | 595.7±153.4 | 1.7 (0.117) |
| MOCA | 21.2±2.1 | 20.7±3.7 | 21.8±1.6 | –0.26 (0.8) |
| FOGQ | 7.4±1.8 | 2.4±1.1 | 13.2±1.5 | –5.88 (< 0.001)*** |
| mUPDRS | 24.4±3.8 | 21±5.9 | 28.3±4.3 | –0.97 (0.35) |
Values are shown as mean±SEM. Statistics reported as t-score (p-value). DD, disease duration; LEDD, Levodopa equivalent daily dosage; MoCA, Montreal Cognitive Assessment; FOGQ, Freezing of Gait Questionnaire;mUPDRS,motor portion of the Unified Parkinson’s Disease Rating Scale. ***p < 0.001. All clinical assessments were performed when DBS was ON with therapeutic settings.
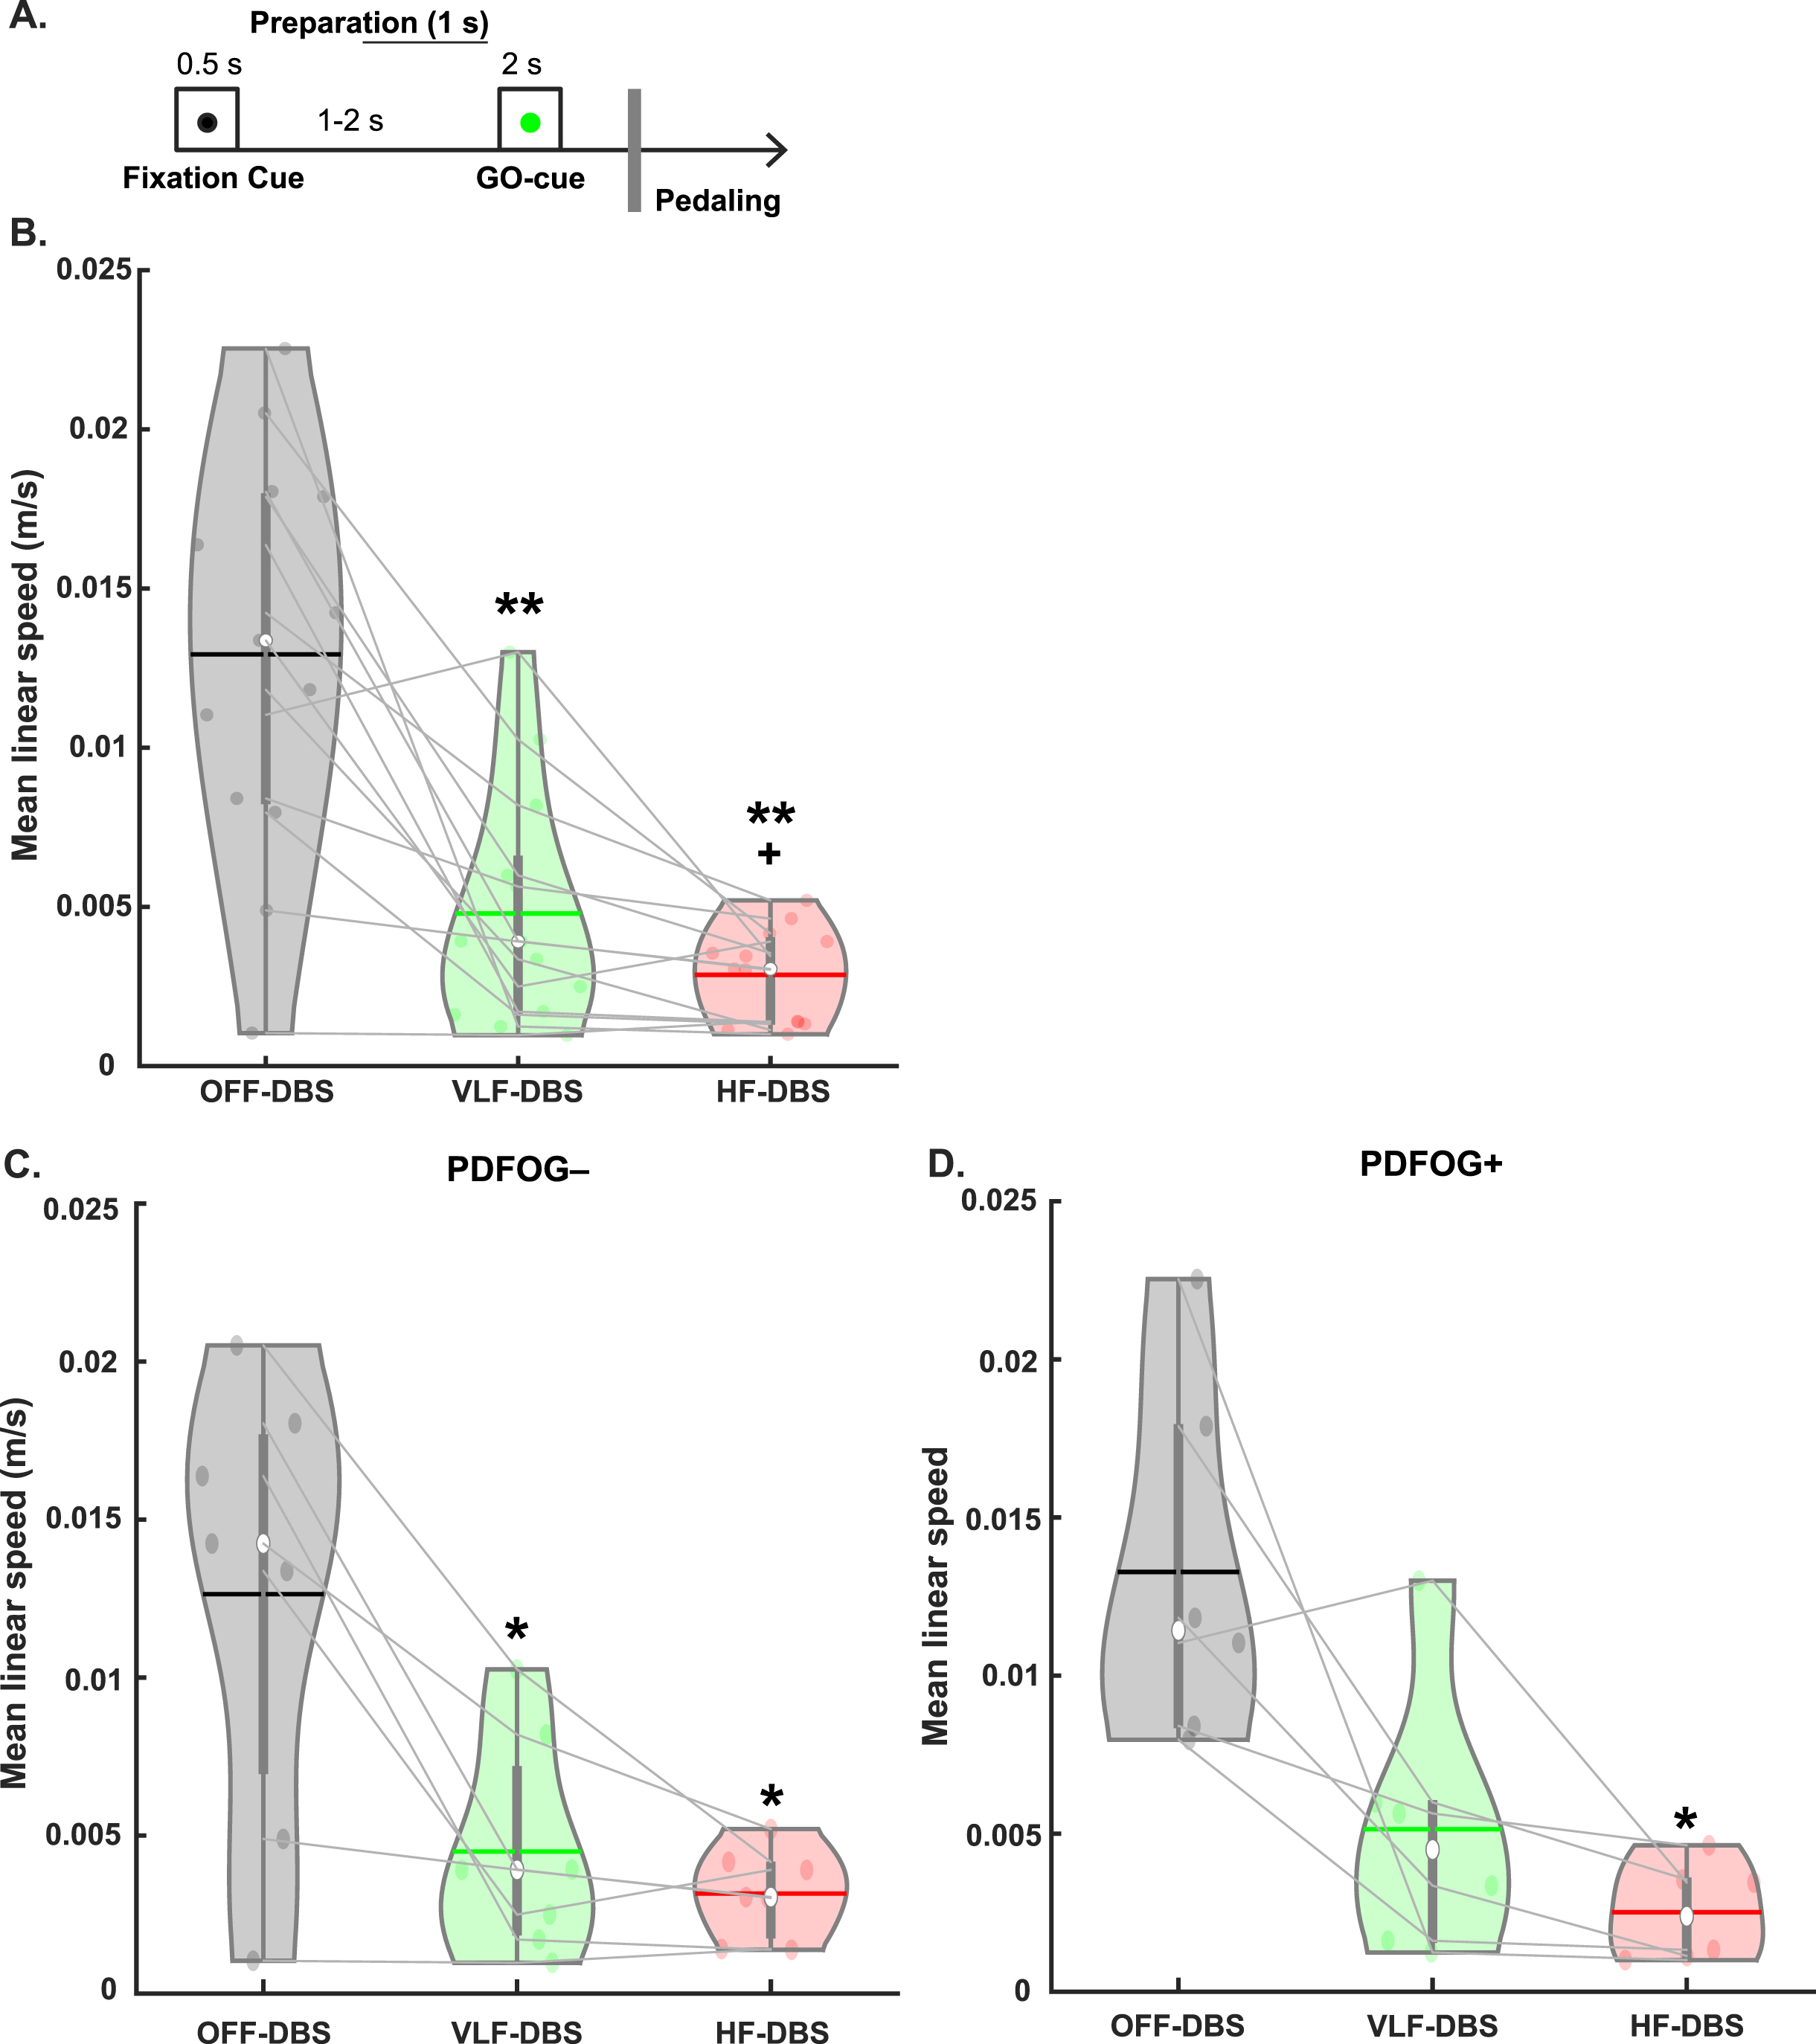
For each of the tasks, subjects received STN-DBS at very low frequency (theta: 4 Hz), high frequency (120–175 Hz), or 0 Hz (OFF) stimulation in a randomized fashion to determine the effect of different frequencies of DBS on GO-cue-triggered lower-limb pedaling task performance and motor cortical oscillations. Acute delivery of STN stimulation is associated with transient sensory effects, which could have affected the outcomes. Therefore, EEG recordings were not obtained immediately after changing stimulation parameters. After each stimulation frequency change, we waited at least 20 minutes before performing the pedaling task to allow for washout of previous stimulation effects. All other stimulation parameters such as contacts, amplitude, and pulse width were not changed with respect to the chronic DBS setting with optimal clinical response in each individual participant. The lower-limb pedaling task was performed similar to previous studies [23, 32]. This task was utilized over a gait task due to the high risk of falls in PD patients. Briefly, for each lower-limb pedaling motor task trial, a fixation cue for 0.5 s was followed by (1–2 s later) a GO-cue for 2 s on the monitor with 3 s of inter-trial interval (Fig. 1A). PD subjects completed one rotation on the stationary pedals upon seeing the GO-cue and then stopped the pedal. A 3-axis accelerometer was fastened to the ankle of one leg. The task was repeated for 30 trials across two blocks.
Fig. 1
Behavioral task and effects of STN-DBS on movement kinematics. A) A fixation cue was displayed for 0.5 s followed by (1–2 s later) a GO cue for 2 s to prompt the beginning of pedaling. B) Very low frequency (VLF)- and high-frequency (HF)-DBS at the STN results in a decrease in mean linear speed during the lower-limb pedaling task compared to OFF-DBS. C) Similar decreases are observed in the PDFOG–subgroup. D) Only high-frequency STN-DBS results in a decrease in mean linear speed in the PDFOG + subgroup. *p < 0.05, **p < 0.01 vs. OFF-DBS. + p < 0.05 vs. VLF-DBS. In violin plots, horizontal lines and white circles represent the mean and median values, respectively.
Pedaling speed calculation
Studies have shown that PD patients can exhibit discontinuous variations in speed during continuous and repetitive pedaling that can be counted as having severe lower-extremity dysfunction and freezing phenomena [23, 33, 34]. Based on our previous study [23], we computed the linear speed for each pedaling trial from the x-axis of the accelerometer signal. Briefly, we selected 0–2000 ms from the GO cue as the time-window to compute linear speed of the pedaling performance, with faster linear speed representing better performance. The x-axis accelerometer signal was detrended and low-pass filtered at 5 Hz and the mean linear speed (m/s) was computed for each trial and then averaged.
EEG recordings and processing
For each stimulation condition, EEG signals were acquired during the pedaling task using a 64-channel cap with a 0.1 Hz high-pass filter sampled at 5000 Hz with electrode Pz as a reference channel. All EEG signals were imported and processed in EEGLAB. Electrodes Fp1, Fp2, FT9, FT10, TP9, and TP10 were removed due to contamination from eye-blink and muscle artifact. First, we applied the DBSFILT Matlab-based function (https://sourceforge.net/projects/dbsfilt/files/) to attenuate DBS artifacts [35]. Basically, this function follows three steps: 1) Temporal Filtering: this step filters the signal; 2) Spike Detection: this step identifies spikes based on the Hampel identifier for automated spike detection; 3) Spike Removal: in this step, an identifier treats artefacts as outliers in the frequency domain and replaces them with interpolated values [36, 37]. Signals were then resampled to 500 Hz, epoched, and re-referenced to the average. For the pedaling task, data were epoched starting 1000 ms prior to the onset of the ‘GO’ cue until 3000 ms after the ‘GO’ cue. Similar to our previous studies [23, 32], bad channels and epochs were detected using a conjunction of the FASTER algorithm and pop_rejchan from EEGLAB and were subsequently interpolated and rejected respectively. Furthermore, eye blinks were removed following the ICA method.
Signal analysis
First, based on our hypothesis, we calculated relative theta and beta-band power during preparation for movement, between when the fixation cue and the GO-cue occurred. These preparatory signals (from –1000 ms to when the GO-cue appeared) were filtered from 0.1 to 50 Hz and then spectral analysis using the pwelch function was performed. Relative power was calculated in each frequency band (i.e., dividing the power in each frequency by the total spectral power). Next, mean spectral data from the cluster of motor cortical electrodes was computed and theta (5–8 Hz) and beta (13–30 Hz) relative power values were exported for the statistical analyses. Later, time-frequency analysis was performed by complex Morlet wavelets, as explained previously [23, 25, 26]. Each epoch was then cut in length (–500 to + 2000 ms after the GO cue), and the baseline for each frequency consisted of the average power from –300 to –200 ms to the onset of the GO cue. Based on our a priori hypothesis, we confined our time-frequency analyses to a motor cortical cluster and focused on the hypothesized role of motor cortical theta and beta oscillations during the cue-triggered pedaling task. For the analyses, we used averaged time-frequency data from our motor cortical region of interest comprising of the electrodes C3, C1, Cz, C2, and C4. In our previous studies [23, 26], we have shown that abnormal motor cortical theta activity has been associated with cue-evoked responses as well as attention and motor preparation or initiation in people with PD, therefore, we selected 100 ms prior to 200 ms after the ‘GO’ cue to examine theta-band (5–8 Hz) activity. In addition, previous studies [23] have shown abnormal motor cortical beta activity during motor execution. Accordingly, we selected 500 ms to 2,000 ms after the ‘GO’ cue to examine beta-band (13–30 Hz) activity since participants executed the motor task during that period. Also, we set the size threshold for chance occurrence of the statistical cluster against 500 permutations for time-frequency analyses.
Statistical analysis
Prior to all statistical analyses, the Shapiro-Wilk test was performed to test the normality of the data. In addition, Mauchly’s test of sphericity was performed, and Greenhouse-Geisser corrections were applied when the assumption of sphericity had been violated. Initially, to observe the differences between different DBS frequencies on pedaling performance, we ran one-way repeated measures ANOVAs (rmANOVAs) on accelerometer data comparing linear speed between OFF-DBS, VLF-DBS, and HF-DBS, followed by false discovery rate (FDR) correction using the Benjamini & Hochberg procedure [38] to adjust the p-values. To consider the role of FOG, we ran separate rmANOVAs in PDFOG + and PDFOG–subgroups comparing the effects of different DBS frequencies on linear speed of the pedaling task. We took this stratified approach due to the low sample size, to limit the number of parameters in the model, and in order to avoid imposing assumptions about similarity of the data across the FOG strata. We next examined the effects of DBS frequencies on preparatory relative theta and beta values via rmANOVAs. We ran similar rmANOVAs on task-related motor cortical theta and beta power values. Furthermore, we performed correlation analyses between linear speed of the pedaling task and task-related theta and beta power values at OFF-DBS, VLF-DBS, and HF-DBS. Finally, we again took a stratified approach and ran separate rmANOVAs in PDFOG + and PDFOG–subgroups to examine the effects of the different DBS frequencies on preparatory theta and beta power and movement-related theta power and beta power.
RESULTS
The one-way rmANOVA examining the effect of different frequencies of stimulation on pedaling kinematics (mean linear speed) revealed a main effect of stimulation (F1.31,15.76 = 24.05, p < 0.001; Fig. 1B). Pairwise comparisons were FDR corrected and revealed a significant reduction in mean linear speed of the pedaling task in VLF-DBS (p < 0.01) and HF-DBS (p < 0.01) compared to OFF-DBS, and in HF-DBS compared to VLF-DBS (p = 0.04). We also performed these same analyses in PDFOG–and PDFOG + subgroups. In the PDFOG–subgroup, a main effect of stimulation on mean linear speed was observed (F2,12 = 12.94, p = 0.001; Fig. 1C) with pairwise differences showing a reduction in mean linear speed in VLF-DBS (p = 0.02) and HF-DBS (p = 0.02) compared to OFF-DBS. No difference was observed between VLF-DBS and HF-DBS (p = 0.21). In PDFOG+, a main effect of stimulation was also observed (F2,10 = 9.63, p = 0.005; Fig. 1D), with a reduction in mean linear speed for HF-DBS (p = 0.03) compared to OFF-DBS. No pairwise differences were observed between OFF-DBS and VLF-DBS (p = 0.08) or between VLF-DBS and HF-DBS (p = 0.13). These results demonstrate that STN-DBS at very low (4 Hz) or higher frequencies (120–175 Hz) cannot improve the kinematics of lower-limb movements.
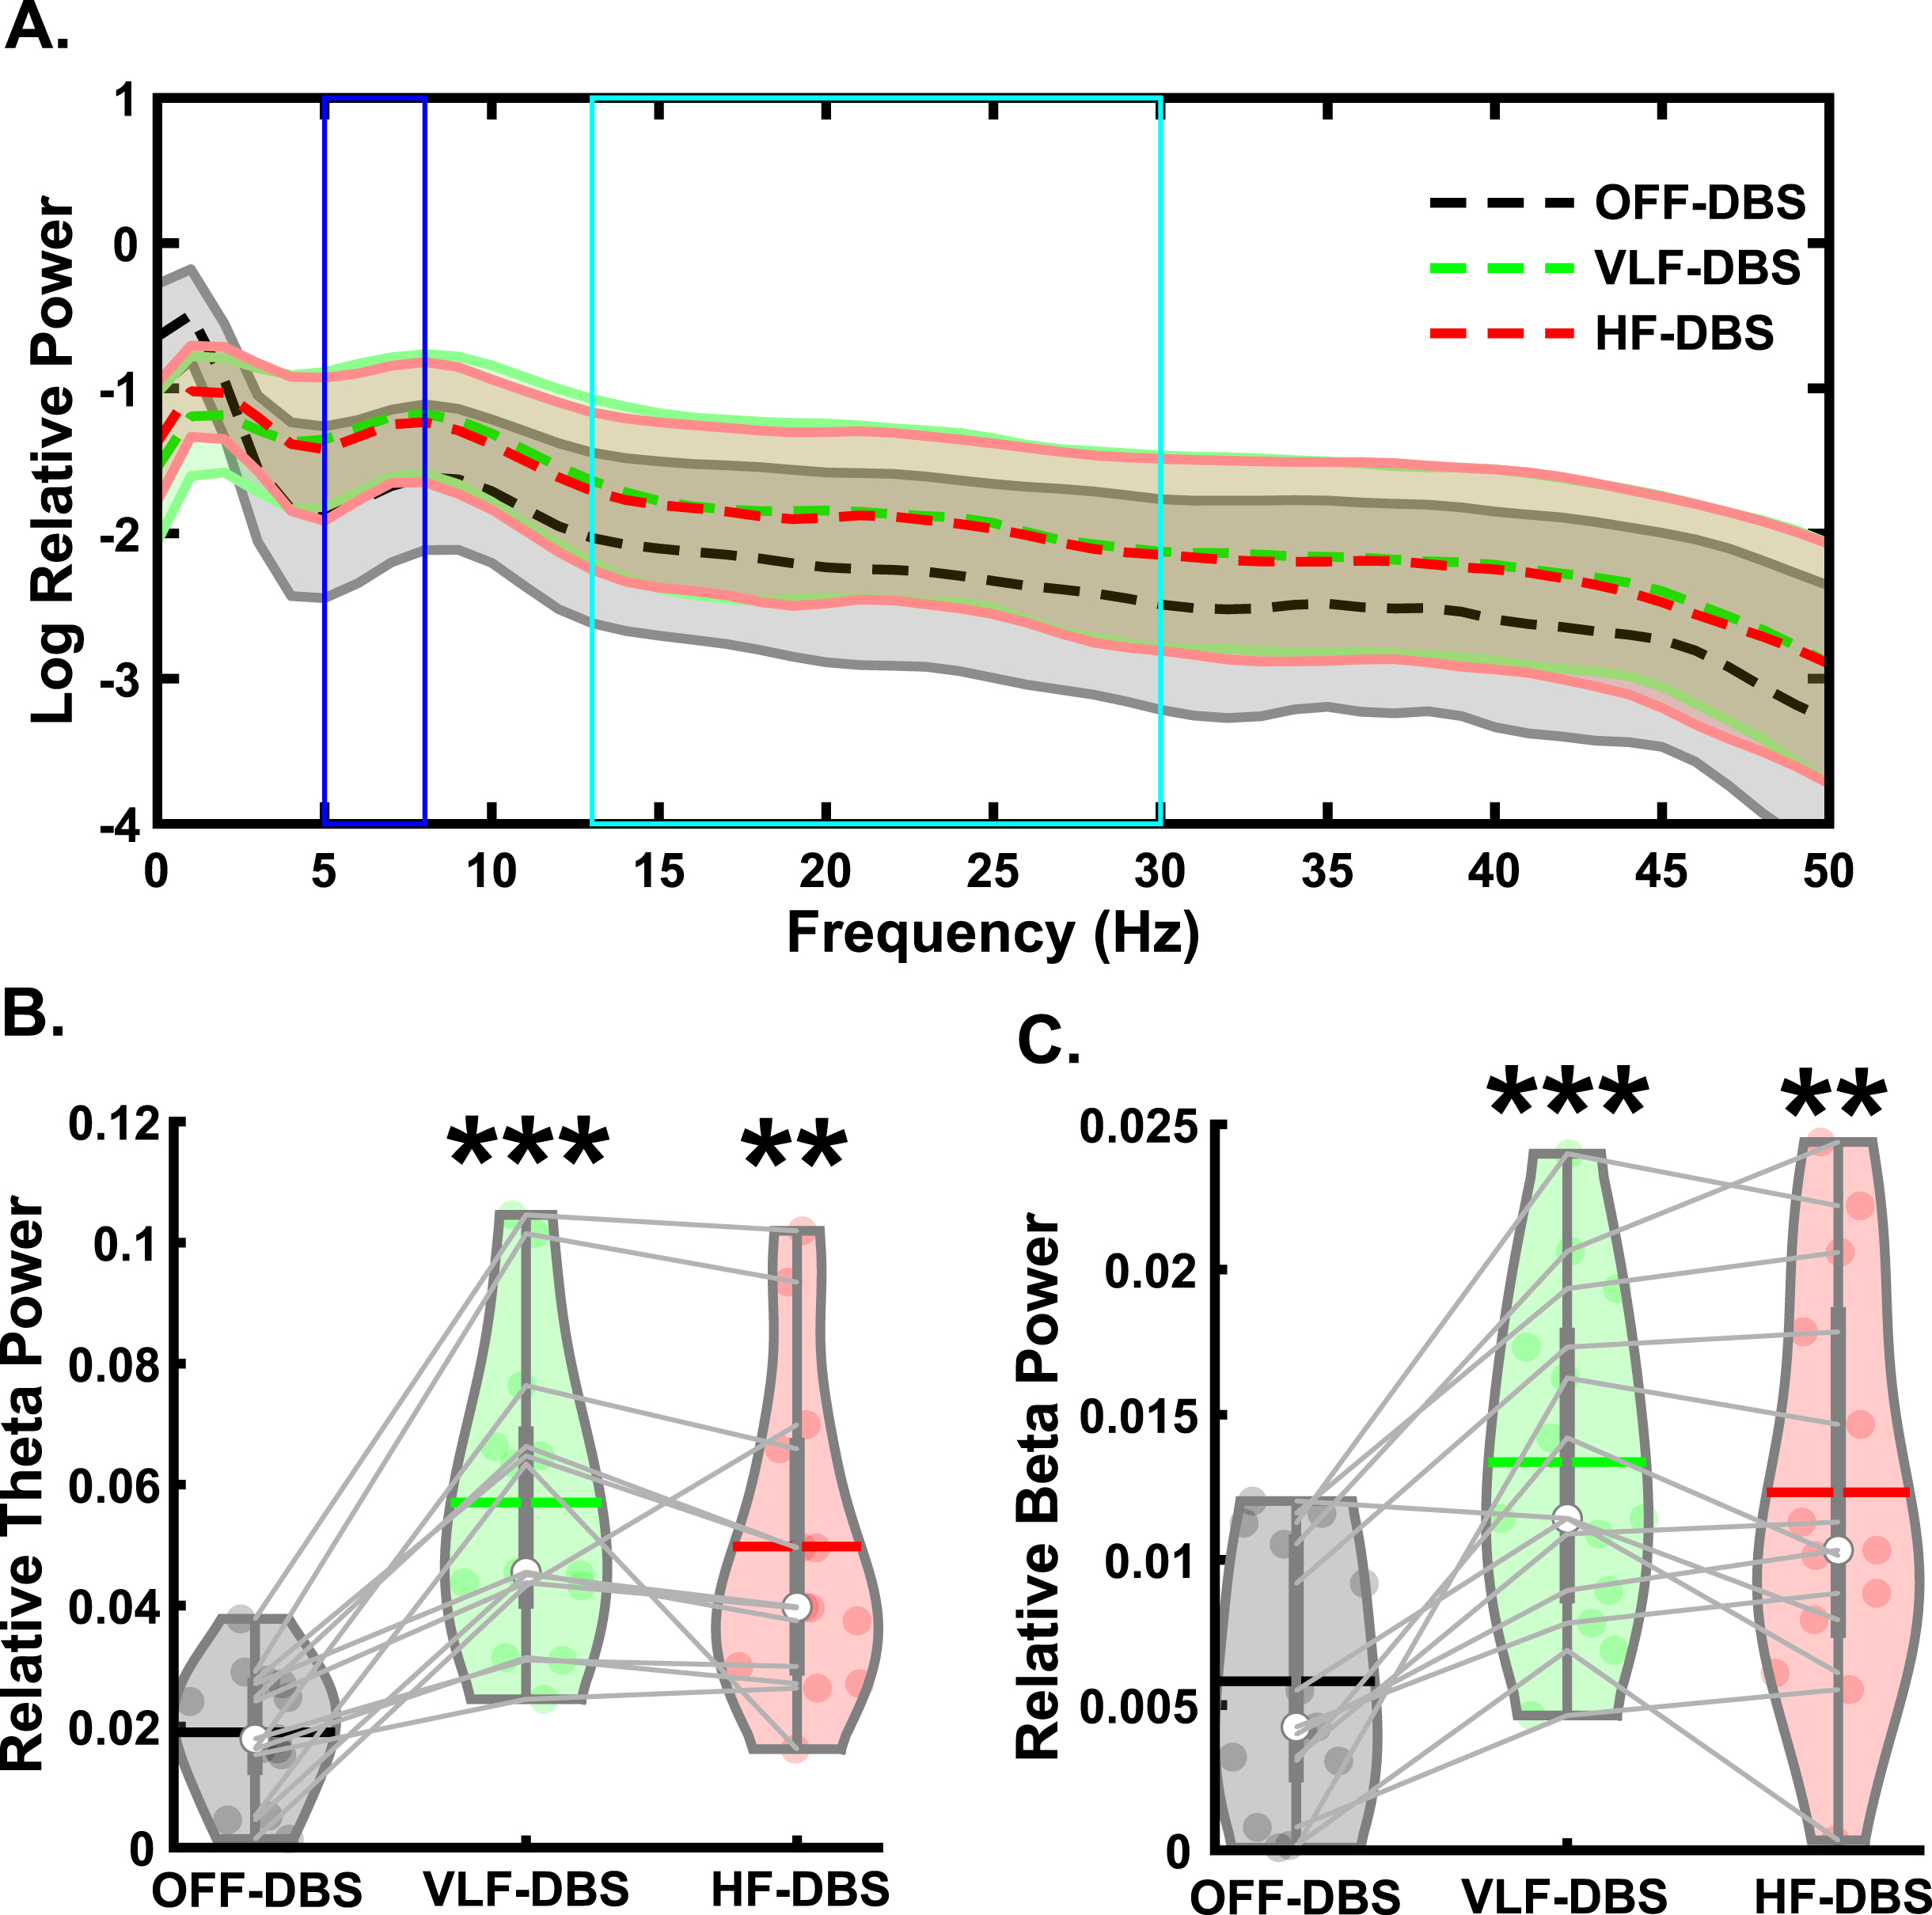
For all EEG analyses, please see Supplementary Table 2 for descriptive statistics. For the preparatory signal analyses (Fig. 2A), there was a main effect of stimulation on preparatory theta band relative power (F2,24 = 25.28, p < 0.001; Fig. 2B). Pairwise comparisons showed significantly higher theta power in VLF-DBS (p < 0.001) and HF-DBS (p = 0.001) compared to OFF-DBS, but no difference between VLF-DBS and HF-DBS (p = 0.127). We also observed a main effect of stimulation on preparatory beta band relative power (F2,24 = 22.1, p < 0.001; Fig. 2C), with pairwise comparisons showing higher beta power in VLF-DBS (p < 0.001) and HF-DBS (p = 0.002) compared to OFF-DBS; no difference was observed between VLF-DBS and HF-DBS (p = 0.24).
Fig. 2
Effects of STN-DBS during the preparatory period. A) Spectral power differences between stimulation parameters across multiple frequencies. B) STN very low frequency (VLF)- and high frequency (HF)-DBS result in increased relative theta power during the preparatory period. C) VLF-DBS and HF-DBS result in increased relative beta power during the preparatory period. **p < 0.01 vs. OFF-DBS, ***p < 0.001 vs. OFF-DBS. In violin plots, horizontal lines and white circles represent the mean and median values, respectively.
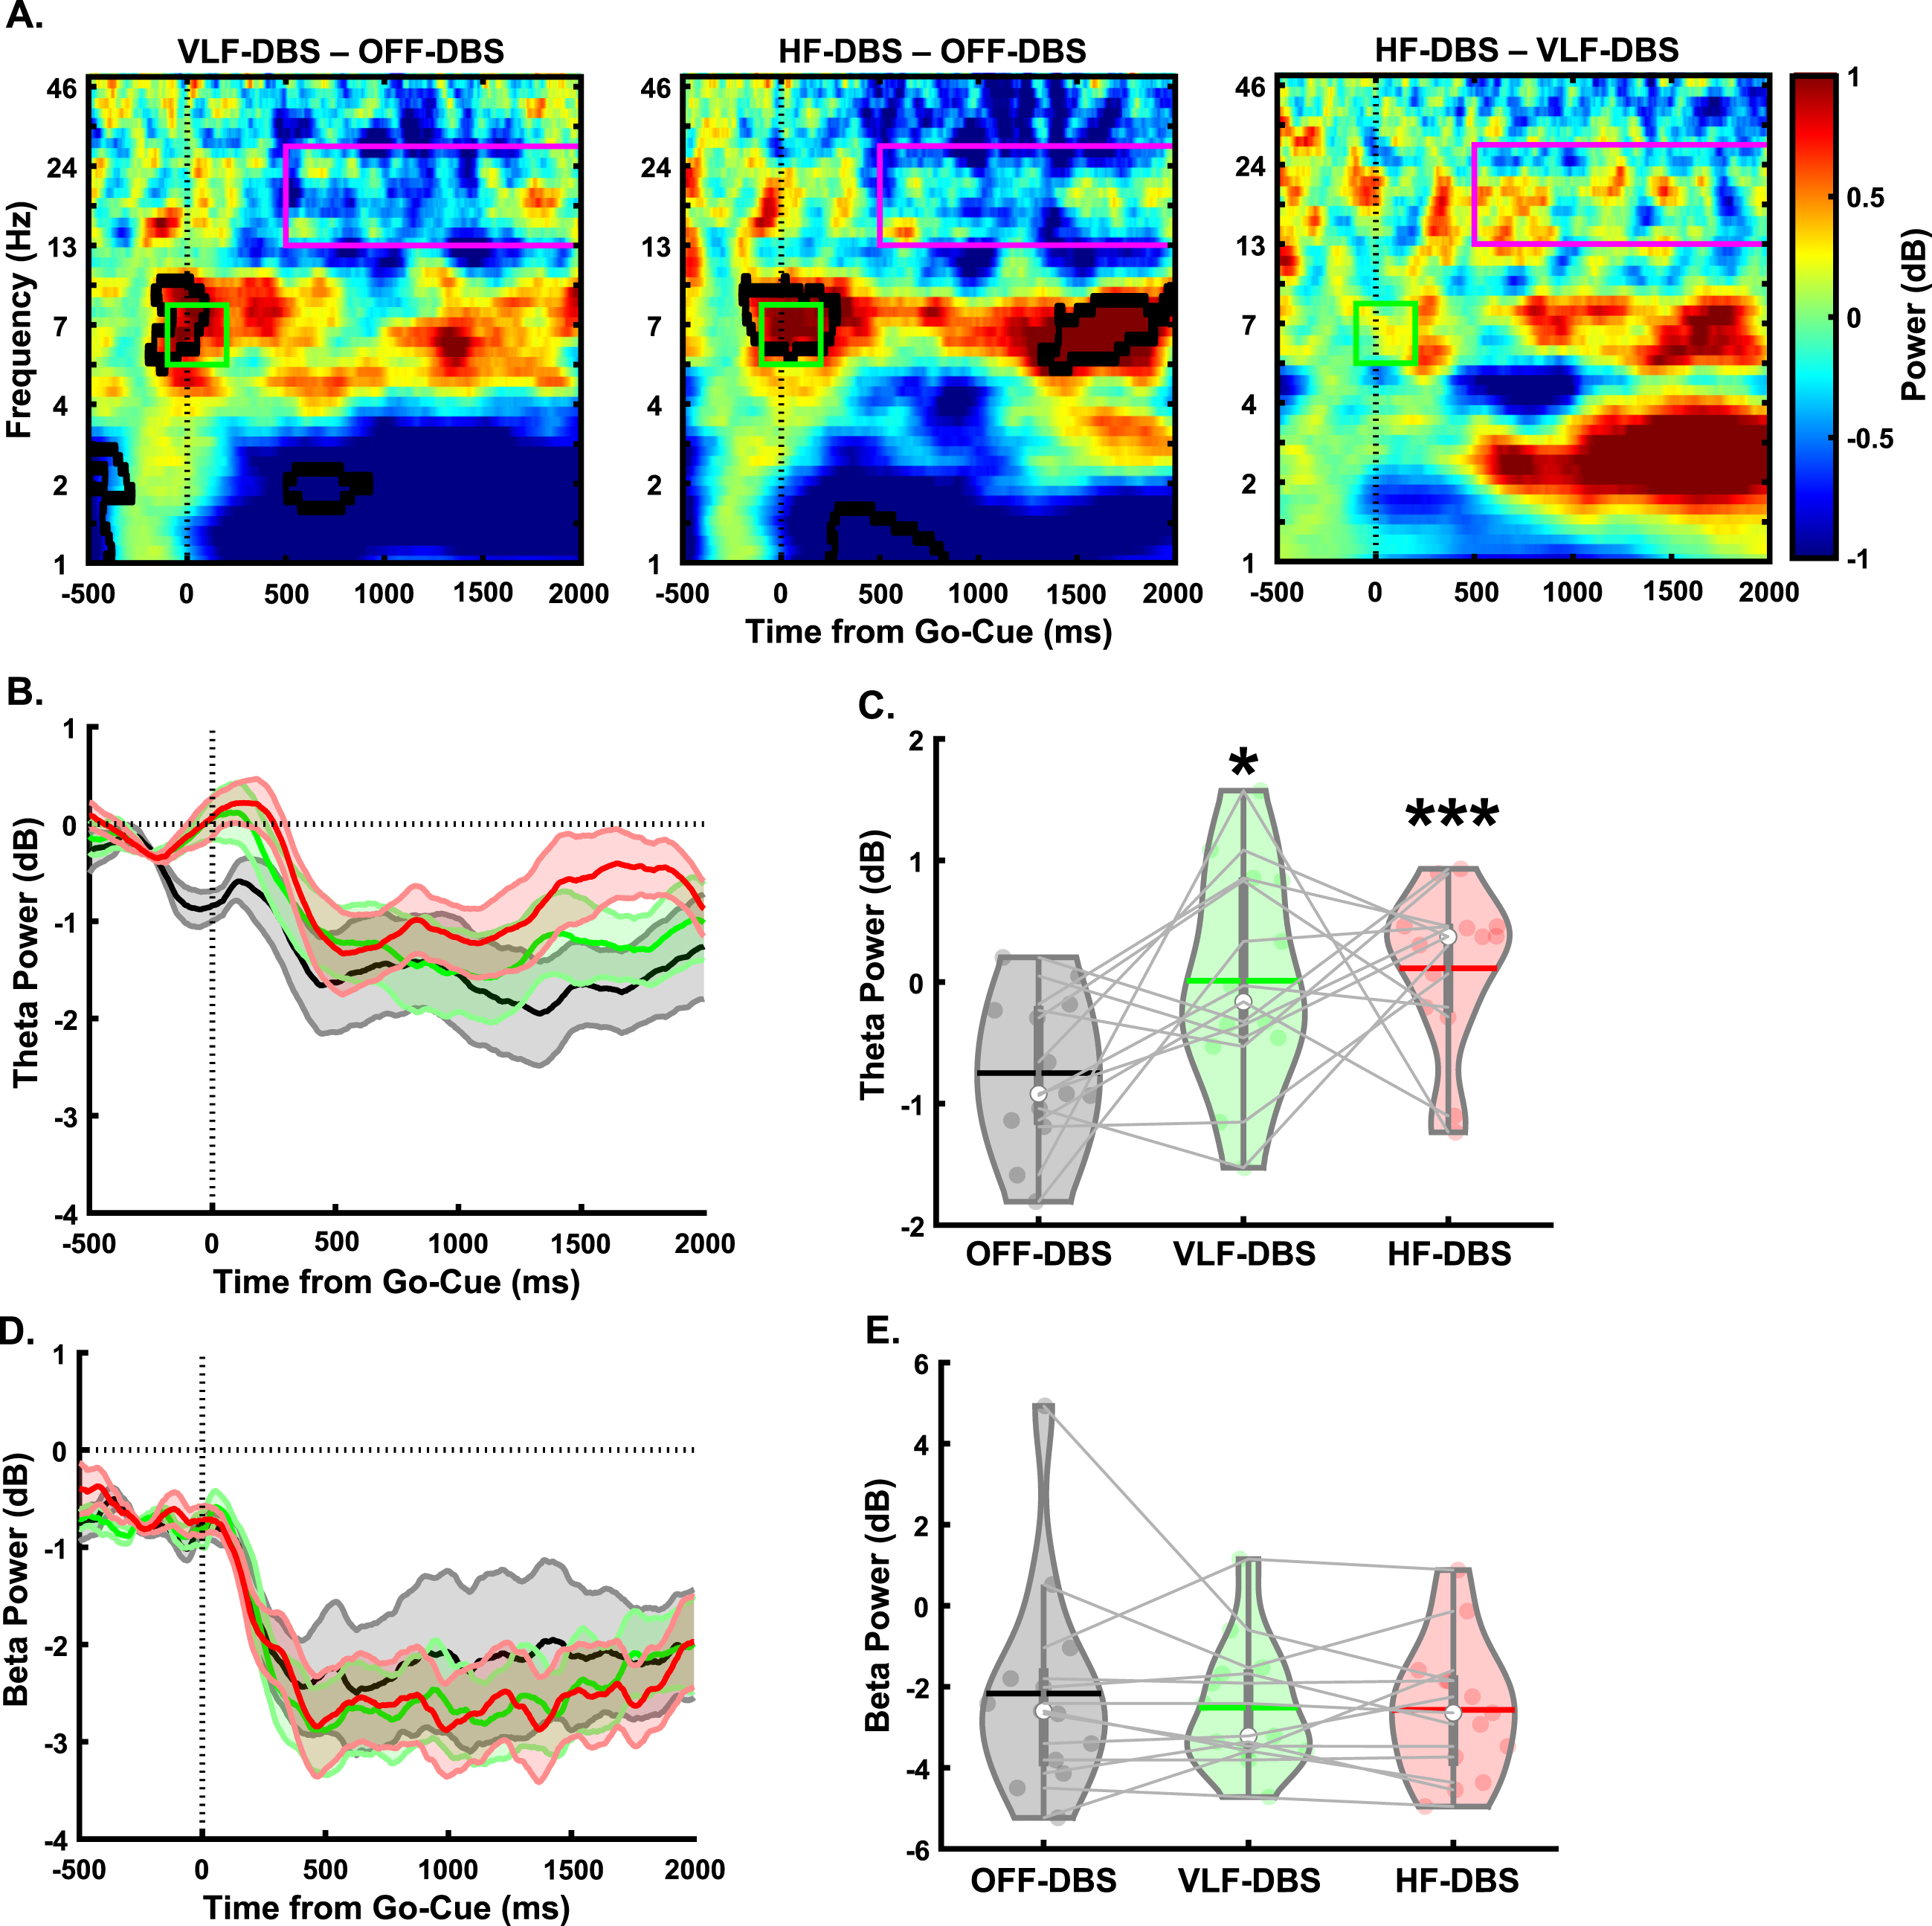
In the lower-limb pedaling task (Fig. 3A), there was a main effect of stimulation in the cue-triggered theta-band power (F1.36,16.37 = 5.1, p = 0.029; Fig. 3B, C). Pairwise comparisons revealed significantly higher theta power with VLF-DBS (p = 0.049) and HF-DBS (p = 0.001) compared to OFF-DBS. No difference was seen between VLF-DBS and HF-DBS (p = 0.78). However, no main effect of stimulation frequency was found for the movement-related beta band (F2,24 = 0.42, p = 0.66; Fig. 3D, E). These findings show that both VLF-DBS and HF-DBS at the STN have modulatory effects on cue-triggered theta power during the pedaling task, but movement-related beta power is unaffected by stimulation at either frequency. In our correlation analyses examining associations between pedaling kinematics (mean linear speed of pedaling task) and EEG time-frequency results, there were no significant associations between mean speed of pedaling movement and cue-triggered theta power at OFF-DBS (rho = 0.24, p = 0.44), VLF-DBS (rho = –0.41, p = 0.17), or HF-DBS (rho = –0.35, p = 0.25; Supplementary Figure 1A). Similarly, there were no associations between linear movement speed and movement-related beta power at OFF-DBS (rho = 0.04, p = 0.89), VLF-DBS (rho = –0.48, p = 0.1), or HF-DBS (rho = 0.15, p = 0.63; Supplementary Figure 1B).
Fig. 3
Effects of STN-DBS on motor cortical EEG oscillations during a lower-limb pedaling task. A) Time-frequency plots demonstrating differences between STN very low-frequency (VLF)-DBS and OFF-DBS (left), high-frequency (HF)-DBS and OFF-DBS (middle), and HF-DBS and VLF-DBS (right). B-C) Theta power is increased with VLF-DBS and HF-DBS during the lower-limb pedaling task. D-E) Beta power is unaffected with VLF-DBS and HF-DBS. *p < 0.05 vs. OFF-DBS. ***p < 0.001 vs. OFF-DBS. In violin plots, horizontal lines and white circles represent the mean and median values, respectively.
We next examined EEG spectral data during the preparatory period and pedaling task between PDFOG–and PDFOG + (Figs. 4 and 5). For PDFOG–(Fig. 4A) a main effect of stimulation was observed in the preparatory period in the theta-band (F2,12 = 18.97, p < 0.001; Fig. 4B). Pairwise comparisons demonstrated significantly higher relative theta power with VLF-DBS (p = 0.001) and HF-DBS (p = 0.009) compared to OFF-DBS; no difference was observed between VLF-DBS and HF-DBS (p = 0.34) in these patients. A main effect of stimulation was also observed in the preparatory period in the beta band (F2,12 = 15.55, p < 0.001; Fig. 4C) for PDFOG–. Similar to theta band, pairwise comparisons showed significantly higher relative beta band power during VLF-DBS (p = 0.012) and HF-DBS (p = 0.012) compared to during OFF-DBS. No difference was observed between VLF-DBS and HF-DBS (p = 0.22). For the PDFOG + subgroup (Fig. 4D), a main effect of stimulation was observed during the preparatory period, such that both very low and high stimulation increased the power in the theta (F1.09,5.43 = 7.77, p = 0.034; Fig. 4E) and beta bands (F1.03,5.16 = 6.52, p = 0.049; Fig. 4F). After FDR corrections, no differences were found in relative theta power between OFF-DBS and VLF-DBS (p = 0.066), between OFF-DBS and HF-DBS (p = 0.066), or between VLF-DBS and HF-DBS (p = 0.066). However, before correction these comparisons showed higher relative theta power during VLF-DBS (p = 0.033) and HF-DBS (p = 0.046) compared to OFF-DBS. Pairwise comparisons showed significantly higher relative beta band power with VLF-DBS (p = 0.024) compared to OFF-DBS, but no difference between HF-DBS and OFF-DBS (p = 0.128) or between VLF-DBS and HF-DBS (p = 0.739). These data suggest that the preparatory data observed in the entire group of PD patients regardless of FOG status may have been driven by the PDFOG–subgroup, who had similar effects of stimulation. For PDFOG+, only VLF-DBS appeared to influence preparatory oscillations, and only in the beta band.
Fig. 4
Different spectral responses to STN-DBS between PDFOG–and PDFOG + subgroups during the preparatory period. A) Spectral power differences between stimulation parameters across multiple frequencies for the PDFOG–subgroup during the preparatory period. B) STN very low frequency (VLF)-DBS and high frequency (HF)-DBS result in increased relative theta power during the preparatory period for the PDFOG–subgroup. C) VLF-DBS and HF-DBS result in increased relative beta power during the preparatory period for the PDFOG–subgroup. D) Spectral power differences between stimulation parameters across multiple frequencies for the PDFOG + subgroup during the preparatory period. E) STN VLF-DBS and HF-DBS do not affect theta power during the preparatory period for the PDFOG + subgroup. F) VLF-DBS, but not HF-DBS, resulted in increased relative beta power during the preparatory period for the PDFOG + subgroup. *p < 0.05 vs. OFF-DBS, **p < 0.01 vs. OFF-DBS. In violin plots, horizontal lines and white circles represent the mean and median values, respectively.
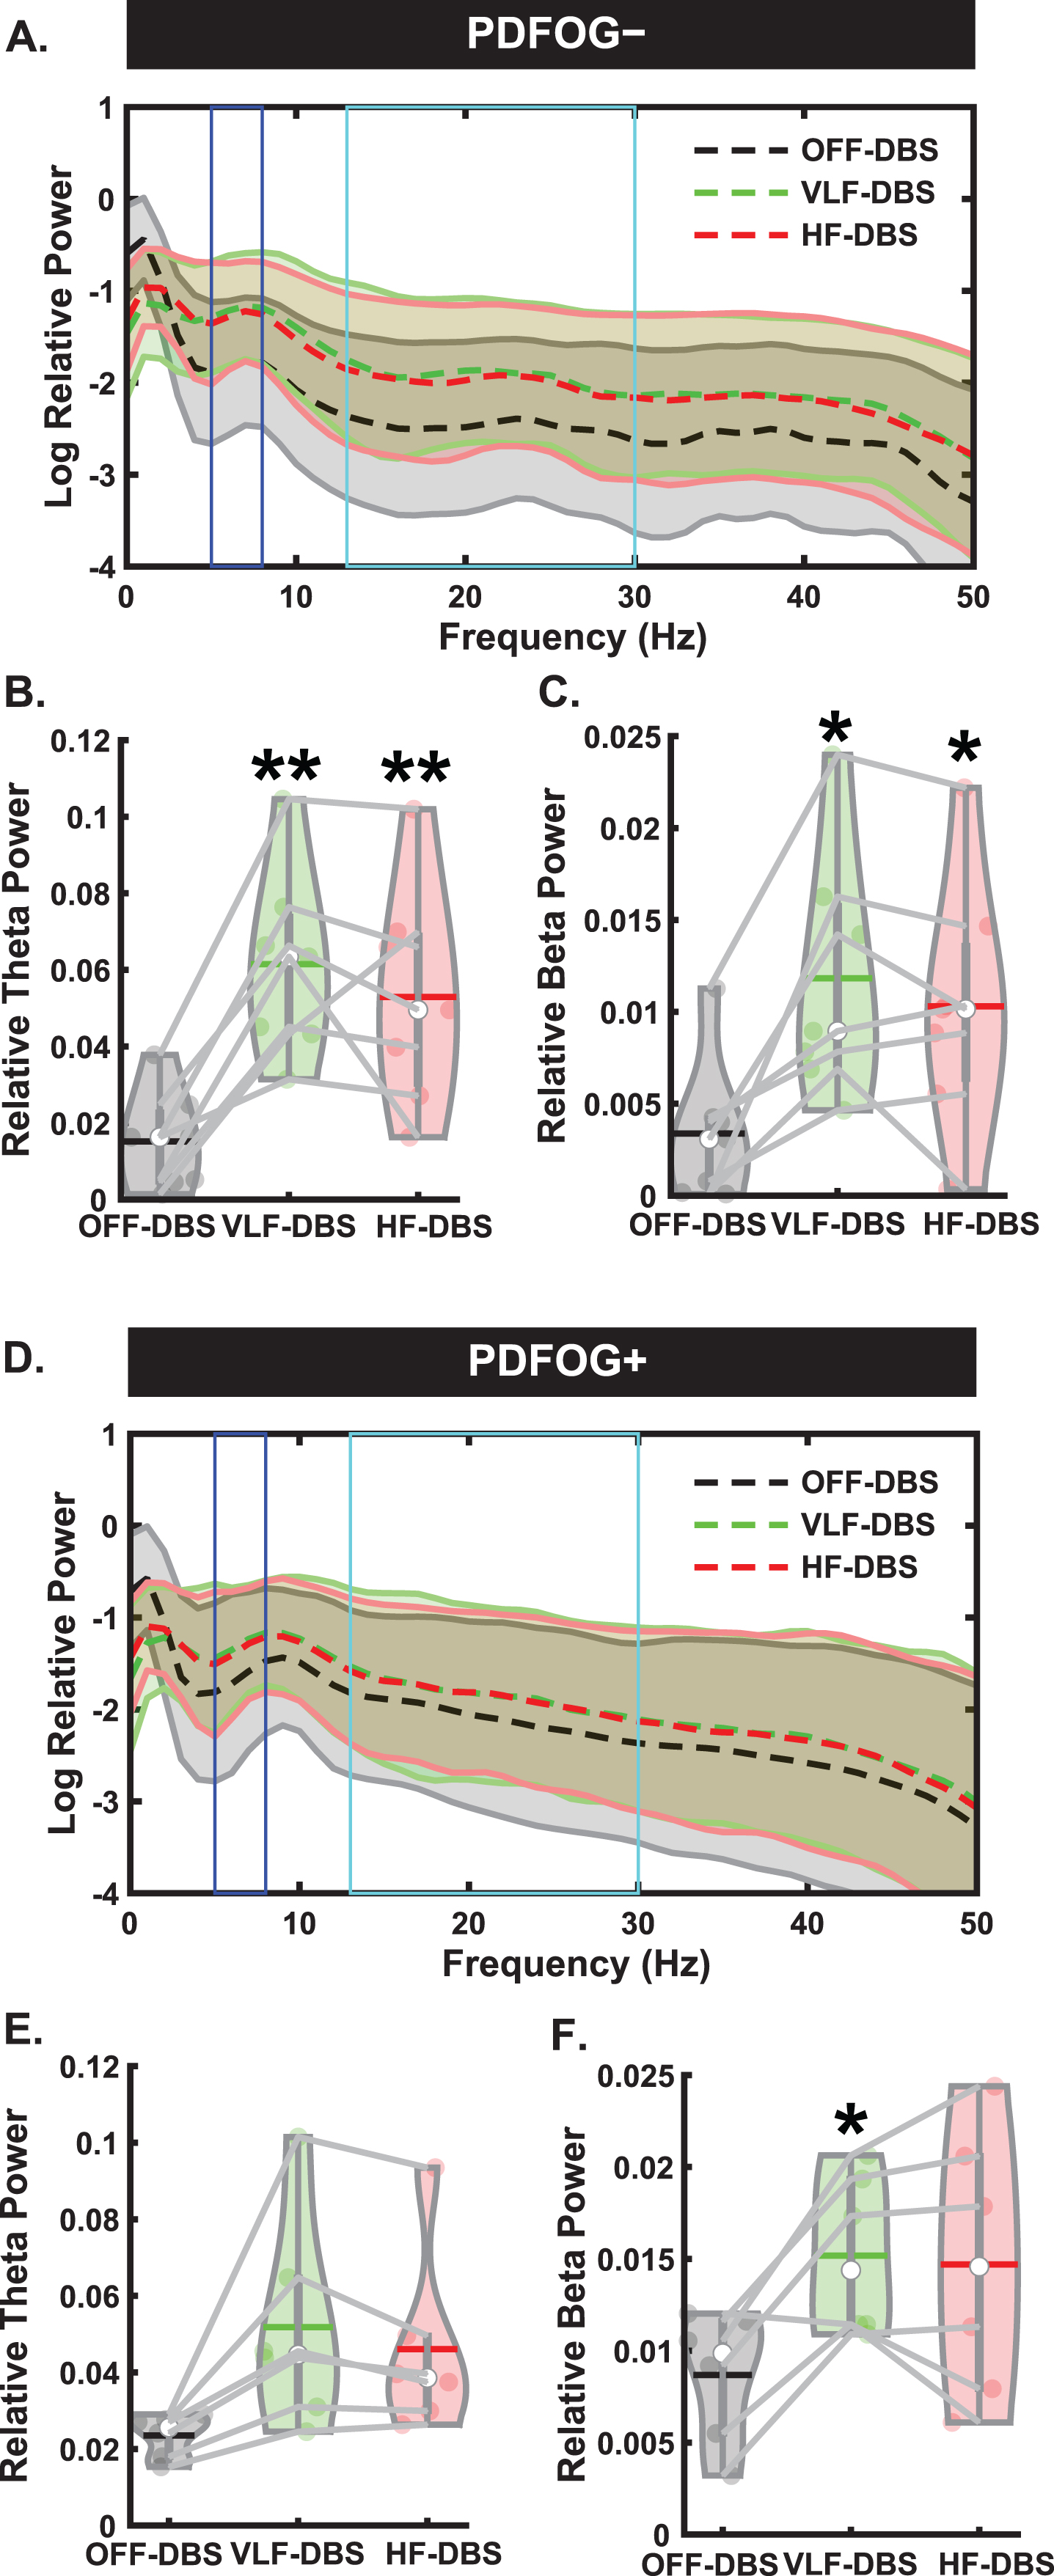
Fig. 5
Different responses to STN-DBS between PDFOG–and PDFOG + subgroups during the lower-limb pedaling task. A) Time-frequency plots demonstrating differences between STN very low-frequency (VLF)-DBS and OFF-DBS (left), high-frequency (HF)-DBS and OFF-DBS (middle), and HF-DBS and VLF-DBS (right) for the PDFOG–subgroup. B, C) No effects of stimulation are observed in the theta and beta frequency bands for PDFOG–. D) Time-frequency plots demonstrating differences between STN VLF-DBS and OFF-DBS (left), HF-DBS and OFF-DBS (middle), and HF-DBS and VLF-DBS (right) for the PDFOG + subgroup. E) Both VLF- and HF-DBS result in increased theta-power during the pedaling task for the PDFOG + subgroup. F) No effect of STN-DBS is observed in the beta-band for the PDFOG + subgroup. *p < 0.05 vs. OFF. In violin plots, horizontal lines and white circles represent the mean and median values, respectively.
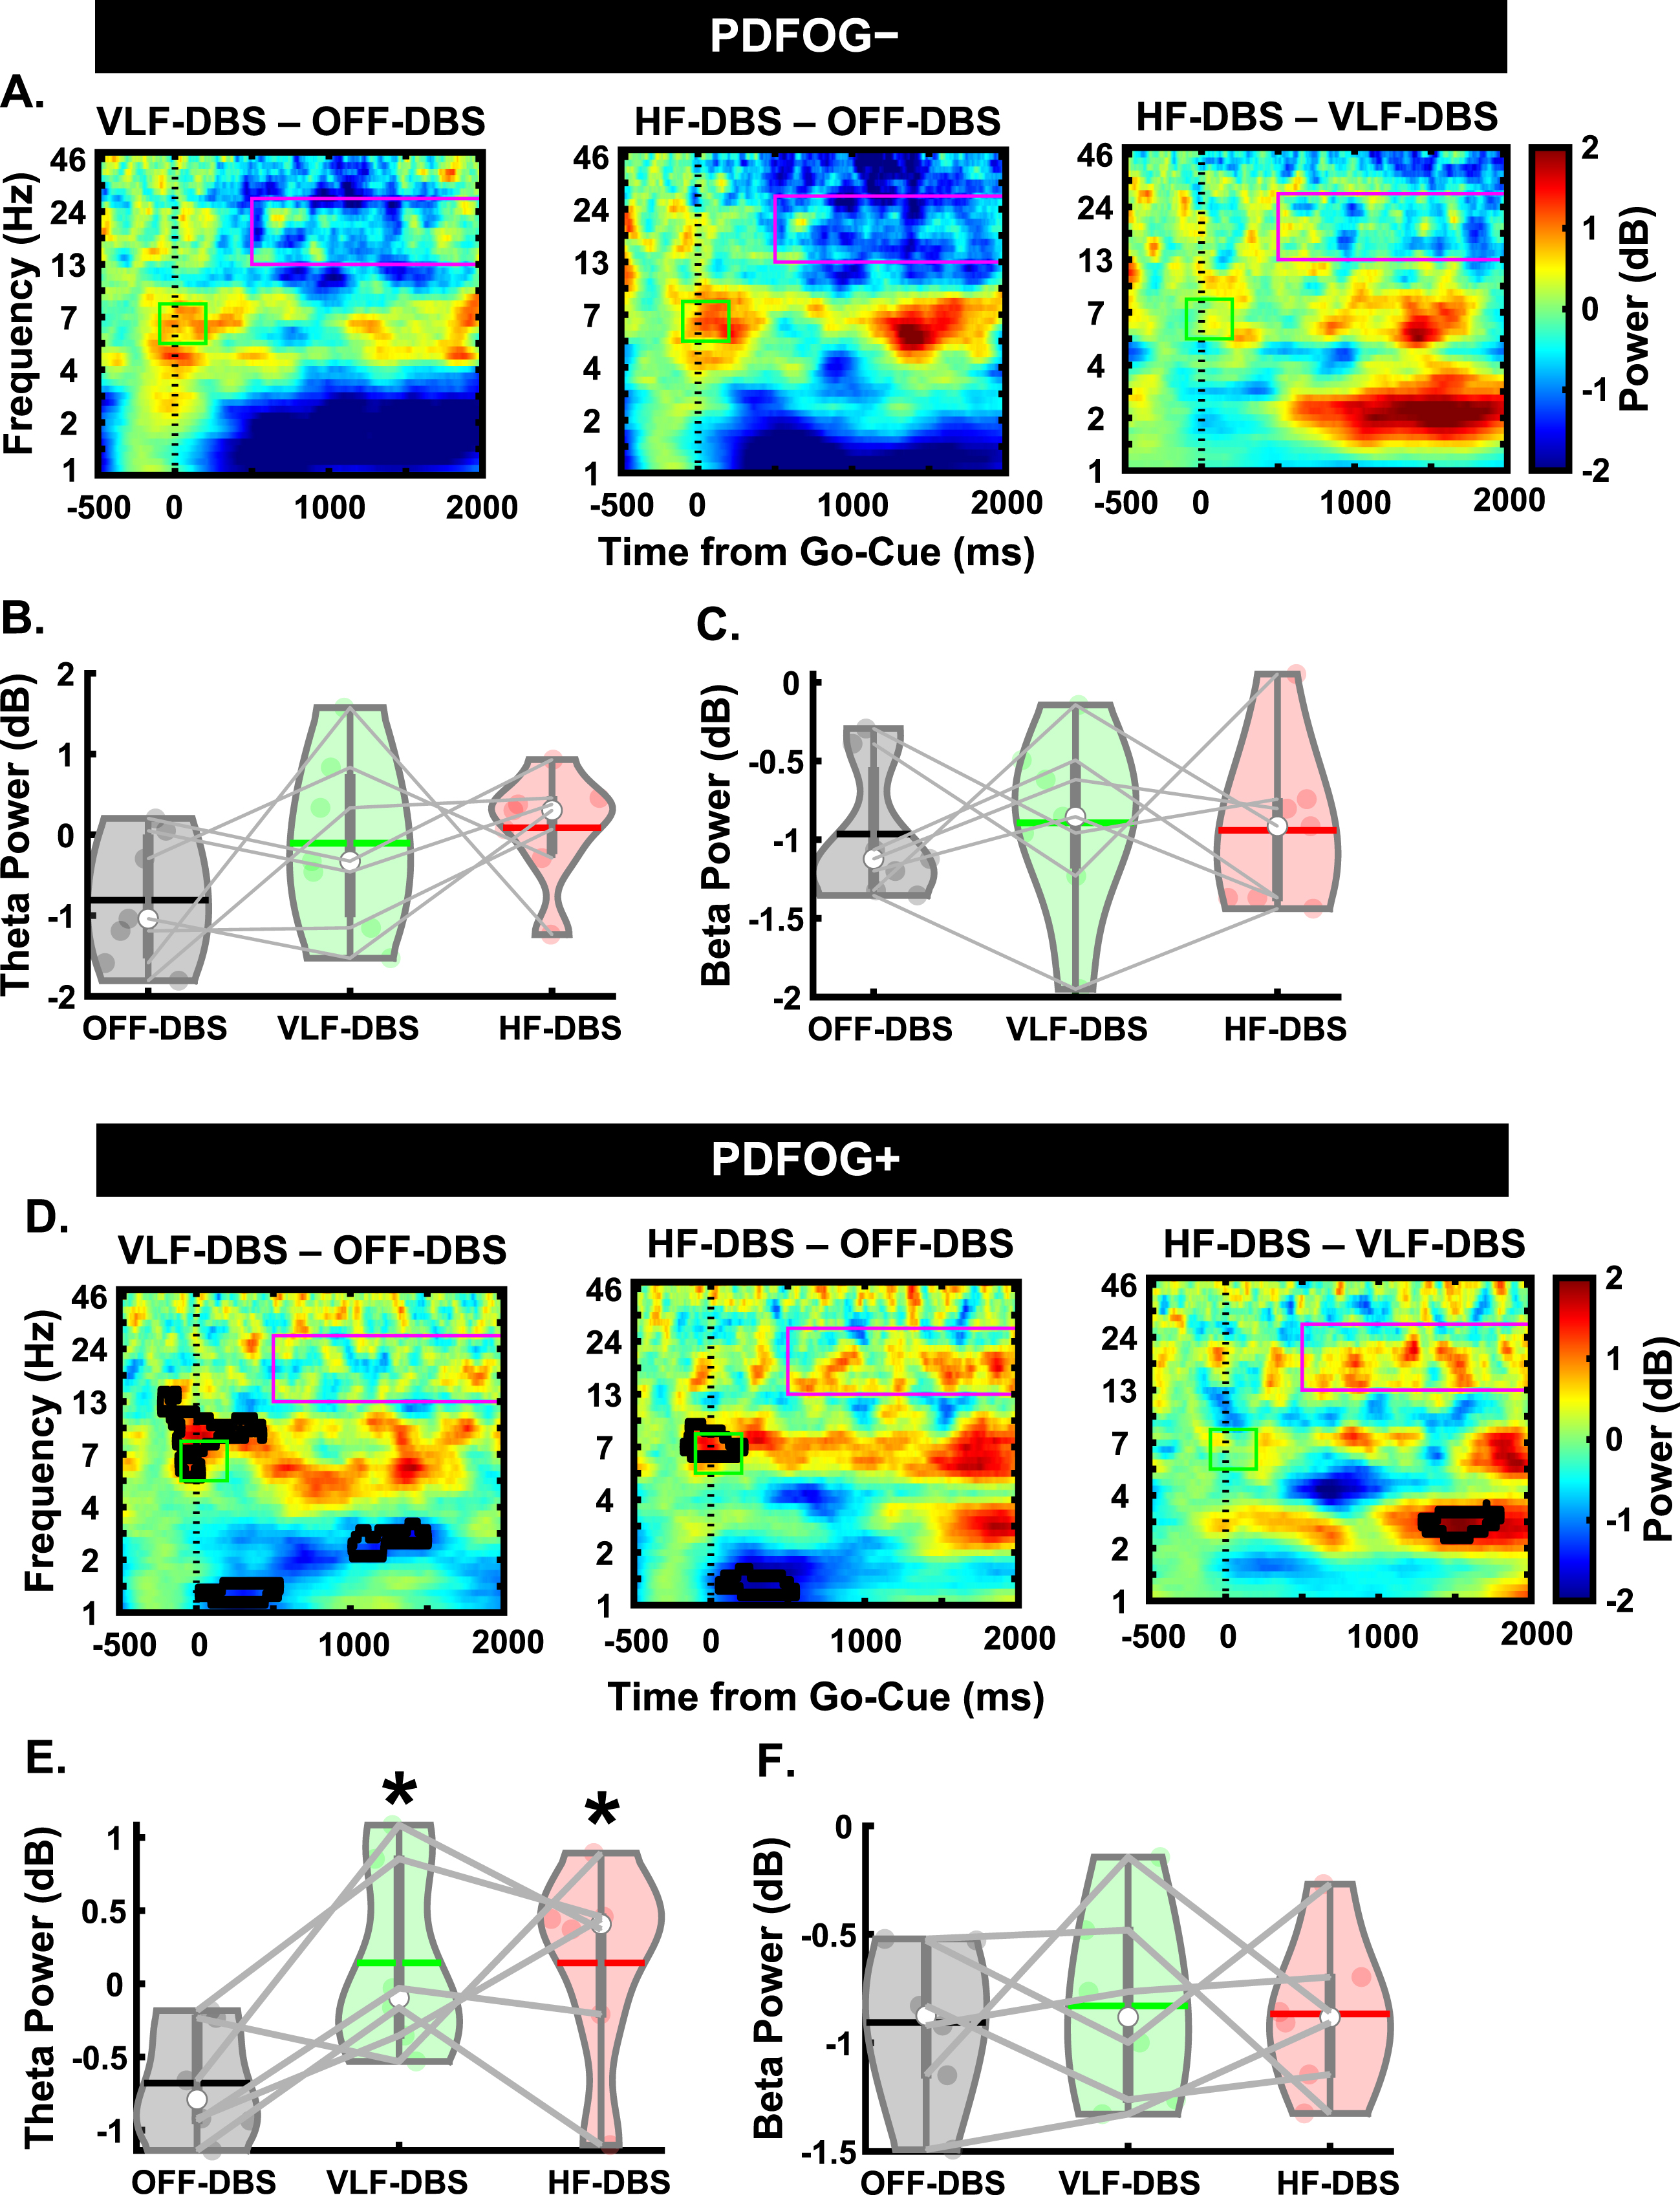
Next, we assessed differences during the pedaling task between the PD subgroups. In the PDFOG–group, there was no effect of stimulation at any frequency on cue-triggered theta (F2,12 = 1.71, p = 0.22; Fig. 5B) or movement-related beta band activity (F2,12 = 0.04, p = 0.959; Fig. 5C). However, we did see a main effect of stimulation in the cue-triggered theta band in PDFOG + patients (F2,10 = 5.34, p = 0.026; Fig. 5E), with pairwise comparisons showing significantly higher theta power with VLF-DBS (p = 0.045) and HF-DBS (p = 0.023) compared to OFF-DBS. No difference was observed between LF-DBS and HF-DBS (p = 0.99). In addition, no main effect was seen in the movement-related beta band for PDFOG + (F2,10 = 0.06, p = 0.94; Fig. 5F). These effects of stimulation occurring solely in the PDFOG + subgroups in the theta-band are congruent with previous work implicating an association between the theta-band and FOG [23].
DISCUSSION
In this study, we explored the effects of very low and high frequencies of DBS on patients with PD during a lower-limb pedaling motor task, and we assessed whether differences exist between patients stratified by FOG status. Interestingly, we found that many of the changes associated with high frequency DBS, both in terms of kinematic changes as well as neurophysiological changes assessed via EEG, were similarly seen with very low frequency DBS. Furthermore, we found that these changes occurred primarily in the theta band during the pedaling task, whereas changes in both theta and beta bands were seen during the preparatory period. To assess whether FOG status is associated with kinematic or neurophysiological changes we subdivided patients into PDFOG + and PDFOG–. In PDFOG–, both very low and high DBS frequencies reduced pedaling speed compared to DBS OFF; in PDFOG + high-frequency DBS reduced speed profoundly compared to OFF and VLF DBS frequency. Interestingly, in the pedaling task theta band activity was modulated by both DBS frequencies in the PDFOG + group, whereas no differences were seen in theta band activity between frequency conditions in the PDFOG–group. In contrast, during the preparatory period, both DBS frequencies led to changes in theta and beta band activity in the PDFOG–group, while in the PDFOG + group changes were only seen when low frequency DBS was applied, and then only in the beta band. Overall, our study demonstrates similarities between low and high frequency DBS compared to OFF-DBS on kinematic performance and EEG metrics, but differences begin to emerge when subdividing people with PD into those with FOG and those without.
We originally hypothesized that since HF-DBS at the STN is less effective in alleviating lower-limb motor dysfunction [10, 11], it would produce no effect compared to OFF-DBS in the beta band. Previous studies have shown that effective HF STN DBS reduced beta band power in the cortical and subcortical regions during upper-limb/hand movement and the reduction in beta activity was correlated with improved upper-limb motor kinematics [18–21]. Interestingly, HF STN DBS did not improve lower-limb movements or affect movement-associated abnormal beta oscillations [39]. However, studies have shown that high beta power in the cortical and subcortical regions is associated with abnormal lower-limb/gait movement in PDFOG+[23, 27]. These studies have suggested that high beta could be related to the gait issues in PD. Our results are congruent with this hypothesis, as no significant effect on beta oscillations was seen with STN HF-DBS during the lower-limb pedaling task. However, in the preparatory data, HF-DBS produced heightened beta oscillations compared to OFF-DBS. In a previous report, STN HF-DBS showed a reduction in the STN beta oscillations during freely moving condition [22]. However, our findings suggest that elevated levels of beta activity during the preparatory period were normalized by STN HF-DBS when cue-based lower limb movements were initiated and executed. Interestingly, we observed similar effects in the beta band when STN VLF-DBS at 4 Hz was applied (i.e., an increase in beta oscillations during the preparatory condition which was normalized when the lower-limb pedaling movement was initiated). Given the prominence of STN HF-DBS in clinical practice, observing similar effects with very low frequency stimulation could inspire future research examining wider ranges of stimulation frequencies and observing the subsequent effects. Nevertheless, despite the changes seen in the preparatory state, stimulation produced no effect on beta-band oscillations during pedaling compared to OFF-DBS and those oscillations were unrelated to kinematic effects.
Here, we hypothesized that cue-triggered lower-limb impairments in PD and effects produced using DBS would manifest in the motor cortical theta-band since the lower-limb movement was performed after the attentional cue. Our previous work has shown abnormal midfrontal theta oscillations during both cognitive tasks such as interval timing and lower-limb pedaling motor tasks [21, 24, 25]. Similarly, other studies have also shown significant contributions of non-motor symptomology to lower-limb impairments in PD [12, 13]. Given these previous findings, changes in the frontal motor cortical theta band may be strongly associated with lower-limb impairments compared to the beta-band. Our data add further evidence to this notion by showing significant increases in motor cortical theta power during STN HF-DBS during the lower-limb pedaling task. Furthermore, these increases were also observed in the preparatory condition prior to movement. In contrast to the change seen in the beta-band from the preparatory period to the pedaling task, increased theta power at the occurrence of the GO-cue which persists into the pedaling movement could indicate that stimulation is affecting cognitive states more than movement-related phenomena. Indeed, when examining associations between different DBS-related motor cortical theta oscillations and movement kinematics, we observed no significant associations. In addition to our examinations of different stimulation frequencies on the lower-limb pedaling task, we also sought to determine whether differences exist between PDFOG + and PDFOG–. Since previous studies have shown higher beta power in the STN in PDFOG + compared to PDFOG–, as well as differences in cortical theta-band during lower-limb pedaling motor tasks [23], whether these subgroups differ in their response to stimulation is of paramount importance. We found no differences between stimulation conditions in cue-triggered theta or movement-related beta during the lower-limb pedaling motor task in the PDFOG- subgroup, but there was a difference in theta oscillations between very low and high-frequency conditions in the PDFOG + subgroup. This indicates that the differences in motor cortical theta oscillations observed in our analysis of all PD patients could be related to the FOG phenomenon. Interestingly, the higher theta and beta power observed in the preparatory period during VLF and HF DBS for all PD patients was only replicated in the PDFOG–subgroup. In the PDFOG + subgroup, only VLF-DBS produced higher beta-band oscillatory power during the preparatory period. That said, there was a main effect of stimulation for both theta and beta in this group, so the differences observed are likely due to lower sample sizes when subdividing groups. Furthermore, including subgroup as a separate factor produced no significant differences between PDFOG–and PDFOG+, so future research with higher numbers in each subgroup is necessary to further elucidate subtle differences associated with FOG.
A primary limitation of this study is the lower sample size, particularly when subdividing the PD group into PDFOG–and PDFOG+. While future research would benefit from a higher sample size, given the difficulty of recruitment of this specific population (i.e., PD with DBS and FOG) and the time-commitment to explore different DBS frequencies, it is important to examine both kinematic and neurophysiological effects of DBS at a wide range of frequencies even at a lower sample size. This study may also have been improved by including a separate control group who did not receive stimulation, and this may be an avenue for future research. However, within the scope of this study, we chose to examine the data from the OFF-DBS condition for each subject as a control due to potential effects of the DBS implantation surgery. Next, previous research has demonstrated that phase-amplitude coupling (PAC) is important in the FOG phenomenon [40]. Though it would be interesting to examine PAC of beta/gamma frequencies in our study, we did not collect enough trials for each participant or recruit enough participants to enable these analyses. In addition, though the pedaling task was utilized in this study due to the high risk of falls in PD patients, it is considered an indirect measure of gait rather than a direct measure. Similarly, in our task, we used linear speed from our cue-triggered pedaling task to measure gait dysfunction, which did not significantly differ between PD subgroups. Successful gait requires the integration of sensorimotor, visual, and cognitive information, so our measure may not have adequately assessed gait dysfunction. However, previous research has shown differences in pedaling or gait kinematics between PDFOG–and PDFOG + subgroups [41]. In the current study, subjects were prompted to execute the pedaling task following an external GO cue, which has been shown to improve movement execution in PDFOG+[42, 43]. In turn, this may have resulted in the lack of significant differences in linear speed between PD subgroups. Another limitation is that both PDFOG–and PDFOG + groups were treated with levodopa medication, and we did not examine signals without medication. Next, the parameters of the high frequency condition were not identical between subjects. Each PD subject was stimulated with their optimal clinical DBS parameters. Further, across conditions, only frequency of stimulation was changed; amplitude, impulse width, and DBS contacts were not altered. Finally, we did not maintain the total electrical energy delivered (TEED) between different stimulation conditions via changing the amplitude; therefore, observed changes in the movement speed and cortical activity may be the result of different amounts of TEED.
In conclusion, our study provides further evidence towards the lack of efficacy of current DBS approaches for PD with lower-limb impairments, particularly with FOG. In the future, alternative DBS or hybrid interventions might be used to help restore the lower-limb motor and cognitive impairments present in advanced PD with FOG.
ACKNOWLEDGMENTS
This work was supported by the Division of Basic Biomedical Sciences at the University of South Dakota, Vermillion, SD, USA and by F32AG069445 to RCC from NIA. Data collection was supported by R01NS100849 from NINDS and the National Center for Advancing Translational Sciences of the National Institutes of Health (Award Number: UL1TR002537).
CONFLICT OF INTEREST
The authors have no conflict of interest to report.
DATA AVAILABILITY
The data supporting the findings of this study can be obtained from these authors upon reasonable request available on request from the corresponding author.
SUPPLEMENTARY MATERIAL
[1] The supplementary material is available in the electronic version of this article: https://dx.doi.org/10.3233/JPD-225113.
REFERENCES
[1] | Boonstra TA , van der Kooij H , Munneke M , Bloem BR ((2008) ) Gait disorders and balance disturbances in Parkinson’s disease: Clinical update and pathophysiology. Curr Opin Neurol 21: , 461–471. |
[2] | Nutt JG , Bloem BR , Giladi N , Hallett M , Horak FB , Nieuwboer A ((2011) ) Freezing of gait: Moving forward on a mysterious clinical phenomenon. Lancet Neurol 10: , 734–744. |
[3] | Bloem BR , Hausdorff JM , Visser JE , Giladi N ((2004) ) Falls and freezing of gait in Parkinson’s disease: A review of two interconnected, episodic phenomena. Mov Disord 19: , 871–884. |
[4] | Allen NE , Schwarzel AK , Canning CG ((2013) ) Recurrent falls in Parkinson’s disease: A systematic review. Parkinsons Dis 2013: , 906274. |
[5] | Ambani LM , Van Woert MH ((1973) ) Start hesitation–a side effect of long-term levodopa therapy. N Engl J Med 288: , 1113–1115. |
[6] | Chen R ((2012) ) Paradoxical worsening of gait with levodopa in Parkinson disease. Neurology 78: , 446–447. |
[7] | Espay AJ , Fasano A , van Nuenen BF , Payne MM , Snijders AH , Bloem BR ((2012) ) “On” state freezing of gait in Parkinson disease: A paradoxical levodopa-induced complication. Neurology 78: , 454–457. |
[8] | Nozaki T , Asakawa T , Sugiyama K , Koda Y , Shimoda A , Mizushima T , Sameshima T , Namba H ((2018) ) Effect of subthalamic deep brain stimulation on upper limb dexterity in patients with Parkinson disease. World Neurosurg 115: , e206–e217. |
[9] | Shapiro MB , Vaillancourt DE , Sturman MM , Metman LV , Bakay RA , Corcos DM ((2007) ) Effects of STN DBS on rigidity in Parkinson’s disease. IEEE Trans Neural Syst Rehabil Eng 15: , 173–181. |
[10] | St George RJ , Nutt JG , Burchiel KJ , Horak FB ((2010) ) A meta-regression of the long-term effects of deep brain stimulation on balance and gait in PD. Neurology 75: , 1292–1299. |
[11] | Brozova H , Barnaure I , Ruzicka E , Stochl J , Alterman R , Tagliati M ((2021) ) Short- and long-term effects of DBS on gait in Parkinson’s disease. Front Neurol 12: , 688760. |
[12] | Scholl JL , Espinoza AI , Rai W , Leedom M , Baugh LA , Berg-Poppe P , Singh A ((2021) ) Relationships between freezing of gait severity and cognitive deficits in Parkinson’s disease. Brain Sci 11: , 1496. |
[13] | Banks SJ , Bayram E , Shan G , LaBelle DR , Bluett B ((2019) ) Non-motor predictors of freezing of gait in Parkinson’s disease. Gait Posture 68: , 311–316. |
[14] | Ehgoetz Martens KA , Lukasik EL , Georgiades MJ , Gilat M , Hall JM , Walton CC , Lewis SJG ((2018) ) Predicting the onset of freezing of gait: A longitudinal study. Mov Disord 33: , 128–135. |
[15] | Bharti K , Suppa A , Tommasin S , Zampogna A , Pietracupa S , Berardelli A , Pantano P ((2019) ) Neuroimaging advances in Parkinson’s disease with freezing of gait: A systematic review. Neuroimage Clin 24: , 102059. |
[16] | Bluett B , Banks S , Cordes D , Bayram E , Mishra V , Cummings J , Litvan I ((2018) ) Neuroimaging and neuropsychological assessment of freezing of gait in Parkinson’s disease. Alzheimers Dement (N Y) 4: , 387–394. |
[17] | Gallardo MJ , Cabello JP , Corrales MJ , Torres-Donaire J , Bravo JJ , Talavera MP , Leon A , Vaamonde-Gamo J ((2018) ) Freezing of gait in Parkinson’s disease: Functional neuroimaging studies of the frontal lobe. Neurol Res 40: , 900–905. |
[18] | Luoma J , Pekkonen E , Airaksinen K , Helle L , Nurminen J , Taulu S , Makela JP ((2018) ) Spontaneous sensorimotor cortical activity is suppressed by deep brain stimulation in patients with advanced Parkinson’s disease. Neurosci Lett 683: , 48–53. |
[19] | Wingeier B , Tcheng T , Koop MM , Hill BC , Heit G , Bronte-Stewart HM ((2006) ) Intra-operative STN DBS attenuates the prominent beta rhythm in the STN in Parkinson’s disease. Exp Neurol 197: , 244–251. |
[20] | Qasim SE , de Hemptinne C , Swann NC , Miocinovic S , Ostrem JL , Starr PA ((2016) ) Electrocorticography reveals beta desynchronization in the basal ganglia-cortical loop during rest tremor in Parkinson’s disease. Neurobiol Dis 86: , 177–186. |
[21] | Singh A ((2018) ) Oscillatory activity in the cortico-basal ganglia-thalamic neural circuits in Parkinson’s disease. Eur J Neurosci 48: , 2869–2878. |
[22] | Quinn EJ , Blumenfeld Z , Velisar A , Koop MM , Shreve LA , Trager MH , Hill BC , Kilbane C , Henderson JM , Bronte-Stewart H ((2015) ) Beta oscillations in freely moving Parkinson’s subjects are attenuated during deep brain stimulation. Mov Disord 30: , 1750–1758. |
[23] | Singh A , Cole RC , Espinoza AI , Brown D , Cavanagh JF , Narayanan NS ((2020) ) Frontal theta and beta oscillations during lower-limb movement in Parkinson’s disease. Clin Neurophysiol 131: , 694–702. |
[24] | Bosch TJ , Barsainya R , Ridder A , Santosh KC , Singh A ((2022) ) Interval timing and midfrontal delta oscillations are impaired in Parkinson’s disease patients with freezing of gait. J Neurol 269: , 2599–2609. |
[25] | Singh A , Cole RC , Espinoza AI , Evans A , Cao S , Cavanagh JF , Narayanan NS ((2021) ) Timing variability and midfrontal ∼4Hz rhythms correlate with cognition in Parkinson’s disease. NPJ Parkinsons Dis 7: , 14. |
[26] | Singh A , Richardson SP , Narayanan N , Cavanagh JF ((2018) ) Mid-frontal theta activity is diminished during cognitive control in Parkinson’s disease. Neuropsychologia 117: , 113–122. |
[27] | Singh A , Plate A , Kammermeier S , Mehrkens JH , Ilmberger J , Bötzel K ((2013) ) Freezing of gait-related oscillatory activity in the human subthalamic nucleus. Basal Ganglia 3: , 25–32. |
[28] | Giladi N , Shabtai H , Simon ES , Biran S , Tal J , Korczyn AD ((2000) ) Construction of freezing of gait questionnaire for patients with Parkinsonism. Parkinsonism Relat Disord 6: , 165–170. |
[29] | Giladi N , Tal J , Azulay T , Rascol O , Brooks DJ , Melamed E , Oertel W , Poewe WH , Stocchi F , Tolosa E ((2009) ) Validation of the freezing of gait questionnaire in patients with Parkinson’s disease. Mov Disord 24: , 655–661. |
[30] | Harris PA , Taylor R , Minor BL , Elliott V , Fernandez M , O’Neal L , McLeod L , Delacqua G , Delacqua F , Kirby J , Duda SN , Consortium RE ((2019) ) The REDCap consortium: Building an international community of software platform partners. J Biomed Inform 95: , 103208. |
[31] | Harris PA , Taylor R , Thielke R , Payne J , Gonzalez N , Conde JG ((2009) ) Research electronic data capture (REDCap)–a metadata-driven methodology and workflow process for providing translational research informatics support. J Biomed Inform 42: , 377–381. |
[32] | Bosch TJ , Groth C , Eldridge TA , Gnimpieba EZ , Baugh LA , Singh A ((2021) ) Altered cerebellar oscillations in Parkinson’s disease patients during cognitive and motor tasks. Neuroscience 475: , 185–196. |
[33] | Abe K , Asai Y , Matsuo Y , Nomura T , Sato S , Inoue S , Mizukura I , Sakoda S ((2003) ) Classifying lower limb dynamics in Parkinson’s disease. Brain Res Bull 61: , 219–226. |
[34] | Vercruysse S , Gilat M , Shine JM , Heremans E , Lewis S , Nieuwboer A ((2014) ) Freezing beyond gait in Parkinson’s disease: A review of current neurobehavioral evidence. Neurosci Biobehav Rev 43: , 213–227. |
[35] | Lio G , Thobois S , Ballanger B , Lau B , Boulinguez P ((2018) ) Removing deep brain stimulation artifacts from the electroencephalogram: Issues, recommendations and an open-source toolbox. Clin Neurophysiol 129: , 2170–2185. |
[36] | Allen DP ((2009) ) A frequency domain Hampel filter for blind rejection of sinusoidal interference from electromyograms. J Neurosci Methods 177: , 303–310. |
[37] | Allen DP , Stegemoller EL , Zadikoff C , Rosenow JM , Mackinnon CD ((2010) ) Suppression of deep brain stimulation artifacts from the electroencephalogram by frequency-domain Hampel filtering. Clin Neurophysiol 121: , 1227–1232. |
[38] | Thissen D , Steinberg L , Kuang D ((2002) ) Quick and easy implementation of the Benjamini-Hochberg procedure for controlling the false positive rate in multiple comparisons. J Educ Behav Stat 27: , 77–83. |
[39] | Xie T , Vigil J , MacCracken E , Gasparaitis A , Young J , Kang W , Bernard J , Warnke P , Kang UJ ((2015) ) Low-frequency stimulation of STN-DBS reduces aspiration and freezing of gait in patients with PD. Neurology 84: , 415–420. |
[40] | Yin Z , Zhu G , Liu Y , Zhao B , Liu D , Bai Y , Zhang Q , Shi L , Feng T , Yang A , Liu H , Meng F , Neumann WJ , Kuhn AA , Jiang Y , Zhang J ((2022) ) Cortical phase-amplitude coupling is key to the occurrence and treatment of freezing of gait. Brain 145: , 2407–2421. |
[41] | Snijders AH , Haaxma CA , Hagen YJ , Munneke M , Bloem BR ((2012) ) Freezer or non-freezer: Clinical assessment of freezing of gait. Parkinsonism Relat Disord 18: , 149–154. |
[42] | Burleigh-Jacobs A , Horak FB , Nutt JG , Obeso JA ((1997) ) Step initiation in Parkinson’s disease: Influence of levodopa and external sensory triggers. Mov Disord 12: , 206–215. |
[43] | Nieuwboer A ((2008) ) Cueing for freezing of gait in patients with Parkinson’s disease: A rehabilitation perspective. Mov Disord 23: (Suppl 2), S475–481. |


