
Temporal Muscle Thickness Correlates with Sarcopenia in Parkinson’s Disease
Abstract
Background:
Sarcopenia is characterized by a progressive loss of muscle mass, strength, and function resulting in adverse health outcomes. Current assessment strategies are bothersome and means to simplify the diagnosis are an unmet medical need in Parkinson’s disease (PD).
Objective:
To evaluate temporal muscle thickness (TMT) obtained on routine cranial MRI as a surrogate marker of sarcopenia in PD patients.
Methods:
We correlated TMT from axial non-contrast-enhanced T1-weighted sequences of MRI close (±12 months) to an outpatient visit including sarcopenia (EWGSOP1, EWGSOP2, SARC-F), frailty (Fried’s criteria, clinical frailty scale), and disease characteristics of Parkinson’s patients (Hoehn and Yahr-scale, Movement Disorder Society-Unified Parkinson’s Disease Rating Scale, quality of life with the Parkinson’s Disease Questionnaire-8) assessments.
Results:
Cranial MRI was available in 32 patients with a mean age of 73.56±5.14 years, mean disease duration of 11.46±5.66 years, and median Hoehn and Yahr stage of 2.5. The mean TMT was 7.49±2.76 (7.15) mm. Mean TMT was significantly associated with sarcopenia (EWGSOP2, p = 0.018; EWGSOP1, p = 0.023) and frailty status (physical phenotype; p = 0.045). Moreover, there were significant moderate to strong correlations between TMT measurement and appendicular skeletal muscle mass index (r: 0.437, p = 0.012), as well as handgrip strength (r: 0.561, p < 0.001).
Conclusion:
Reduced TMT seems to be a promising surrogate marker for sarcopenia (EWGSOP2) and muscle strength in this pilot study in PD patients.
INTRODUCTION
Sarcopenia is characterized by a progressive loss of muscle mass, strength, and function that negatively affect health outcomes such as functional independence, quality of life (QoL), and survival [1]. The current gold standard for the diagnosis of sarcopenia is derived from the European Working Group for Sarcopenia in Older People (EWGSOP) from 2019 (EWGSOP2) [1] and replaces its former criteria (EWGSOP1) [2]. Sarcopenia is diagnosed in a stepwise approach integrating low muscle strength (i.e., probable sarcopenia) plus low muscle mass to confirm sarcopenia (i.e., definite sarcopenia). An additional impaired physical function (e.g., low gait speed) classifies it as severe [1].
With rising life expectancy and thus an increase of people over the age of 60 years, improving their health and well-being is a priority. The prevalence of sarcopenia (EWGSOP2) in the general older population is around 10% (2–26%i.e., primary sarcopenia) [3, 4]. However, in the presence of chronic disorders including idiopathic Parkinson’s disease (PD), the prevalence of sarcopenia increases (i.e., secondary sarcopenia; 29% [18–40% ] in PD) [5]. Apart from sarcopenia, frailty is a geriatric syndrome that defines a state of increased risk for negative health outcomes [6]. Using the physical criteria, it is also found in around 10% of the general elderly population (4–27%) [7–9] and up to 38% (24–55%) in PD patients [10].
Early assessment of sarcopenia should be implemented in PD patients to prevent adverse health events. To this end, a thorough assessment of sarcopenia is warranted, which can be challenging in clinical routine. Screening tools such as the SARC-F exist, however, its applicability in PD patients is questionable [11, 12]. In brain cancer research, temporal muscle thickness (TMT) obtained on cranial MRI has been used as a surrogate marker for patients at risk of sarcopenia. Temporal muscle atrophy predicted faster progression and reduced overall survival [13, 14].
In this study, we retrospectively evaluated TMT in routine cranial MRI in PD patients that had a sarcopenia-assessment in our movement disorders clinic. Firstly, we aimed to assess the usability of TMT as a surrogate parameter of sarcopenia defined by different criteria. Secondly, we evaluated correlations of TMT with PD-related clinical characteristics of our cohort, the different components of sarcopenia, and the physical phenotype of frailty [7].
METHODS
For this analysis, we used data from a PD patient cohort that has been assessed for sarcopenia and frailty in the frame of a longitudinal observational study in our movement disorders clinic [15]. Patient selection was based on the availability of routinely performed cranial MRI close to the respective sarcopenia assessment.
The study protocol was approved by the local ethics committees. All participants gave written informed consent prior to their participation. The interviews and examinations were carried out in accordance with the principles expressed in the Declaration of Helsinki of 1975 and its later amendments.
Diagnosis of idiopathic PD was based on the Movement Disorder Society (MDS) Clinical Diagnostic Criteria [16]. The assessment of sarcopenia was performed between 2018 and 2021 and based on the EWGSOP’s operating standards and sex-specific cut-offs [1, 2]. Muscle mass was measured with the InBody 770 bioelectrical impedance analysis (BIA) machine at 50 kHz. Appendicular skeletal muscle mass (ASM) was calculated based on the recommended equation by Sergi et al. [17]. Muscle strength was assessed with a calibrated handheld dynamometer (CITEC CT3002). Two trials for each hand were performed and the best result from the strongest hand was used. For muscle function we measured gait speed (in meters/second) on a marked track with a stopwatch.
This study reports the results of sarcopenia-classification according to EWGSOP2 (see above) [1] as well as EWGSOP1. In the latter, decreased muscle mass only was defined as presarcopenia, whereas the addition of reduced muscle strength or gait speed classified the participant to be sarcopenic. Fulfilling all three criteria represents severe sarcopenia [2]. We choose to apply both the EWGSOP1 and 2 criteria for sarcopenia-assessment in this study as only few groups have used the new EWGSOP2 criteria in PD patient cohorts so far. The concordance of prevalence-ratings between the two criteria was recently rated as poor in a local PD population [12]. However, EWGSOP1 criteria were more closely associated with negative health outcomes in a recentreview [3].
Moreover, the participating PD patients were screened for sarcopenia using the SARC-F, a simple questionnaire composed of five items: strength, climbing stairs, assistance with walking, rising from a chair and falls with zero to two points each. A value of≥four points is indicative of sarcopenia [18]. Frailty was also assessed using Fried et al.’s criteria [7] as well as the validated 9-item screening tool Canadian Study of Health and Aging Clinical Frailty Scale (CSHA CFS, Version 1). The latter is based on impairment in mobility, functional capacity, cognition, and comorbidities with a score of ≥five points being indicative of frailty [19].
Exclusion criteria for participation included presence of another movement disorder or any contraindications to perform BIA (e.g., deep brain stimulation).
TMT was assessed in routine cranial MRI that were unrelated but in close temporal relation to the assessment of sarcopenia. TMT was measured on axial non-contrast-enhanced T1-weighted MR sequences by an investigator with experience in neuroimaging of neurodegenerative disorders, which was blinded to sarcopenia diagnosis and clinical patient characteristics (B.H.). We applied the same measuring procedures as reported elsewhere [13, 20]. The mean of TMT of both sides was calculated for further analyses [13, 20].
Apart from sarcopenia, frailty, and TMT, demographic data (sex and age), disease duration, comorbidities (Charlson Comorbidity Index) [21], and QoL using the PD Questionnaire-8 (PDQ-8, with lower scores indicating better QoL) [22] were assessed. Disease stage and manifestation were characterized with the Hoehn & Yahr (H&Y) scale and MDS-Unified PD Rating Scale (MDS-UPDRS). The tremor dominant (TD) and postural instability/gait difficulty (PIGD) PD phenotypes were determined and the TD phenotype was compared to a non-TD phenotype [23]. Levodopa equivalent daily dose (LEDD) was calculated using published conversion factors [24]. Recurrent falls were defined as >1 fall within the last year [25].
Statistical analyses
Categorical variables are given in number (n) and percent (%) of the category (sex, number of patients with presarcopenia/probable sarcopenia and definite sarcopenia, number of patients with prefrailty and frailty, PD type). For continuous quantitative measures the mean with its standard deviation and the median were calculated. Integer data are presented as median (interquartile range). The Kruskal-Wallis-test was used to compare continuous variables between more than two groups. Otherwise, continuous variables were tested for normality with the Kolmogorov-Smirnov test and Mann-Whitney-U tests or unpaired student’s t-tests were used for group comparisons depending on the scale type (see Table legends for details). Pearson correlation coefficient with its two-sided p-value was calculated to assess the relation between mean TMT and patient characteristics.
The significance level was set at a two-sided p-value of <0.05 (for correction for multiple comparison see legend of Table 3). SPSS 25.0 for windows (SPSS Inc., IBM Corporation and other(s) 1989, 2013, Chicago, IL) was used to tabulate and analyze data.
Table 3
Association of mean temporal muscle thickness with sarcopenia stages according to different assessment methods and with frailty (n = 32)
| EWGSOP2 | ||||
| No Sarcopenia | Probable Sarcopenia | Definite Sarcopenia | p | |
| n = 4 | n = 16 | n = 12 | ||
| TMT mean (mm) | 10.38±3.73 (8.73) | 7.36±2.94 (6.90) | 6.70±1.46 (6.90) | 0.058* |
| TMT mean (mm) | 10.38±3.73 (8.73) | 7.08±2.40 (6.90) | 0.018*** | |
| EWGSOP1 | ||||
| No Sarcopenia | Presarcopenia | Confirmed Sarcopenia | p | |
| n = 16 | n = 1 | n = 15 | ||
| TMT mean (mm) | 8.16±2.42 (7.73) | NA | 6.21±1.79 (5.75) | 0.023* |
| TMT mean (mm) | 8.16±2.42 (7.73) | 6.82±2.99 (6.03) | 0.067*** | |
| Frailty | ||||
| No Frailty | Prefrail | Frail | p | |
| n = 1 | n = 23 | n = 8 | ||
| TMT mean (mm) | NA | 7.55±2.51 (7.65) | 6.26±1.37 (6.00) | 0.092* |
| TMT mean (mm) | 7.90±3.00 (7.80) | 6.26±1.37 (6.00) | 0.045** | |
Continuous data is presented as mean±SD (median). Abbreviations: TMT, Temporal muscle thickness; EWGSOP, European Working Group on Sarcopenia in Older People; NA, not applicable. *Kruskal-Wallis-Test; **Student’s t-test; ***Mann-Whitney-U test; Significance level: p≤0.05. We did not formally adjust for multiple comparisons. If adjusting for multiple comparisons, the p-values would be set at p < 0.0167 (0.05/3, i.e., EWGSOP1, EWGSOP2, and frailty).
RESULTS
Figures 1–3 highlight the decrease of mean TMT from no to definite sarcopenia stage. Demographic data of the cohort are reported in Tables 1 and 2. A total of 32 PD patients aged 73.56±5.14 (73.53) years had an MRI within 12 months to a clinical sarcopenia assessment with a mean TMT of 7.49±2.76 (7.15) mm. Mean disease duration was 11.46±5.66 (11.02) years and the median H&Y stage was 2.50. According to EWGSOP2, probable sarcopenia was present in 50% (n = 16), definite sarcopenia in 38% and confirmed sarcopenia according to EWGSOP1 in 47% (n = 15). In the SARC-F, 44% (n = 14) of the patients screened positive for sarcopenia. Frailty was diagnosed in 25% (n = 8) and 31% (n = 10) screened positive for it using the CSHA CFS. Age, disease duration, H&Y stage, and impairment in QoL increased with sarcopenia stage (EWGSOP2), whereas MDS-UPDRS total and sub scores as well as LEDD did not (Tables 1 and 2).
Fig. 1
Temporal muscle thickness measurement of patients in different sarcopenia stages. A) no sarcopenia, B) severe sarcopenia (EWGSOP2).
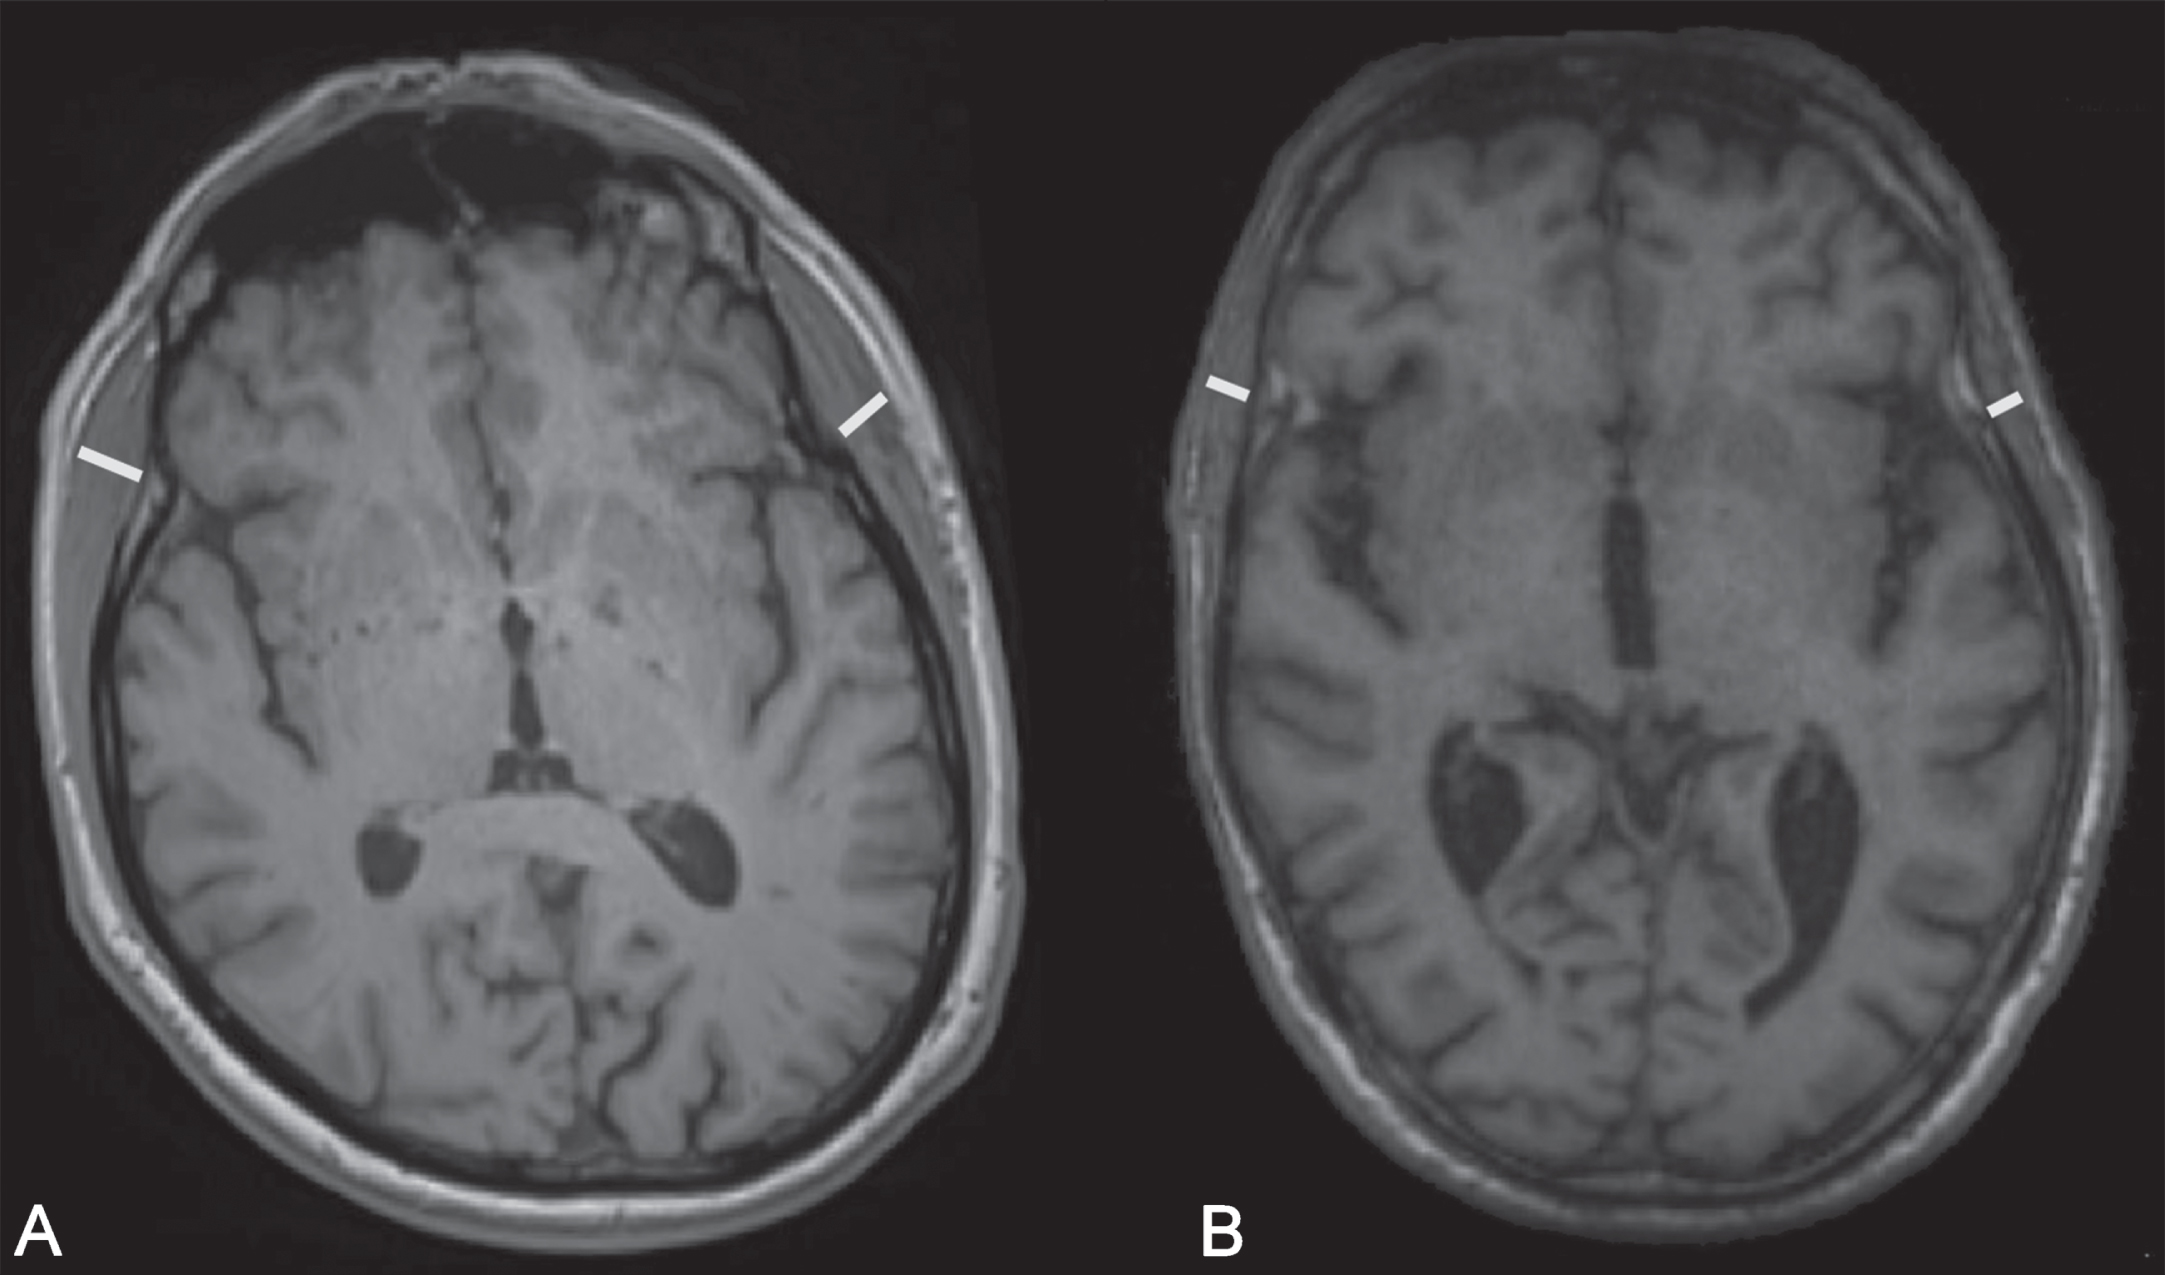
Fig. 2
Mean temporal muscle thickness in different sarcopenia stages. EWGSOP, European Working Group on Sarcopenia in Older People.
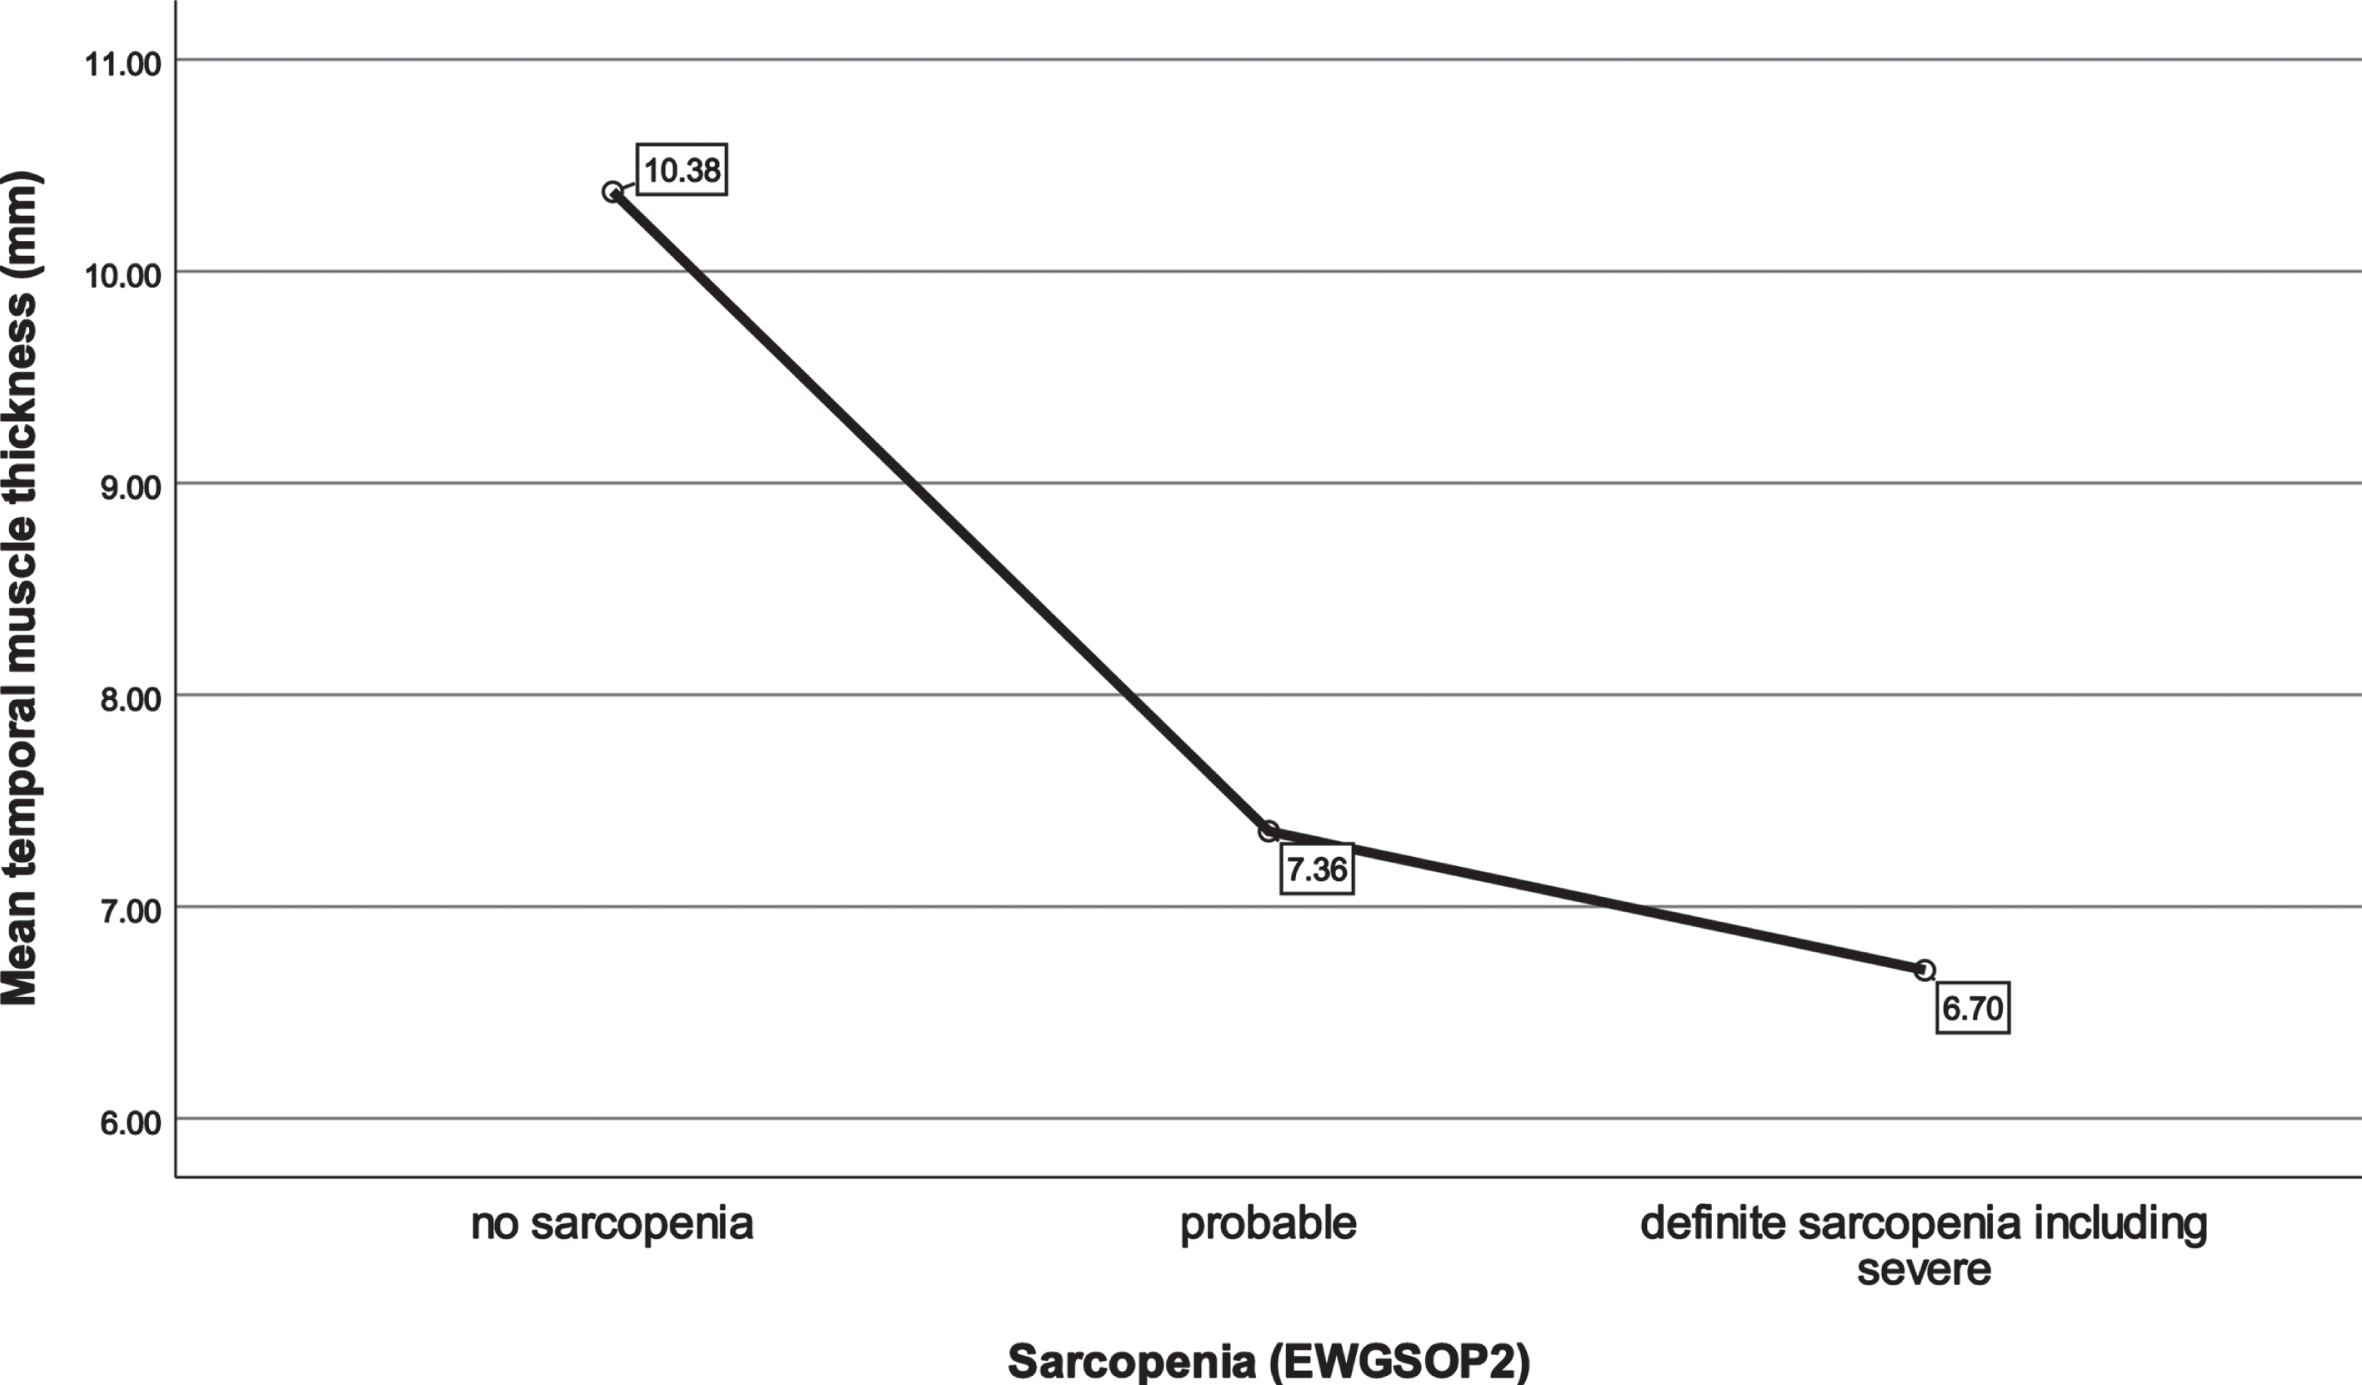
Fig. 3
Distribution of temporal muscle thickness in different sarcopenia stages. EWGSOP, European Working Group on Sarcopenia in Older People.
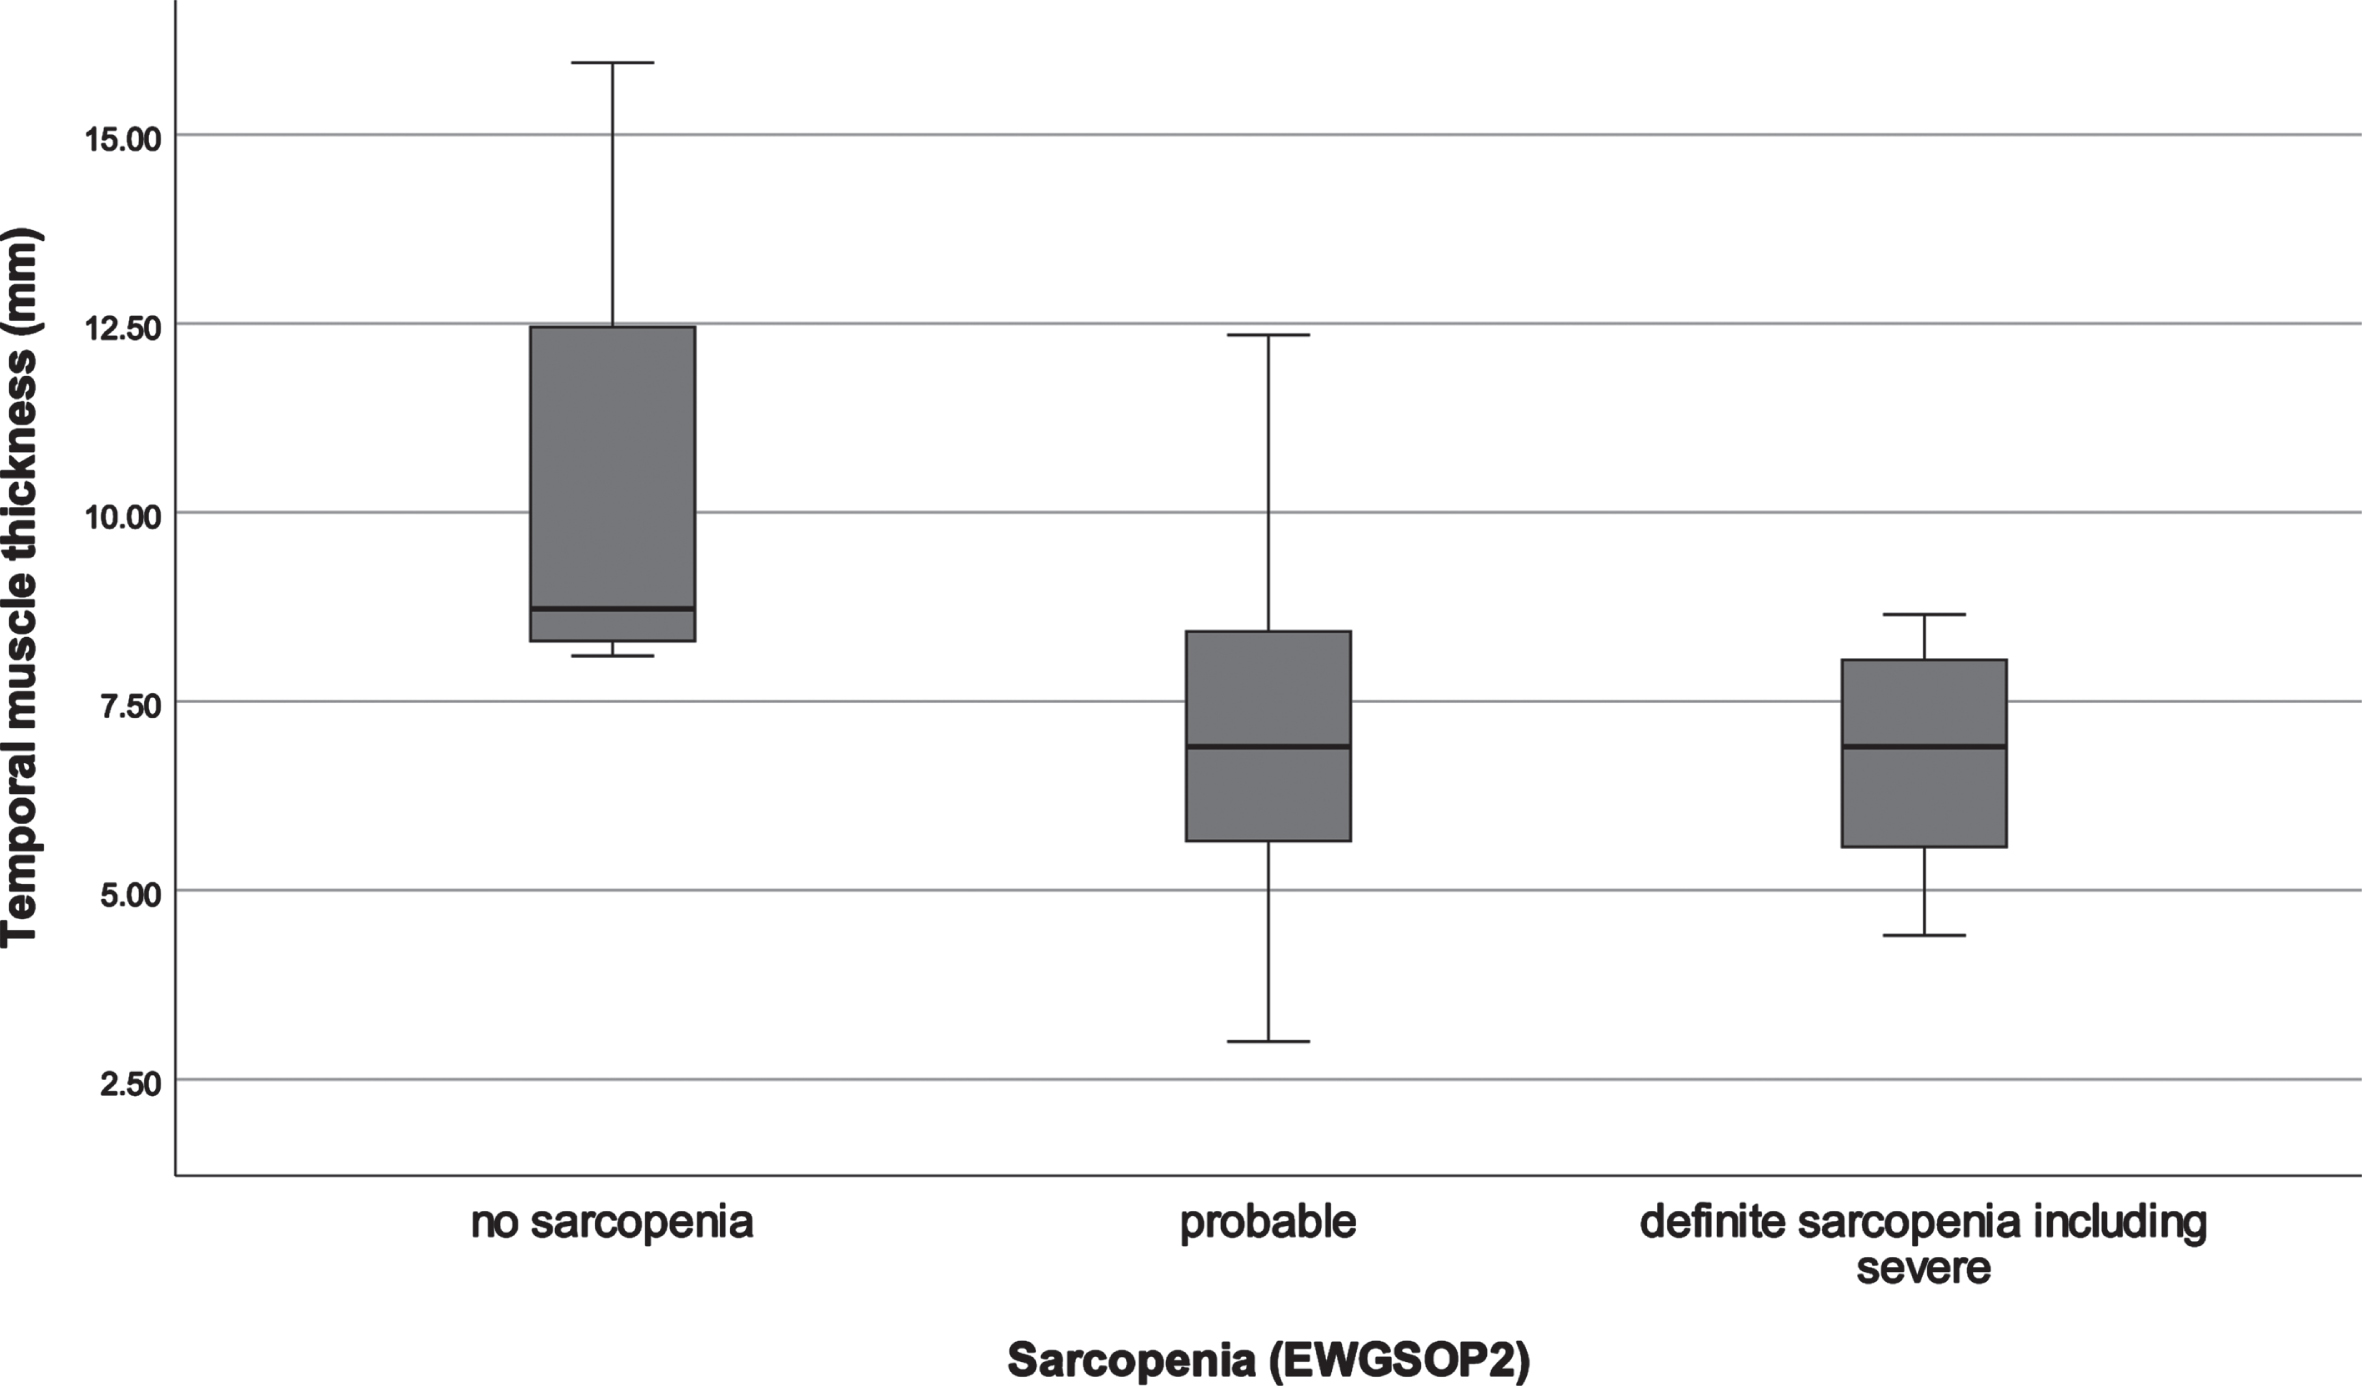
Table 1
Measurements of sarcopenia and frailty in the total patient cohort (n = 32)
| Sarcopenia (EWGSOP2) | |
| No Sarcopenia | 4 (12.5%) |
| Probable | 16 (50.0%) |
| Definite (including severe) | 12 (37.5%) |
| Sarcopenia (EWGSOP1) | |
| No Sarcopenia | 16 (50.0%) |
| Presarcopenia | 1 (3.1%) |
| Confirmed (including severe) | 15 (46.9%) |
| ASMI (kg/m2) | 7.57±1.25 (7.40) |
| Male: 8.45±0.97 (8.37) | |
| Female: 6.57±0.63 (6.66) | |
| Gait velocity (m/s) | 1.09±0.42 (1.08) |
| Handgrip strength (kg) | 15.61±7.17 (14.63) |
| Male: 20.13±6.33 (20.80) | |
| Female: 10.49±9.07 (3.90) | |
| Risk for sarcopenia (SARC-F) | 14 (43.8%) |
| Frailty (Fried) | |
| Not frail | 1 (3.1%) |
| Prefrail | 23 (71.9%) |
| Frail | 8 (25.0%) |
| Frailty (CSHA CFS) | 10 (31.3%) |
| TMT left side (mm) | 7.39±2.69 (7.20) |
| TMT right side (mm) | 7.58±2.90 (7.00) |
| TMT mean (mm) | 7.49±2.76 (7.15) |
Continuous data is presented as mean±SD (median), categorical data as n, %. Integer data are presented as median (interquartile range). EWGSOP, European Working Group on Sarcopenia in Older People; ASMI, Appendicular skeletal muscle mass index; SARC-F, a simple five-item questionnaire for assessing the risk of sarcopenia; CSHA, Canadian Study on Health & Aging; CFS, Clinical Frailty Scale; TMT, temporal muscle thickness.
Table 2
Clinical characteristics of the patient cohort (total and according to different sarcopenia stages)
| Total (n = 32) | No Sarcopenia (EWGSOP2)n = 4 | Probable Sarcopenia (EWGSOP2)n = 16 | Definite + severe Sarcopenia (EWGSOP2)n = 12 | |
| Age (years) | 73.56±5.14 (73.35) | 69.14±4.53 (67.37) | 73.26±4.99 (71.76) | 75.42±4.90 (75.93) |
| Sex (m / f) | 17 (53.1%)/15 (46.9%) | 3 (75.0%)/1 (25.9%) | 7 (43.8%)/9 (56.3%) | 7 (58.3%)/5 (41.7%) |
| Disease duration (y) | 11.46±5.66 (11.02) | 7.95±5.09 (7.49) | 11.56±5.23 (10.17) | 12.50±6.35 (12.58) |
| Charlson Comorbidity Index | 0.00 (0.00 –0.00) | 0.00 (0.00 –0.00) | 0.00 (0.00 –0.00) | 0.00 (0.00 –1.75) |
| PD Type | 10 (31.3%) | 2 (50.0%) | 4 (25.0%) | 4 (33.3%) |
| TD | ||||
| Non-TD | 22 (68.8%) | 2 (50.0%) | 12 (75.0%) | 8 (66.7%) |
| MDS-UPDRS Total Score | 65.28±31.01 (60.00) | 50.75±29.60 (37.50) | 72.38±29.44 (66.50) | 60.67±33.40 (57.00) |
| MDS-UPDRS Part 1 | 13.09±8.60 (12.00) | 9.75±9.91 (6.00) | 14.00±10.32 (11.50) | 13.00±5.58 (13.50) |
| MDS-UPDRS Part 2 | 12.91±9.55 (11.00) | 9.00±6.33 (8.00) | 14.88±9.47 (14.50) | 11.58±10.52 (8.50) |
| MDS-UPDRS Part 3 | 35.72±14.97 (36.50) | 28.00±12.54 (27.00) | 39.13±13.80 (38.50) | 33.75±16.91 (32.00) |
| MDS-UPDRS Part 4 | 3.56±4.49 (2.00) | 4.00±4.55 (3.00) | 4.38±4.38 (3.50) | 2.33±4.72 (0.00) |
| Hoehn and Yahr stage | 2.50 (2.00 –3.00) | 2.00 (2.00 –2.75) | 2.00 (2.00 –3.00) | 2.00 (2.00 –3.75) |
| LEDD (mg) | 795.81±404.37 (737.50) | 480.50±304.76 (490.00) | 917.94±380.16 (842.50) | 738.08±420.63 (587.50) |
| Recurrent falls | 11 (34.4%) | 1 (25.0%) | 6 (37.5%) | 4 (36.4%) |
| PDQ-8 Summary Index | 25.63±17.14 (25.00) | 11.72±10.33 (10.94) | 28.52±18.88 (26.56) | 26.56±14.68 (29.69) |
Continuous data is presented as mean±SD (median), categorical data as n, %. Integer data are presented as median (interquartile range). m, male; f, female; PD, Parkinson’s Disease; EWGSOP, European Working Group on Sarcopenia in Older People; TD, tremor-dominant; MDS-UPDRDS, Movement disorder society –Unified Parkinson’s Disease Rating Scale; LEDD, Levodopa equivalent daily dose; PDQ-8, Parkinson’s Disease Questionnaire-8.
Mean TMT was significantly different (Mann-Whitney-U test; p = 0.018) between patients with sarcopenia and those without sarcopenia according to EWGSOP2 criteria (Table 3, Figs. 1–3). Moreover, there was significant difference in TMT between groups stratified according to the frailty status (Student’s t-test; p = 0.045; Table 3).
Mean TMT showed a moderate correlation with sarcopenia according to EWGSOP 2 (probable and definite; Pearson’s r: –0.402, p = 0.023) and ASM index (r: 0.437, p = 0.012). Handgrip strength showed a strong positive correlation with mean TMT (r: 0.561, p < 0.001; Table 4). Neither disease duration, nor PD phenotype, MDS-UPDRS Parts 1–4, H&Y stage, LEDD, PDQ-8 Summary Index, gait velocity, frailty according to Fried et al. [7] nor the CFS [19] were correlated with TMT (all p > 0.068; Table 4).
Table 4
Correlation of mean temporal muscle thickness with sarcopenia characteristics, frailty
and clinical characteristics
| Correlation with TMT (in mm, n = 32) | ||
| Pearson Correlation Coefficient | p | |
| Sarcopenia (EWGSOP2, probable + definite) | –0.402 | 0.023 |
| Sarcopenia (EWGSOP1, presarcopenia + confirmed) | –0.246 | 0.174 |
| ASMI (kg/m2) | 0.437 | 0.012 |
| Gait velocity (m/s) | 0.313 | 0.081 |
| Handgrip strength (kg) | 0.561 | 0.001 |
| Risk for sarcopenia (SARC-F) | –0.262 | 0.148 |
| Frailty (Fried, frail) | –0.262 | 0.148 |
| Frailty (CSHA CFS) | –0.327 | 0.068 |
| TMT mean at follow-up | NA | NA |
| Sex (male/female) | –0.274 | 0.130 |
| Age (y) | –0.357 | 0.045 |
| Disease duration (y) | –0.062 | 0.736 |
| Charlson Comorbidity Index | –0.160 | 0.382 |
| PD Type (TD / non-TD) | –0.009 | 0.960 |
| MDS-UPDRS Total Score | –0.258 | 0.153 |
| MDS-UPDRS Part 1 | –0.194 | 0.289 |
| MDS-UPDRS Part 2 | –0.079 | 0.667 |
| MDS-UPDRS Part 3 | –0.314 | 0.080 |
| MDS-UPDRS Part 4 | –0.200 | 0.273 |
| Hoehn and Yahr stage | –0.260 | 0.150 |
| LEDD (mg) | –0.001 | 0.997 |
| Recurrent falls | –0.184 | 0.312 |
| PDQ-8 Summary Index | –0.305 | 0.101 |
Pearson correlation coefficients and their respective p-values are displayed. TMT, temporal muscle thickness; EWGSOP, European Working Group on Sarcopenia in Older People; ASMI, Appendicular skeletal muscle mass index; SARC-F, a simple five-item questionnaire for assessing the risk of sarcopenia; CSHA, Canadian Study on Health & Aging; CFS, Clinical Frailty Scale; TD, tremor-dominant; MDS-UPDRDS, Movement disorder society –Unified Parkinson’s Disease Rating Scale; LEDD, Levodopa equivalent daily dose; PDQ-8, Parkinson’s Disease Questionnaire-8; NA, not applicable. Significance level: p≤0.05.
DISCUSSION
In this study sarcopenia (EWGSOP2) was present in 38% (n = 12 of 32 patients), which is higher compared to the only other study using the EWGSOP2 criteria for sarcopenia-assessment in PD patients [26]. These may be explained by regional differences (Brazil vs. Austria) as well as a higher age and markedly longer disease duration of our PD patient cohort [26]. Physical frailty was present in 25% (n = 8) of patients in our study, which is slightly lower compared to its pooled prevalence in a recent meta-analysis in PD patients [10]. Heterogeneity of the trials may explain the different frequency distribution.
The aim of this analysis was to determine the usability of mean TMT, as measured in axial non-contrast-enhanced T1-weighted MR sequences, to assess sarcopenia in PD patients.
TMT recently gained the interest of the scientific community as a surrogate marker for sarcopenia in other neurological diseases and as a predictor of relevant clinical outcomes. Except for cancer research (e.g., glioblastoma [13], cerebral metastasis [14, 27], head and neck squamous cell carcinoma [28]), TMT was also assessed in neurological patients with amyotrophic lateral sclerosis (ALS) were it was related to the functional outcome (ALS functional rating scale) and overall survival [29]. In demented patients, cognitive function was associated with TMT [30] and in patients with aneurysmal subarachnoid hemorrhage with endovascular treatment, TMT was an important determinant of disability (modified Rankin Scale) [31].
Mean TMT in our study was significantly associated with sarcopenia as well as with frailty status [7]. The prevalence of sarcopenia is typically lower when using EWGSOP2 criteria (difference of about 7% in a recent review [3]). Due to the adapted operationalization of sarcopenia-diagnosis and stricter recommended cut-off values for handgrip strength and muscle mass, the EWGSOP2 criteria are believed to be more accurate [12]. TMT in this study only significantly correlated with assessment of sarcopenia according to EWGSOP2 but not EWGSOP1. This supports its role as a promising surrogate marker for the assessment of sarcopenia, even when stringent criteria are applied. Reduced TMT significantly correlated with the core determinants of sarcopenia muscle strength and ASM index. An Austrian study of healthy volunteers and patients with a variety of neurological diseases also showed a moderate-to-strong positive correlation of TMT with handgrip strength [20]. This study did not include a PD patient cohort for which our study now provides data. Handgrip strength, the cornerstone of the current sarcopenia assessment (EWGSOP2), is believed to represent overall muscle function most reliably [1]. The robust close relation of grip strength and TMT in different bodily states (disease-free, neurological diseases) reflects the utility of TMT to provide information about physical functionality. To the best of our knowledge, no study so far assessed a correlation between TMT and BIA-derived ASM. MRI-derived TMT values were however correlated with the cross-sectional area of skeletal muscles at the level of the third lumbar vertebra on computed tomography scans of patients with brain metastasis and glioblastoma. Both studies concluded on the usefulness of TMT as a surrogate marker of the body’s total skeletal muscle mass [32, 33].
Furthermore, we did not find a significant correlation of TMT with gait velocity, which may be explained by the reduced gait velocity in PD patients in general. In the updated definition of sarcopenia (EWGSOP2), the working group used physical performance such as gait speed to establish severity. In contrast to this, reduced TMT seems to represent sarcopenia independently of low gait speed in PD patients, and therefore gait velocity is not suitable for rating sarcopenia in PD patients. Furthermore, reduced gait velocity is not necessary to diagnose sarcopenia [1].
Muscle mass and function are known to decrease with age. It is therefore unsurprising that mean TMT was inversely correlated with age in our patient cohort. In an Austrian study of healthy volunteers and patients with various neurological diseases, only TMT of the former declined with age [20]. Generally, age represents the number one risk factor for sarcopenia [1], which is reflected in our findings.
PD patients should be screened for sarcopenia for timely counter measurements. Assessing TMT on routine cranial MRI, that are performed during the diagnostic work-up of PD patients, may aid in identification of patients at risk for sarcopenia. Respective physical training and nutritional advice may influence the patient’s sarcopenia status positively and thus enhance their motor functionand QoL [34].
Apart from muscle mass and function, TMT (measured via ultrasound with high inter-rater reliability: 0.99) has recently been introduced as a surrogate marker for nutritional status (assessed with calf and arm circumference, protein levels, triceps skinfold thickness for fat mass) [35]. An adequate diet with supply of protein and energy is vital for muscle health and hence for prevention of sarcopenia. Malnutrition in PD occurs in about 11–41% of patients, which is not only associated with worse motor outcome but also quality of life [36, 37]. Assessment of TMT may provide an objective measurement for an individual’s nutritional status to improved dietary therapy and monitor progression, which should be subject of future trials.
The systemic assessment with BIA as a standardized and validated method [1] as well as the comprehensive integration of physical performance and PD-specific parameters including QoL are important strengths of this study. ASM in this study was calculated using raw BIA measurements at 50 KHz based on the recommended equation by Sergi et al. [17]. The equation itself was based on an older European population and is therefore reflective of our PD patient cohort. To reduce influence of body size and improve comparability, the ASM was adjusted (ASM/height2, i.e., ASMI). Considering these, the easy use, and wide availability of BIA, it is a good method in comparison to dual-energy X-ray absorptiometry (DXA), which is favored for muscle mass measurement by several clinicians and researchers [1].
Moreover, the comparison of TMT measurements to the gold standard of sarcopenia assessment (EWGSOP2) highlights our study in contrast to others, as it is one of only two studies using these criteria in PD patients. The assessment of PD patients in our study was performed prospectively by movement disorder specialists based on standard criteria. This guarantees the correct diagnosis and classification of disease characteristics. There are also some limitations to consider. Firstly, due to the retrospective nature of the study, we did not compare the TMT values of our PD patients to an age- and sex-matched local healthy control group. Secondly, the small sample size may be subject to a sample bias and thus limit generalizability.
Conclusion
In conclusion, to our knowledge this is the first study to assess the usability of TMT as a surrogate marker for sarcopenia in PD patients. Our study shows that TMT correlates with the diagnosis of sarcopenia and its core components in PD patients. Thus, TMT from routine cranial MRI may represent a promising and widely accessible marker for sarcopenia to be recognized by clinicians treating PD patients. Further studies with a larger cohort and control group are needed to verify the findings of this pilot study and to define optimal TMT-cut-off values for sarcopenia in PD.
ACKNOWLEDGMENTS
We want to thank all participants who voluntarily took part in this study.
CONFLICT OF INTEREST
The authors have no conflict of interest to report in relation to the manuscript.
DATA AVAILABILITY
Data that support the findings of this study are available from the first or corresponding author upon reasonable request and fulfilling data sharing regulations approved by the local ethics committee. Only deidentified individual data that underlie the results reported in this manuscript will be made available. Proposals should be directed to the first or corresponding author. Data will only be shared via individual secured network connections.
REFERENCES
[1] | Cruz-Jentoft AJ , Bahat G , Bauer J , Boirie Y , Bruyère O , Cederholm T , Cooper C , Landi F , Rolland Y , Sayer AA , Schneider SM , Sieber CC , Topinkova E , Vandewoude M , Visser M , Zamboni M Writing Group for the European Working Group on Sarcopenia in Older People 2 (EWG-SOP2), and the Extended Group for EWGSOP2 ((2019) ) Sarcozpenia: Revised European consensus on definition and diagnosis. Age Ageing 48: , 16–31. |
[2] | Cruz-Jentoft AJ , Baeyens JP , Bauer JM , Boirie Y , Cederholm T , Landi F , Martin FC , Michel JP , Rolland Y , Schneider SM , Topinková E , Vandewoude M , Zamboni M European Working Group on Sarcopenia in Older People ((2010) ) Spenia: European consensus on definition and diagnosis: Report of the European Working Group on Sarcopenia in Older People. Age Ageing 39: , 412–423. |
[3] | Fernandes LV , Paiva AEG , Silva ACB , de Castro IC , Santiago AF , de Oliveira EP , Porto LCJ ((2022) ) Prevalence of sarcopenia according to EWGSOP1 and EWGSOP2 in older adults and their associations with unfavorable health outcomes: A systematic review. Aging Clin Exp Res 34: , 505–514. |
[4] | Petermann-Rocha F , Balntzi V , Gray SR , Lara J , Ho FK , Pell JP , Celis-Morales C ((2022) ) Global prevalence of sarcopenia and severe spenia: A systematic review and meta-analysis. J Cachexia Sarcopenia Muscle 13: , 86–99. |
[5] | Cai Y , Feng F , Wei Q , Jiang Z , Ou R , Shang H ((2021) ) Sarcopenia in patients with Parkinson’s disease: A systematic review and meta-analysis. Front Neurol 12: , 598035. |
[6] | Rockwood K , Theou O ((2020) ) Using the Clinical Frailty Scale in allocating scarce health care resources. Can Geriatr J 23: , 210–215. |
[7] | Fried LP , Tangen CM , Walston J , Newman AB , Hirsch C , Gottdiener J , Seeman T , Tracy R , Kop WJ , Burke G , McBurnie MA , Cardiovascular Health Study Collaborative Research Group ((2001) ) Frailty in older adults: Evidence for a phenotype. J Gerontol A Biol Sci Med Sci 56: , M146–156. |
[8] | Collard RM , Boter H , Schoevers RA , Oude Voshaar RC ((2012) ) Prevalence of frailty in community-dwelling older persons: A systematic review. J Am Geriatr Soc 60: , 1487–1492. |
[9] | Kehler DS , Ferguson T , Stammers AN , Bohm C , Arora RC , Duhamel TA , Tangri N ((2017) ) Prevalence of frailty in Canadians 18-79 years old in the Canadian Health Measures Survey. BMC Geriatr 17: , 28. |
[10] | McMillan JM , Michalchuk Q , Goodarzi Z ((2021) ) Frailty in Parkinson’s disease: A systematic review and meta-analysis. Clin Park Relat Disord 4: , 100095. |
[11] | da Luz MCL , Pinho CPS , Bezerra GKA , da Conceicao Chaves de Lemos M , da Silva Diniz A , Cabral PC ((2021) ) SARC-F and SARC-CalF in screening for sarcopenia in older adults with Parkinson’s disease. Exp Gerontol 144: , 111183. |
[12] | Valent D , Peball M , Krismer F , Lanbach A , Zemann S , Horlings C , Poewe W , Seppi K ((2022) ) Different assessment tools to detect sarcopenia in patients with Parkinson’s disease. Front Neurol 13: , 1014102. |
[13] | Furtner J , Weller M , Weber M , Gorlia T , Nabors B , Reardon DA , Tonn JC , Stupp R , Preusser M , EORTC Brain Tumor Group ((2022) ) Temporal muscle thickness as a prognostic marker in patients with newly diagnosed glioblastoma: Translational imaging analysis of the CENTRIC EORTC 26071-22072 and CORE Trials. Clin Cancer Res 28: , 129–136. |
[14] | Furtner J , Berghoff AS , Albtoush OM , Woitek R , Asenbaum U , Prayer D , Widhalm G , Gatterbauer B , Dieckmann K , Birner P , Aretin B , Bartsch R , Zielinski CC , Schopf V , Preusser M ((2017) ) Survival prediction using temporal muscle thickness measurements on cranial magnetic resonance images in patients with newly diagnosed brain metastases. Eur Radiol 27: , 3167–3173. |
[15] | Peball M , Mahlknecht P , Werkmann M , Marini K , Murr F , Herzmann H , Stockner H , de Marzi R , Heim B , Djamshidian A , Willeit P , Willeit J , Kiechl S , Valent D , Krismer F , Wenning GK , Nocker M , Mair K , Poewe W , Seppi K ((2019) ) Prevalence and associated factors of sarcopenia and frailty in Parkinson’s disease: A cross-sectional study. Gerontology 65: , 216–228. |
[16] | Postuma RB , Berg D , Stern M , Poewe W , Olanow CW , Oertel W , Obeso J , Marek K , Litvan I , Lang AE , Halliday G , Goetz CG , Gasser T , Dubois B , Chan P , Bloem BR , Adler CH , Deuschl G ((2015) ) MDS clinical diagnostic criteria for Parkinson’s disease. Mov Disord 30: , 1591–1601. |
[17] | Sergi G , De Rui M , Veronese N , Bolzetta F , Berton L , Carraro S , Bano G , Coin A , Manzato E , Perissinotto E ((2015) ) Assessing appendicular skeletal muscle mass with bioelectrical impedance analysis in free-living Caucasian older adults. Clin Nutr 34: , 667–673. |
[18] | Malmstrom TK , Miller DK , Simonsick EM , Ferrucci L , Morley JE ((2016) ) SARC-F: A symptom score to predict persons with sarcopenia at risk for poor functional outcomes. J Cachexia Sarcopenia Muscle 7: , 28–36. |
[19] | Rockwood K , Song X , MacKnight C , Bergman H , Hogan DB , McDowell I , Mitnitski A ((2005) ) A global clinical measure of fitness and frailty in elderly people. CMAJ 173: , 489–495. |
[20] | Steindl A , Leitner J , Schwarz M , Nenning KH , Asenbaum U , Mayer S , Woitek R , Weber M , Schopf V , Berghoff AS , Berger T , Widhalm G , Prayer D , Preusser M , Furtner J ((2020) ) Sarcopenia in neurological patients: Standard values for temporal muscle thickness and muscle strength evaluation. J Clin Med 9: , 1272. |
[21] | Charlson ME , Pompei P , Ales KL , MacKenzie CR ((1987) ) A new method of classifying prognostic comorbidity in longitudinal studies: Development and validation. J Chronic Dis 40: , 373–383. |
[22] | Jenkinson C , Fitzpatrick R , Peto V , Greenhall R , Hyman N ((1997) ) The PDQ-8: Development and validation of a short-form Parkinson’s disease questionnaire. Psychol Health 12: , 805–814. |
[23] | Stebbins GT , Goetz CG , Burn DJ , Jankovic J , Khoo TK , Tilley BC ((2013) ) How to identify tremor dominant and postural instability/gait difficulty groups with the movement disorder society unified Parkinson’s disease rating scale: Comparison with the unified Parkinson’s disease rating scale. Mov Disord 28: , 668–670. |
[24] | Tomlinson CL , Stowe R , Patel S , Rick C , Gray R , Clarke CE ((2010) ) Systematic review of levodopa dose equivalency reporting in Parkinson’s disease. Mov Disord 25: , 2649–2653. |
[25] | Mahlknecht P , Kiechl S , Bloem BR , Willeit J , Scherfler C , Gasperi A , Rungger G , Poewe W , Seppi K ((2013) ) Prevalence and burden of gait disorders in elderly men and women aged 60-97 years: A population-based study. PLoS One 8: , e69627. |
[26] | da Luz MCL , Bezerra GKA , Asano AGC , Chaves de Lemos MDC , Cabral PC ((2021) ) Determinant factors of sarcopenia in individuals with Parkinson’s disease. Neurol Sci 42: , 979–985. |
[27] | Kim YI , Shin JY , Yang SH , Kim HH , Shim BY , Ahn S ((2022) ) Association between temporal muscle thickness and overall survival in non-small cell lung cancer patients with brain metastasis. Curr Oncol 29: , 6463–6471. |
[28] | Lee B , Bae YJ , Jeong WJ , Kim H , Choi BS , Kim JH ((2021) ) Temporalis muscle thickness as an indicator of sarcopenia predicts progression-free survival in head and neck squamous cell carcinoma. Sci Rep 11: , 19717. |
[29] | Vinciguerra C , Toriello A , Nardone V , Romano D , Tartaglione S , Abate F , Landolfi A , Barone P ((2022) ) Temporal muscle thickness and survival in patients with amyotrophic lateral sclerosis. Neurol Res 44: , 1006–1010. |
[30] | Cho J , Park M , Moon WJ , Han SH , Moon Y ((2022) ) Sarcopenia in patients with dementia: Correlation of temporalis muscle thickness with appendicular muscle mass. Neurol Sci 43: , 3089–3095. |
[31] | Katsuki M , Suzuki Y , Kunitoki K , Sato Y , Sasaki K , Mashiyama S , Matsuoka R , Allen E , Saimaru H , Sugawara R , Hotta A , Tominaga T ((2020) ) Temporal muscle as an indicator of sarcopenia is independently associated with Hunt and Kosnik Grade on Admission and the modified Rankin Scale Score at 6 months of patients with subarachnoid hemorrhage treated by endovascular coiling. World Neurosurg 137: , e526–e534. |
[32] | Leitner J , Pelster S , Schopf V , Berghoff AS , Woitek R , Asenbaum U , Nenning KH , Widhalm G , Kiesel B , Gatterbauer B , Dieckmann K , Birner P , Prayer D , Preusser M , Furtner J ((2018) ) High correlation of temporal muscle thickness with lumbar skeletal muscle cross-sectional area in patients with brain metastases. PLoS One 13: , e0207849. |
[33] | Ten Cate C , Huijs SMH , Willemsen ACH , Pasmans R , Eekers DBP , Zegers CML , Ackermans L , Beckervordersandforth J , van Raak EPM , Anten M , Hoeben A , Postma AA , Broen MPG ((2022) ) Correlation of reduced temporal muscle thickness and systemic muscle loss in newly diagnosed glioblastoma patients. J Neurooncol 160: , 611–618. |
[34] | Dent E , Morley JE , Cruz-Jentoft AJ , Arai H , Kritchevsky SB , Guralnik J , Bauer JM , Pahor M , Clark BC , Cesari M , Ruiz J , Sieber CC , Aubertin-Leheudre M , Waters DL , Visvanathan R , Landi F , Villareal DT , Fielding R , Won CW , Theou O , Martin FC , Dong B , Woo J , Flicker L , Ferrucci L , Merchant RA , Cao L , Cederholm T , Ribeiro SML , Rodriguez-Manas L , Anker SD , Lundy J , Gutierrez Robledo LM , Bautmans I , Aprahamian I , Schols J , Izquierdo M , Vellas B ((2018) ) International Clinical Practice Guidelines for Sarcopenia (ICFSR): Screening, diagnosis and management. J Nutr Health Aging 22: , 1148–1161. |
[35] | Hasegawa Y , Yoshida M , Sato A , Fujimoto Y , Minematsu T , Sugama J , Sanada H ((2019) ) Temporal muscle thickness as a new indicator of nutritional status in older individuals. Geriatr Gerontol Int 19: , 135–140. |
[36] | Jiang Z , Ou R , Chen Y , Zhang L , Wei Q , Hou Y , Gu X , Cao B , Liu K , Shang H , Song W ((2022) ) Prevalence and associated factors of malnutrition in patients with Parkinson’s disease using CONUT and GNRI. Parkinsonism Relat Disord 95: , 115–121. |
[37] | Sheard JM , Ash S , Mellick GD , Silburn PA , Kerr GK ((2014) ) Improved nutritional status is related to improved quality of life in Parkinson’s disease. BMC Neurol 14: , 212. |


