
Extra-Basal Ganglia Brain Structures Are Related to Motor Reserve in Parkinson’s Disease
Abstract
Background:
The “motor reserve” is an emerging concept based on the discrepancy between the severity of parkinsonism and dopaminergic degeneration; however, the related brain structures have not yet been elucidated.
Objective:
We investigated brain structures relevant to the motor reserve in Parkinson’s disease (PD) in this study.
Methods:
Patients with drug-naïve, early PD were enrolled, who then underwent dopamine transporter (DAT) scan and diffusion tensor imaging (DTI). The severity of motor symptoms was evaluated with the Unified Parkinson’s Disease Rating Scale score of bradykinesia and rigidity on the more affected side and dopaminergic degeneration of DAT uptake of the more affected putamen. Individual motor reserve estimate (MRE) was evaluated based on the discrepancy between the severity of motor symptoms and dopaminergic degeneration. Using DTI and the Brainnetome atlas, brain structures correlated with MRE were identified.
Results:
We enrolled 193 patients with drug-naïve PD (mean disease duration of 15.6±13.2 months), and the MRE successfully predicted the increase of levodopa equivalent dose after two years. In the DTI analysis, fractional anisotropy values of medial, inferior frontal, and temporal lobes, limbic structures, nucleus accumbens, and thalamus were positively correlated with the MRE, while no brain structures were correlated with mean diffusivity. Additionally, degree centrality derived from the structural connectivity of the frontal and temporal lobes and limbic structures was positively correlated with the MRE.
Conclusion:
Our results show empirical evidence for MR in PD and brain structures relevant to MR, particularly, the extra-basal ganglia system including the limbic and frontal structures.
INTRODUCTION
The characteristic hallmark of Parkinson’s disease (PD) is progressive dopaminergic cell loss, and the treatment protocol focuses on dopamine replacement [1, 2]. Therefore, dopamine transporter (DAT) scan is regarded as a useful tool to evaluate the dopaminergic degeneration [3–5] and even suggested as a predictive marker for the disease severity in PD [5–9]. Nevertheless, the discrepancy between the severity of parkinsonian symptoms and dopaminergic deficit in patients with PD has already been demonstrated [10], and previous studies had failed to predict the disease progression in patients with PD using DAT imaging alone [11, 12]. Therefore, although dopaminergic deficit confirmation by DAT imaging is important, there are other factors to decide the severity of clinical parkinsonism.
The concept of motor reserve (MR), including the pre- and post-morbid compensatory changes, was introduced to explain the aforementioned apparent discrepancies based on a wide clinical spectrum and long-standing neurodegenerative process even from the pre-clinical stage [13]. Despite the lack of consensus on how to measure MR in PD patients, MR can be evaluated using the discrepancy between the imaging-based dopaminergic deficit and the severity of clinical manifestations [13]. As suggested in our study, this method of computing MR could explain the discrepancies between DAT results and clinical parkinsonism, and even predict the clinical prognosis in PD.
Previous studies reported that MR is associated with various factors such as demographics, lifestyle, or environment in patients with PD [14–17]. All these factors lead to structural changes in the brain, which in turn reflect the MR in patients with PD. Only one previous study using functional magnetic resonance imaging (MRI) has focused on the brain structures related to MR [18]. Interestingly, this study demonstrated that diverse basal ganglia and extra-basal ganglia structures are associated with MR. However, since there is no study using other imaging modalities, the relevant brain structures continue to be ambiguous and thus, they need to be explored.
Diffusion tensor imaging (DTI) is an MRI technique sensitive to the orientation of mobility in intravoxel water molecules [19], which can detect microstructural changes in the neural tissue in PD [20]. Therefore, considering the long-standing course of PD, DTI allows the study of neuronal fiber integrity influenced by both the neurodegenerative and compensatory processes in PD which are directly associated with MR.
Therefore, to investigate the relevant brain structures for MR in PD, we constructed a linear marker model to quantify MR using multiple regression, and analyzed the correlation between the MR marker and DTI-imaging derived features of fractional anisotropy, mean diffusivity, and structural connectivity in patients with drug-naïve, early PD.
METHODS
Study population and clinical assessments
This study was approved by the Institutional Review Board of Samsung Medical Center, Seoul, Korea, and all enrolled subjects provided written informed consent. All methods were carried out in accordance with the relevant guidelines and regulations.
We prospectively recruited patients with drug naïve, early PD at the Movement Disorders Clinic of Samsung Medical Center to collect the baseline data from 2015 to 2016, and then obtained the levodopa equivalent daily dose (LEDD) after 2 years from the baseline evaluation for the marker of disease progression based on the previous literature [13, 18]. PD was diagnosed using the United Kingdom Parkinson’s Disease Society Brain Bank criteria [21], and an early PD was defined as PD with a disease duration of less than four years [22]. We excluded participants with structural brain lesions including territorial stroke or white matter changes (an age-related white matter change score ≥2 on brain MRI) [23], other known neurodegenerative diseases, psychiatric disorders requiring medication, cognitive decline (a Korean Mini-Mental Status Exam [K-MMSE] score <24), or musculo-skeletal problems mimicking parkinsonism.
We evaluated clinical parkinsonism using the Unified Parkinson Disease Rating Scale (UPDRS) part 3 and the Hoehn and Yahr (HY) stage [24], and divided the UPDRS part 3 score into 4 sub-scores of tremor, rigidity, bradykinesia, and axial symptoms [25]. In terms of dopaminergic deficit, all subjects underwent [18F] N-(3-fluoropropyl)-2β-carbon ethoxy-3β-(4-iodophenyl) nortropane (18FP-CIT) positron emission tomography (PET) in a Discovery ST8 scanner (GE Healthcare, Milwaukee, WI). For DTI analysis, we performed high-resolution T1-weighted structural imaging and DTI in a 3.0 T Intera Achieva scanner (Philips Healthcare, Best, Netherlands) on all participants. Additionally, global cognition was evaluated using the K-MMSE [26, 27].
Quantitative analysis of 18FP-CIT PET
Brain 18FP-CIT PET images were obtained using a PET/computed tomography (CT) scanner (Discovery STE, GE Healthcare, USA), 120 min after an injection of 185 MBq 18FP-CIT. The PET images were acquired for 10 min in a three-dimensional mode immediately after a brain CT scan for attenuation correction and image fusion. CT scanning was performed at 140 kVp and 50 mAs with a slice thickness of 3.75 mm. The 18FP-CIT PET images were reconstructed with a VUE POINT algorithm using a 128×128 matrix.
In terms of DAT uptake, we computed the specific to non-specific binding ratio (SNBR) of putamen and caudate of the more affected side. The SNBR of the putamen was the ratio of mean uptake value of the putamen to that of the ipsilateral cerebellum, and the same computation was applied for the caudate. In detail, we segmented the putamen, caudate, and occipital cortex in the T1-MRI images using Freesurfer [28], and the segmented regions were registered onto the PET images to specify the three regions. The partial volume effect was corrected using the iterative Yang algorithm implemented in PETPVC toolbox [29]. Photon attenuation was estimated from the T1-MRI images and corrected using attenuation maps calculated through a combination of intensity- and prior-based tissue segmentation and atlas registration [30]. Finally, SNBRs were computed for the putamen and caudate of the more affected side.
A linear marker model for motor reserve (motor reserve estimate)
We hypothesized MR as a difference between the actual and estimated severity of motor symptoms. The estimated severity was defined based on imaging-based pathology and demographics similar to a previous study [18]. Based on the consistent correlations of rigidity and bradykinesia with DAT uptake in putamen [7, 9, 12], we used the sum of rigidity and bradykinesia scores of UPDRS part 3 of the more affected side as the severity of parkinsonism, and SNBR of putamen of the more affected side as the dopaminergic deficit. We performed multiple linear regression with the severity of motor symptoms as the dependent variable, SNBR of putamen of the more affected side as the independent variable, and age, sex, disease duration, and K-MMSE as covariates. The resulting regression (beta) coefficients of these variables were used to calculate the estimated severity of motor symptoms. With this assumption, we defined the MR markers as the difference between the actual and estimated severity of motor symptoms as follows.
(1)
(2)
We further defined MR estimate (MRE) as the normalized z-score value [18]. Furthermore, to validate MRE with the relationship between MRE and the LEDD after 2 years from the baseline, we created a linear regression model with LEDD as the dependent variable and MRE as the independent variable.
MRI acquisition and preprocessing of diffusion tensor imaging data
Three-dimensional T1-weighted and diffusion-weighted MRI was performed. The T1-weighted images were acquired with the following imaging parameters: sagittal slice thickness, 1.0 mm; over contiguous slices with 50% overlap; echo time (TE) 4.6 ms; repetition time (TR) 9.9 ms; flip angle 8°; slice gap 0 mm; matrix size of 240×240 pixels, reconstructed to 480×480 over a field of view (FOV) of 240 mm. Diffusion MRI was performed using the following parameters: 128×128 acquisition matrix; 1.72×1.72×2 mm3 voxel size; 70 axial slices; 22×22 cm2 field of view; TE 60 ms; TR 7696 ms; flip angle 90°; slice gap 0 mm; and a b-factor of 600 s/mm2. We acquired baseline imaging without weighting and weighted imaging in 45 different directions. All axial sections were acquired parallel to the anterior-posterior commissure line.
For the analysis of diffusion MRI data, we first computed fractional anisotropy (FA) and mean diffusivity (MD) using FMRIB’s Software Library (FSL v4.1.2) (http://www.fmrib.ox.ac.uk/fsl). In detail, the head motion and image distortions induced by eddy currents were corrected using FSL. We adopted the Brainnectome atlas to specify the regions of interest (ROIs) of diffusion MRI scans [31]. The diffusion tensor was calculated with the DTIFIT program in FSL for whole-brain volumes. FA and MD maps were calculated for every voxel. Finally, FA and MD values of each ROI were calculated by the sample mean of voxel-wise FA and MD values. Additionally, we computed degree centrality (DC) from the structural connectivity analysis using probabilistic tractography. Probabilistic tractography algorithm implemented in FSL software was applied to extract the fiber connection in all ROIs [32]. We applied bedpostX and probtrackX tools of FSL on the diffusion data, which allows the modeling of crossing fibers within each voxel, to generate a connectivity distribution [33]. Connectivity analysis is a graph analysis that requires nodes and edges, and we considered 90 ROIs as nodes in a graph [34]. Each edge was defined as fiber probability connecting a pair of regions. We applied a weighted and undirected network model to perform connectivity analysis. The constructed graph is commonly referred to as the structural connectivity matrix as it reflects structural connectivity via white matter fiber tracts. DC was computed as the number of direct connections to all other nodes with respect to a given node to quantify the structural connectivity [34, 35]. Finally, we applied a weighted and undirected network model to perform the connectivity analysis and computed the DC for every participant. To eliminate the confounding effect from variables such as age, sex, and K-MMSE score, we regressed them from the imaging features (FA, MD, and DC).
Correlation analysis between the motor reserve estimate and DTI imaging features
To investigate the relevant brain structures related to MR, we performed a correlation analysis between MRE and imaging features (FA, MD, and DC) of each brain ROI. Age, sex, and clinical parkinsonism were controlled for and multiple comparisons were adjusted with Bonferroni correction. Statistical significance was set at a p-value of 0.05. All statistical analyses were conducted using MATLAB [36].
RESULTS
Clinical and demographic data of enrolled subjects
We enrolled 193 patients with drug-naïve early PD in this study, and all the demographic and clinical data of enrolled participants are illustrated in Table 1. The mean age was 66.2±9.6 years and mean disease duration was 15.6±13.2 months. The mean UPDRS part 3 score was 16.5±10.1 and mean HY stage was 1.6±0.6.
Table 1
Demographics and clinical data of enrolled patients with drug-naïve Parkinson’s disease
| Total (n = 193) | |
| Age, y | 66.2±9.6 |
| Sex (male: female), n (%) | 89: 104 (46.1: 53.9) |
| Disease duration, months | 15.6±13.2 |
| More affected side (left: right), n (%) | 104: 89 (53.9: 46.1) |
| HY stage | 1.6±0.6 |
| UPDRS part 3, total score | 16.5±10.1 |
| Tremor | 2.1±2.1 |
| Rigidity | 2.8±2.4 |
| Bradykinesia | 6.9±4.6 |
| Axial symptom | 4.7±3.9 |
| Dominant symptom side score | |
| Tremor | 1.6±1.6 |
| Rigidity | 1.9±1.5 |
| Bradykinesia | 4.8±2.8 |
| K-MMSE | 27.6±2.5 |
| SNBR, more affected side | |
| Caudate | 5.1±1.6 |
| Putamen | 4.1±1.2 |
| Striatum | 9.2±2.5 |
HY, Hoehn and Yahr; UPDRS, united Parkinson’s disease rating scale; K-MMSE, Korean version of mini-mental status exam; SNBR, specific/non-specific binding ratio. Continuous data were reported using mean±standard deviation format.
Additionally, when we evaluated the correlation between clinical symptoms and DAT uptake, the rigidity and bradykinesia sub-scores of the more affected side were significantly correlated with the SNBR of the more affected putamen (Supplementary Table 1).
Calculation and validation of motor reserve estimate
The general linear model revealed that the DAT uptake in the more affected putamen significantly predicted the severity of motor symptoms (sum of rigidity and bradykinesia score of UPDRS part 3 in the more affected side) as shown in Table 2. The validation of MRE with LEDD after 2 years from the baseline showed that MRE was significantly correlated with LEDD after 2 years (Supplementary Figure 1).
Table 2
General linear model to predict the sum of rigidity and bradykinesia score of the more affected side
| Variable | β | Standard error | p |
| Intercept | 27.18 | 4.6513 | <0.0001 |
| Age | –0.0991 | –0.0307 | 0.0014 |
| Sex | –0.4210 | 0.5398 | 0.0171 |
| Disease duration | 0.0502 | 0.0209 | 0.0171 |
| MMSE | –0.4312 | 0.1213 | 0.0005 |
| SNBR of the more affected putamen | –0.6421 | 0.2243 | 0.0047 |
SNBR, specific/non-specific binding ratio; values in bold indicate a statistically significant difference (p-value <0.05).
Correlation analysis between motor reserve estimate and imaging features
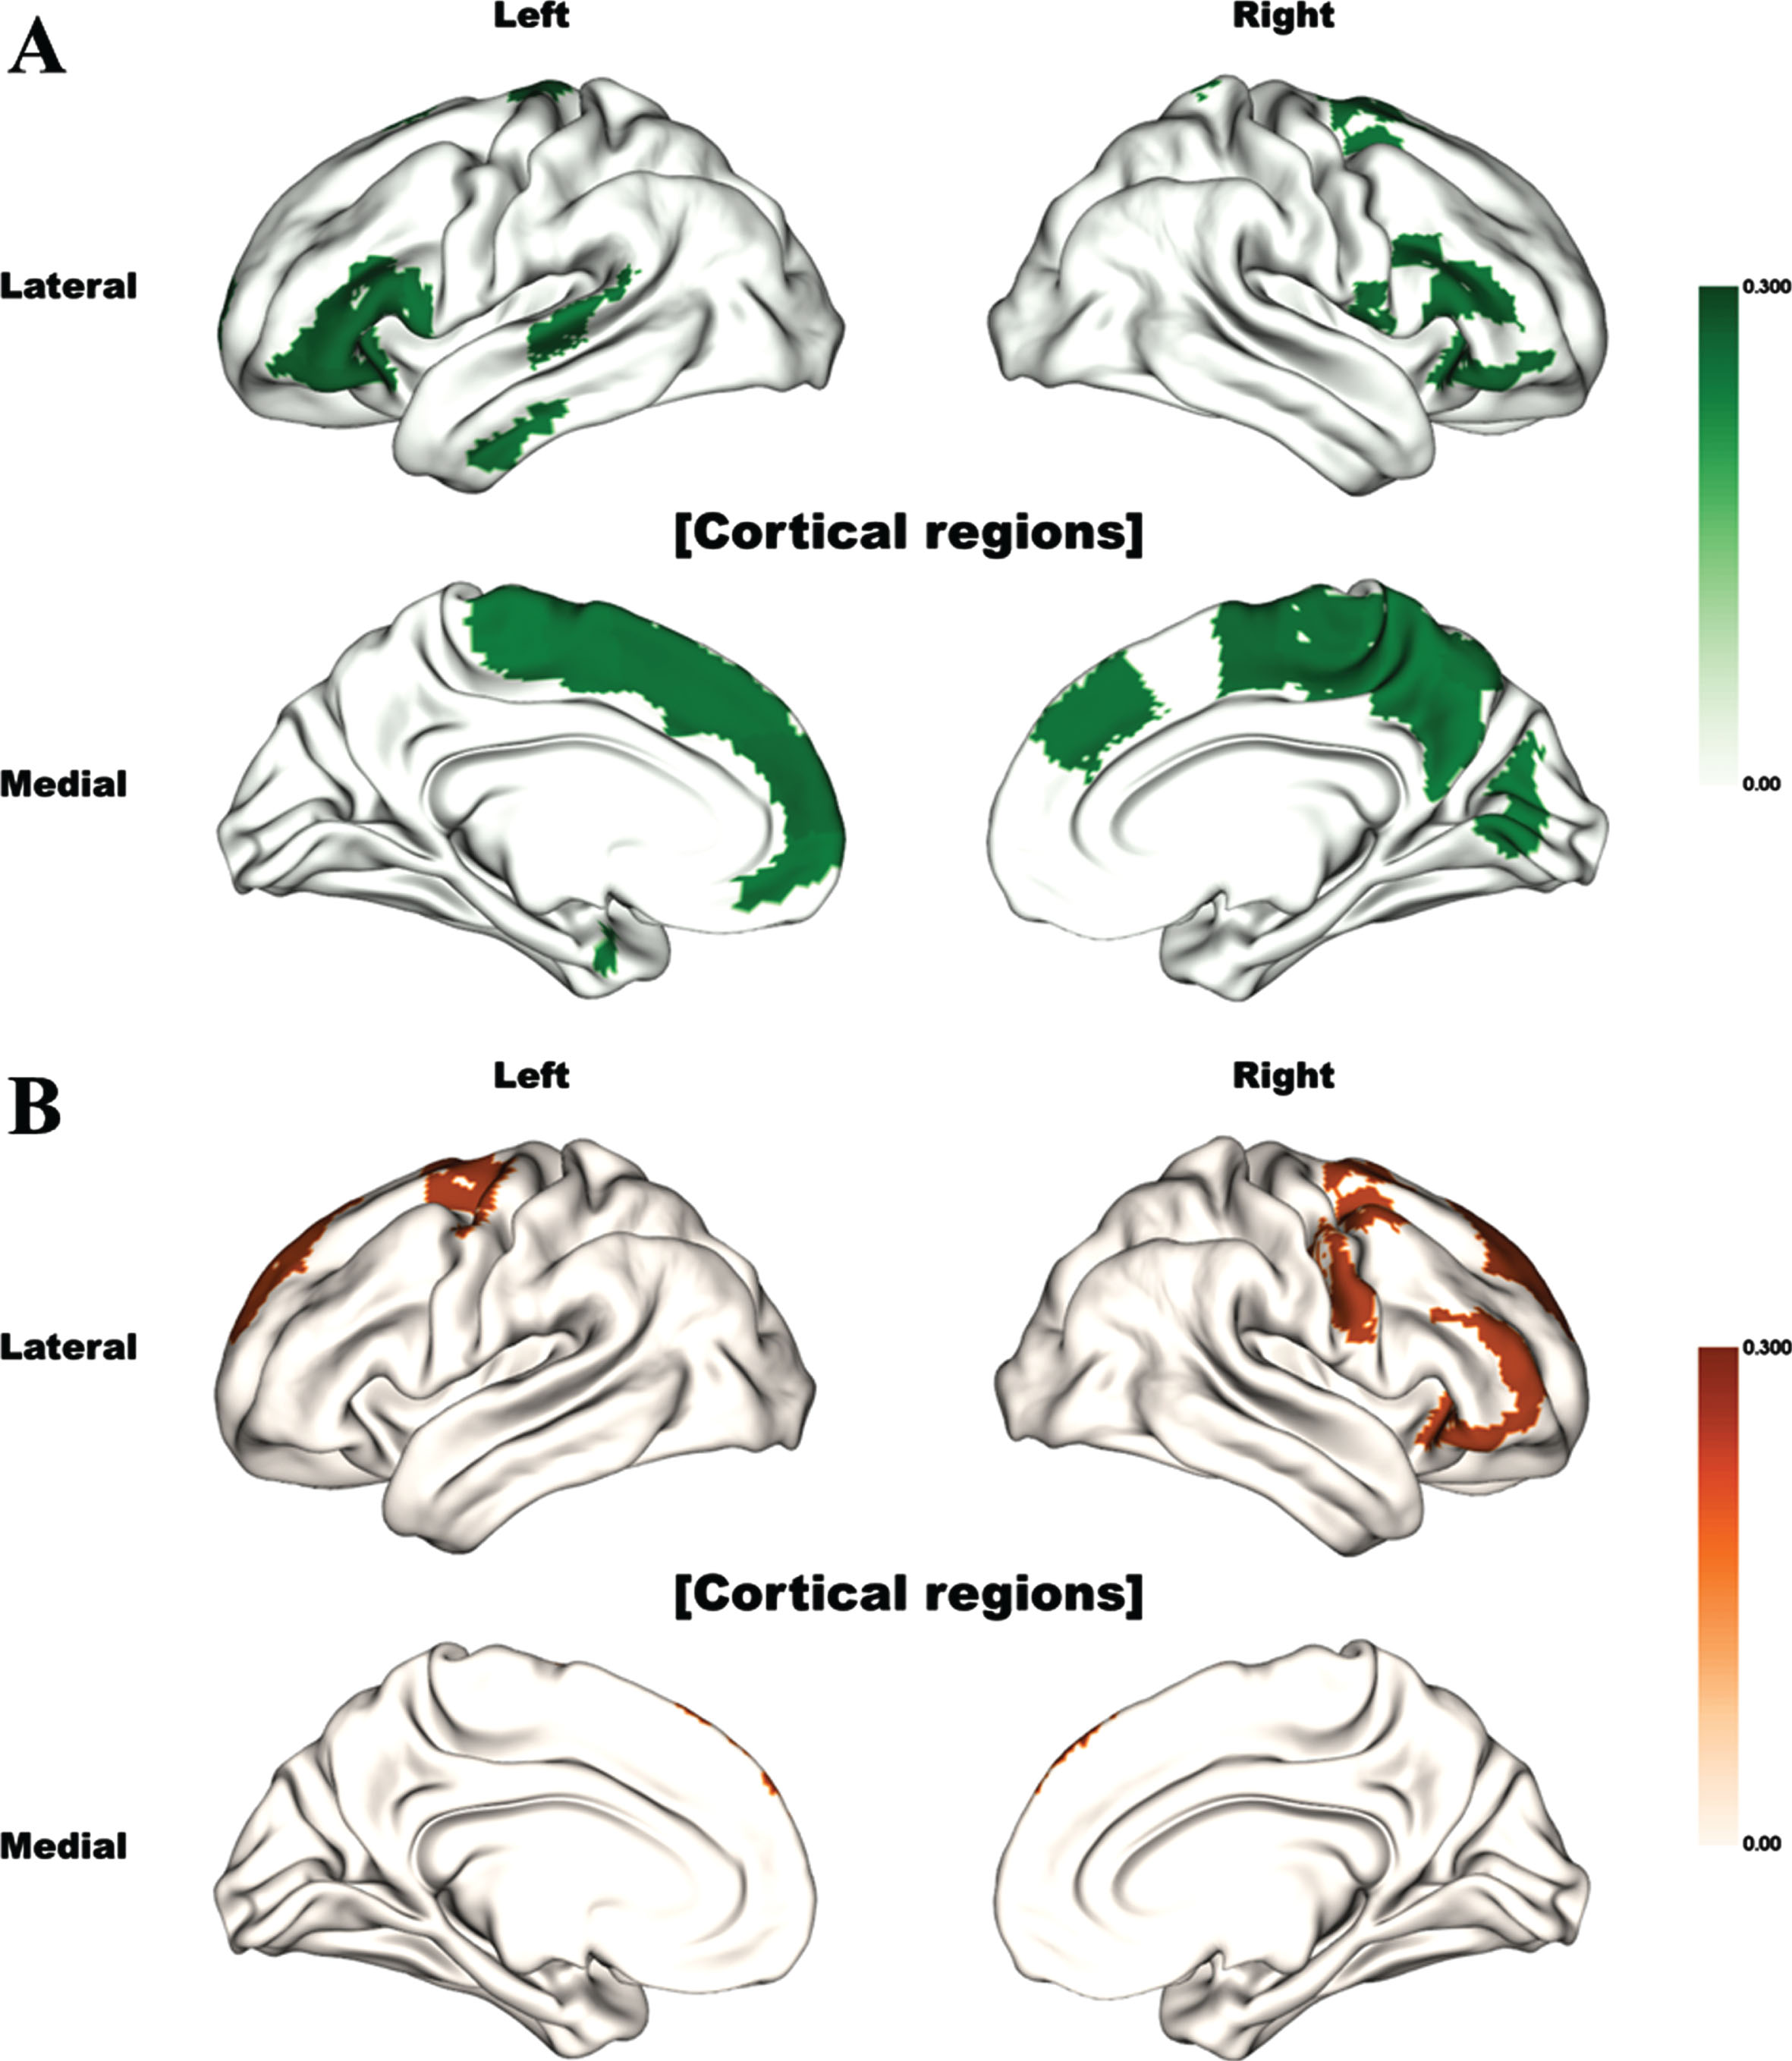
We performed a correlation analysis between the MRE and imaging features from DTI (FA, MD, and DC) of each brain region. All the correlated brain structures are illustrated in Fig. 1 and described in Supplementary Table 2. The MRE was mainly correlated with the FA values of the frontal and temporal lobes, and precuneus. However, no significant association between MD values and MRE was found in any brain region. Additionally, DC derived from the structural connectivity of the frontal lobe structures was also positively correlated with the MR.
Fig. 1
Brain regions significantly correlated with motor reserve estimate (Bonferroni corrected). The color indicates the correlation (rho) value. Significant correlations between motor reserve estimates and (A) fractional anisotropy values and (B) degree centrality values are shown.
DISCUSSION
This is the first study to investigate the correlation of brain structures with motor reserve using DTI, and explain the discrepancy between clinical parkinsonism and dopaminergic degeneration. Previous studies suggested DAT imaging as a predictive marker for clinical parkinsonism in patients with PD [5–8]. Both putamen and caudate are associated with motor symptoms in PD [7], but the decrease of DAT uptake in contralateral putamen is the prominent finding from early PD patients [5]. Accordingly, putamen is more related with motor symptoms compared to caudate especially in early PD patients [8]. We enrolled early stage PD patients and confirmed significant correlations between dopaminergic degeneration in putamen and some parkinsonian symptoms (Supplementary Table 1). However, the severity of DAT uptake and clinical parkinsonism did not always match [10], and the concept of MR was suggested to explain this discrepancy in PD patients [13]. Considering PD is a slowly progressive neurodegenerative disease with a long-standing clinical course even before symptom onset, pathologic changes could lead to structural changes in the brain or connectome dysfunction [37]. Moreover, various factors even from pre-morbid status, such as lifestyle, demographic factors, or genetic background, could affect the severity of clinical parkinsonism [14–17]. Among these changes, some could improve clinical parkinsonism or delay the onset of motor symptoms even with similar dopaminergic depletion. To explain this diverse clinical presentation, a previous study described a “threshold theory” for symptom presentation [10], and others suggested the concept of “motor reserve” based on the discrepancy between the severity of parkinsonism and dopaminergic deficit [14–17]. In accordance with these hypotheses, the MRE calculated in our study successfully predicted LEDD after 2 years from the baseline in our study.
Various aforementioned factors associated with MR could affect the changes in specific brain structures, which in turn might reflect MR. However, only one previous study using functional MRI has demonstrated that diffuse brain structures, including basal ganglia and extra-basal ganglia structures, are associated with MR [18]. Similarly, our results also revealed that diverse cortical structures, mainly the frontal and temporal lobes and precuneus, are associated with MR in patients with PD. Therefore, although basal ganglia pathway is a key structure involved in the neurodegenerative process of PD, extra-basal ganglia structures could play important roles in determining MR.
We found relevant brain structures with MR using FA, MD, and DC and there were different involved brain structures in our results. DC is a connectivity measure reflecting the degree of connectedness for a given brain region with respect to the rest of the brain, whereas FA is a focal measure confined to a given region measuring the degree of anisotropic water diffusion. Therefore, the results using FA and DC could be different with each other, despite the overlaps of brain lesions in FA and DC values. Especially, only frontal lobe regions were detected with analysis of DC, although more regions in temporal lobe and precuneus with analysis of FA. Therefore, both frontal lobe itself and connections with frontal lobe are important in terms of MR in PD based on our results.
In according to our results, basal ganglia have lots of connections with various cortical structures, especially frontal lobe regions, and basal ganglia loops are important in not only motor function (motor loop), but also cognition (associative loop) and emotion (limbic loop). Among these basal ganglia loops, motor loop is primarily involved in PD, especially in early stage [38], and associative and limbic loops might compensate the dysfunction of motor loop in PD [39]. Interestingly, most relevant cortical structures were detected in frontal and temporal lobes in our study, and these cortical structures are mainly involved in associative/cognitive basal ganglia loops. Cognition is already reported to be related with motor reserve in PD as our results [14, 40], and MMSE score was also related with motor reserve in our study. Additionally, precuneus is an important structure, especially for the cognition in PD [41, 42], and a structure more involved in PD patients with more severe motor and cognitive symptoms [43]. In this study, we controlled MMSE score when we evaluated MRE and found precuneus was associated with MR.
Frontal lobe is the cortical area which undergoes thinning with initial disease progression in patients with PD [44], thus its role beginning from the early stage of PD would be important. In addition, the frontal lobe structures were associated with dyskinesia and falling, which are important markers of PD progression [45, 46]. Moreover, various non-motor symptoms, including cognitive decline, depression, or apathy, were also connected to the frontal lobe in patients with PD [47–49]. Basal ganglia structures, which are directly connected with the substantia nigra, are vulnerable to the pathologic changes in patients with PD, and the fronto-striatal connectivity is also affected with disease progression [50]. Such an abnormality in the fronto-striatal connectivity has already been reported in the non-tremor PD phenotype, which is associated with poor prognosis and more pathologic involvement in patients with PD [33]. Based on the previous results, the changes in frontal lobe are associated with motor and non-motor parkinsonian symptoms from the early to advanced stage. Combining these findings with our results, the frontal lobe is a structure associated with MR or higher threshold in patients with PD.
Aside from the frontal lobe structures, various non-motor symptoms are also related to the temporal lobe structures [49, 51]. The temporal cortex undergoes thinning with PD progression following that in the frontal cortex [44]. A previous functional MRI study also showed a similar correlation between the limbic and frontal lobe structures [18]. In addition, limbic structures were also involved in the basal ganglia circuits that help to compensate for the damaged basal ganglia motor circuit in PD. Similarly, precuneus was also reported to be connected to basal ganglia and motor control [52]. Additionally, the fronto-parietal network is associated with clinical symptoms and treatment in PD [53, 54]. Therefore, all the changes in the aforementioned structures would be reflected as MR which may compensate for parkinsonism resulting from dopaminergic degeneration in patients with PD.
Our study has several strengths. First, we recruited a relatively large-sized sample of patients with drug-naïve PD to investigate relevant brain structures with motor reserve. Second, our results showed significant correlations of SNBR of putamen or striatum with contralateral rigidity and bradykinesia, consistent with previous studies [7, 8]. This indicates that our results could sufficiently represent the motor reserve in patients with PD. Third, we enrolled only drug-naïve PD patients to eliminate possible confounding effects from dopaminergic medications. Moreover, bradykinesia and rigidity are well-responsive motor symptoms to dopaminergic medications [55], and the response to levodopa is also reported to be associated with PD progression [56]. Therefore, by eliminating the confounding effect of dopaminergic medications we could identify the “exact” severity of clinical parkinsonism in patients with PD.
However, our study also has some limitations. First, since ours was a cross-sectional and not a cohort study, it is difficult to understand whether the suggested brain structures underwent adaptive changes to neurodegeneration or pre-morbid changes related to MR. Therefore, we used the term “motor reserve” rather than “compensation”, because the latter term would be appropriate only for post-morbid adaptive changes from pathologic involvements. To understand the exact mechanism for the structural changes in our results, further studies recruiting a large-sized sample with pre-morbid status and longer follow-up period is required. Second, even though diverse neurotransmitters could be involved in PD patients, we evaluated only dopaminergic degeneration in our study. However, dopaminergic degeneration is a hallmark of PD pathology, and we defined clinical parkinsonism with bradykinesia and rigidity which were significantly correlated with DAT imaging results in the present and previous studies [7, 8]. Further, most motor symptoms result from the involvement of dopaminergic system, and respond well to the dopaminergic medications.
In conclusion, MRE successfully predicted progression in patients with drug-naïve PD in the present study. On our results suggest that various extra-basal ganglia structures are related to MR in patients with PD. We hope the brain structures revealed by our findings will be targets for future treatment options for patients with PD.
ACKNOWLEDGMENTS
This research was supported by the National Research Foundation (NRF-2020M3E5D2A01084892), Institute for Basic Science (IBS-R015-D1), Ministry of Science and ICT (IITP-2021-2018-0-01798), IITP grant funded by the AI Graduate School Support Program (2019-0-00421), ICT Creative Consilience program (IITP-2020-0-01821), and the Artificial Intelligence Innovation Hub program (2021-0-02068).
CONFLICT OF INTEREST
JY declared speaker’s honoraria from SK chemicals, Myung-in Pharm, Esai, Medtronic and Boston Scientific. JHW, MK, JK, SHM, MK, JHA, JKM, HP, and JWC have nothing to declare.
SUPPLEMENTARY MATERIAL
[1] The supplementary material is available in the electronic version of this article: https://dx.doi.org/10.3233/JPD-223542.
REFERENCES
[1] | Kalia LV , Kalia SK , Lang AE ((2015) ) Disease-modifying strategies for Parkinson’s disease. Mov Disord 30: , 1442–1450. |
[2] | Nutt JG , Wooten GF ((2005) ) Clinical practice. Diagnosis and initial management of Parkinson’s disease. N Engl J Med 353: , 1021–1027. |
[3] | Ravina B , Eidelberg D , Ahlskog JE , Albin RL , Brooks DJ , Carbon M , Dhawan V , Feigin A , Fahn S , Guttman M , Gwinn-Hardy K , McFarland H , Innis R , Katz RG , Kieburtz K , Kish SJ , Lange N , Langston JW , Marek K , Morin L , Moy C , Murphy D , Oertel WH , Oliver G , Palesch Y , Powers W , Seibyl J , Sethi KD , Shults CW , Sheehy P , Stoessl AJ , Holloway R ((2005) ) The role of radiotracer imaging in Parkinson disease. Neurology 64: , 208–215. |
[4] | de la Fuente-Fernandez R ((2012) ) Role of DaTSCAN and clinical diagnosis in Parkinson disease. Neurology 78: , 696–701. |
[5] | Wang J , Zuo CT , Jiang YP , Guan YH , Chen ZP , Xiang JD , Yang LQ , Ding ZT , Wu JJ , Su HL ((2007) ) 18F-FP-CIT PET imaging and SPM analysis of dopamine transporters in Parkinson’s disease in various Hoehn & Yahr stages. J Neurol 254: , 185–190. |
[6] | Hong JY , Oh JS , Lee I , Sunwoo MK , Ham JH , Lee JE , Sohn YH , Kim JS , Lee PH ((2014) ) Presynaptic dopamine depletion predicts levodopa-induced dyskinesia in de novo Parkinson disease. Neurology 82: , 1597–1604. |
[7] | Pirker W ((2003) ) Correlation of dopamine transporter imaging with parkinsonian motor handicap: How close is it? Mov Disord 18: (Suppl 7), S43–S51. |
[8] | Djaldetti R , Treves TA , Ziv I , Melamed E , Lampl Y , Lorberboym M ((2009) ) Use of a single [123I]-FP-CIT SPECT to predict the severity of clinical symptoms of Parkinson disease. Neurol Sci 30: , 301–305. |
[9] | Kuribara T , Enatsu R , Kitagawa M , Arihara M , Sasagawa A , Hirano T , Suzuki H , Yokoyama R , Mikami T , Mikuni N ((2020) ) Neuroimaging and neurophysiological evaluation of severity of Parkinson’s disease. J Clin Neurosci 74: , 135–140. |
[10] | Engelender S , Isacson O ((2017) ) The threshold theory for Parkinson’s disease. Trends Neurosci 40: , 4–14. |
[11] | Vogt T , Kramer K , Gartenschlaeger M , Schreckenberger M ((2011) ) Estimation of further disease progression of Parkinson’s disease by dopamin transporter scan vs clinical rating. Parkinsonism Relat Disord 17: , 459–463. |
[12] | Hubbuch M , Farmakis G , Schaefer A , Behnke S , Schneider S , Hellwig D , Fassbender K , Kirsch CM , Dillmann U , Spiegel J ((2011) ) FP-CIT SPECT does not predict the progression of motor symptoms in Parkinson’s disease. Eur Neurol 65: , 187–192. |
[13] | Chung SJ , Yoo HS , Lee YH , Lee HS , Lee PH , Sohn YH ((2020) ) Initial motor reserve and long-term prognosis in Parkinson’s disease. Neurobiol Aging 92: , 1–6. |
[14] | Sunwoo MK , Hong JY , Lee JJ , Lee PH , Sohn YH ((2016) ) Does education modify motor compensation in Parkinson’s disease? J Neurol Sci 362: , 118–120. |
[15] | Sunwoo MK , Lee JE , Hong JY , Ye BS , Lee HS , Oh JS , Kim JS , Lee PH , Sohn YH ((2017) ) Premorbid exercise engagement and motor reserve in Parkinson’s disease. Parkinsonism Relat Disord 34: , 49–53. |
[16] | Lee Y , Oh JS , Chung SJ , Lee JJ , Chung SJ , Moon H , Lee PH , Kim JS , Sohn YH ((2018) ) The presence of depression in de novo Parkinson’s disease reflects poor motor compensation. PLoS One 13: , e0203303. |
[17] | Lee Y , Oh JS , Chung SJ , Chung SJ , Kim SJ , Nam CM , Lee PH , Kim JS , Sohn YH ((2017) ) Does smoking impact dopamine neuronal loss in de novo Parkinson disease? Ann Neurol 82: , 850–854. |
[18] | Chung SJ , Kim HR , Jung JH , Lee PH , Jeong Y , Sohn YH ((2020) ) Identifying the functional brain network of motor reserve in early Parkinson’s disease. Mov Disord 35: , 577–586. |
[19] | Alexander AL , Lee JE , Lazar M , Field AS ((2007) ) Diffusion tensor imaging of the brain. Neurotherapeutics 4: , 316–329. |
[20] | Brooks DJ ((2008) ) Technology insight: Imaging neurodegeneration in Parkinson’s disease. Nat Clin Pract Neurol 4: , 267–277. |
[21] | Jankovic J , McDermott M , Carter J , Gauthier S , Goetz C , Golbe L , Huber S , Koller W , Olanow C , Shoulson I , et al. ((1990) ) Variable expression of Parkinson’s disease: A base-line analysis of the DATATOP cohort. The Parkinson Study Group. Neurology 40: , 1529–1534. |
[22] | Na BS , Ha J , Park JH , Ahn JH , Kim M , Kim JS , Kim HT , Cho JW , Youn J ((2019) ) Comparison of gait parameters between drug-naive patients diagnosed with multiple system atrophy with predominant parkinsonism and Parkinson’s disease. Parkinsonism Relat Disord 60: , 87–91. |
[23] | Wahlund LO , Barkhof F , Fazekas F , Bronge L , Augustin M , Sjogren M , Wallin A , Ader H , Leys D , Pantoni L , Pasquier F , Erkinjuntti T , Scheltens P , European Task Force on Age-Related White Matter Changes ((2001) ) A new rating scale for age-related white matter changes applicable to MRI and CT. Stroke 32: , 1318–1322. |
[24] | Hoehn MM , Yahr MD ((1998) ) Parkinsonism: Onset, progression, and mortality. 1967. Neurology 50: , 318 and 316 pages following. |
[25] | Diederich NJ , Moore CG , Leurgans SE , Chmura TA , Goetz CG ((2003) ) Parkinson disease with old-age onset: A comparative study with subjects with middle-age onset. Arch Neurol 60: , 529–533. |
[26] | Lee JY , Dong Woo L , Cho SJ , Na DL , Hong Jin J , Kim SK , You Ra L , Youn JH , Kwon M , Lee JH , Maeng Je C ((2008) ) Brief screening for mild cognitive impairment in elderly outpatient clinic: Validation of the Korean version of the Montreal Cognitive Assessment. J Geriatr Psychiatry Neurol 21: , 104–110. |
[27] | Jo SA , Park MH , Jo I , Ryu SH , Han C ((2007) ) Usefulness of Beck Depression Inventory (BDI) in the Korean elderly population. Int J Geriatr Psychiatry 22: , 218–223. |
[28] | Fischl B ((2012) ) FreeSurfer. Neuroimage 62: , 774–781. |
[29] | Thomas BA , Cuplov V , Bousse A , Mendes A , Thielemans K , Hutton BF , Erlandsson K ((2016) ) PETPVC: A toolbox for performing partial volume correction techniques in positron emission tomography. Phys Med Biol 61: , 7975–7993. |
[30] | Izquierdo-Garcia D , Hansen AE , Forster S , Benoit D , Schachoff S , Furst S , Chen KT , Chonde DB , Catana C ((2014) ) An SPM8-based approach for attenuation correction combining segmentation and nonrigid template formation: Application to simultaneous PET/MR brain imaging. J Nucl Med 55: , 1825–1830. |
[31] | Fan L , Li H , Zhuo J , Zhang Y , Wang J , Chen L , Yang Z , Chu C , Xie S , Laird AR , Fox PT , Eickhoff SB , Yu C , Jiang T ((2016) ) The Human Brainnetome Atlas: A new brain atlas based on connectional architecture. Cereb Cortex 26: , 3508–3526. |
[32] | Wang R BT , Sorensen AG , Wedeen VJ ((2007) ) Diffusion toolkit: A software package for diffusion imaging data processing and tractography. Proc Intl Soc Mag Reson Med 15: , 3720. |
[33] | Barbagallo G , Caligiuri ME , Arabia G , Cherubini A , Lupo A , Nistico R , Salsone M , Novellino F , Morelli M , Cascini GL , Galea D , Quattrone A ((2017) ) Structural connectivity differences in motor network between tremor-dominant and nontremor Parkinson’s disease. Hum Brain Mapp 38: , 4716–4729. |
[34] | Bullmore E , Sporns O ((2009) ) Complex brain networks: Graph theoretical analysis of structural and functional systems. Nat Rev Neurosci 10: , 186–198. |
[35] | Rubinov M , Sporns O ((2010) ) Complex network measures of brain connectivity: Uses and interpretations. Neuroimage 52: , 1059–1069. |
[36] | (1998) MATLAB Guide. The MathWorks, Inc. Natick, MA. |
[37] | Bellucci A , Mercuri NB , Venneri A , Faustini G , Longhena F , Pizzi M , Missale C , Spano P ((2016) ) Review: Parkinson’s disease: From synaptic loss to connectome dysfunction. Neuropathol Appl Neurobiol 42: , 77–94. |
[38] | Galvan A , Devergnas A , Wichmann T ((2015) ) Alterations in neuronal activity in basal ganglia-thalamocortical circuits in the parkinsonian state. Front Neuroanat 9: , 5. |
[39] | Mi TM , Zhang W , Li Y , Liu AP , Ren ZL , Chan P ((2021) ) Altered functional segregated sensorimotor, associative, and limbic cortical-striatal connections in Parkinson’s disease: An fMRI investigation. Front Neurol 12: , 720293. |
[40] | Chung SJ , Kim YJ , Kim YJ , Lee HS , Yun M , Lee PH , Jeong Y , Sohn YH ((2022) ) Potential link between cognition and motor reserve in patients with Parkinson’s disease. J Mov Disord 15: , 249–257. |
[41] | Brandao PRP , Munhoz RP , Grippe TC , Cardoso FEC , de Almeida ECBM , Titze-de-Almeida R , Tomaz C , Tavares MCH ((2020) ) Cognitive impairment in Parkinson’s disease: A clinical and pathophysiological overview. J Neurol Sci 419: , 117177. |
[42] | Jia X , Li Y , Li K , Liang P , Fu X ((2018) ) Precuneus dysfunction in Parkinson’s disease with mild cognitive impairment. Front Aging Neurosci 10: , 427. |
[43] | Uribe C , Segura B , Baggio HC , Abos A , Garcia-Diaz AI , Campabadal A , Marti MJ , Valldeoriola F , Compta Y , Tolosa E , Junque C ((2018) ) Cortical atrophy patterns in early Parkinson’s disease patients using hierarchical cluster analysis. Parkinsonism Relat Disord 50: , 3–9. |
[44] | Wilson H , Niccolini F , Pellicano C , Politis M ((2019) ) Cortical thinning across Parkinson’s disease stages and clinical correlates. J Neurol Sci 398: , 31–38. |
[45] | Yoo HS , Chung SJ , Lee YH , Lee HS , Ye BS , Sohn YH , Lee PH ((2019) ) Levodopa-induced dyskinesia is closely linked to progression of frontal dysfunction in PD. Neurology 92: , e1468–e1478. |
[46] | Lindholm B , Eek F , Skogar O , Hansson EE ((2019) ) Dyskinesia and FAB score predict future falling in Parkinson’s disease. Acta Neurol Scand 139: , 512–518. |
[47] | Sanchez-Dinorin G , Rodriguez-Violante M , Cervantes-Arriaga A , Navarro-Roa C , Ricardo-Garcell J , Rodriguez-Camacho M , Solis-Vivanco R ((2021) ) Frontal functional connectivity and disease duration interactively predict cognitive decline in Parkinson’s disease. Clin Neurophysiol 132: , 510–519. |
[48] | Chaudhary S , Kumaran SS , Goyal V , Kalaivani M , Kaloiya GS , Sagar R , Mehta N , Srivastava AK , Jagannathan NR ((2021) ) Frontal lobe metabolic alterations characterizing Parkinson’s disease cognitive impairment. Neurol Sci 42: , 1053–1064. |
[49] | Wen MC , Chan LL , Tan LC , Tan EK ((2016) ) Depression, anxiety, and apathy in Parkinson’s disease: Insights from neuroimaging studies. Eur J Neurol 23: , 1001–1019. |
[50] | Lanciego JL , Luquin N , Obeso JA ((2012) ) Functional neuroanatomy of the basal ganglia. Cold Spring Harb Perspect Med 2: , a009621. |
[51] | Zhang L , Wang M , Sterling NW , Lee EY , Eslinger PJ , Wagner D , Du G , Lewis MM , Truong Y , Bowman FD , Huang X ((2018) ) Cortical thinning and cognitive impairment in Parkinson’s disease without dementia. IEEE/ACM Trans Comput Biol Bioinform 15: , 570–580. |
[52] | Lehericy S , Bardinet E , Tremblay L , Van de Moortele PF , Pochon JB , Dormont D , Kim DS , Yelnik J , Ugurbil K ((2006) ) Motor control in basal ganglia circuits using fMRI and brain atlas approaches. Cereb Cortex 16: , 149–161. |
[53] | Liu Q , Shi Z , Wang K , Liu T , Funahashi S , Wu J , Zhang J ((2022) ) Treatment enhances betweenness centrality of fronto-parietal network in Parkinson’s patients. Front Comput Neurosci 16: , 891384. |
[54] | Diez-Cirarda M , Ojeda N , Pena J , Cabrera-Zubizarreta A , Gomez-Beldarrain MA , Gomez-Esteban JC , Ibarretxe-Bilbao N ((2015) ) Neuroanatomical correlates of theory of mind deficit in Parkinson’s disease: A multimodal imaging study. PLoS One 10: , e0142234. |
[55] | Salat D , Tolosa E ((2013) ) Levodopa in the treatment of Parkinson’s disease: Current status and new developments. J Parkinsons Dis 3: , 255–269. |
[56] | Malek N , Kanavou S , Lawton MA , Pitz V , Grosset KA , Bajaj N , Barker RA , Ben-Shlomo Y , Burn DJ , Foltynie T , Hardy J , Williams NM , Wood N , Morris HR , Grosset DG , PRoBaND clinical consortium ((2019) ) L-dopa responsiveness in early Parkinson’s disease is associated with the rate of motor progression. Parkinsonism Relat Disord 65: , 55–61. |


