
Neurofilament Light Protein Predicts Disease Progression in Idiopathic REM Sleep Behavior Disorder
Abstract
Background:
Idiopathic rapid eye movement sleep behavior disorder (iRBD) is increasingly recognized as a manifestation preceding the α-synucleinopathies like Parkinson’s disease (PD). Neurofilament light chain (NfL) have been reported to be higher in synucleinopathies as a sign of neurodegeneration.
Objective:
To evaluate whether plasma NfL is valuable in reflecting cognitive and motor status in iRBD and PD with a premorbid history of RBD (PDRBD), and predicting disease progression in iRBD.
Methods:
Thirty-one patients with iRBD, 30 with PDRBD, and 18 healthy controls were included in the cross-sectional and prospective study. Another cohort from the Parkinson’s Progression Markers Initiative (PPMI) dataset was enrolled for verification analysis. All patients received evaluations of cognitive, motor, and autonomic function by a battery of clinical tests at baseline and follow-up. Blood NfL was measured by the Quanterix Simoa HD-1.
Results:
In our cohort, 26 patients with iRBD completed the follow-up evaluations, among whom eight (30.8%) patients displayed phenoconversion. Baseline plasma NfL cutoff value of 22.93 pg/mL performed best in distinguishing the iRBD converters from non-converters (sensitivity: 75.0%, specificity: 83.3%, area under the curve: 0.84). Cognitive and motor function were significantly correlated with NfL levels in PDRBD (correlation coefficients: –0.379, 0.399; respectively). Higher baseline NfL levels in iRBD were significantly associated with higher risks for cognitive, motor, autonomic function progression, and phenoconversion at follow-up (hazard ratios: 1.069, 1.065, 1.170, 1.065; respectively). The findings were supported by the PPMI dataset.
Conclusion:
Plasma NfL is valuable in reflecting disease severity of PDRBD and predicting disease progression and phenoconversion in iRBD.
INTRODUCTION
Rapid eye movement (REM) sleep behavior disorder (RBD) is characterized by dream-enactment behaviors during REM sleep due to the loss of physiological muscle atonia [1]. Idiopathic RBD (iRBD) is not merely a parasomnia but also precedes the development of α-synucleinopathies, such as Parkinson’s disease (PD), PD dementia, dementia with Lewy bodies (DLB), and multiple system atrophy (MSA) [2]. The conversion rate of iRBD to neurodegenerative diseases is 33.5% at 5 years, 82.4% at 10.5 years, and 96.6% at 14 years [3], representing a huge opportunity for potential neuroprotective therapies. 43% iRBD patients would eventually convert to PD, and 25% to DLB [3]. Therefore, an easily accessible biomarker that can identify iRBD with a high risk of rapid phenoconversion is needed to improve the prediction of individual disease progression.
Neurofilament light chain (NfL) is a neuronal cytoskeletal protein highly expressed in large-caliber myelinated axons that is released into the cerebrospinal fluid (CSF) upon neuronal damage or neurodegeneration [4]. Considering that the correlation coefficients are as high as 0.86 to 0.94 between CSF and plasma/serum NfL, plasma NfL is supposed to be an easily accessible candidate biomarker for assessing the extent of neurodegeneration [5]. Recently, neurofilament light protein has been extensively studied in multiple sclerosis [6, 7], inherited peripheral neuropathy [8], amyotrophic lateral sclerosis [9, 10], and neurodegenerative diseases [11], such as Alzheimer’s disease dementia [12, 13] and frontotemporal dementia [14]. However, it remains controversial whether blood NfL levels in patients with PD are higher than those in healthy controls [15–18], possibly due to the varieties in age, clinical diagnosis accuracy, proportion of combining with RBD, disease duration, and Hoehn and Yahr score of the patients in different studies. Blood NfL levels were found to be significantly higher in MSA and other atypical parkinsonism syndromes (APS) compared to PD, which can discriminate APS from PD with high accuracy [16–18]. Few studies were reported about NfL levels in PD with RBD, which represents a more severe subtype of PD. Moreover, to the best of our knowledge, only one study has measured the plasma NfL levels in probable iRBD, but no difference was found in plasma NfL levels between patients with probable iRBD and healthy controls [19]. Microstructural changes in the white matter have been reported in iRBD [20–22], which may closely correlate with to NfL changes. However, data on plasma NfL in video-polysomnography (v-PSG) confirmed iRBD are lacking, and it is unknown whether plasma NfL is valuable in reflecting cognitive and motor status or predicting disease progression in iRBD. Based on the above, we hypothesized that iRBD patients with higher plasma NfL levels would be more likely to suffer from function deterioration during follow-up. Plasma NfL may be an easily accessible candidate biomarker for predicting disease conversion in patients with iRBD. Therefore, this study aimed to 1) compare plasma NfL levels among iRBD patients, PD patients with a premorbid history of RBD (PDRBD), and healthy controls measured by the Quanterix Simoa HD-1; 2) measure whether an baseline plasma NfL cutoff point could distinguish iRBD converters from non-converters in the near future; 3) examine the correlations between plasma NfL levels and cognitive as well as motor function in iRBD and PDRBD; and 4) explore whether plasma NfL levels were correlated with cognitive, motor, and autonomic function progression in iRBD.
METHODS
Participants
Thirty-one patients with iRBD were enrolled at baseline from Tianjin Medical University General Hospital. Overnight v-PSG (Nicolet v32) was conducted in the patients with iRBD at a digital sleep laboratory. iRBD was diagnosed according to the criteria in the International Classification of Sleep Disorders-3 [23]. Clinical interview and neurological examination were conducted in the patients with iRBD to make sure that they had normal pressure changes from the supine to standing position and did not meet the clinical diagnosis of neurodegenerative diseases at baseline. PD was diagnosed according to Movement Disorder Society Clinical Diagnostic Criteria for PD [24]. PDRBD was identified in patients who had typical self-reported dream enactment behavior before the diagnosis of PD. The exclusion criteria include 1) age more than 79 years and 2) history of stroke, epilepsy, encephalitis, or any other neurologic disorders, psychiatric disorders, head trauma, unstable hypertension or diabetes, chronic obstructive pulmonary disease. Fifty-three patients with PD were screened, 23 were excluded since they did not have dream enactment behavior before the diagnosis of PD, and 30 patients with PDRBD were finally enrolled. The demographic information and plasma of 59 healthy individuals aged from 50 to 79 years without neuropsychiatric diseases history were collected from the hospital medical examination center. Of those, 18 age- and gender-matched healthy individuals were enrolled as the controls of the patients with iRBD and PDRBD in the comparison of plasma NfL. This study employed a cross-sectional and prospective design. Twenty-six patients with iRBD completed the follow-up evaluations of cognitive, motor, and autonomic function. Due to the limited sample, 32 patients with iRBD, 80 PDRBD, and 83 healthy controls with complete demographic, clinical information, and serum NfL from the Parkinson’s Progression Markers Initiative (PPMI) dataset (https://www.ppmi-info.org/access-data-specimens/download-data) [25] were included for verification analysis.
This study was approved by the Ethics Committee at the Tianjin Medical University General Hospital. All participants provided informed consent forms.
Clinical evaluation
Clinical evaluations, including RBD symptoms, mood, and cognitive, motor, and autonomic function, were performed by trained neurologists in a quiet environment. The severity of RBD symptoms were evaluated by the Rapid Eye Movement Sleep Behavior Disorder Questionnaire–Hong Kong (RBDQ-HK). Anxiety and depression were assessed by Hamilton’s Anxiety and Depression Scales. The cognitive evaluations include 1) general cognitive function: Mini-Mental State Examination (MMSE) [26]; 2) visuospatial function: Rey-Osterrieth Complex Figure Test (ROCF) [27] and Clock Drawing Test (CDT) [28]; 3) memory function: Auditory Verbal Learning Test (AVLT) [29] and ROCF delayed recall tests; and 4) attention-executive function: Stroop Color-Word Test (modified version) (Stroop A, Stroop B, Stroop C), Symbol Digit Modality Test (SDMT) [30], and Trail Making Test (TMT) A, TMT B [31]. The motor function tests include 1) Movement Disorder Society revised Unified Parkinson’s Disease Rating Scale part III (MDS UPDRS-III) [32]; 2) Alternate-tap Test [33]; and 3) three-meter Timed Up and Go test [33]. The autonomic function was evaluated by the Scales for Outcomes in Parkinson’s disease-autonomic (SCOPA-AUT) Questionnaire [34] and pressure changes from the supine to standing position over 3 minutes.
Follow-up plan
Specifically, patients with iRBD were interviewed by telephone every three months. Face-to-face interviews, including neurological examination and clinical tests, were conducted every six months or whenever they reported complaints of cognitive, motor, or autonomic function. The face-to-face interview lasted for at least two years from baseline, and it would be terminated once a neurodegenerative disease was diagnosed within two years.
Diagnostic criteria for disease progression
Cognitive, motor, and autonomic function progression were assessed by the changes in MMSE score, UPDRS part III motor score, and pressure in the supine and standing positions combined with the reported decline in cognitive and motor function and postural dizziness by the subjects themselves or their caregivers during the follow-up period. In detail, cognitive function progression was defined as a sustained decrease of at least two points in the MMSE scores during follow-up [35] as well as complaints of worse cognitive function than before. Motor function progression was defined as a sustained increase of at least two points in the UPDRS part III scores [35] as well as complaints of slower movement than before. Autonomic function progression was defined as systolic pressure drop of at least 30 mmHg from the supine to standing position and complaints of postural dizziness. General disease progression of iRBD was defined as any progression in cognitive, motor, or autonomic function as described above. Phenoconversion was defined when patients with iRBD meet the clinical diagnostic criteria of PD [24], DLB [36], or MSA [37] at follow-up.
Plasma collection and measurement of NfL
Peripheral venous blood samples were obtained from the participants into EDTA tubes at the first clinical evaluation. Samples were centrifuged for 3000×g, 5 min, and stored in cryotubes at –80°C before detection. Plasma NfL was measured in duplicate using an ultrahigh sensitivity protein molecular detection instrument (Simoa HD-1, Quanterix, MA, USA) and a Simoa NfL reagent kit (502153, Quanterix, MA, USA), as previously described by Chen [38], and the mean of the duplicate values was taken as the final read out.
Statistical analysis
The statistical analyses were performed using SPSS 23.0 (SPSS Inc. Chicago, IL, USA). Numerical variables were expressed as the mean±standard deviation or median (interquartile ranges) according to whether they followed a normal distribution. The normality of the data distribution was evaluated with the Shapiro–Wilk test. The differences in gender distribution among the three groups were explored using the Chi-square test. For variables that meet the assumptions of normality and homoscedasticity, the groups were compared with two-sample independent t-test (for two groups) and One way ANOVA test (for three groups). The nonparametric Mann–Whitney U test (for two groups) and Kruskal–Wallis test (for three groups) were applied to compared the variables that violated a normal distribution or homoscedasticity. For multiple-comparison analyses, the statistical significance value was adjusted by Bonferroni correction. Considering the limited sample size, the post-hoc power analyses were performed using G*power to calculate the power (1-β) for the comparison tests on NfL levels by given α (0.05), current sample size and effect size. In addition, the exploratory analyses including correlation and regression analyses were performed. In detail, NfL levels were log10-transformed for correlation and linear regression analyses. Correlations among variables were assessed by Pearson or Spearman coefficients according to whether they followed a normal distribution. The correlations between plasma NfL levels and cognitive as well as motor function were assessed by the multiple linear regression analyses adjusted for confounding factors. The correlation between plasma NfL levels and disease progression during the follow-up period was assessed by the multivariate Cox regression analyses.
Receiver operating characteristic (ROC) curve analyses were applied to assess the diagnostic value of plasma NfL levels. The maximum value of the Youden J index (sensitivity+specificity - 1.0) was used as a criterion for selecting the optimal NfL cutoff value. Kaplan–Meier curves were applied to compare the cumulative probability risk of disease progression and phenoconversion between iRBD patients with NfL levels above and below the cutoff value. Statistical differences in the Kaplan–Meier curves between the groups were determined by the log-rank test.
RESULTS
Demographic and clinical characteristics of the participants
The demographic and clinical characteristics of the participants from our cohort and the PPMI dataset were presented in Tables 1 and 2, respectively. No significant difference was found in age and gender among the three groups.
Table 1
Clinical characteristics and plasma NfL levels of participants at baseline
| Characteristics | HC (n = 18) | iRBD (n = 31) | PDRBD (n = 30) | p |
| Age, y | 65.22±6.20 | 65.77±4.38 | 67.30±4.54 | 0.298 |
| Male, % | 9 (50.00%) | 21 (67.74%) | 18 (60.00%) | 0.469 |
| Disease duration of RBD, y | NA | 4.97±4.15 | NA | NA |
| Disease duration of PD, y | NA | NA | 3.53±3.70 | NA |
| RBD-HK | NA | 52.26±16.27 | 42.67±18.52 | 0.040 |
| SCOPA-AUT | NA | 10.03±5.38 | 20.55±10.85 | < 0.001 |
| MMSE | 30.00 (29.00, 30.00) | 28.00 (27.00, 29.00) | 25.00 (22.00, 27.25) | < 0.001a,b, 0.047c |
| Visuospatial function | ||||
| ROCF score | NA | 28.31±7.96 | 24.19±9.57 | 0.068 |
| CDT | NA | 2.70±0.71 | 2.04±0.94 | 0.003 |
| Memory function | ||||
| AVLT short delay memory | NA | 3.63±2.22 | 2.85±2.61 | 0.127 |
| AVLT long delay memory | NA | 2.87±2.27 | 2.26±2.71 | 0.178 |
| AVLT recognition | NA | 18.68±4.76 | 19.04±3.31 | 0.927 |
| ROCF delayed recall | NA | 12.57±7.24 | 8.50±9.31 | 0.016 |
| Attention-executive function | ||||
| Stroop test A | NA | 19.26±8.74 | 20.15±7.95 | 0.512 |
| Stroop test B | NA | 26.32±9.78 | 29.04±9.11 | 0.182 |
| Stroop test C | NA | 43.23±19.26 | 41.07±11.98 | 0.827 |
| SDMT | NA | 23.46±11.47 | 13.52±13.66 | 0.008 |
| TMT A | NA | 79.34±48.17 | 128.88±69.38 | 0.008 |
| TMT B | NA | 216.31±87.18 | 304.23±182.93 | 0.089 |
| UPDRS part III scores | NA | 1.50 (0, 6.00) | 26.00 (19.50, 41.00) | < 0.001 |
| Alternate-tap test (Taps/min) | ||||
| Left | NA | 180.14±40.56 | 137.40±33.48 | < 0.001 |
| Right | NA | 189.24±54.73 | 148.88±37.99 | 0.003 |
| Average | NA | 184.69±46.81 | 143.14±34.78 | 0.001 |
| 3-meter Timed Up and Go (s) | NA | 7.82±1.57 | 9.36±1.93 | 0.002 |
| Plasma NfL, pg/mL | 13.97 (10.84,18.18) | 17.95 (13.44,30.22) | 20.53 (14.93, 32.56) | 0.057a, 0.015b, 1.000c |
Values represent the mean±SD or median (P25, P75). aHC vs. iRBD; bHC vs. PDRDB; ciRBD vs. PDRBD. For the multiple-comparison, Bonferroni-corrected p-values are presented. HC, healthy controls; iRBD, idiopathic rapid eye movement sleep behavior disorder; PD, Parkinson’s disease; PDRBD, Parkinson’s disease with a premorbid history of rapid eye movement sleep behavior disorder; RBD-HK, Rapid Eye Movement Sleep Behavior Disorder Questionnaire-Hong Kong; SCOPA-AUT, Scales for Outcomes in Parkinson’s disease-autonomic; MMSE, Mini-Mental State Examination; ROCF, Rey-Osterrieth Complex Figure Test; CDT, Clock Drawing Test; AVLT, Auditory Verbal Learning Test; SDMT, Symbol digit modalities test; TMT, Trail making test; UPDRS, United Parkinson’s Disease Rating Scale; NfL, neurofilament light chain; NA, not available.
Table 2
Clinical characteristics and serum NfL levels of participants at baseline in the PPMI dataset
| Characteristics | HC (n = 83) | iRBD (n = 32) | PDRBD (n = 80) | p |
| Age, y | 68.92±5.09 | 68.79±5.17 | 67.55±5.86 | 0.239 |
| Male, % | 56 (67.47%) | 27 (84.38%) | 62 (77.50%) | 0.125 |
| Time since RBD symptoms onset, y | NA | 9.97±6.41 | NA | NA |
| Disease duration of PD, month | NA | NA | 7.11±6.96 | NA |
| MoCA | 28.00 (27.00, 29.00) | 27.00 (24.00, 28.00) | 27.00 (25.00, 28.00) | < 0.001a,b, 1.000c |
| UPDRS part III scores | 0 (0, 2.00) | 3.50 (2.00, 6.75) | 21.00 (17.00, 29.75) | 0.014a,< 0.001b,c |
| Serum NfL, pg/mL | 12.50 (9.91, 16.4) | 14.10 (11.53, 17.20) | 14.40 (11.30, 19.88) | 0.313a, 0.038b, 1.000c |
Values represent the mean±SD or median (P25, P75). aHC vs. iRBD; bHC vs. PDRDB; ciRBD vs. PDRBD. For the multiple-comparison, Bonferroni-corrected p-values are presented. PPMI, Parkinson’s Progression Markers Initiative; HC, healthy controls; iRBD, idiopathic rapid eye movement sleep behavior disorder; PD, Parkinson’s disease; PDRBD, Parkinson’s disease with a premorbid history of rapid eye movement sleep behavior disorder; MoCA, Montreal Cognitive Assessment; UPDRS, United Parkinson’s Disease Rating Scale; NfL, neurofilament light chain; NA, not available.
In our cohort, the patients with iRBD had more severe RBD symptoms than those with PDRBD (p = 0.040). SCOPA-AUT scores were significantly increased in PDRBD compared with those in iRBD (p < 0.001). The MMSE scores were significantly lower in PDRBD compared to those in iRBD (p = 0.047), which was also observed in patients with iRBD compared to age-matched healthy controls (p < 0.001). Compared with patients with iRBD, the patients with PDRBD performed worse on neuropsychological tests (CDT (p = 0.003), ROCF delayed recall (p = 0.016), SDMT (p = 0.008), TMT A (p = 0.008)) and motor tests (UPDRS part III (p < 0.001), Alternate-tap test (left, p < 0.001; right, p = 0.003; average, p = 0.001), and 3-meter Timed Up and Go test (p = 0.002)).
Baseline plasma NfL levels in the participants
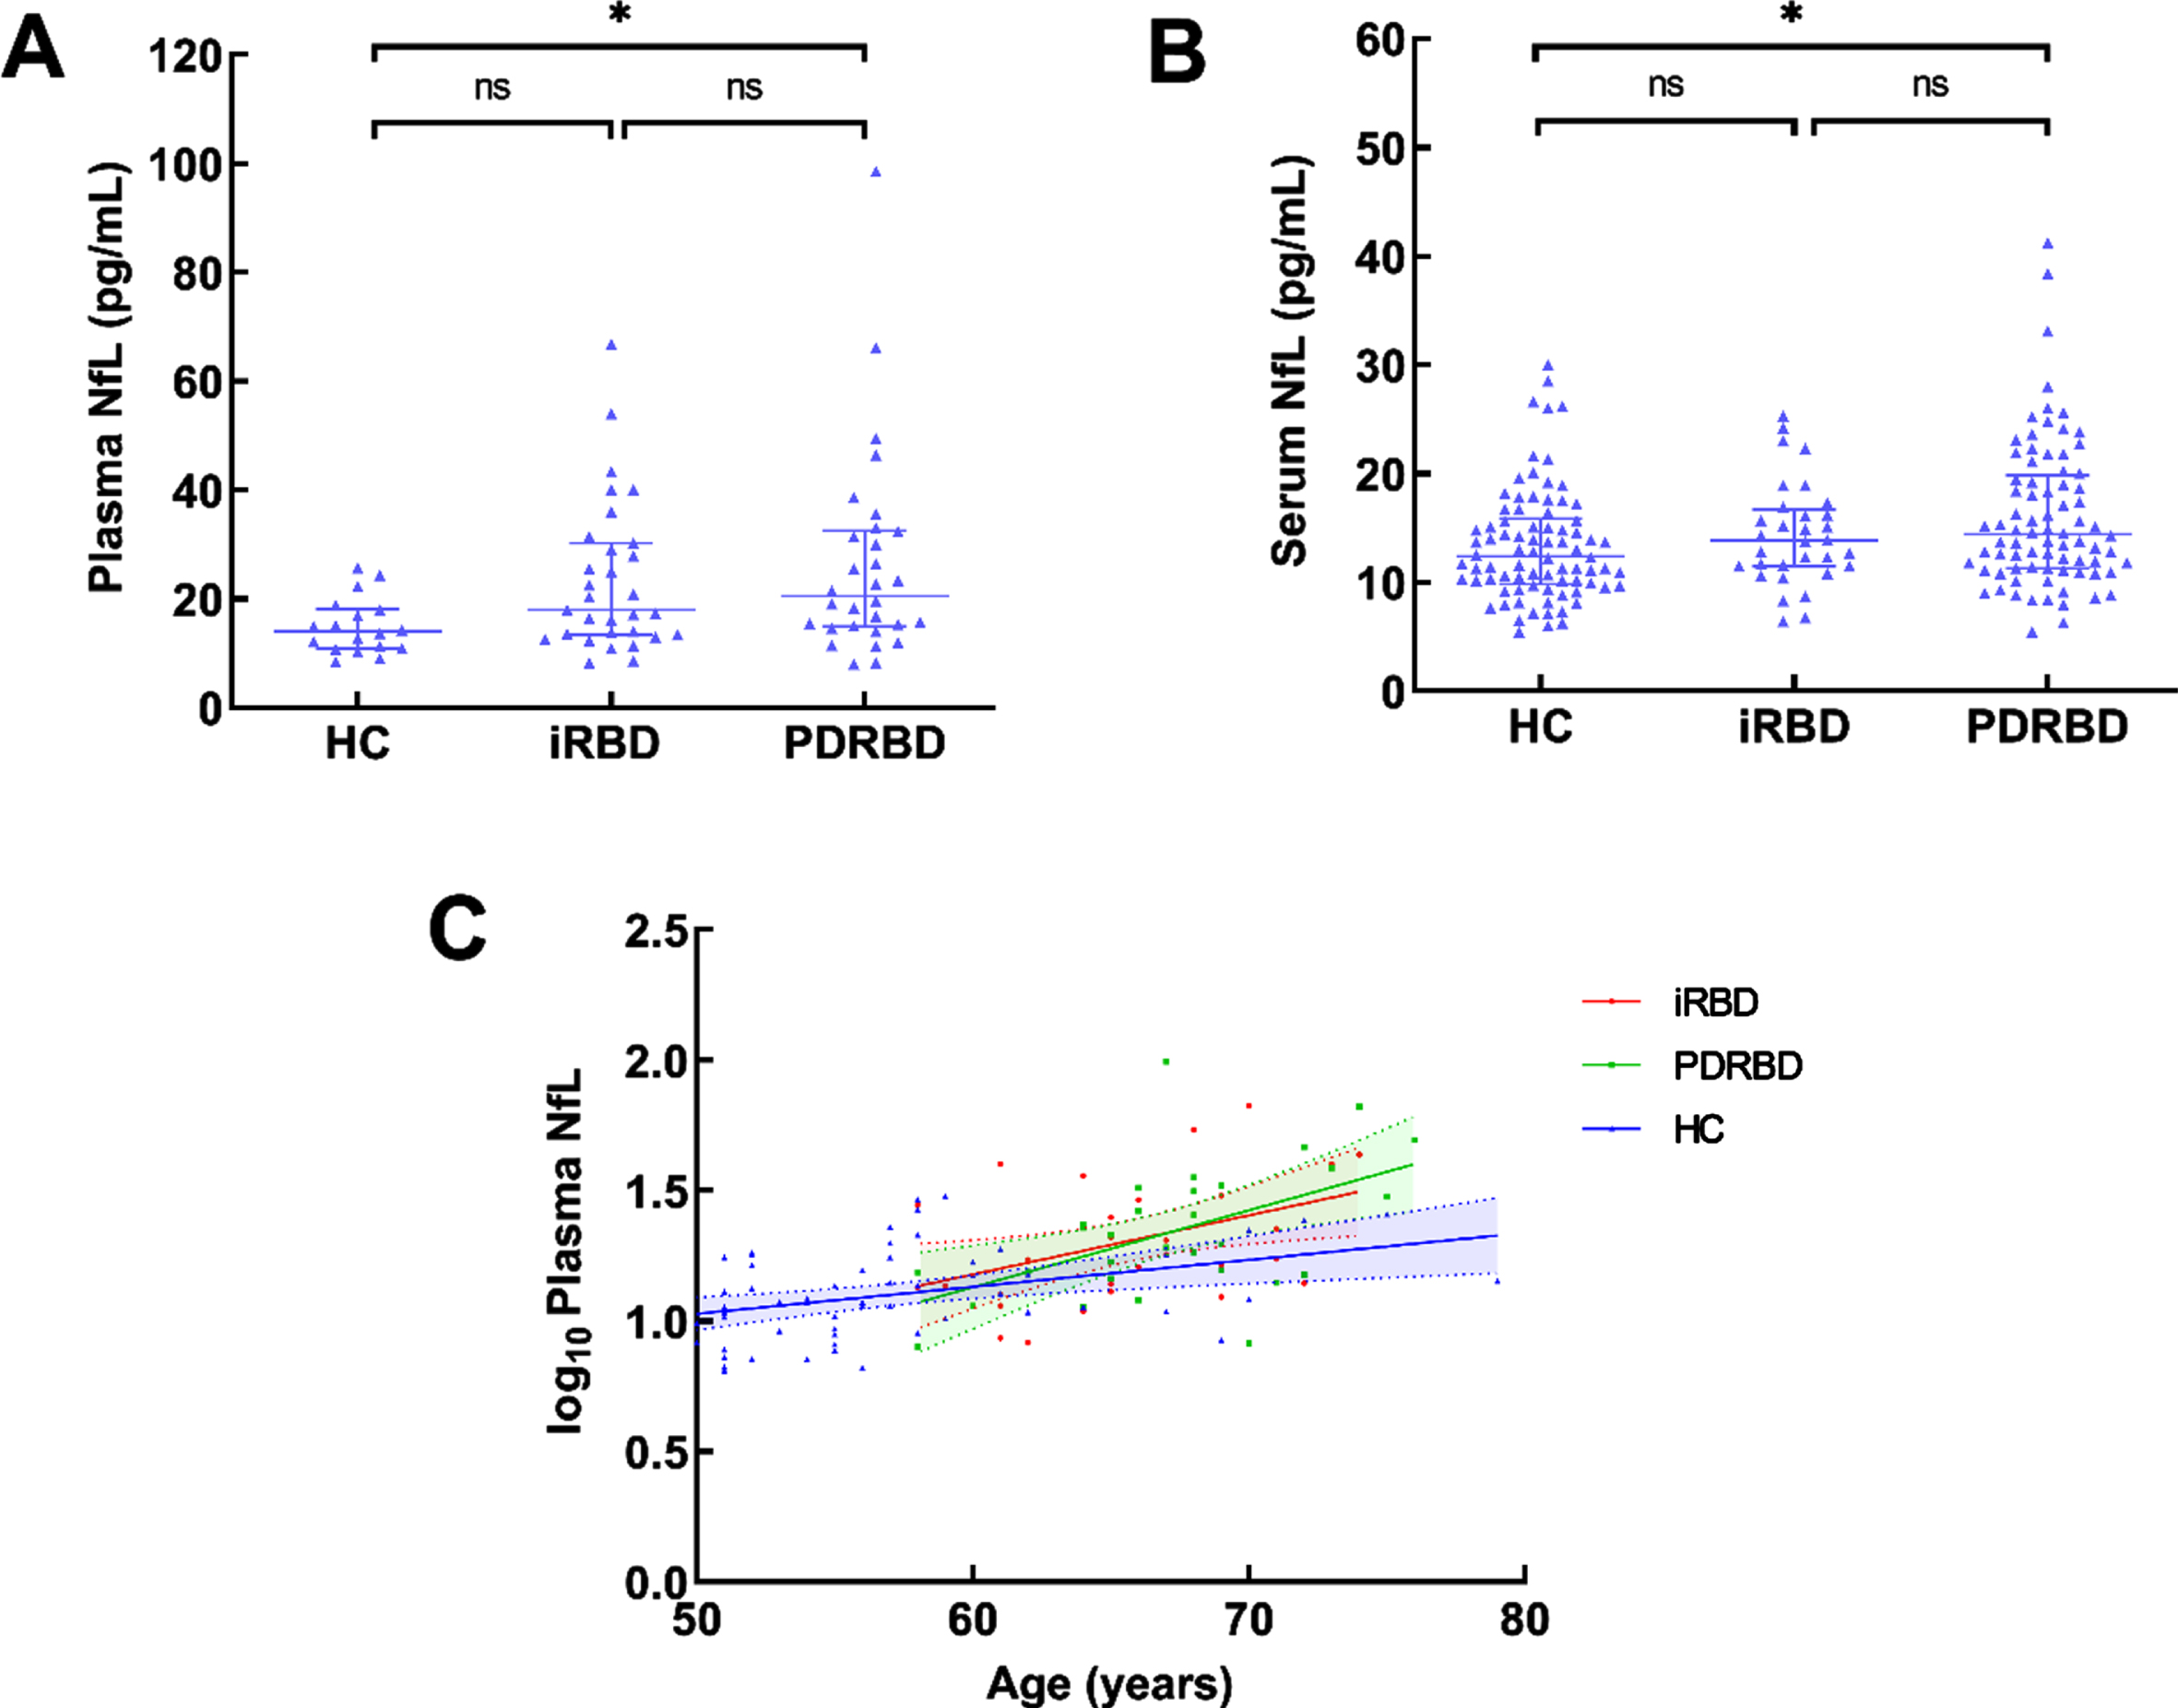
In our cohort, the plasma NfL levels were significantly higher in patients with PDRBD than those in the age-matched healthy controls (20.53 (14.93, 32.56) pg/ml vs. 13.97 (10.84,18.18) pg/ml, p = 0.015, 1-β=0.759). No difference was found in plasma NfL levels between the patients with iRBD and healthy controls (Table 1 and Fig. 1A, 1-β=0.753). The same outcome was observed in the PPMI dataset (Table 2 and Fig. 1B). The plasma NfL levels (log transformed) were correlated with age in healthy controls, as well as patients with iRBD and PDRBD (healthy controls: r = 0.395, 95% CI: 0.179–0.598, p = 0.002; iRBD: r = 0.426, 95% CI: 0.094–0.702, p = 0.017; PDRBD: r = 0.522, 95% CI: 0.194–0.785, p = 0.003; Fig. 1C; Pearson correlation analyses).
Fig. 1
Blood NfL levels in all participants and their correlation with age. A) Plasma NfL levels in HC, iRBD, and PDRBD in our cohort. B) Serum NfL levels in HC, iRBD, and PDRBD from the PPMI dataset. C) The correlation between plasma NfL levels (log10-transformed) and age in different groups, Pearson correlation analyses. NfL, neurofilament light chain; HC, healthy controls; iRBD, idiopathic rapid eye movement sleep behavior disorder; PD, Parkinson’s disease; PDRBD, PD with a premorbid history of RBD; PPMI, Parkinson’s Progression Markers Initiative; *p < 0.05; **p < 0.01.
Correlation between plasma NfL levels and cognitive status/motor severity in iRBD and PDRBD
No correlation was found between plasma NfL levels and cognitive or motor performance in patients with iRBD. Plasma NfL levels were associated with cognitive and motor function measured by MMSE and UPDRS part III in patients with PDRBD (Table 3; Spearman correlation analyses). When the multivariate regression analysis simultaneously considered age, sex, and disease duration of PD, the correlation between NfL levels and severity of cognition (assessed with MMSE), and the correlation between NfL levels and disease duration of PD and severity of motor symptoms (assessed with the UPDRS part III) in the patients with PDRBD remained significant (Table 4). The correlation and multivariate regression analyses were also conducted in the PPMI dataset (Supplementary Tables 1 and 2). These findings suggested that higher NfL levels were correlated with poorer cognitive and motor function in patients with PDRBD.
Table 3
Correlations between plasma NfL levels (log10-transformed) and cognitive/motor function in patients with iRBD and PDRBD
| Variables | Correlation Coefficient | 95% CI | p |
| iRBD | |||
| Cognitive function (defined by MMSE scores) | 0.168 | –0.229 ∼ 0.551 | 0.375 |
| Motor function (defined by UPDRS part III scores) | 0.083 | –0.318 ∼ 0.435 | 0.661 |
| PDRBD | |||
| Cognitive function (defined by MMSE scores) | –0.379 | –0.701 ∼ 0.025 | 0.043 |
| Motor function (defined by UPDRS part III scores) | 0.399 | –0.001 ∼ 0.745 | 0.032 |
Spearman correlation analysis. iRBD, idiopathic rapid eye movement sleep behavior disorder; PDRBD, Parkinson’s disease with a premorbid history of rapid eye movement sleep behavior disorder; MMSE, Mini-Mental State Examination; UPDRS, United Parkinson’s Disease Rating Scale; NfL, neurofilament light chain; CI, Confidence interval.
Table 4
Multivariate linear regression models for cognitive/motor symptom severity in patients with PDRBD
| Independent variables | Coefficient | Standard error | r | t | p |
| Cognitive function (defined by MMSE scores) | |||||
| Constant | 46.329 | ||||
| Age | –0.264 | 0.159 | –0.296 | –1.657 | 0.110 |
| Male sex | –1.031 | 1.337 | –0.127 | –0.771 | 0.448 |
| Disease duration | –0.180 | 0.178 | –0.165 | –1.012 | 0.321 |
| Plasma NfL level (log10-transformed) | –0.083 | 0.039 | –0.392 | –2.154 | 0.041 |
| Motor function (defined by UPDRS part III scores) | |||||
| Constant | –48.373 | ||||
| Age | 0.984 | 0.555 | 0.302 | 1.774 | 0.089 |
| Male sex | –0.710 | 4.730 | –0.024 | –0.150 | 0.882 |
| Disease duration | 1.304 | 0.615 | 0.328 | 2.120 | 0.045 |
| Plasma NfL level (log10-transformed) | 0.298 | 0.134 | 0.388 | 2.234 | 0.035 |
PDRBD, Parkinson’s disease and premorbid history of rapid eye movement sleep behavior disorder; MMSE, Mini-Mental State Examination; UPDRS, United Parkinson’s Disease Rating Scale; NfL, neurofilament light chain.
Baseline plasma NfL predicts cognitive, motor, and autonomic function progression in patients with iRBD
In our cohort, twenty-six of 31 patients with iRBD involved in a follow-up study with a mean period of 2.2±0.9 years (range 0.5–4 years). Fourteen of 26 patients (53.8%) with iRBD displayed general disease progression. Among whom twelve (46.2%), 8 (30.8%), and 6 (23.1%) displayed cognitive, motor, and autonomic function progression, respectively. Moreover, four were diagnosed with PD, two DLB, and two MSA. In the PPMI dataset, twelve of 32 (37.5%) patients with iRBD displayed phenoconversion in the following 4.2±1.4 years (range 0.5–5 years), eight converted to PD, three to DLB and one to MSA. The demographic and clinical characteristics of the iRBD converters and non-converters at baseline from our cohort and the PPMI dataset were presented in Tables 5 and 6, respectively. In our cohort, iRBD converters performed worse in the Symbol digit modalities test and Train making test B, which indicated that iRBD converters possess poorer attention-executive function than the iRBD non-converters at baseline.
Table 5
Clinical characteristics and plasma NfL levels of the iRBD converters and non-converters at baseline
| Characteristics | iRBD converters (n = 8) | iRBD non-converters (n = 18) | p |
| Age, y | 67.63±4.75 | 65.22±4.02 | 0.196 |
| Male, % | 4 (50.00%) | 12 (66.67%) | 0.664 |
| Disease duration of RBD, y | 6.00±4.96 | 4.89±4.01 | 0.550 |
| Follow-up duration, y | 1.70 (0.90, 2.00) | 2.00 (2.00, 3.00) | 0.019 |
| RBD-HK | 46.00±9.49 | 51.33±16.64 | 0.328 |
| SCOPA-AUT | 10.88±9.16 | 10.44±4.89 | 0.879 |
| MMSE | 28.00 (27.00, 28.00) | 28.00 (22.75, 29.00) | 0.790 |
| Visuospatial function | |||
| ROCF score | 27.93±2.92 | 28.91±7.13 | 0.732 |
| CDT | 2.86±0.38 | 2.63±0.81 | 0.479 |
| Memory function | |||
| AVLT short delay memory | 2.71±1.70 | 4.18±2.48 | 0.170 |
| AVLT long delay memory | 2.29±1.80 | 3.19±2.48 | 0.398 |
| AVLT recognition | 19.57±2.76 | 19.31±3.68 | 0.870 |
| ROCF delayed recall | 11.93±11.64 | 11.94±4.41 | 0.998 |
| Attention-executive function | |||
| Stroop test A | 22.00±11.89 | 18.44±7.76 | 0.385 |
| Stroop test B | 27.57±10.88 | 26.56±10.50 | 0.831 |
| Stroop test C | 46.57±24.29 | 44.72±19.29 | 0.843 |
| SDMT | 16.00±7.46 | 27.00±11.41 | 0.015 |
| TMT A | 102.00±73.70 | 71.71±34.93 | 0.190 |
| TMT B | 285.33±91.11 | 193.65±80.49 | 0.030 |
| UPDRS part III scores | 6.00 (1.00, 8.00) | 1.00 (0, 4.00) | 0.055 |
| Alternate-tap test (Taps/min) | |||
| Left | 152.71±40.23 | 186.13±39.01 | 0.075 |
| Right | 161.14±48.51 | 196.63±55.08 | 0.157 |
| Average | 156.93±43.75 | 191.38±45.99 | 0.109 |
| 3-meter Timed Up and Go (s) | 7.66±1.63 | 7.76±1.62 | 0.897 |
| Plasma NfL, pg/mL | 33.99 (18.58, 53.04) | 15.00 (12.12, 20.50) | 0.005 |
Values represent the mean±SD or median (P25, P75). iRBD, idiopathic rapid eye movement sleep behavior disorder; RBD-HK, Rapid Eye Movement Sleep Behavior Disorder Questionnaire-Hong Kong; SCOPA-AUT, Scales for Outcomes in Parkinson’s disease-autonomic; MMSE, Mini-Mental State Examination; ROCF, Rey-Osterrieth Complex Figure Test; CDT, Clock Drawing Test; AVLT, Auditory Verbal Learning Test; SDMT, Symbol digit modalities test; TMT, Trail making test; UPDRS, United Parkinson’s Disease Rating Scale; NfL, neurofilament light chain.
Table 6
Clinical characteristics and serum NfL levels of the iRBD converters and non-converters at baseline in the PPMI dataset
| Characteristics | iRBD converters (n = 12) | iRBD non-converters (n = 20) | p |
| Age, y | 67.33±3.09 | 69.05±5.40 | 0.269 |
| Male, % | 7 (58.33%) | 20 (100.00%) | 0.004 |
| Time since RBD symptoms onset, y | 11.08±7.06 | 8.47±4.91 | 0.233 |
| Follow-up duration, y | 2.00 (2.00, 4.00) | 5.00 (5.00, 5.00) | <0.001 |
| MoCA | 26.50 (24.00, 27.75) | 27.0 (24.00, 28.00) | 0.646 |
| UPDRS part III scores | 6.08±4.87 | 3.79±3.38 | 0.132 |
| Serum NfL, pg/mL | 16.30 (14.95, 21.45) | 12.00 (10.65, 14.20) | 0.017 |
Values represent the mean±SD or median (P25, P75). iRBD, idiopathic rapid eye movement sleep behavior disorder; MoCA, Montreal Cognitive Assessment; UPDRS, United Parkinson’s Disease Rating Scale; NfL, neurofilament light chain.
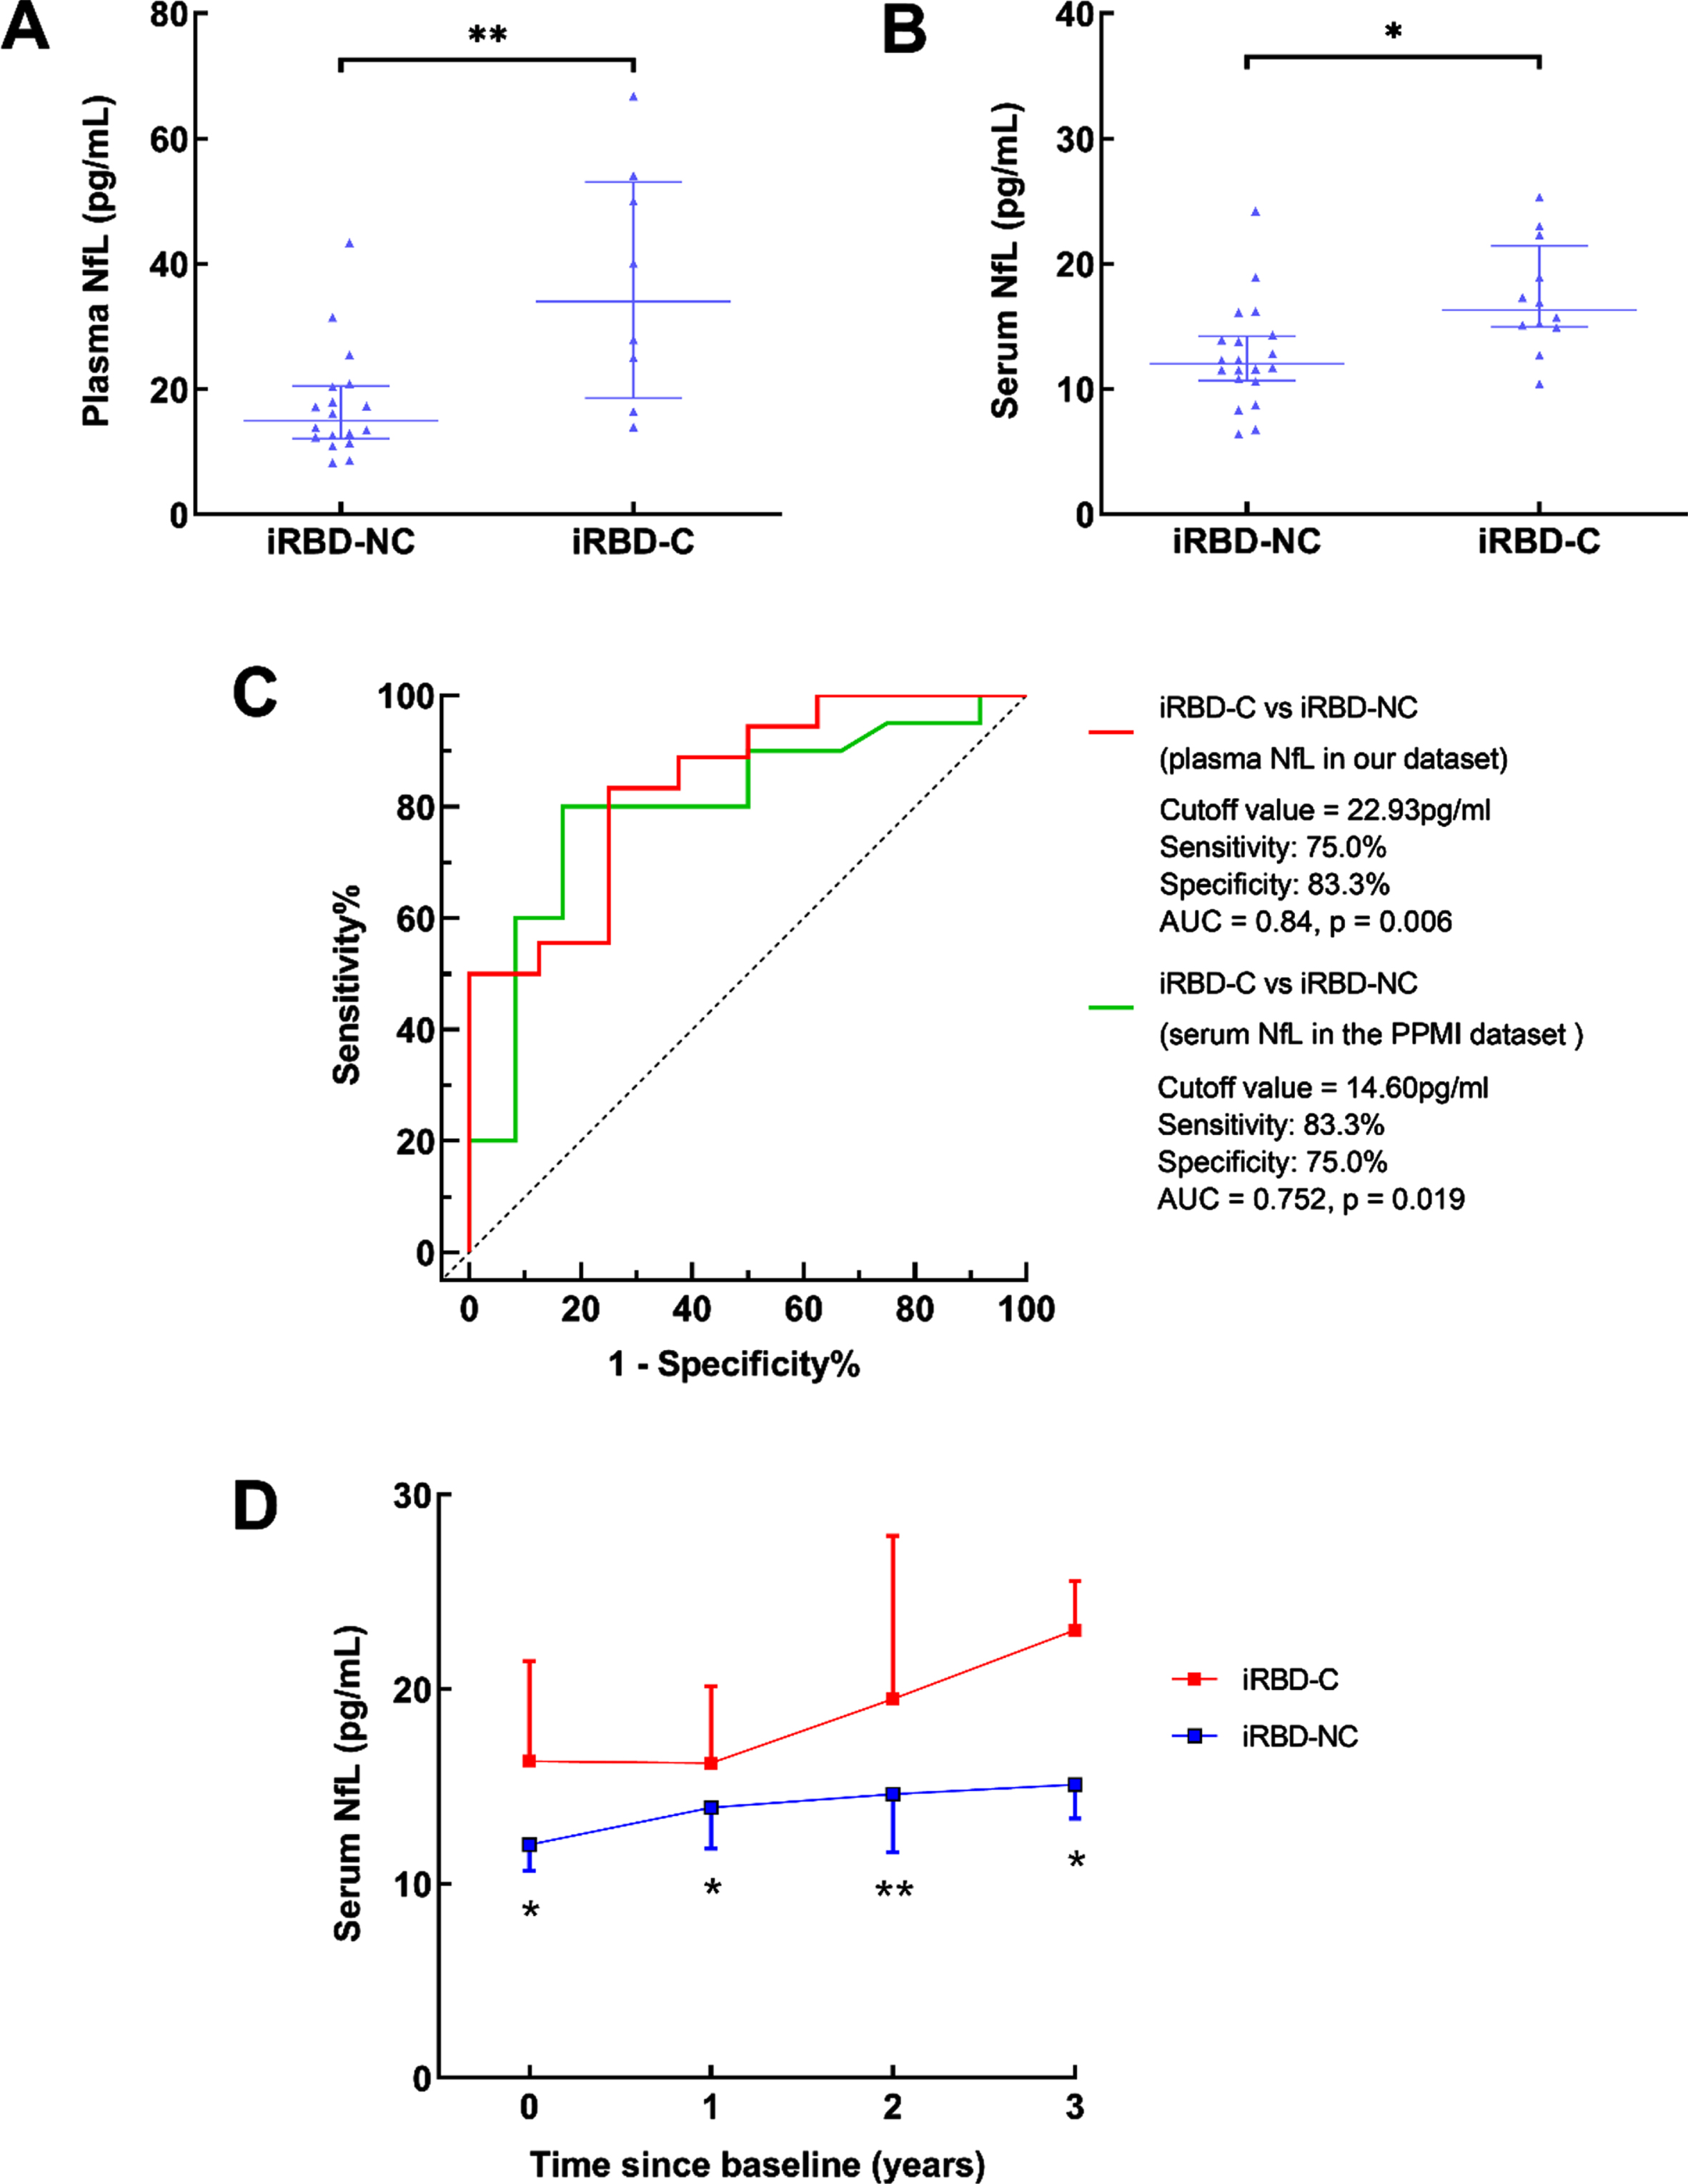
The baseline blood NfL levels were significantly higher in patients with iRBD converters than those in iRBD non-converters in our cohort (plasma: 33.99 (18.58, 53.04) pg/ml vs. 15.00 (12.12, 20.50) pg/ml, p = 0.005, Fig. 2A, 1-β=0.819) and the PPMI dataset (serum: 16.30 (14.95, 21.45) pg/ml vs. 12.00 (10.65, 14.20) pg/ml, p = 0.017, Fig. 2B, 1-β=0.811). The ROC analysis showed that a plasma NfL cutoff value of 22.93 pg/mL served to distinguish iRBD converters from non-converters (sensitivity: 75.0%, specificity: 83.3%, area under the curve (AUC): 0.84, p = 0.006) (Fig. 2C), and a serum NfL cutoff value of 14.60 pg/mL served to distinguish iRBD converters from non-converters in the PPMI dataset (sensitivity: 83.3%, specificity: 75.0%, AUC: 0.752, p = 0.019) (Fig. 2C). Compared with iRBD non-converters, the serum NfL levels in iRBD converters were higher at the following 1, 2, and 3 years in the PPMI dataset (Fig. 2D).
Fig. 2
Blood NfL levels in iRBD converters and non-converters. A) Baseline plasma NfL levels in iRBD converters and non-converters in our cohort. B) Baseline serum NfL levels in iRBD converters and non-converters from the PPMI dataset. C) Receiver operating characteristic curve analyses for differentiating iRBD converters and non-converters from our cohort and the PPMI dataset. D) The dynamic changes of serum NfL in iRBD from the PPMI dataset. iRBD-C, iRBD converters; iRBD-NC, iRBD non-converters; *p < 0.05; **p < 0.01.
As shown in Table 7, Cox regression analyses showed that higher baseline plasma NfL levels were associated with higher hazard ratios (HRs) for cognitive progression (after adjustment for age, gender, disease duration, and baseline MMSE scores; adjusted HR= 1.069, 95% CI: 1.024–1.115, p = 0.002), motor progression (after adjustment for age, gender, disease duration, and baseline UPDRS III scores, adjusted HR= 1.065, 95% CI: 1.017–1.116, p = 0.008), autonomic function progression (after adjustment for age, gender, disease duration, and baseline SCOPA-AUT scores; adjusted HR= 1.170, 95% CI: 1.010–1.335, p = 0.036), general disease progression and phenoconversion (after adjustment for age, gender, disease duration, and baseline MMSE, UPDRS part III and SCOPA-AUT scores; adjusted HR= 1.056, 95% CI: 1.013–1.101, p = 0.011, adjusted HR= 1.065, 95% CI: 1.019–1.113, p = 0.005, respectively). Consistently, higher baseline serum NfL levels were associated with higher HRs for phenoconversion in the PPMI dataset (adjusted HR= 1.153, 95% CI: 1.015–1.310, p = 0.028). In summary, baseline NfL levels were valuable in predicting the decline of cognitive, motor, and autonomic function at follow-up.
Table 7
Cox regression analysis of baseline NfL levels and function progression in patients with iRBD
| Variables | HR (95% CI) | |||
| Univariate | p | Multivariate | p | |
| Higher risk of cognitive function progression | 1.069 (1.024, 1.115) | 0.002 | 1.069 (1.024, 1.115)a | 0.002 |
| Higher risk of motor function progression | 1.067 (1.018, 1.118) | 0.006 | 1.065 (1.017, 1.116)b | 0.008 |
| Higher risk of autonomic function progression | 1.083 (1.020, 1.149) | 0.009 | 1.170 (1.010, 1.355)C | 0.036 |
| Higher risk of progression in any function above | 1.057 (1.016, 1.100) | 0.006 | 1.056 (1.013, 1.101)d | 0.011 |
| Higher risk of phenoconversion | 1.068 (1.022, 1.117) | 0.004 | 1.065 (1.019, 1.113)d | 0.005 |
| Higher risk of phenoconversion in the PPMI dataset | 1.171 (1.047, 1.309) | 0.006 | 1.153 (1.015, 1.310)e | 0.028 |
CI, confidence interval; HR, hazard ratio; NfL, neurofilament light chain; PPMI, Parkinson’s Progression Markers Initiative. HRs represent the risk of cognitive, motor, and autonomic function progression within 2.2 years of follow-up. aThe multivariable analyses were adjusted for age, gender, disease duration, and baseline Mini-Mental State Examination (MMSE) scores. bThe multivariable analyses were adjusted for age, gender, disease duration, and baseline United Parkinson’s Disease Rating Scale part III (UPDRS III) scores. cThe multivariable analyses were adjusted for age, gender, disease duration, and baseline Scales for Outcomes in Parkinson’s Disease-Autonomic questionnaire (SCOPA-AUT) scores. dThe multivariable analyses were adjusted for age, gender, disease duration, and baseline MMSE, UPDRS III, and SCOPA-AUT scores. eThe multivariable analyses were adjusted for age, gender, disease duration, and baseline MoCA, UPDRS III, and SCOPA-AUT scores.
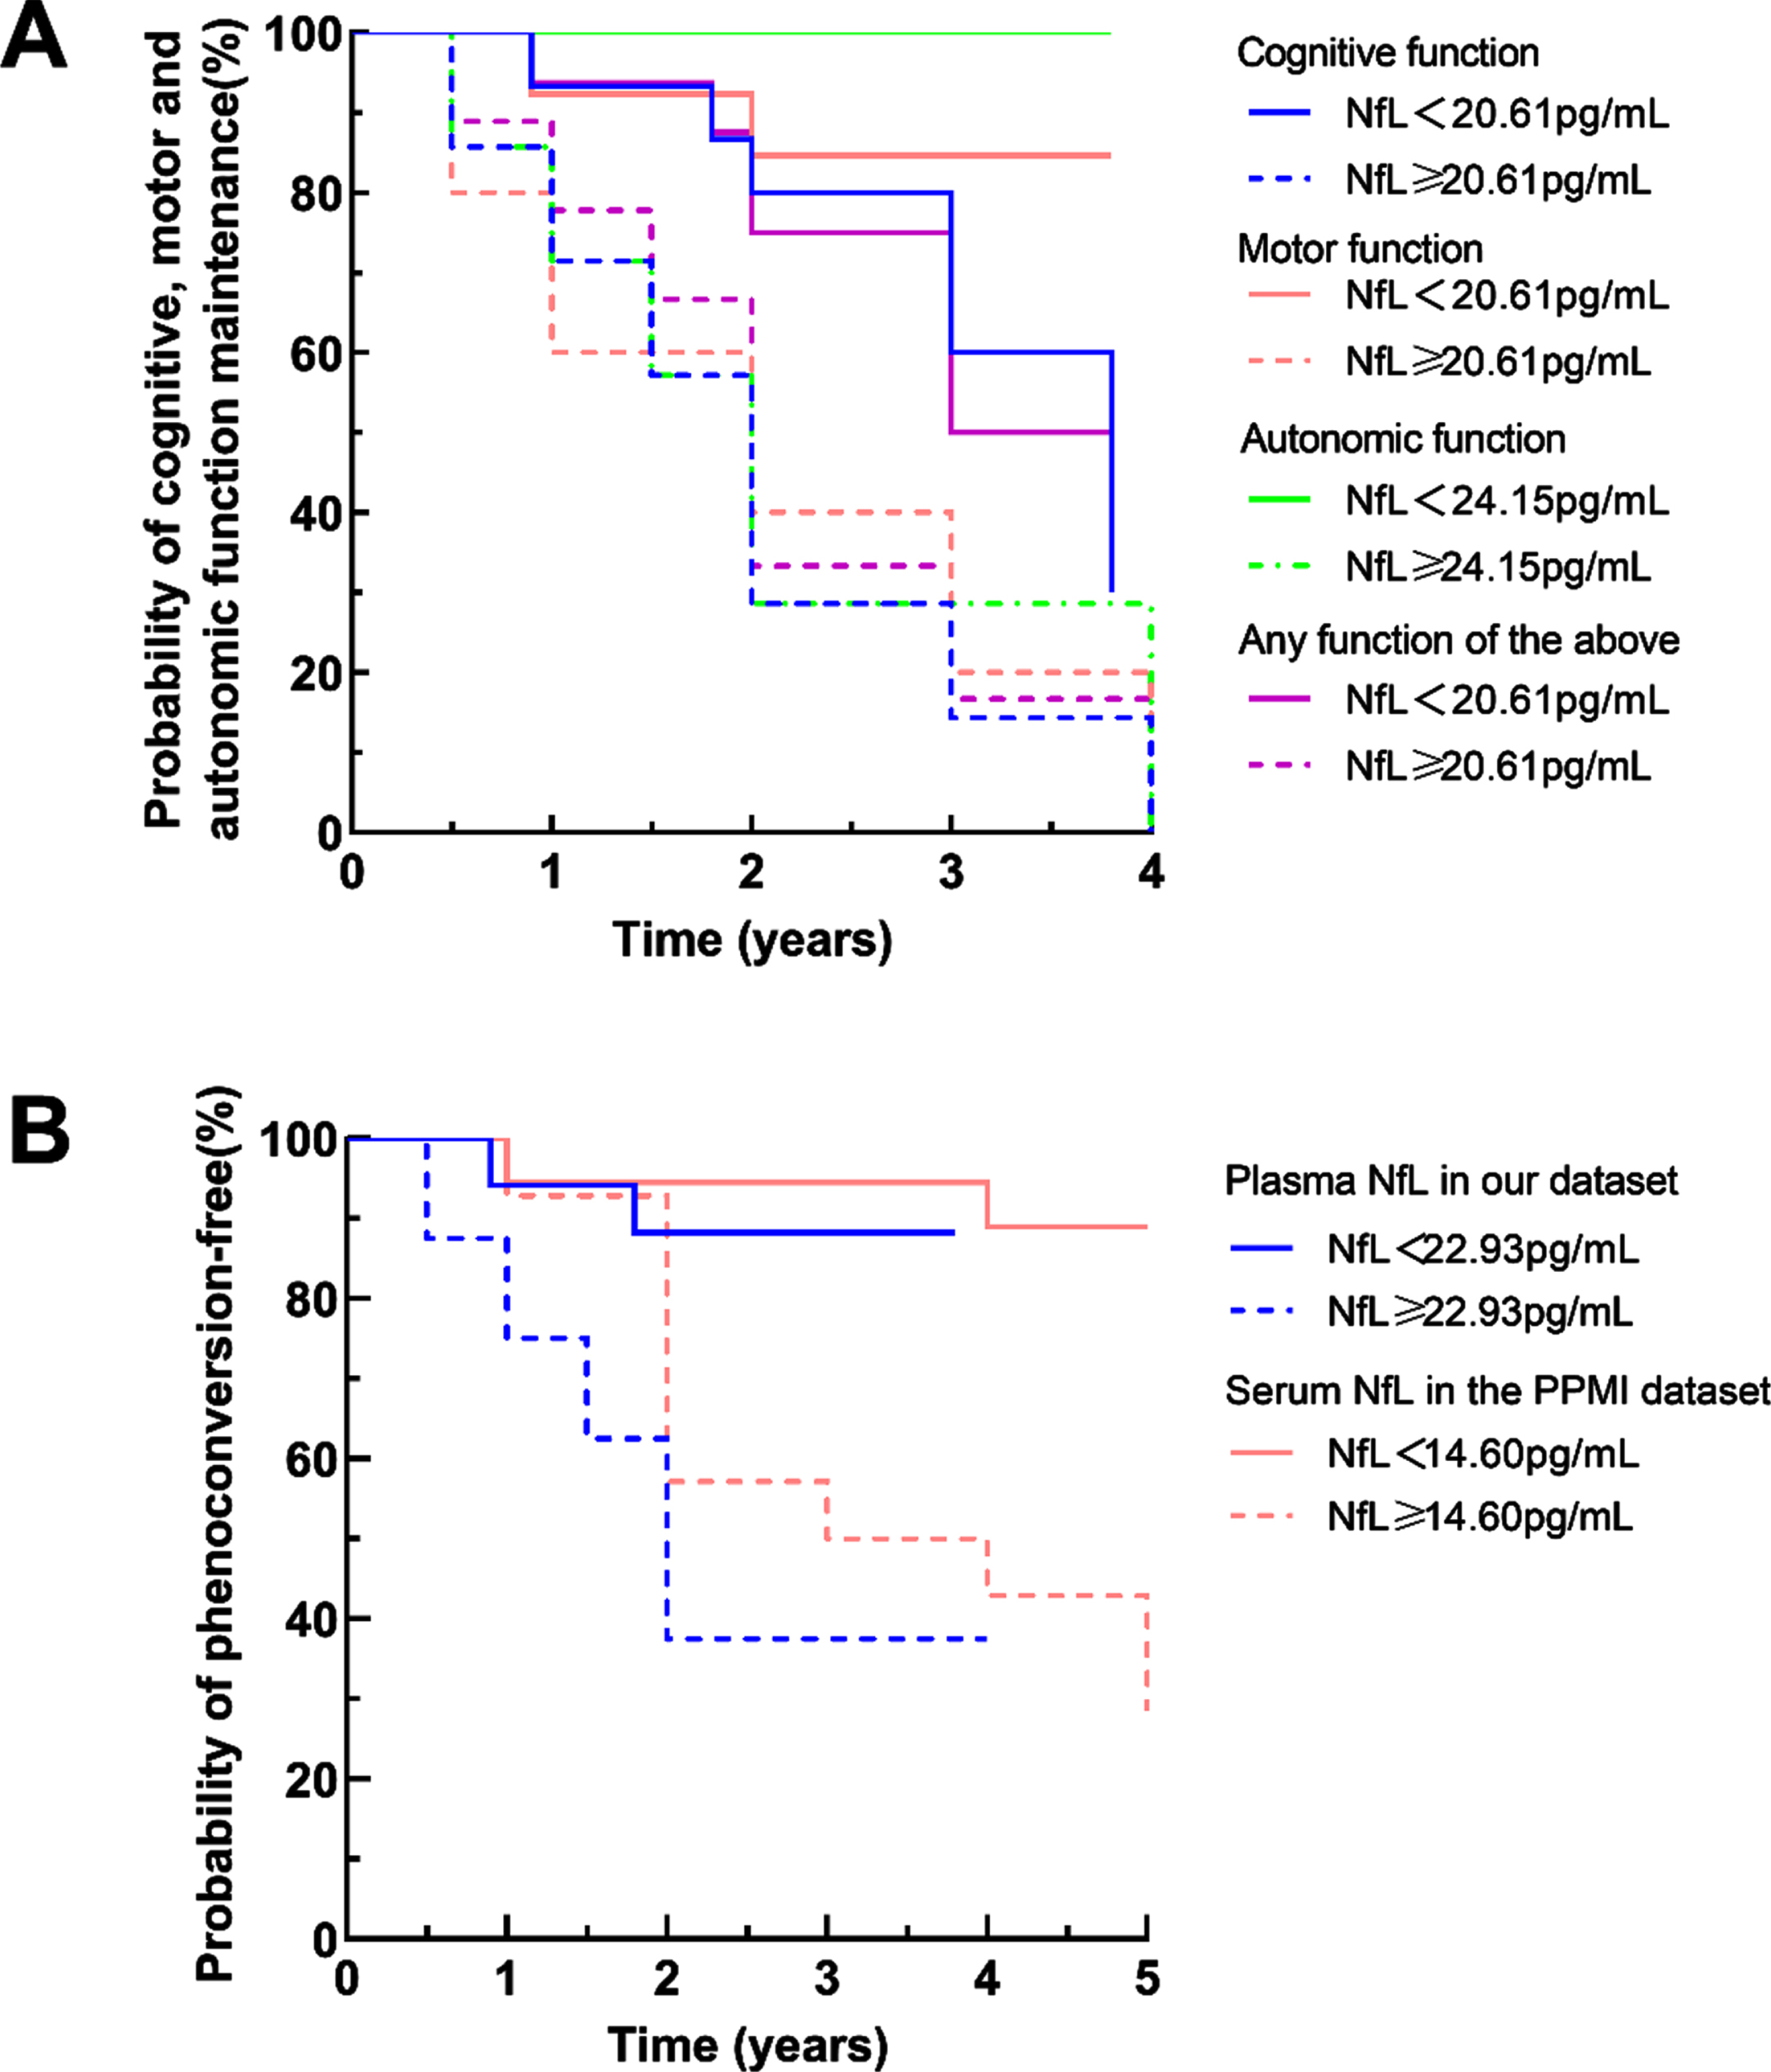
ROC analyses were performed in iRBD to identify cutoff values based on the highest Youden J index. Kaplan–Meier analyses showed clear divergence between iRBD with baseline plasma NfL levels above and below the cutoff value (log-rank test, Fig. 3A, B). The cutoff values of plasma NfL were 20.61 pg/ml for cognitive, motor function progression, and general disease progression (p = 0.029, p = 0.027, p = 0.043, respectively), 24.15 pg/mL for autonomic function progression (p = 0.001), and 22.93 pg/mL for phenoconversion (p = 0. 009), respectively. The cutoff value of serum NfL was 14.60 pg/ml for phenoconversion in the PPMI dataset (p = 0.001).
Fig. 3
Disease progression and phenoconversion in patients with iRBD with high or low plasma NfL levels in the follow-up study. A) The Kaplan-Meier plots showed outcomes for cognitive, motor, autonomic function progression and general disease progression in patients with iRBD who had baseline NfL concentrations above or below the cutoff levels determined by receiver operating characteristic curve analyses in our cohort. B) The Kaplan-Meier plots showed outcomes for phenoconversion in patients with iRBD who had baseline blood NfL concentrations above or below the cutoff levels determined by receiver operating characteristic curve analyses in our cohort and the PPMI dataset.
DISCUSSION
This study demonstrated that plasma NfL levels were valuable in reflecting the severity of cognitive and motor impairment in patients with PDRBD, but not in iRBD. Baseline plasma NfL cutoff value of 22.93 pg/mL performed best in distinguishing the iRBD converters from non-converters. Higher baseline plasma NfL levels could predict a higher risk of cognitive, motor, autonomic function progression, and phenoconversion after a mean interval of 2.2±0.9 years in patients with iRBD. Data from the PPMI dataset also supported that serum NfL levels were correlated with cognitive and motor performance in PDRBD and could predict phenoconversion at follow-up in patients with iRBD. Overall, this study indicated that plasma NfL may serve as a valuable biomarker for disease severity in patients with PDRBD, and for cognitive, motor, or autonomic function progression and phenoconversion in patients with iRBD. Plasma NfL detected by the Simoa technique might assist clinicians in assessing disease severity in PDRBD and identifying patients with iRBD at high risk of rapid disease progression.
Plasma NfL changes in patients with iRBD and PDRBD
No difference was found in blood NfL levels between patients with iRBD and healthy controls, which is consistent with a previous study [19]. However, a high blood NfL at baseline was found in the iRBD patients who converted to clinically established neurodegenerative disease in the limited follow-up period. Considering that the increase of blood NfL occurs during the conversion from prodromal period to clinically established PD [19], this study indicated that baseline blood NfL is a potential marker for identifying iRBD with high risk of conversion in the near future. In addition, this study found that plasma NfL levels were significantly higher in patients with PDRBD than those in healthy controls. Blood NfL levels in PD patients remain controversial [15–18]. Plasma NfL levels were related to disease severity in patients with PD [17]. Thus, patients with PD of varying severity may contribute to the inconformity in different studies. As it has been reported that symptoms in PD with RBD are more severe than those in PD without RBD [39], plasma NfL levels in PD with RBD may be higher in comparison with those in PD without RBD. However, previous studies did not consider whether PD patients had prodromic RBD symptoms. Since about half of iRBD would convert to PDRBD, our study highlighted the role of blood NfL changes in monitoring disease progression.
Correlation between NfL and clinical features in iRBD and PDRBD patients
In this study, we first focused on the correlation between plasma NfL and clinical features in patients with iRBD, but no correlation was found between baseline plasma NfL levels and cognitive or motor function in the patients with iRBD in the cross-sectional analysis. The result was supported by the PPMI dataset. Plasma NfL levels in patients with MSA were reported to be higher than those in patients with PD [17]. Thus, we speculated that plasma NfL levels may be higher in patients with iRBD who convert to MSA, whereas cognitive or motor function may be preserved in the early stage. However, the statistical power was limited in the correlation analysis due to the small sample size in our study, further research with large sample is needed to evaluate the value of baseline plasma NfL in reflecting the cognitive or motor status in patients with iRBD.
PD with RBD symptoms represents a subtype with a longer disease duration and more severe motor and nonmotor symptoms than PD without RBD symptoms [39]. In this study, higher baseline plasma NfL levels were correlated with worse performance on cognitive and motor tests in patients with PDRBD, which is consistent with previous studies in patients with PD [17, 40, 41]. It has been reported that blood NfL was associated with white matter damage in Alzheimer’s disease [42] and multiple sclerosis [43] and could also reflect cortical neurodegeneration from the very early stages of PD [44]. An eight-year longitudinal study showed that blood NfL levels predicted progression of motor impairment and reduction in putamen dopamine transporter binding ratios in de novo PD [45]. Blood NfL levels were strongly correlated with CSF NfL levels in patients with PD and APS as well as healthy controls [16]. Higher CSF NfL levels reflected more sever neuroaxonal damage [11] and were correlated with striatal dopamine transporter uptake deficits and lower fractional anisotropy in diffusion tensor imaging of several axonal tracts in patients with PD [46]. From these observations, it seems that blood NfL may be an easily accessible biomarker to reflect striatal dopamine transporter uptake deficits, white matter damage and cortical neurodegeneration, which contribute to cognitive or motor impairment in patients with PD. Our study confirmed that plasma NfL is a valuable biomarker for monitoring severity in both motor and cognitive impairment of patients with PDRBD.
Plasma NfL and disease progression in patients with iRBD
Our study showed that higher baseline plasma NfL levels above a specific cutoff value were associated with higher HRs for cognitive, motor, autonomic function progression, and phenoconversion during follow-up in patients with iRBD. In our study, some patients with iRBD displayed deterioration in cognitive, autonomic, or motor function at follow-up, but did not evolve towards more definitive, clinically overt synucleinopathy subtypes, such as DLB, MSA, PD, or PD dementia. Thus, we considered the decline of cognitive, motor, or autonomic function along with phenoconversion as the outcome events in our cohort. We found that patients with iRBD whose plasma NfL≥20.61 pg/ml at baseline were more likely to suffer from cognitive or motor progression, whereas those with higher plasma NfL (≥24.15 pg/ml) at baseline were more likely to suffer from autonomic progression in the follow-up period. Generally, deterioration in different clinical manifestations, including cognitive, motor, or autonomic impairment, in iRBD indicates different phenotypic conversion to synucleinopathies. Patients with iRBD who progress in cognitive, motor, or autonomic function may convert to DLB, PD, or MSA in follow-up, respectively. It has been reported that blood or CSF NfL serves as a promising biomarker to discriminate patients with MSA from PD [16, 17, 47], and blood NfL predicts the progression of motor or cognitive impairment in PD [17, 45] and disease progression in MSA [48] and frontotemporal dementia [14]. Imaging research has confirmed that patients with MSA showed more extensive white matter involvement, notably descending tracts from the primary motor cortex to the corona radiata and cerebral peduncle, than those with PD [49]. Considering that higher plasma NfL may represent more extensive white matter damage and cortical neurodegeneration, as we mentioned above, our study indicated that baseline plasma NfL measurements may be useful for predicting phenotype conversion. Furthermore, in our cohort, baseline plasma NfL≥22.93 pg/ml in the patients with iRBD predicted conversion to the clinical diagnosed PD, DLB, and MSA in the near future, which was supported by the findings from the PPMI dataset (baseline cut-off value in serum NfL: 14.60 pg/ml). Variations of race and blood species (serum or plasma) may contribute to the different cutoff values in blood NfL. Further research with large sample is needed to confirm the association between baseline blood NfL levels and risk of disease progression in iRBD, considering the limited power in the exploratory regression analyses. In conclusion, our study demonstrated the potential value of blood NfL in predicting disease progression and phenoconversion in the patients with iRBD.
Limitations
There were some limitations in our study. First, we enrolled PD by the clinical diagnosis, which was not confirmed by postmortem pathological confirmation, and RBD symptoms in patients with PD were defined by clinical diagnosis but not PSG, which may have resulted in misclassification. However, the enrolled patients with PDRBD were all clinical typical. Second, the results may be not persuasive enough due to the small sample size. However, the diagnosis of all patients with iRBD in this study was confirmed by medical history, magnetic resonance imaging and PSG, and face-to-face clinical evaluation was conducted at follow-up. Moreover, we included the cohort from the PPMI dataset to verify the findings.
CONCLUSION
The cross-sectional and prospective follow-up study showed that plasma NfL served as a valuable biomarker in identifying iRBD with high risk of conversion in a short time, and reflecting disease severity of PDRBD, and predicting cognitive, motor, autonomic function progression and phenoconversion in iRBD. Future studies with a larger sample of participants and longer follow-up period are warranted to support our findings and to confirm the role of plasma NfL in predicting disease progression in iRBD.
ACKNOWLEDGMENTS
The authors thank the patients and healthy volunteers for participating in this study and the members of the Tianjin Neurological Institute, Tianjin Medical University General Hospital, for their support. Specially, the authors thank to The Michael J. Fox Foundation and the group of academic scientists and industry partners who launched the PPMI.
FUNDING
This study was supported by the Tianjin Science and Technology Project (grant number 17ZXMFSY00180 to Rong Xue), the Science and Technology Project of the Health and Family Planning Commission in Tianjin Binhai New Area (grant number 2018BWKY019 to Xuan Zhang), the Science and Technology Young Talent Project of Tianjin Health Commission (grant number TJWJ2021YJ004 to Xuan Zhang), and Tianjin Key Medical Discipline (Specialty) Construction Project.
DATA AVAILABILITY
The data supporting the findings of this study are available on request from the corresponding author. The data are not publicly available due to privacy or ethical restrictions.
SUPPLEMENTARY MATERIAL
[1] The supplementary material is available in the electronic version of this article: https://dx.doi.org/10.3233/JPD-223519.
REFERENCES
[1] | Iranzo A , Santamaria J , Tolosa E ((2016) ) Idiopathic rapid eye movement sleep behaviour disorder: Diagnosis, management, and the need for neuroprotective interventions. Lancet Neurol 15: , 405–419. |
[2] | Hogl B , Stefani A , Videnovic A ((2018) ) Idiopathic REM sleep behaviour disorder and neurodegeneration - an update. Nat Rev Neurol 14: , 40–55. |
[3] | Galbiati A , Verga L , Giora E , Zucconi M , Ferini-Strambi L ((2019) ) The risk of neurodegeneration in REM sleep behavior disorder: A systematic review and meta-analysis of longitudinal studies. Sleep Med Rev 43: , 37–46. |
[4] | Petzold A ((2005) ) Neurofilament phosphoforms: Surrogate markers for axonal injury, degeneration and loss. J Neurol Sci 233: , 183–198. |
[5] | Bacioglu M , Maia LF , Preische O , Schelle J , Apel A , Kaeser SA , Schweighauser M , Eninger T , Lambert M , Pilotto A , Shimshek DR , Neumann U , Kahle PJ , Staufenbiel M , Neumann M , Maetzler W , Kuhle J , Jucker M ((2016) ) Neurofilament light chain in blood and CSF as marker of disease progression in mouse models and in neurodegenerative diseases. Neuron 91: , 56–66. |
[6] | Piehl F , Kockum I , Khademi M , Blennow K , Lycke J , Zetterberg H , Olsson T ((2018) ) Plasma neurofilament light chain levels in patients with MS switching from injectable therapies to fingolimod. Mult Scler 24: , 1046–1054. |
[7] | Kuhle J , Kropshofer H , Haering DA , Kundu U , Meinert R , Barro C , Dahlke F , Tomic D , Leppert D , Kappos L ((2019) ) Blood neurofilament light chain as a biomarker of MS disease activity and treatment response. Neurology 92: , e1007–e1015. |
[8] | Sandelius A , Zetterberg H , Blennow K , Adiutori R , Malaspina A , Laura M , Reilly MM , Rossor AM ((2018) ) Plasma neurofilament light chain concentration in the inherited peripheral neuropathies. Neurology 90: , e518–e524. |
[9] | Benatar M , Wuu J , Andersen PM , Lombardi V , Malaspina A ((2018) ) Neurofilament light: A candidate biomarker of presymptomatic amyotrophic lateral sclerosis and phenoconversion. Ann Neurol 84: , 130–139. |
[10] | Lu CH , Macdonald-Wallis C , Gray E , Pearce N , Petzold A , Norgren N , Giovannoni G , Fratta P , Sidle K , Fish M , Orrell R , Howard R , Talbot K , Greensmith L , Kuhle J , Turner MR , Malaspina A ((2015) ) Neurofilament light: A candidate biomarker of presymptomatic amyotrophic lateral sclerosis and phenoconversion. Neurology 84: , 2247–2257. |
[11] | Bridel C , van Wieringen WN , Zetterberg H , Tijms BM , Teunissen CE , and the NFLG, Alvarez-Cermeno JC , Andreasson U , Axelsson M , Backstrom DC , Bartos A , Bjerke M , Blennow K , Boxer A , Brundin L , Burman J , Christensen T , Fialova L , Forsgren L , Frederiksen JL , Gisslen M , Gray E , Gunnarsson M , Hall S , Hansson O , Herbert MK , Jakobsson J , Jessen-Krut J , Janelidze S , Johannsson G , Jonsson M , Kappos L , Khademi M , Khalil M , Kuhle J , Landen M , Leinonen V , Logroscino G , Lu CH , Lycke J , Magdalinou NK , Malaspina A , Mattsson N , Meeter LH , Mehta SR , Modvig S , Olsson T , Paterson RW , Perez-Santiago J , Piehl F , Pijnenburg YAL , Pyykko OT , Ragnarsson O , Rojas JC , Romme Christensen J , Sandberg L , Scherling CS , Schott JM , Sellebjerg FT , Simone IL , Skillback T , Stilund M , Sundstrom P , Svenningsson A , Tortelli R , Tortorella C , Trentini A , Troiano M , Turner MR , van Swieten JC , Vagberg M , Verbeek MM , Villar LM , Visser PJ , Wallin A , Weiss A , Wikkelso C , Wild EJ ((2019) ) Diagnostic value of cerebrospinal fluid neurofilament light protein in neurology: A systematic review and meta-analysis. JAMA Neurol 76: , 1035–1048. |
[12] | Weston PSJ , Poole T , Ryan NS , Nair A , Liang Y , Macpherson K , Druyeh R , Malone IB , Ahsan RL , Pemberton H , Klimova J , Mead S , Blennow K , Rossor MN , Schott JM , Zetterberg H , Fox NC ((2017) ) Serum neurofilament light in familial Alzheimer disease: A marker of early neurodegeneration. Neurology 89: , 2167–2175. |
[13] | Preische O , Schultz SA , Apel A , Kuhle J , Kaeser SA , Barro C , Graber S , Kuder-Buletta E , LaFougere C , Laske C , Voglein J , Levin J , Masters CL , Martins R , Schofield PR , Rossor MN , Graff-Radford NR , Salloway S , Ghetti B , Ringman JM , Noble JM , Chhatwal J , Goate AM , Benzinger TLS , Morris JC , Bateman RJ , Wang G , Fagan AM , McDade EM , Gordon BA , Jucker M , Dominantly Inherited Alzheimer N ((2019) ) Serum neurofilament dynamics predicts neurodegeneration and clinical progression in presymptomatic Alzheimer’s disease. Nat Med 25: , 277–283. |
[14] | van der Ende EL , Meeter LH , Poos JM , Panman JL , Jiskoot LC , Dopper EGP , Papma JM , de Jong FJ , Verberk IMW , Teunissen C , Rizopoulos D , Heller C , Convery RS , Moore KM , Bocchetta M , Neason M , Cash DM , Borroni B , Galimberti D , Sanchez-Valle R , Laforce R Jr., Moreno F , Synofzik M , Graff C , Masellis M , Carmela Tartaglia M , Rowe JB , Vandenberghe R , Finger E , Tagliavini F , de Mendonca A , Santana I , Butler C , Ducharme S , Gerhard A , Danek A , Levin J , Otto M , Frisoni GB , Cappa S , Pijnenburg YAL , Rohrer JD , van Swieten JC , Genetic Frontotemporal dementia I ((2019) ) Serum neurofilament light chain in genetic frontotemporal dementia: A longitudinal, multicentre cohort study. Lancet Neurol 18: , 1103–1111. |
[15] | Oosterveld LP , Verberk IMW , Majbour NK , El-Agnaf OM , Weinstein HC , Berendse HW , Teunissen CE , van de Berg WDJ ((2020) ) CSF or serum neurofilament light added to alpha-Synuclein panel discriminates Parkinson’s from controls. Mov Disord 35: , 288–295. |
[16] | Marques TM , van Rumund A , Oeckl P , Kuiperij HB , Esselink RAJ , Bloem BR , Otto M , Verbeek MM ((2019) ) Serum NFL discriminates Parkinson disease from atypical parkinsonisms. Neurology 92: , e1479–e1486. |
[17] | Lin CH , Li CH , Yang KC , Lin FJ , Wu CC , Chieh JJ , Chiu MJ ((2019) ) Blood NfL: A biomarker for disease severity and progression in Parkinson disease. Neurology 93: , e1104–e1111. |
[18] | Hansson O , Janelidze S , Hall S , Magdalinou N , Lees AJ , Andreasson U , Norgren N , Linder J , Forsgren L , Constantinescu R , Zetterberg H , Blennow K , Swedish Bio Fs ((2017) ) Blood-based NfL: A biomarker for differential diagnosis of parkinsonian disorder. Neurology 88: , 930–937. |
[19] | Wilke C , Dos Santos MCT , Schulte C , Deuschle C , Scheller D , Verbelen M , Brockmann K , von Thaler AK , Sunkel U , Roeben B , Bujac S , Metzger FG , Maetzler W , da Costa AN , Synofzik M , Berg D ((2020) ) Intraindividual neurofilament dynamics in serum mark the conversion to sporadic Parkinson’s disease. Mov Disord 35: , 1233–1238. |
[20] | Unger MM , Belke M , Menzler K , Heverhagen JT , Keil B , Stiasny-Kolster K , Rosenow F , Diederich NJ , Mayer G , Moller JC , Oertel WH , Knake S ((2010) ) Diffusion tensor imaging in idiopathic REM sleep behavior disorder reveals microstructural changes in the brainstem, substantia nigra, olfactory region, and other brain regions. Sleep 33: , 767–773. |
[21] | Scherfler C , Frauscher B , Schocke M , Iranzo A , Gschliesser V , Seppi K , Santamaria J , Tolosa E , Hogl B , Poewe W , Group S ((2011) ) White and gray matter abnormalities in idiopathic rapid eye movement sleep behavior disorder: A diffusion-tensor imaging and voxel-based morphometry study. Ann Neurol 69: , 400–407. |
[22] | Ohlhauser L , Smart CM , Gawryluk JR ((2019) ) Tract-based spatial statistics reveal lower white matter integrity specific to idiopathic rapid eye movement sleep behavior disorder as a proxy for prodromal Parkinson’s disease. J Parkinsons Dis 9: , 723–731. |
[23] | Sateia MJ ((2014) ) International classification of sleep disorders-third edition: Highlights and modifications. Chest 146: , 1387–1394. |
[24] | Postuma RB , Berg D , Stern M , Poewe W , Olanow CW , Oertel W , Obeso J , Marek K , Litvan I , Lang AE , Halliday G , Goetz CG , Gasser T , Dubois B , Chan P , Bloem BR , Adler CH , Deuschl G ((2015) ) MDS clinical diagnostic criteria for Parkinson’s disease. Mov Disord 30: , 1591–1601. |
[25] | Parkinson Progression Marker Initiative ((2011) ) The Parkinson Progression Marker Initiative (PPMI). Prog Neurobiol 95: , 629–635. |
[26] | Cui GH , Yao YH , Xu RF , Tang HD , Jiang GX , Wang Y , Wang G , Chen SD , Cheng Q ((2011) ) Cognitive impairment using education-based cutoff points for CMMSE scores in elderly Chinese people of agricultural and rural Shanghai China. Acta Neurol Scand 124: , 361–367. |
[27] | Caffarra P , Vezzadini G , Dieci F , Zonato F , Venneri A ((2002) ) Rey-Osterrieth complex figure: Normative values in an Italian population sample. Neurol Sci 22: , 443–447. |
[28] | Rouleau I , Salmon DP , Butters N , Kennedy C , McGuire K ((1992) ) Quantitative and qualitative analyses of clock drawings in Alzheimer’s and Huntington’s disease. Brain Cogn 18: , 70–87. |
[29] | Guo Q , Zhao Q , Chen M , Ding D , Hong Z ((2009) ) A comparison study of mild cognitive impairment with 3 memory tests among Chinese individuals. Alzheimer Dis Assoc Disord 23: , 253–259. |
[30] | Strauss E , Sherman EMS , Spreen O ((2006) ) A compendium of neuropsychological tests: Administration, norms, and commentary. Oxford University Press, 3rd ed, New York. |
[31] | Lu L , Bigler ED ((2000) ) Performance on original and a Chinese version of Trail Making Test Part B: A normative bilingual sample. Appl Neuropsychol 7: , 243–246. |
[32] | Goetz CG , Tilley BC , Shaftman SR , Stebbins GT , Fahn S , Martinez-Martin P , Poewe W , Sampaio C , Stern MB , Dodel R , Dubois B , Holloway R , Jankovic J , Kulisevsky J , Lang AE , Lees A , Leurgans S , LeWitt PA , Nyenhuis D , Olanow CW , Rascol O , Schrag A , Teresi JA , van Hilten JJ , LaPelle N , Movement Disorder Society URTF ((2008) ) Movement Disorder Society-sponsored revision of the Unified Parkinson’s Disease Rating Scale (MDS-UPDRS): Scale presentation and clinimetric testing results. Mov Disord 23: , 2129–2170. |
[33] | Nutt JG , Lea ES , Van Houten L , Schuff RA , Sexton GJ ((2000) ) Determinants of tapping speed in normal control subjects and subjects with Parkinson’s disease: Differing effects of brief and continued practice. Mov Disord 15: , 843–849. |
[34] | Visser M , Marinus J , Stiggelbout AM , Van Hilten JJ ((2004) ) Assessment of autonomic dysfunction in Parkinson’s disease: The SCOPA-AUT. Mov Disord 19: , 1306–1312. |
[35] | Poewe W ((2009) ) Clinical measures of progression in Parkinson’s disease. Mov Disord 24 Suppl 2: , S671–676. |
[36] | McKeith IG , Boeve BF , Dickson DW , Halliday G , Taylor JP , Weintraub D , Aarsland D , Galvin J , Attems J , Ballard CG , Bayston A , Beach TG , Blanc F , Bohnen N , Bonanni L , Bras J , Brundin P , Burn D , Chen-Plotkin A , Duda JE , El-Agnaf O , Feldman H , Ferman TJ , Ffytche D , Fujishiro H , Galasko D , Goldman JG , Gomperts SN , Graff-Radford NR , Honig LS , Iranzo A , Kantarci K , Kaufer D , Kukull W , Lee VMY , Leverenz JB , Lewis S , Lippa C , Lunde A , Masellis M , Masliah E , McLean P , Mollenhauer B , Montine TJ , Moreno E , Mori E , Murray M , O’Brien JT , Orimo S , Postuma RB , Ramaswamy S , Ross OA , Salmon DP , Singleton A , Taylor A , Thomas A , Tiraboschi P , Toledo JB , Trojanowski JQ , Tsuang D , Walker Z , Yamada M , Kosaka K ((2017) ) Diagnosis and management of dementia with Lewy bodies: Fourth consensus report of the DLB Consortium. Neurology 89: , 88–100. |
[37] | Gilman S , Wenning GK , Low PA , Brooks DJ , Mathias CJ , Trojanowski JQ , Wood NW , Colosimo C , Durr A , Fowler CJ , Kaufmann H , Klockgether T , Lees A , Poewe W , Quinn N , Revesz T , Robertson D , Sandroni P , Seppi K , Vidailhet M ((2008) ) Second consensus statement on the diagnosis of multiple system atrophy. Neurology 71: , 670–676. |
[38] | Chen J , Yang X , Zhang Y , Zheng P , Wei C , Mao Z , He W , Jin WN ((2021) ) Reference values for plasma neurofilament light chain (NfL) in healthy Chinese. Clin Chem Lab Med 59: , e153–e156. |
[39] | Hu Y , Yu SY , Zuo LJ , Cao CJ , Wang F , Chen ZJ , Du Y , Lian TH , Wang YJ , Chan P , Chen SD , Wang XM , Zhang W ((2015) ) Parkinson disease with REM sleep behavior disorder: Features, alpha-synuclein, and inflammation. Neurology 84: , 888–894. |
[40] | Niemann L , Lezius S , Maceski A , Leppert D , Englisch C , Schwedhelm E , Zeller T , Gerloff C , Kuhle J , Choe CU ((2021) ) Serum neurofilament is associated with motor function, cognitive decline and subclinical cardiac damage in advanced Parkinson’s disease (MARK-PD). Parkinsonism Relat Disord 90: , 44–48. |
[41] | Chen CH , Lee BC , Lin CH ((2020) ) Integrated plasma and neuroimaging biomarkers associated with motor and cognition severity in Parkinson’s disease. J Parkinsons Dis 10: , 77–88. |
[42] | Schultz SA , Strain JF , Adedokun A , Wang Q , Preische O , Kuhle J , Flores S , Keefe S , Dincer A , Ances BM , Berman SB , Brickman AM , Cash DM , Chhatwal J , Cruchaga C , Ewers M , Fox NN , Ghetti B , Goate A , Graff-Radford NR , Hassenstab JJ , Hornbeck R , Jack C Jr., Johnson K , Joseph-Mathurin N , Karch CM , Koeppe RA , Lee AKW , Levin J , Masters C , McDade E , Perrin RJ , Rowe CC , Salloway S , Saykin AJ , Sperling R , Su Y , Villemagne VL , Voglein J , Weiner M , Xiong C , Fagan AM , Morris JC , Bateman RJ , Benzinger TLS , Jucker M , Gordon BA , Dominantly Inherited Alzheimer N ((2020) ) Serum neurofilament light chain levels are associated with white matter integrity in autosomal dominant Alzheimer’s disease. Neurobiol Dis 142: , 104960. |
[43] | Saraste M , Bezukladova S , Matilainen M , Tuisku J , Rissanen E , Sucksdorff M , Laaksonen S , Vuorimaa A , Kuhle J , Leppert D , Airas L ((2021) ) High serum neurofilament associates with diffuse white matter damage in MS. Neurol Neuroimmunol Neuroinflamm 8: , e926. |
[44] | Sampedro F , Perez-Gonzalez R , Martinez-Horta S , Marin-Lahoz J , Pagonabarraga J , Kulisevsky J ((2020) ) Serum neurofilament light chain levels reflect cortical neurodegeneration in de novo Parkinson’s disease. Parkinsonism Relat Disord 74: , 43–49. |
[45] | Ye R , Locascio JJ , Goodheart AE , Quan M , Zhang B , Gomperts SN ((2021) ) Serum NFL levels predict progression of motor impairment and reduction in putamen dopamine transporter binding ratios in de novo Parkinson’s disease: An 8-year longitudinal study. Parkinsonism Relat Disord 85: , 11–16. |
[46] | Backstrom D , Linder J , Jakobson Mo S , Riklund K , Zetterberg H , Blennow K , Forsgren L , Lenfeldt N ((2020) ) NfL as a biomarker for neurodegeneration and survival in Parkinson disease. Neurology 95: , e827–e838. |
[47] | Canaslan S , Schmitz M , Villar-Pique A , Maass F , Gmitterova K , Varges D , Lingor P , Llorens F , Hermann P , Zerr I ((2021) ) Detection of cerebrospinal fluid neurofilament light chain as a marker for alpha-synucleinopathies. Front Aging Neurosci 13: , 717930. |
[48] | Zhang L , Cao B , Hou Y , Gu X , Wei Q , Ou R , Zhao B , Luo C , Shang H ((2022) ) Neurofilament light chain predicts disease severity and progression in multiple system atrophy. Mov Disord 37: , 421–426. |
[49] | Nguyen TT , Cheng JS , Chen YL , Lin YC , Tsai CC , Lu CS , Weng YH , Wu YM , Hoang NT , Wang JJ ((2021) ) Fixel-based analysis of white matter degeneration in patients with progressive supranuclear palsy or multiple system atrophy, as compared to Parkinson’s disease. Front Aging Neurosci 13: , 625874. |


