
Cognitive Performance and Learning Parameters Predict Response to Working Memory Training in Parkinson’s Disease
Abstract
Background:
Working memory (WM) training (WMT) is a popular intervention approach against cognitive decline in patients with Parkinson’s disease (PD). However, heterogeneity in WM responsiveness suggests that WMT may not be equally efficient for all patients.
Objective:
The present study aims to evaluate a multivariate model to predict post-intervention verbal WM in patients with PD using a supervised machine learning approach. We test the predictive potential of novel learning parameters derived from the WMT and compare their predictiveness to other more commonly used domains including demographic, clinical, and cognitive data.
Methods:
37 patients with PD (age: 64.09±8.56, 48.6% female, 94.7% Hoehn & Yahr stage 2) participated in a 5-week WMT. Four random forest regression models including 1) cognitive variables only, 2) learning parameters only, 3) both cognitive and learning variables, and 4) the entire set of variables (with additional demographic and clinical data, ‘all’ model), were built to predict immediate and 3-month-follow-up WM.
Result:
The ‘all’ model predicted verbal WM with the lowest root mean square error (RMSE) compared to the other models, at both immediate (RMSE = 0.184; 95% -CI=[0.184;0.185]) and 3-month follow-up (RMSE = 0.216; 95% -CI=[0.215;0.217]). Cognitive baseline parameters were among the most important predictors in the ‘all’ model. The model combining cognitive and learning parameters significantly outperformed the model solely based on cognitive variables.
Conclusion:
Commonly assessed demographic, clinical, and cognitive variables provide robust prediction of response to WMT. Nonetheless, inclusion of training-inherent learning parameters further boosts precision of prediction models which in turn may augment training benefits following cognitive interventions in patients with PD.
INTRODUCTION
Cognitive decline is a common, debilitating non-motor symptom in patients with Parkinson’s disease (PD), which is the second most frequent neurodegenerative disorder of older age [1]. Working memory (WM), executive functions, and attention are frequently impaired cognitive domains across various disease stages [2–4]. WM training (WMT) is the most empirically investigated cognitive training approach across the lifespan [5] due to the strong association of WM with fluid intelligence [6] and daily functioning [7]. WMT delivers reliable medium to large direct training effects and elicits small to medium near-transfer effects [5, 8, 9]. However, positive far-transfer effects by WMT are strongly debated nowadays as considerable heterogeneity in training effects suggests that WMT may not be equally efficient in all participants [8].
Recent randomized controlled trials (RCT) investigating WMT in PD [10, 11], addressed heterogeneity of WMT response by identifying potential predictors of the treatment response including, e.g., cognitive performance at baseline, age, and fluid intelligence. However, large proportions of variance in training response remain unexplained when using traditional statistical methods [10, 12]. In the context of recent machine learning studies, learning performance during cognitive training has recently been used as a behavioral proxy in combination with neuroimaging to monitor response to cognitive training in psychosis [13–15]. In healthy aging, higher gains in tasks trained during WMT are associated with higher transfer effects in both near- and far-transfer outcomes [16–19], yet training recommendations to patients with PD lack an individual signature needed to maximize patients’ benefit from WMT. The informed identification of patients with a positive response to WMT may allow early, personalized interventions (‘precision medicine’ instead of ‘one-size-fits-all’) to delay the onset and progression of cognitive decline in the domain of WM in PD [20].
However, it remains unclear to what extent demographic and clinical characteristics, cognitive performance at baseline, and training-inherent learning performance are useful in predicting WMT response in patients with PD. In this study we aim 1) to elucidate the predictive pattern joining data from several domains (demographic combined with clinical variables, cognitive data, and training-inherent learning performance) using a random forest regression algorithm in a sample of PD patients [11] and 2) to compare predictiveness of single and combined data domains to identify the most informative combination of features. The latter may help to pave a more efficient path to the real-world therapeutic setting, as the availability and accessibility of information from these data domains also highly varies between data domains.
METHODS
Study design
The original study [11] was designed as a single-blind RCT to evaluate the efficacy of a 5-week computerized WMT compared to a waiting list control group (CG). Clinical and cognitive assessments took place at baseline, the week after the 5-week training/waiting period (POST), and at 3-month follow-up (FU).
The study protocol was approved by the local ethics committee of the Medical Faculty of the University of Cologne (vote-no.16-043), conducted in compliance with the Helsinki Declaration of 1975, as revised in 2008, and registered with the German Clinical Trials Register (drks.de, DRKS00009379). All participants gave written informed consent before participation. The reporting of the original RCT [11] followed the CONSORT (Consolidated Standards of Reporting Trials) guidelines.
Participants
Participants were recruited at the University Hospital of Cologne, Germany, as well as through regional neurologists and PD support groups. Participants of the present study met the following inclusion criteria: 1) age between 45 and 85 years, 2) diagnosis of idiopathic PD according to UK brain bank criteria [21], and 3) normal or corrected-to-normal vision and hearing. Exclusion criteria were 1) cognitive dysfunctions according to the Level-II diagnostic criteria for PD-MCI [22] or PD dementia [23], 2) severe depressive symptoms measured by the Geriatric Depression Scale (GDS≥11) [24], and/or 3) deep brain stimulation and other reported psychiatric, neurological, and life-threatening diseases. Included patients were randomized to either the WMT group (n = 37) or CG (n = 39). 37 patients of the WMT group and 38 patients of the CG completed the POST assessment, 35 patients of the WMT group, and 37 patients of the CG completed the FU assessment.
For the present predictive analyses, we included all patients who successfully completed the WMT, i.e., all n = 37 patients of the WMT group. On average, the patients attended 24.27 (SD = 1.59) out of max. 25 training sessions, with a minimum of 19 training sessions. They were 64.09 (SD = 8.56) years old, 48.6% female, with a disease onset 6.13 (SD = 4.39) years ago and most patients showing mild to moderate motor impairment (94.7% Hoehn & Yahr [25] (H&Y) stage 2, part 3 of the Unified Parkinson's Disease Rating Scale (UPDRS-III) M = 28.70, SD = 7.97). Scores in the Montr
Table 1
Overview and descriptives of features in the four random forest regression models ‘all’, ‘cog/learning’, ‘cog’, and ‘learning’
| Feature | All | Cog/learning | Cog | Learning | WMT (n = 37) | CG (n = 38) |
| Cognition | ||||||
| Verbal working memory PRE | X | X | X | –0.07 (0.60) | 0.26 (0.61) | |
| Non-verbal working memory PRE | X | X | X | –0.20 (0.56) | –0.05 (0.58) | |
| Executive functions PRE | X | X | X | 0.31 (0.56) | 0.43 (0.46) | |
| Attention PRE | X | X | X | 0.40 (0.73) | 0.52 (0.58) | |
| Verbal memory PRE | X | X | X | –0.04 (0.79) | 0.16 (0.68) | |
| Visuo-cognition PRE | X | X | X | –0.59 (0.90) | –0.08 (0.99) | |
| Fluid intelligence PRE (LPS-4) | X | X | X | 0.38 (1.06) | 0.43 (0.83) | |
| Montr
| X | X | X | 27.03 (1.71) | ||
| Learning | ||||||
| Intercept simple span* | X* | X* | X* | 4069.66 (1220.86) | - | |
| Slope simple span | X | X | X | 100.17 (59.63) | - | |
| Intercept complex span | X | X | X | 3010.25 (1720.92) | - | |
| Slope complex span | X | X | X | 157.93 (71.55) | - | |
| Intercept n-back | X | X | X | 3080.94 (1473.00) | - | |
| Slope n-back | X | X | X | 145.98 (65.14) | - | |
| Demographic | ||||||
| Age | X | 64.09 (8.56) | 63.88 (8.39) | |||
| Sex | X | 48.6% female | 44.7% female | |||
| Education | X | 15.23 (2.96) | 15.83 (2.56) | |||
| Clinical | ||||||
| Years since PD diagnosis* | X* | 6.13 (4.39) | 6.59 (6.06) | |||
| Drug therapy years | X | 6.11 (4.41) | 6.46 (6.00) | |||
| LEDD | X | 674.50 (420.46) | 588.13 (423.57) | |||
| Self-efficacy expectancy PRE (SWE) | X | 49.11 (9.57) | 53.64 (11.24) | |||
| Depression PRE (GDS) | X | 2.08 (1.74) | 2.29 (2.38) | |||
| PD motor symptoms PRE (UPDRS-III) | X | 28.70 (7.96) | 29.45 (8.73) |
Data are mean (SD) of composite scores of cognitive domains unless indicated otherwise. Cognitive domain composite scores were computed as the average of the corresponding equally weighted single test z-scores based on published normative data. For details, refer to Ophey et al. (2020). CG, control group; GDS, Geriatric Depression Scale; LEDD, Levodopa equivalent daily dose; PD, Parkinson’s disease; PRE, baseline examination; SWE, Skala zur Allgemeinen Selbstwirksamkeitserwartung / General Self-Efficacy Scale; UPDRS-III, Unified Parkinson’s Disease Rating Scale Part 3; WMT, working memory training group. *excluded due to high collinearity to other predictors (Spearman’s rho > 0.80; Supplementary Figure 2).
WMT intervention
The computerized WMT was compiled on the basis of the online multi-domain cognitive training program NeuroNation (https://www.neuronation.com, Synaptikon GmbH, Berlin, Germany) and consisted of five WM tasks per one daily training session selected out of a total of nine different WM tasks (for a detailed description of the tasks, see Supplementary Material 1). The nine WM tasks can be classified according to the underlying WM paradigm, e.g., simple and complex span tasks, as well as n-back tasks [27], which hold different requirements on processing resources. According to this classification, three tasks can be regarded as simple span tasks, one task was a pure n-back task, and five tasks were complex span tasks, especially addressing the executive component of WM processes (see Supplementary Material 1). The WMT was accessed online and administered at home for 30 min a day, five days a week, over five weeks and adapted to user performance across training sessions. The patients did not have access to the training platform between POST and 3-month FU assessments and they were instructed not to engage in any additional cognitive training activities during this time.
2.4Learning, neuropsychological, and clinical parameters
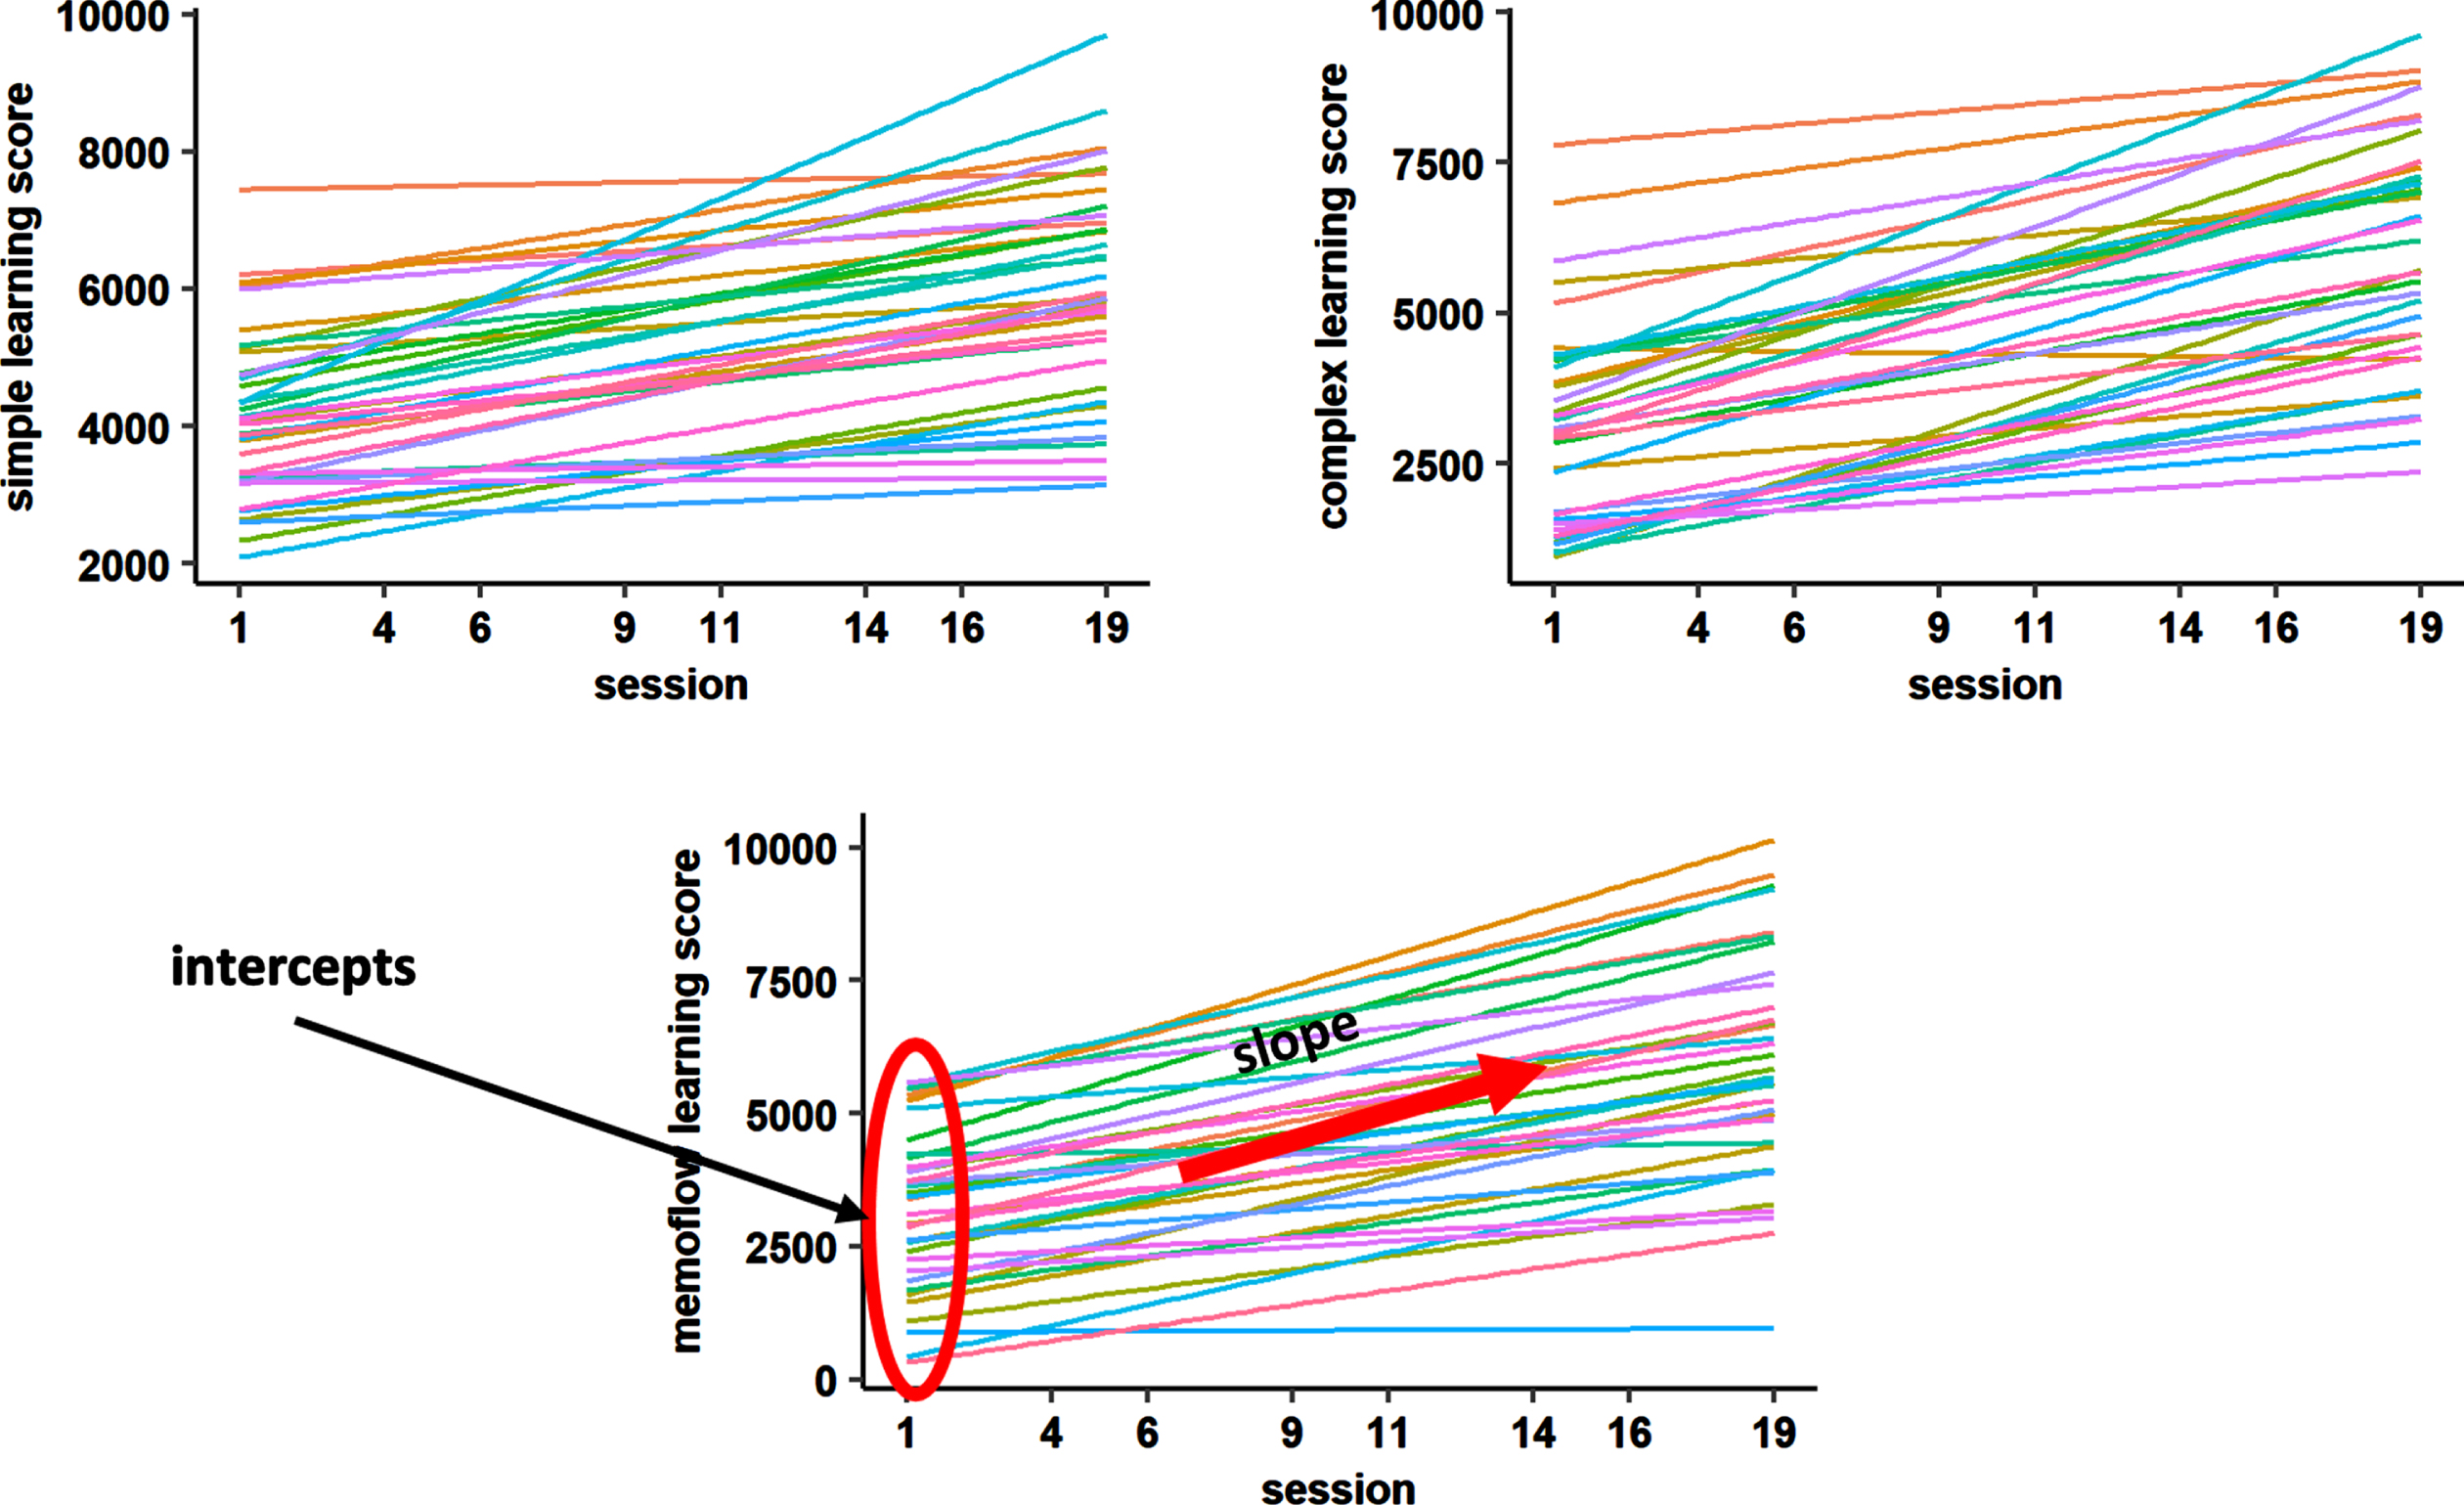
Training-inherent learning performance was tracked via NeuroNation for each of the five trained tasks per training day. For each task, a performance score was given, which represented the sum of all correct answers given within the exercise adjusted for the initial difficulty of the exercise during the training session (the higher the initial difficulty, the more points are given). For the present analyses, we used the min-max normalized scores of the NeuroNation output, which allow to compare task performance across the different WM exercises and training sessions, as the initial performance scores are transformed to a similar range across exercises. Three equally weighted composite scores were built according to the previously described classification of WM paradigms into simple span, complex span, and n-back tasks (see Supplementary Material 1). As applied in previous research [16], two learning parameters per composite score of trained task performance were extracted for each participant based on a linear model fitted to the trained task performance: the ‘intercept’ corresponding to the initial performance level in the first training session and the ‘slope’ corresponding to the change in performance over time (Fig. 1).
Fig. 1
Linear models fitted to learning performance of each participant for each composite score. To extract the learning parameters for each individual, we fitted a linear model to the learning performance curve of each participant (different colors) for training sessions 1, 4, 6, 9, 11, 14, 16, 19. Individual slope and intercept parameters were used as predictors in the random forest regression models.
Outcome raters were blinded for group allocation, patients were not. The WM domain as a near-transfer measure was assessed by several single tests with parallel test forms, if available, including both paper-pencil assessments and computer tests. Two WM composite scores were computed as the average of the corresponding equally weighted single test z-scores based on published normative data of age-, sex-, and education-matched healthy controls. Verbal WM as the primary outcome of the present analyses was assessed by the digit span forward and backward task (Wechsler Memory Scale revised) [28], and the n-back verbal task (Wiener Testsystem) [29]. For details on further cognitive composite scores (non-verbal WM, executive functions, attention, verbal memory, visuo-cognition), which were used as predictors in the present analyses, see Ophey et al. [11]. The reported composite scores can be interpreted as regular z-scores with M = 0 and SD = 1, i.e., a score of 0 represents average performance, negative scores represent worse performance and positive scores represent better performance than the normative population—independent of age, sex, and education, respectively.
The Levodopa Equivalent Daily Dose (LEDD) [30] and years of PD drug therapy, which can be regarded as a proxy for disease duration, were recorded. During all assessments, patients were on their regular dopaminergic PD medication, and the majority of assessments was conducted in the patients’ medication “ON” state. Motor impairment was assessed with the UPDRS-III [31] and the H&Y [25] scale. Furthermore, patients’ questionnaires examining depressive symptoms (GDS) [24] and self-efficacy expectancy (SWE) (German version [32], English version [33]) were considered in the set of predictors (Table 1).
Predictive modeling
We built four single models based on single or combined cognitive, learning, clinical, and demographic data domains to evaluate their individual contribution to the prediction of verbal WM at POST and FU. The ‘cog’ model consists of variables assessing baseline performance in verbal and non-verbal WM, executive functions, attention, verbal memory, visuo-cognition, fluid intelligence, and global cognition. The ‘learning’ model includes slope and intercept parameters for each composite score (simple span, complex span, n-back). The ‘cog/learning’ model describes the combination of the ‘cog’ and ‘learning’ variables and the ‘all’ model additionally includes clinical and demographic information (Table 1). The ‘cog’ model could be estimated based on a standard face-to-face cognitive assessment performed by a neuropsychologist and the ‘learning’ model could be estimated entirely remotely during the WMT. The ‘all’ model could be estimated based on an elaborated face-to-face clinical and cognitive assessment performed by physicians and neuropsychologists additionally including data from the remote WMT.
We used random forest regression as implemented in the R package ‘ranger’ [34] (version 0.13.1) to build the prediction models and to evaluate their performance. In the random forest regression, decision trees are generated based on random subsets of observations in the data set (= bagging). In each decision tree the algorithm repetitively splits the high-dimensional data set at each node based on their most predictive variable within a random subset of the predictors until a certain criterion is reached. A prediction is achieved by integrating the individual predictions of each decision tree. We specified the number of trees generated (N = 1000; sample fraction = 1; sampling with replacement) and the number of possible splitting variables at each node (mtry = square root of number of predictor variables; minimum node size = 5) in accordance with previous recommendations [35]. Predictors were inspected for collinearity to reduce feature space and to avoid biases in model interpretation (Supplementary Figure 2) prior to random forest regression. We excluded the variables ‘years since PD diagnosis’ and ‘intercept simple span’ due to high collinearity to other predictors (Spearman’s rho > 0.80).
Model performance was quantified by root mean square error (RMSE) prediction error, which was calculated by the root of the squared average difference of predicted value based on the model and the actual value. To assess the generalizability of the model, we further calculated the out-of-bag (OOB) prediction error OOB, which represents the performance of the random forest model with respect to observations unseen during the model generation process (for details, see Supplementary Material 2). For both model performance metrics, RMSE and OOB, lower scores represent a better fit of a given model to a dataset.
Predictors were ranked by importance as quantified by the reduction in variance when this predictor was used for splitting the data set [34]. Higher reduction in variance suggests higher importance for regression. The feature importance was estimated using the impurity approach implemented in ‘ranger’ [34]. To assess the stability of our prediction models we used a resampling approach (Niteration =1000; without replacement) selecting a random subset of 80% (N = 30) of the total sample per iteration. Missing data across all predictor variables (∼0.5%) was imputed within each subset of the resampling scheme by median as it shows less bias for extreme values.
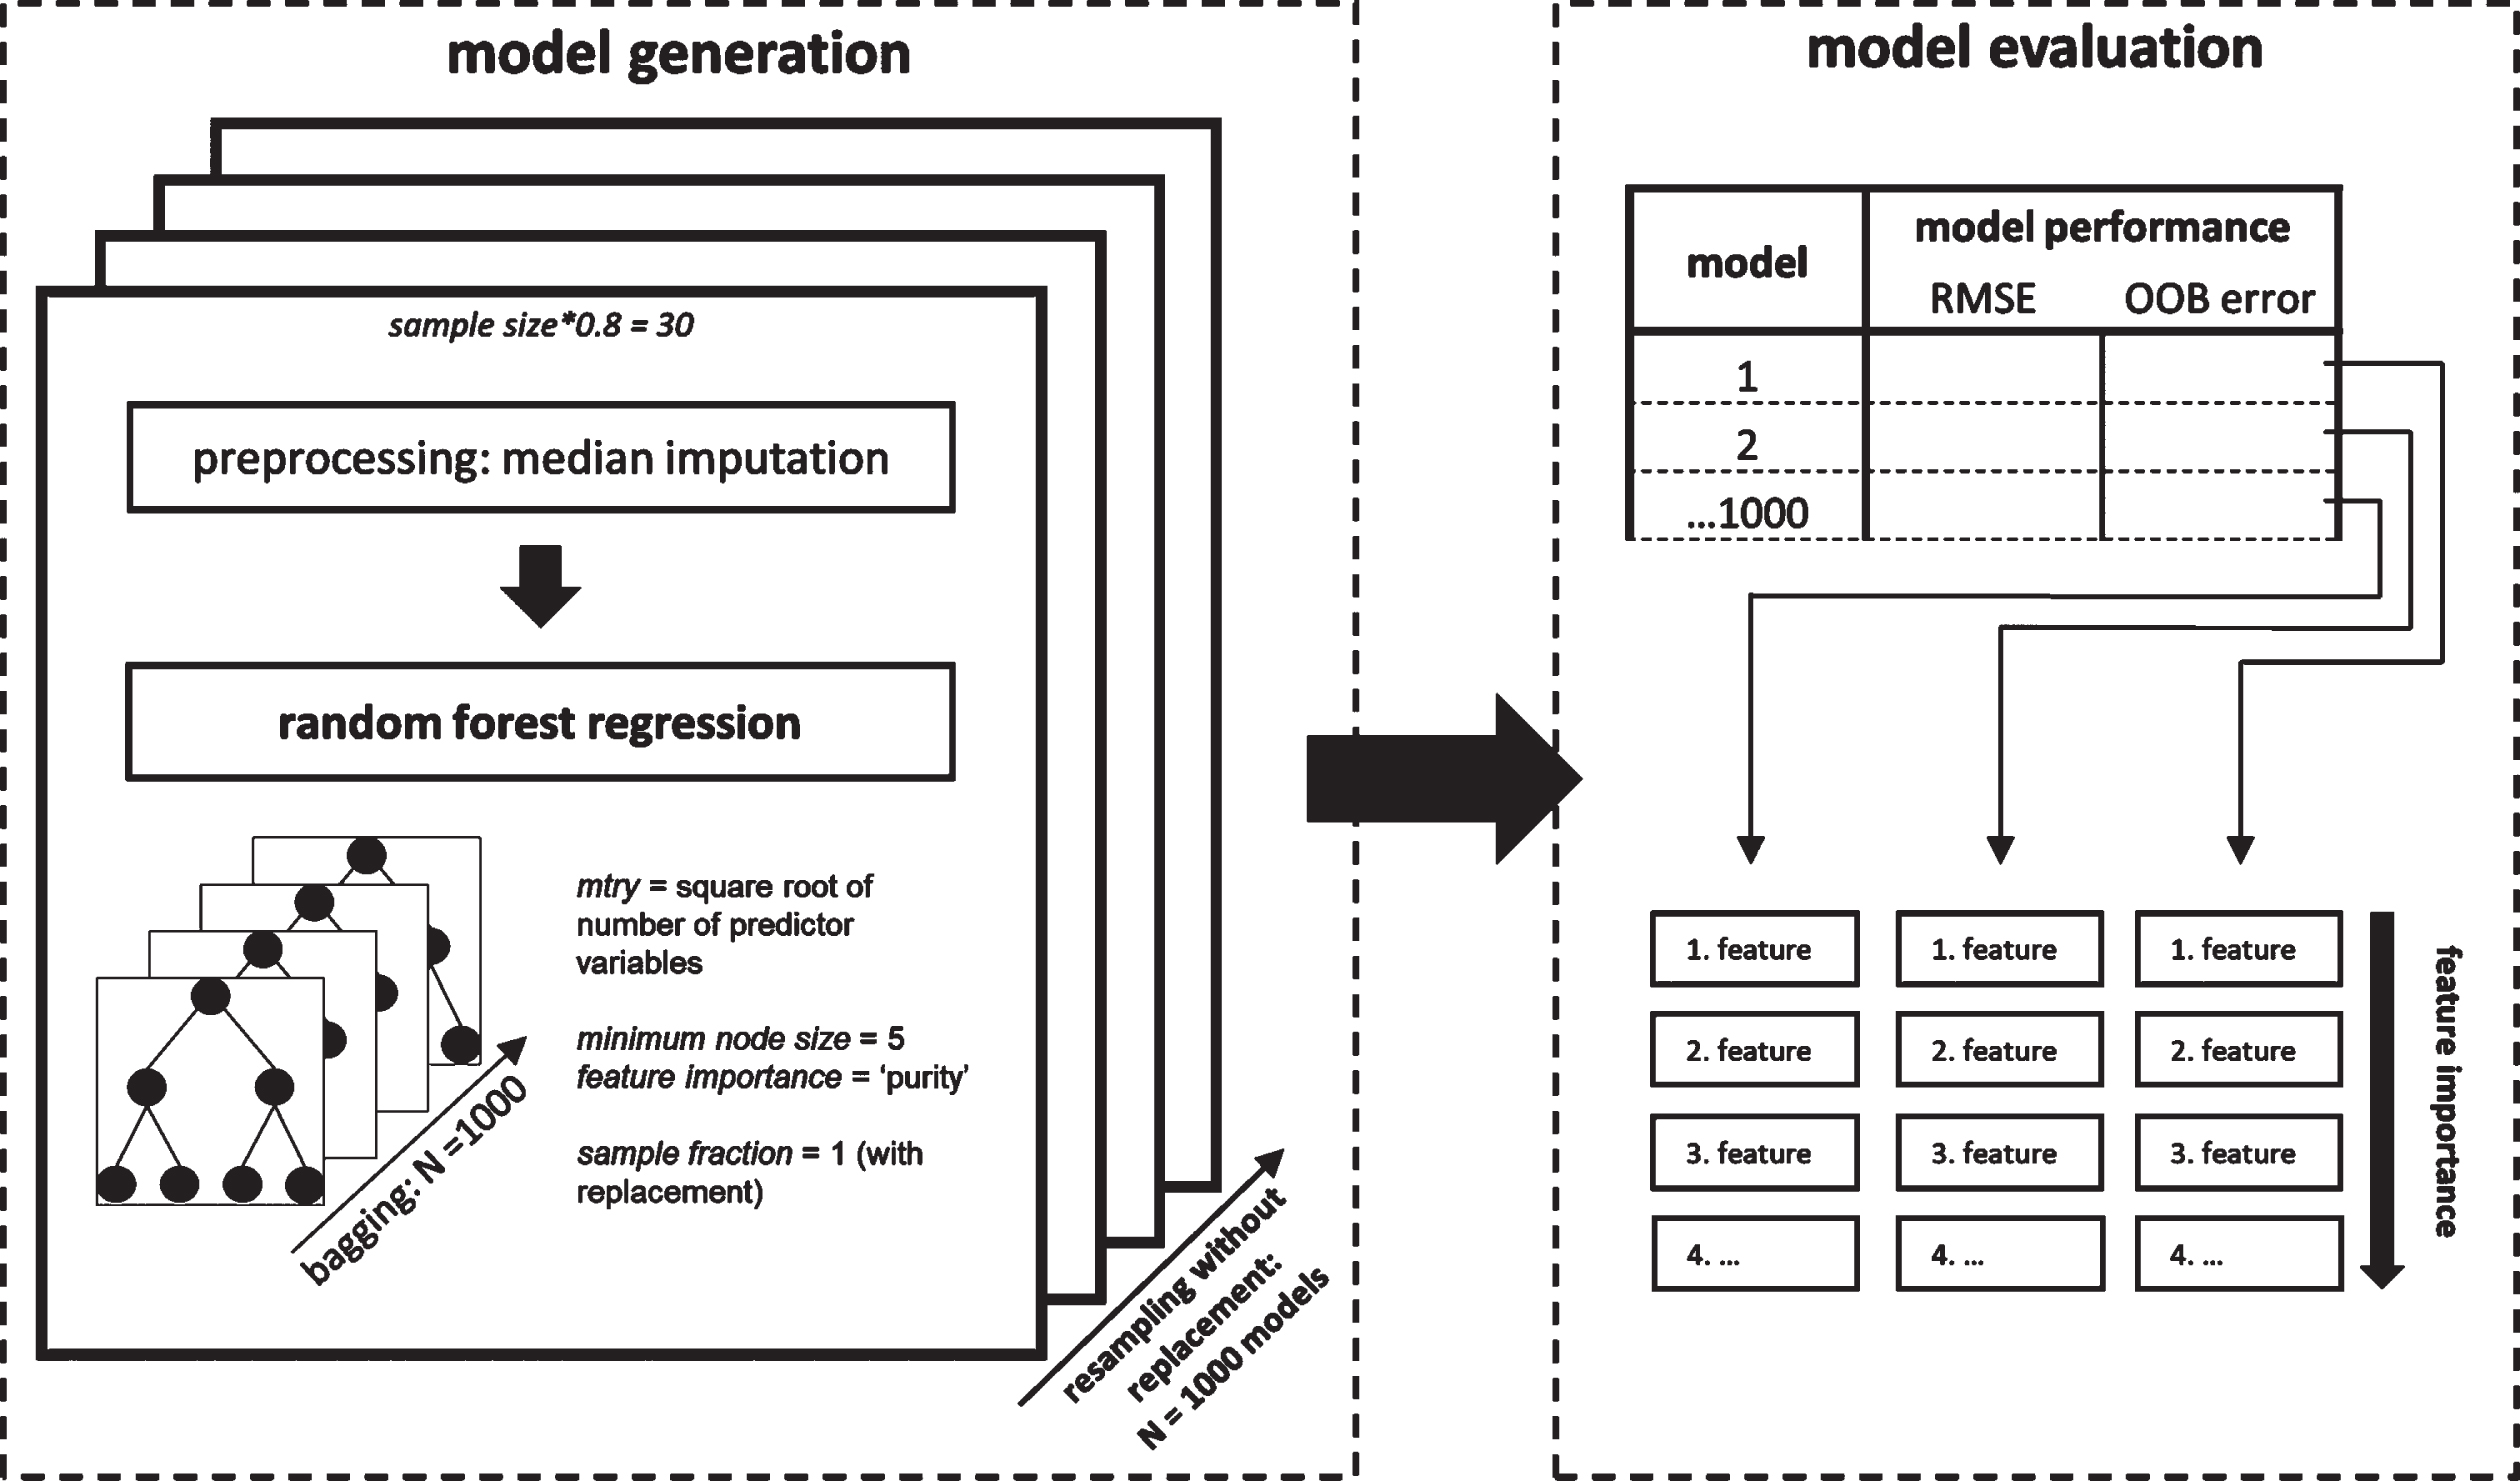
Finally, we calculated pairwise permutation tests to compare performance between the different predictor models generated by the resampling using the ‘rcompanion’-package [36] in R and corrected p-values for multiple comparisons using Bonferroni correction [37]. Cohen’s d was reported as the effect size of the pairwise permutation tests indicating small (d≥0.2), moderate (d≥0.5), or strong (d≥0.8) effects. The random forest regression analysis procedure is visualized in Fig. 2.
Fig. 2
Random forest regression analysis procedure. Random forest regression models were generated embedded in a resampling scheme (left). For each iteration of the resampling that contained 80% of the total sample, variables were median imputed prior to running the random forest algorithm. Each generated model was evaluated based on two model performance indicators and with respect to their feature importance using the ‘impurity’ measure of the ranger package (right).
RESULTS
Details on prior analyses regarding the general efficacy, as well as neural correlates of WM and WMT are reported in Ophey et al. [11], Giehl et al. [38], and Giehl et al. [39]. Table 2 presents the descriptive data for the cognitive domains across baseline, POST, and 3-month FU assessments for the WMT group and the CG. As reported in Ophey et al. [11], repeated-measures, linear mixed-effects models revealed positive training effects for the WMT group compared to the waiting list CG in verbal WM with a small relative effect size 0.39 (95%-Confidence Interval CI = [0.05;0.76]) for the 3-months follow-up only. No other reliable training effects on cognitive and clinical variables were found for either point of time.
Table 2
Descriptive statistics of cognitive outcomes across the working memory training
| PRE | POST | 3-month FU | ||||
| WMT (n = 37) | CG (n = 38) | WMT (n = 37) | CG (n = 38) | WMT (n = 35) | CG(n = 37) | |
| Verbal working memory | –0.07 (0.60) | 0.26 (0.61) | 0.10 (0.49) | 0.39 (0.59) | 0.25 (0.57) | 0.31 (0.58) |
| Non-verbal working memory | –0.20 (0.56) | –0.05 (0.58) | –0.01 (0.51) | 0.07 (0.57) | –0.02 (0.50) | 0.08 (0.60) |
| Executive functions | 0.31 (0.56) | 0.43 (0.46) | 0.40 (0.41) | 0.44 (0.44) | 0.44 (0.52) | 0.46 (0.46) |
| Verbal memory | –0.04 (0.79) | 0.16 (0.68) | 0.67 (0.84) | 0.77 (0.74) | 0.75 (0.95) | 0.94 (0.65) |
| Attention | 0.40 (0.73) | 0.52 (0.58) | 0.51 (0.65) | 0.57 (0.62) | 0.53 (0.59) | 0.63 (0.55) |
| Visuo-cognition | –0.59 (0.90) | –0.08 (0.99) | –0.41 (1.04) | –0.33 (1.06) | –0.40 (1.02) | –0.59 (0.98) |
| Fluid intelligence (LPS-4) | 0.38 (1.06) | 0.43 (0.83) | 0.46 (0.75) | 0.14 (0.76) | 0.52 (0.99) | 0.50 (0.97) |
Data are mean (SD) of composite scores of cognitive domains unless indicated otherwise. Cognitive domain composite scores were computed as the average of the corresponding equally weighted single test z-scores based on published normative data. For details, refer to Ophey et al. (2020). CG, control group; FU, follow-up; LPS-4, Leistungsprüfsystem subtest 4: logical reasoning, version 50 + for patients aged≥50 years; WMT, working memory training group.
Predictive modeling
The ‘all’ model predicted verbal WM with the lowest RMSE prediction error (‘all’ vs. ‘cog/learning’: p < 0.001) followed by the combination of the cognitive and the ‘learning’ model (‘cog/learning’ vs. ‘cog’: p < 0.001), the cognitive solely model (‘cog’ vs. ‘learning’: p < 0.001) and the ‘learning’ solely model (Fig. 3; Table 3). This result is common to both timepoints (POST, 3-month FU). The RMSE prediction error of the ‘all’ model was 0.184 (95% -CI=[0.184;0.185]) at POST and 0.216 (95% -CI=[0.215;0.217]) at FU. Results of the OOB prediction error are presented in the Supplementary Material 2 and visualized in Supplementary Figure 3. RMSE prediction errors of the four evaluated models at POST and FU, as well as predictor ranks of variables in the ‘all’ model including clinical, demographic, cognitive, and learning variables are visualized in Fig. 3.
Fig. 3
Random forest regression model prediction for verbal working memory at POST and 3-month FU. We used random forest regression to evaluate the predictive performance of different subsets of predictor variables: cognitive (‘cog’), ‘learning’, clinical, and demographic (‘all’). The graph shows the performance of the models generated through resampling (N = 1000) measured by root mean square error (RMSE) and the feature importance (impurity approach) of the ‘all‘ model for the prediction of verbal working memory at timepoints (A) POST and (B) 3-month FU. For both time points each Bonferroni-corrected pairwise model comparison was significant (pbonferroni <0.001, for effect sizes, see Table 3). PRE, baseline; WM, working memory.
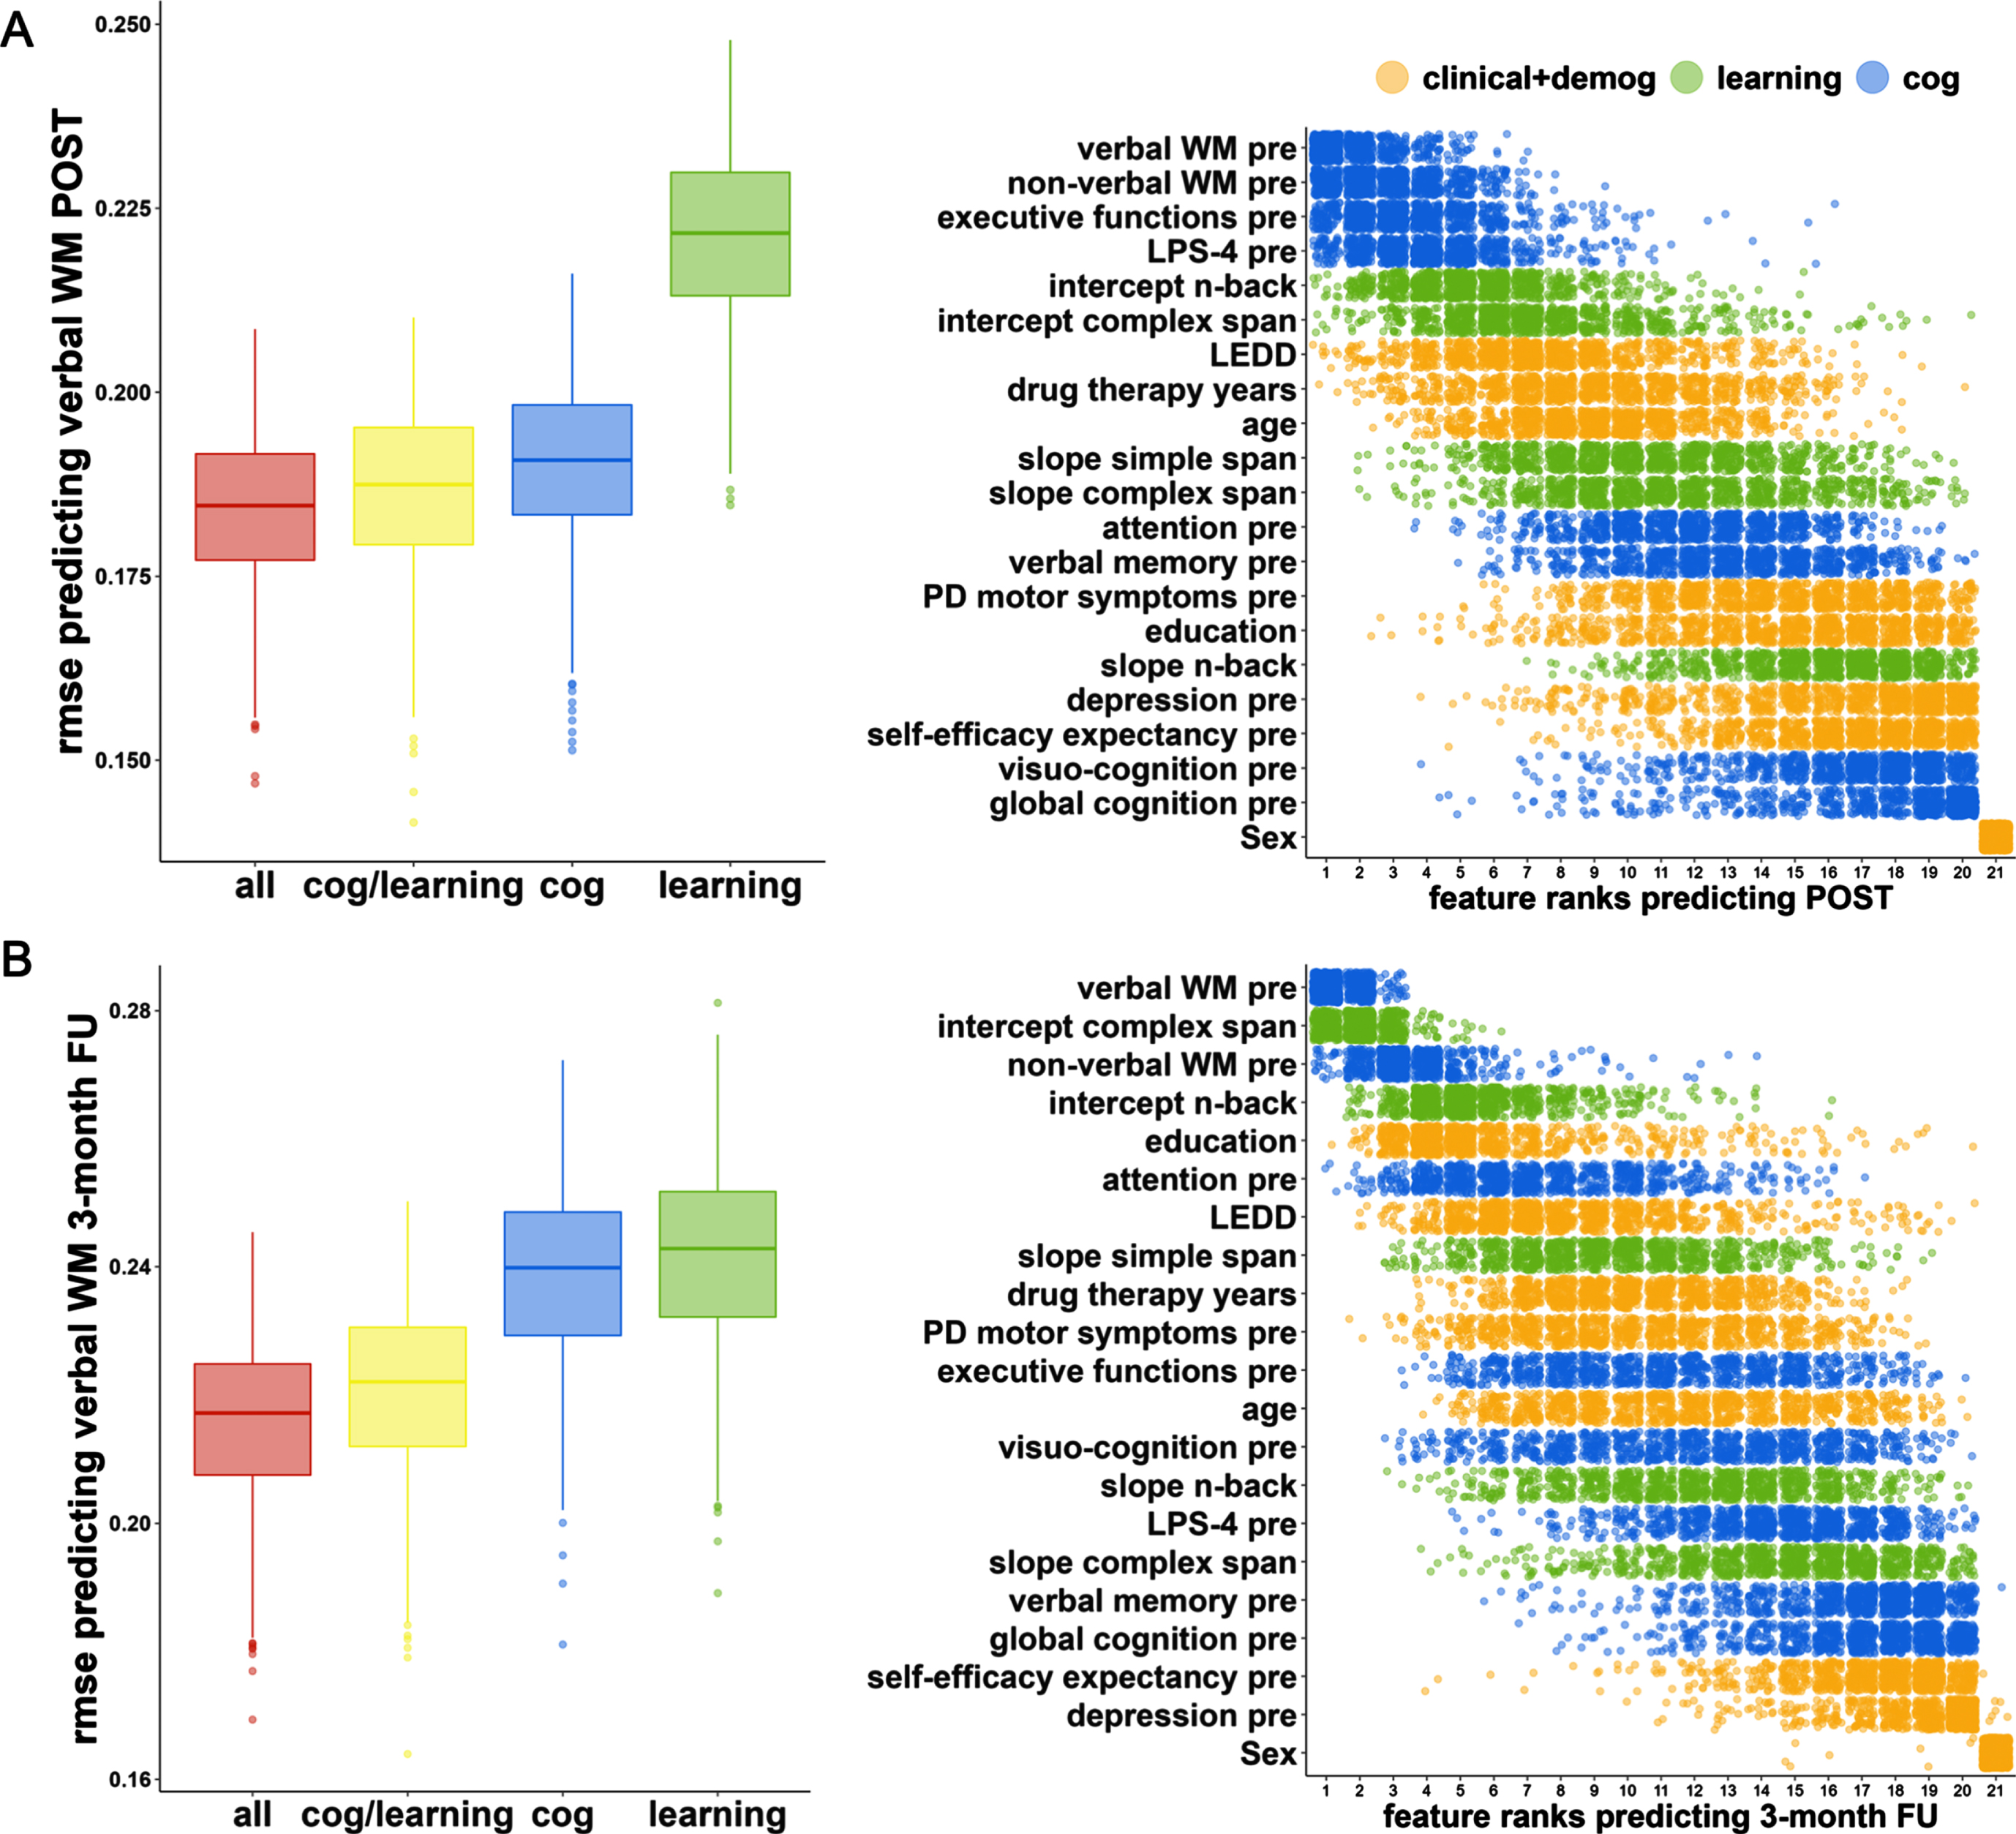
Table 3
Comparison of model performance (RMSE) by pairwise permutation tests
| Permutation Test | Effect Size | |||||
| POST | 3-month FU | POST | 3-month FU | |||
| statistic | p* | statistic | p* | Cohen’s d | Cohen’s d | |
| ’all’ vs. ‘cog/learning’ | –5.68 | <0.001 | –8.49 | <0.001 | 0.26 | 0.39 |
| ’all’ vs. ‘cog’ | –12.13 | <0.001 | –29.43 | <0.001 | 0.56 | 1.75 |
| ’all’ vs. ‘learning’ | –38.37 | <0.001 | –30.82 | <0.001 | 3.34 | 1.90 |
| ’cog/learning’ vs. ‘cog’ | –6.33 | <0.001 | –24.99 | <0.001 | 0.29 | 1.35 |
| ’cog/learning’ vs. ‘learning’ | –37.00 | <0.001 | –27.02 | <0.001 | 2.94 | 1.52 |
| ’cog’ vs. ‘learning’ | –36.07 | <0.001 | –4.78 | <0.001 | 2.73 | 0.21 |
*Bonferroni corrected.
The ten most important predictors for POST WM comprised four cognitive baseline predictors (verbal WM, non-verbal WM, executive functions, fluid intelligence, rank 1-4), three learning parameters (intercept n-back, intercept complex span, slope simple span, rank 5-6, 9), two clinical variables (dopaminergic medication, drug therapy years, rank 7 + 10), and one demographic characteristic (age, rank 8). The ten most important predictors for FU WM included three cognitive baseline variables (verbal WM, non-verbal WM, attention, rank 1 + 3+6), the same three learning parameters as for POST WM (intercept n-back, intercept complex span, slope simple span, rank 2 + 4+8), three clinical variables (dopaminergic medication, drug therapy years, motor impairment, rank 7 + 9-10), and one demographic characteristic (education, rank 5).
At POST and FU effect sizes between the ‘all’ model and the ‘cog/learning’ model were small (Cohen’s ds≤0.39), and medium to large in comparison to the ‘cog’ and ‘learning’ model (Cohen’s ds≥0.56). The combined ‘cog/learning’ model significantly outperformed the ‘cog’ model with a small effect size at POST-test (Cohen’s d = 0.29), however, with a large effect size at FU (Cohen’s d = 1.35).
DISCUSSION
The present study generated and compared multivariate models that aim to predict responsiveness to WMT in patients with PD using learning parameters in addition to cognitive, clinical, and demographic characteristics. General WMT effects in our previous study [11] were limited to the domain of verbal WM, while no other cognitive domains improved in the WMT group relative to the passive waiting list CG. For this reason, in the current study we applied the random forest model to predict response to WMT in patients with PD. The model using the entire set of prognostic variables reached the best performance among other models using the cognitive and/or learning subset only. While the learning model could not outperform the combined model including all the variables, the training-inherent learning characteristics further refined the performance of the cognitive model.
Cognitive variables at baseline, especially the verbal WM score, had the highest feature importance among the investigated set of predictors for verbal WM immediate and 3-month FU intervention scores. Moreover, executive functions at baseline and fluid intelligence followed in the hierarchy of the feature importance at immediate FU, delineating how general cognitive ability complements task-specific requirements represented by verbal WM [6]. A recent large-scale analysis of cognitive training data from more than 36,000 individuals revealed a latent general ability factor determining the improvement in later stages of training, whereas several task-specific factors determined initial training performance [40]. Notably, only the WM composites stay within the most important feature ranks at 3-month FU, possibly indicating a less strong predictiveness of general cognitive abilities at 3-month FU.
In our analyses, we evaluated the single feature importance of our investigated learning parameters, i.e., intercepts and slopes of three composite scores summarizing performance across training sessions of nine training tasks. Our results reveal higher importance of the composite intercepts than the corresponding slopes for both immediate and 3-month FU WM. The intercepts may represent a general proxy for WM performance at baseline, which is why their feature importance appears comparable to that of cognitive baseline scores. However, the intercept parameters do not contain information about the training improvement over time, which is inherently represented in the slope parameters. Our results indicate that baseline performance in either standard cognitive assessments or training-inherent tasks can strongly predict immediate and 3-month FU performance. In turn, it could be derived that the improvement in performance of the training tasks itself was less heterogeneous and therefore less predictive across participants than their individual baseline performance.
Importantly, the predictiveness of learning parameters seems to change over time. For immediate and 3-month FU verbal WM performance, models containing the entire set of behavioral predictors yielded the best model performance, followed by the model combining cognitive baseline performance and learning parameters. While the model using cognitive parameters alone and the model combining cognitive and learning parameters show almost comparable predictive performance immediately after the intervention, the combination of cognitive and learning parameters largely outperformed the model using cognitive baseline parameters alone at 3-month FU. This indicates a stronger predictive importance of learning parameters for long-term WMT outcome compared to immediate WMT outcome, which may indicate that task-general processes acquired during WMT influence performance beyond the training period [40]. The increased predictive value of the learning parameters at FU is also reflected in higher ranks of feature importance. This is in accordance with findings of previous correlational WMT analyses [12] that revealed how individual differences in demographic, cognitive, and clinical variables become less important from immediate to 3-month FU examination. The present study including learning parameters therefore may contribute to closing the gap in understanding the factors influencing response to WMT in patients with PD by revealing associative relationships between individual patient characteristics and cognitive performance. Furthermore, in healthy aging, Bürki et al. [16] showed that near- and far-transfer outcomes were linked to both learning intercepts and slope beyond common proxies for general functioning such as fluid intelligence and the potential to engage in cognitive plasticity, which is potentially reflected in age.
Among clinical variables, the dopaminergic medication (measured as the LEDD [30]), years of drug therapy, and PD motor impairment (measured with the UPDRS-III [31]) were among the most important features in the model including the entire set of features. Cognitive functioning in general but also the ability to engage in cognitive plasticity is to some extent determined or even facilitated by centrally active drugs including dopamine replacement therapy in PD [41, 42]. As stated in the Dopamine Overdose Hypothesis, both dopamine depletion as well as dopamine overdoses might lead to adverse effects in cognitive tasks, resulting in an inverted U-shaped relationship between dopamine levels and cognitive performance [43, 44]. Following, dopaminergic treatment may foster dopamine depleted neural circuits but at the same time overdose relatively intact circuits, resulting in differential effects of dopaminergic supplementation on different cognitive domains relying on different neural circuits [4, 45]. Furthermore, along with the progression of neurodegeneration in PD [44], the optimal level of dopamine replacement therapy for cognitive functions may change over the course of the disease, as it does for motor and other non-motor symptoms [46]. The effects of dopaminergic supplementation on learning and the responsiveness to cognitive interventions in both healthy older adults and patients with PD is heterogeneous as reviewed in Lebedev et al. [45] and requires further investigation. The majority of studies on Levodopa and training responsiveness in PD, however, reveals a positive relationship between LEDD and training outcome.
As the random forest regression does not allow to evaluate the direction of the relationship between predictor variables and outcome, e.g., if more or less years of education are associated with higher WM improvement, we analyzed the bivariate associations between predictors and outcomes, which should, however, be interpreted cautiously (Supplementary Figures 4-6). The WMT literature suggests two mechanisms leading to training effects, which can be discussed in terms of the direction of the relationship between predictor variables and training outcome: on the one hand, compensatory mechanisms [47, 48], i.e., those individuals having more room for improvement benefit most, and on the other hand processes of magnification [47, 48] yielding larger improvement for those with better prerequisites in terms of cognitive and neurobiological reserve [10, 12, 49].
The main limitation of the present analyses is the lack of a validation cohort, which is why the results should be treated cautiously despite the methodologically strong and novel analytical approach. Due to the low sample size we were not able to evaluate our models within a cross-validation scheme as previously recommended [50, 51]. However, stability of the model performances and the feature importance of the investigated predictors was assessed within a resampling approach which decreases the likelihood that results were obtained by chance. Note, that one cannot readily account for model complexity in (non-likelihood-based) random forest regression analyses, as the number of input parameters does not reflect the effective degrees of freedom [52]. This phenomenon is called “paradox of ensembles” by Elder [53]. Nevertheless, the advantage of random forest regression is that is does not make any prior assumptions about the association between predictor variables and response variable (e.g., normal distribution) [35], and it is more suitable than traditional likelihood based approaches such as multiple linear regression when the number of predictors is large [54]. The second limitation refers to the composition of the applied cognitive test battery, including tests that might not have been sensitive enough to monitor different levels of improvements appropriately (e.g., ceiling effects) [55]. Third, the 3-month FU period should be extended by longer FU periods to evaluate predictors of long-term preventive benefits of WMT. Another limitation may be that patients were instructed not to train between POST and 3-month FU; however, it might also be possible, that our participants engaged in further cognitive training activities despite our recommendation.
Finally, future studies with PD patients may want to apply our model to other cohorts and test its reproducibility and generalizability. The present cohort of patients with PD without cognitive performance was not only well-specified regarding its cognitive status, but rather homogeneous regarding motor PD severity. Future research definitely needs to strike a better balance between samples recruited according to specific criteria and the generalizability to broader patient population with PD. Future studies might also apply and evaluate prediction models with predictors from different domains in the context of far-transfer training effects. The present analyses focus on the prediction of verbal WM as a near-transfer measure following WMT. However, in the context of single-domain cognitive intervention approaches such as WMT, those far-transfer effects are of special interest, as training effects in WM are assumed to transfer to other cognitive domains and potentially clinical outcomes [8].
The consideration of WMT-inherent learning parameters allows clinicians and researchers to utilize the information of the WMT-inherent learning dynamics rather than focusing on a single snapshot of cognitive performance obtained from standard cognitive testing [40]. Especially the latter might be biased in patients with PD, who frequently suffer from both motor and—in this context even more important—non-motor fluctuations [56]. Even though non-motor fluctuations may influence training-inherent learning performance as well, their influence will be more balanced across time and patients with PD might have chosen ON phases to train resulting in overall more reliable learning parameters. Furthermore, utilizing the information on training-inherent learning parameters directly extracted from a computerized, remotely delivered WMT, provides a low-threshold possibility to extract a proxy of baseline levels of cognitive performance. Prospectively, the collection of information on potential predictors of training outcome could potentially be performed without resource-intensive face-to-face cognitive assessments reaching even people in more rural areas with less health-care infrastructure. Future studies should evaluate how many training sessions are needed to extract reliable and valid proxies for the proposed learning parameters.
Conclusions
Using a supervised machine learning algorithm, we were able to provide robust prediction of the response to WMT using demographic, clinical, cognitive, and learning data in patients with PD. The consideration of training-inherent learning parameters for the first time in PD research boosted the precision of our prediction models. The application and validation of such prediction models may maximize training benefits following cognitive interventions in patients with PD.
ACKNOWLEDGMENTS
We thank all patients for participation in the study and all staff members who contributed to data collection, entry, and monitoring. Furthermore, we thank the German Parkinson Association (Deutsche Parkinson Vereinigung Bundesverband e.V.) for establishing contact to several regional Parkinson support groups and support in recruitment. We would also like to thank Schuhfried GmbH for providing free access to the computerized subtests of the Wiener Testsystem used in this study and NeuroNation (Synaptikon GmbH, Berlin, Germany) for providing the working memory training tasks, administrative support, and cognitive training licenses for our participants after study completion.
The RCT was funded by department budget only and did not receive any specific grant from funding agencies in the public, commercial, or not-for-profit sectors. NeuroNation (Synaptikon GmbH, Berlin, Germany) provided free access to their cognitive training platform but was not involved in the conceptualization of the study and analyses. Analyses were partly supported by the NARSAD Young Investigator Award of the Brain & Behavior Research Foundation No° 28474 (PI: LK-I).
CONFLICT OF INTEREST
AO received a grant from the “Novartis-Stiftung für therapeutische Forschung” and the Koeln Fortune Program / Faculty of Medicine, University of Cologne, outside the submitted work. CE has received in the last 12 months honoraria from AbbVie Inc., Philyra Inc., Bial Inc., StadaPharm Inc., Bristol Myers Squibb. PR received a travel grant from AbbVie. TvE has received recent grants from the German Research Foundation and reports having received consulting and speaker honoraria as well as research support from Siemens Healthcare, AVID Radiopharmaceuticals, Lilly, Shire Germany, Piramal (now Life Molecular Imaging), Lundbeck, Orion, and GE Healthcare.
EK has received grants from the German Ministry of Education and Research, Parkinson Fonds Deutschland gGmbH, the German Parkinson Society; honoraria from: Oticon GmbH, Hamburg, Germany; Lilly Pharma GmbH, Bad Homburg, Germany; Bernafon AG, Bern, Switzerland; Desitin GmbH, Hamburg, Germany. LKI has received grants from Brain and Behavior Foundation and National Institute of Health NIH. None of the other authors have any conflicts to report.
DATA AVAILABILITY STATEMENT
Original individual participant data and data analysis scripts can be obtained from the corresponding author (AO) upon reasonable request.
SUPPLEMENTARY MATERIAL
[1] The supplementary material is available in the electronic version of this article: https://dx.doi.org/10.3233/JPD-223448.
REFERENCES
[1] | Aarsland D , Batzu L , Halliday GM , Geurtsen GJ , Ballard C , Ray Chaudhuri12-09-2022 K , Weintraub D ((2021) ) Parkinson disease-associated cognitive impairment. Nat Rev Dis Primers 7: , 1–21. |
[2] | Kalbe E , Rehberg SP , Heber I , Kronenbuerger M , Schulz JB , Storch A , Linse K , Schneider C , Gräber S , Liepelt-Scarfone I ((2016) ) Subtypes of mild cognitive impairment in patients with Parkinson’s disease: Evidence from the LANDSCAPE study. J Neurol Neurosurg Psychiatry 87: , 1099–1105. |
[3] | Litvan I , Aarsland D , Adler CH , Goldman JG , Kulisevsky J , Mollenhauer B , Rodriguez-Oroz MC , Tröster AI , Weintraub D ((2011) ) MDS task force on mild cognitive impairment in Parkinson’s Disease: Critical review of PD-MCI. Mov Disord 26: , 1814–1824. |
[4] | Ramos AA , Machado L ((2021) ) A comprehensive meta-analysis on short-term and working memory dysfunction in Parkinson’s disease. Neuropsychol Rev 31: , 288–311. |
[5] | Weicker J , Villringer A , Thöne-Otto A ((2016) ) Can impaired working memory functioning be improved by training? A meta-analysis with a special focus on brain injured patients. Neuropsychology 30: , 190–212. |
[6] | Kovacs K , Conway AR ((2016) ) Process overlap theory: A unified account of the general factor of intelligence. Psychol Inq 27: , 151–177. |
[7] | Diamond A ((2013) ) Executive functions. Annu Rev Psychol 64: , 135–168. |
[8] | Teixeira-Santos AC , Moreira CS , Magalhães R , Magalhães C , Pereira DR , Leite J , Carvalho S , Sampaio A ((2019) ) Reviewing working memory training gains in healthy older adults: A meta-analytic review of transfer for cognitive outcomes. Neurosci Biobehav Rev 103: , 163–177. |
[9] | Hou J , Jiang T , Fu J , Su B , Wu H , Sun R , Zhang T ((2020) ) The long-term efficacy of working memory training for healthy older adults: A systematic review and meta-analysis of 22 randomized controlled trials. J Gerontol B Psychol Sci Soc Sci 75: , 174–188. |
[10] | Fellman D , Salmi J , Ritakallio L , Ellfolk U , Rinne JO , Laine M ((2018) ) Training working memory updating in Parkinson’s disease: A randomised controlled trial. Neuropsychol Rehabil 30: , 673–708. |
[11] | Ophey A , Giehl K , Rehberg S , Eggers C , Reker P , van Eimeren T , Kalbe E ((2020) ) Effects of working memory training in patients with Parkinson’s Disease without cognitive impairment: A randomized controlled trial. Parkinsonism Relat Disord 72: , 13–22. |
[12] | Ophey A , Rehberg S , Giehl K , Eggers C , Reker P , van Eimeren T , Kalbe E ((2021) ) Predicting working memory training responsiveness in Parkinson’s disease: Both “system hardware” and room for improvement are needed. Neurorehabilit Neural Repair 35: , 117–130. |
[13] | Haas SS , Antonucci LA , Wenzel J , Ruef A , Biagianti B , Paolini M , Rauchmann B-S , Weiske J , Kambeitz J , Borgwardt S ((2021) ) A multivariate neuromonitoring approach to neuroplasticity-based computerized cognitive training in recent onset psychosis. Neuropsychopharmacology 46: , 828–835. |
[14] | Kambeitz-Ilankovic L , Vinogradov S , Wenzel J , Fisher M , Haas SS , Betz L , Penzel N , Nagarajan S , Koutsouleris N , Subramaniam K ((2021) ) Multivariate pattern analysis of brain structure predicts functionaloutcome after auditory-based cognitive training interventions. NPJ Schizophr 7: , 40. |
[15] | Kambeitz-Ilankovic L , Wenzel J , Haas SS , Ruef A , Antonucci LA , Sanfelici R , Paolini M , Koutsouleris N , Biagianti B ((2020) ) Modeling social sensory processing during social computerized cognitive training for psychosis spectrum: The resting-state approach. Front Psychiatry 11: , 554475. |
[16] | Bürki CN , Ludwig C , Chicherio C , de Ribaupierre A ((2014) ) Individual differences in cognitive plasticity: An investigation of training curves in younger and older adults. Psychol Res 78: , 821–835. |
[17] | Jaeggi SM , Buschkuehl M , Jonides J , Shah P ((2011) ) Short-and long-term benefits of cognitive training. Proc Natl Acad Sci U S A 108: , 10081–10086. |
[18] | Richmond LL , Morrison AB , Chein JM , Olson IR ((2011) ) Working memory training and transfer in older adults. Psychol Aging 26: , 813. |
[19] | Zinke K , Zeintl M , Rose NS , Putzmann J , Pydde A , Kliegel M ((2014) ) Working memory training and transfer in older adults: Effects of age, baseline performance, and training gains. Dev Psychol 50: , 304–315. |
[20] | Kalbe E , Aarsland D , Folkerts A-K ((2018) ) Cognitive interventions in Parkinson’s Disease: Where we want to go within 20 years. J Parkinsons Dis 8: , S107–S113. |
[21] | Hughes AJ , Daniel SE , Kilford L , Lees AJ ((1992) ) Accuracy of clinical diagnosis of idiopathic Parkinson’s disease: A clinico-pathological study of 100 cases. J Neurol Neurosurg Psychiatry 55: , 181–184. |
[22] | Litvan I , Goldman JG , Tröster AI , Schmand BA , Weintraub D , Petersen RC , Mollenhauer B , Adler CH , Marder K , Williams-Gray CH ((2012) ) Diagnostic criteria for mild cognitive impairment in Parkinson’s disease: Movement Disorder Society Task Force guidelines. Mov Disord 27: , 349–356. |
[23] | Emre M ((2003) ) Dementia associated with Parkinson’s disease. Lancet Neurol 2: , 229–237. |
[24] | Yesavage JA , Brink TL , Rose TL , Lum O , Huang V , Adey M , Leirer VO ((1983) ) Development and validation of a geriatric depression screening scale: A preliminary report. J Psychiatr Res 17: , 37–49. |
[25] | Hoehn MM , Yahr MD ((1967) ) Parkinsonism: Onset, progression, and mortality. Neurology 17: , 427–442. |
[26] | Nasreddine ZS , Phillips NA , Béedirian V , Charbonneau S , Whitehead V , Collin I , Cummings JL , Chertkow H ((2005) ) The Montreal Cognitive Assessment, MoCA: A brief screening tool for mild cognitive impairment. J Am Geriatr Soc 53: , 695–699. |
[27] | Schmiedek F , Lövdén M , Lindenberger U ((2014) ) A task is a task is a task: Putting complex span, n-back, and other working memory indicators in psychometric context. Front Psychol 5: , 1475. |
[28] | Wechsler D (1984) WMS-R: Wechsler memory scale revised: Manual, Psychological Corporation. |
[29] | Schuhfried G (1992) Wiener Testsystem, Vienna Reaction Unit, Basic Program, Molding, Austria. |
[30] | Tomlinson CL , Stowe R , Patel S , Rick C , Gray R , Clarke CE ((2010) ) Systematic review of levodopa dose equivalency reporting in Parkinson’s disease. Mov Disord 25: , 2649–2653. |
[31] | Fahn S , Elton R , Members of the UPDRS Development Committee ((1987) ) Unified Parkinson’s Disease rating scale. In Recent Developments in Parkinson’s Disease, Fahn S, Marsden CD, Goldstein M, Calne DB, eds. Macmillan Healthcare Information, Florham Park, NJ, pp. 153–163. |
[32] | Jerusalem M , Schwarzer R (1999) Skala zur allgemeinen Selbstwirksamkeitserwartung. In Skalen zurErfassung von Lehrer-und Schülermerkmalen. Dokumentation der psychometrischen Verfahren im Rahmen der Wissenschaftlichen Begleitung des Modellversuchs Selbstwirksame Schulen. Freie Universität Berlin, Berlin.. |
[33] | Schwarzer R , Jerusalem M ((1995) ) Generalized Self-Efficacy scale. In Measures in Health Psychology: A User’s Portfolio. Causal and Control Beliefs, Weinman J, Wright S, Johnston M, eds. NFER-NELSON, Windsor, UK,pp. 35–37. |
[34] | Wright MN , Ziegler A (2015) ranger:Afast implementation of random forests for high dimensional data in C++and R. arXiv preprint arXiv:1508.04409. |
[35] | Probst P , Wright MN , Boulesteix AL ((2019) ) Hyperparameters and tuning strategies for random forest. WIREs Data Min Knowl Discov 9: , e1301. |
[36] | Mangiafico S (2019) rcompanion: Functions to support extension education program evaluation. R package version 2. |
[37] | Bonferroni C ((1936) ) Teoria statistica delle classi e calcolo delle probabilita. Pubblicazioni del R Istituto Superiore di Scienze Economiche e Commericiali di Firenze 8: , 3–62. |
[38] | Giehl K , Ophey A , Reker P , Rehberg S , Hammes J , Barbe MT , Zokaei N , Eggers C , Husain M , Kalbe E , van Eimeren T ((2020) ) Effects of home-based working memory training on visuo-spatial working memory in Parkinson’s Disease: A randomized controlled trial. J Cent Nerv Syst Dis 12: , 1179573519899469. |
[39] | Giehl K , Ophey A , Hammes J , Rehberg S , Lichtenstein T , Reker P , Eggers C , Kalbe E , van Eimeren T ((2020) ) Working memory training increases neural efficiency in Parkinson’s disease: A randomized controlled trial. Brain Commun 2: , fcaa115. |
[40] | Steyvers M , Schafer RJ ((2020) ) Inferring latent learning factors in large-scale cognitive training data. Nat Hum Behav 4: , 1145–1155. |
[41] | Calabresi P , Ghiglieri V , Mazzocchetti P , Corbelli I , Picconi B ((2015) ) Levodopa-induced plasticity: A double-edged sword in Parkinson’s disease? Philos Trans R Soc 370: , 20140184. |
[42] | Poletti M , Bonuccelli U ((2013) ) Acute and chronic cognitive effects of levodopa and dopamine agonists on patients with Parkinson’s disease: A review. Ther Adv Psychopharmacol 3: , 101–113. |
[43] | Gotham A , Brown R , Marsden C ((1988) ) ‘Frontal’ cognitive function in patients with Parkinson’s Disease ‘on’ and ‘off’ levodopa. Brain 111: , 299–321. |
[44] | Vaillancourt DE , Schonfeld D , Kwak Y , Bohnen NI , Seidler R ((2013) ) Dopamine overdose hypothesis: Evidence and clinical implications. Mov Disord 28: , 1920–1929. |
[45] | Lebedev AV , Nilsson J , Lindström J , Fredborg W , Akenine U , Hillilä C , Andersen P , Spulber G , de Lange E , van den Berg D-J ((2020) ) Effects of daily L-dopa administration on learning and brain structure in older adults undergoing cognitive training: A randomised clinical trial. Sci Rep 10: , 5227. |
[46] | Armstrong MJ , Okun MS ((2020) ) Diagnosis and treatment of Parkinson disease: A review. JAMA 323: , 548–560. |
[47] | Lövdén M , Bäckman L , Lindenberger U , Schaefer S , Schmiedek F ((2010) ) A theoretical framework for the study of adult cognitive plasticity. Psychol Bull 136: , 659–676. |
[48] | Lövdéen M , Brehmer Y , Li S-C , Lindenberger U ((2012) ) Training-induced compensation versus magnification of individual differences in memory performance. Front Hum Neurosci 6: , 141. |
[49] | Ophey A , Roheger M , Folkerts A-K , Skoetz N , Kalbe E ((2020) ) Asystematic review on predictors of workingmemory training responsiveness in healthy older adults:Methodological challenges and future directions. Front AgingNeurosci 12: , 575804. |
[50] | Dwyer DB , Falkai P , Koutsouleris N ((2018) ) Machine learning approaches for clinical psychology and psychiatry. Annu Rev Clin Psychol 14: , 91–118. |
[51] | Cearns M , Hahn T , Baune BT ((2019) ) Recommendations and future directions for supervised machine learning in psychiatry. Transl Psychiatry 9: , 271. |
[52] | Hauenstein S , Wood SN , Dormann CF ((2018) ) Computing AIC for black-box models using generalized degrees of freedom: A comparison with cross-validation. Commun Stat Simul Comput 47: , 1382–1396. |
[53] | Elder JF ((2003) ) The generalization paradox of ensembles. J Comput Graph Stat 12: , 853–864. |
[54] | Smith G ((2018) ) Step away from stepwise. J Big Data 5: , 32. |
[55] | Mathews M , Abner E , Caban-Holt A , Kryscio R , Schmitt F ((2013) ) CERAD practice effects and attrition bias in a dementia prevention trial. Int Psychogeriatr 25: , 1115–1123. |
[56] | Martínez-Fernández R , Schmitt E , Martinez-Martin P , Krack P ((2016) ) The hidden sister of motor fluctuations in Parkinson’sdisease: A review on nonmotor fluctuations. Mov Disord 31: , 1080–1094. |


