
Comparison of Olfactory Tract Diffusion Measures Between Early Stage Parkinson’s Disease Patients and Healthy Controls Using Ultra-High Field MRI
Abstract
Background:
MRI is a valuable method to assist in the diagnostic work-up of Parkinson’s disease (PD). The olfactory tract (OT) has been proposed as a potential MRI biomarker for distinguishing PD patients from healthy controls.
Objective:
This study aims to further investigate whether diffusion measures of the OT differ between early stage PD patients and healthy controls.
Methods:
Twenty hyposmic/anosmic PD patients, 65 normosmic PD patients, and 36 normosmic healthy controls were evaluated and a 7T diffusion weighted image scan was acquired. Manual seed regions of interest were drawn in the OT region. Tractography of the OT was performed using a deterministic streamlines algorithm. Diffusion measures (fractional anisotropy and mean- radial- and axial diffusivity) of the generated streamlines were compared between groups.
Results:
Diffusion measures did not differ between PD patients compared to healthy controls and between hyposmic/anosmic PD patients, normosmic PD patients, and normosmic healthy controls. A positive correlation was found between age and mean- and axial diffusivity within the hyposmic/anosmic PD subgroup, but not in the normosmic groups. A positive correlation was found between MDS-UPDRSIII scores and fractional anisotropy.
Conclusion:
This study showed that fiber tracking of the OT was feasible in both early stage PD and healthy controls using 7T diffusion weighted imaging data. However, 7T MRI diffusion measures of the OT are not useful as an early clinical biomarker for PD. Future work is needed to clarify the role of other OT measurements as a biomarker for PD and its different subgroups.
INTRODUCTION
Parkinson’s disease (PD) is a neurodegenerative disorder, often recognized by clinicians when motor symptoms like bradykinesia, rigidity, and tremor become apparent. In current clinical practice, the diagnosis of PD is based on the assessment of symptoms and their course over time according to clinical criteria [1]. However, discriminating PD from other parkinsonian syndromes can be difficult as illustrated by the error rate of 24% for a clinical diagnosis of PD, even in specialized movement disorders centers [2]. The diagnostic challenge is in part due to PD being a heterogeneous disease with variation in clinical course, treatment response, genetic background, and the influence of environmental factors. The gold standard for diagnosis remains a neuropathological confirmation of dopaminergic neuronal cell loss. Interestingly, recent advances in neuroimaging have led to the development of several new MRI technologies and to optimism for new useful non-invasive biomarkers for diagnosing PD.
MRI is a valuable method to assist in the diagnostic work-up of PD. Most prominently described in recent years as potential biomarkers to discriminate PD patients from healthy controls (HC) are the signal loss of the nigrosome-1 area on iron sensitive images and reduced signal intensity of the substantia nigra on neuromelanin sensitive images [3–6]. However, limitations of previous studies that investigated these potential MRI biomarkers are small sample sizes, low imaging resolution, and the inclusion of already advanced-staged PD patients in cohort studies. Moreover, most research utilized MRI scanners with a field strength below 7T, with 3T being commonly applied in studies. With the application of various 7T MRI sequences, like iron sensitive scans, neuromelanin sensitive scans, and diffusion weighted imaging (DWI) scans, diagnostic confidence may improve due to increased spatial resolution and a higher signal to noise ratio as a result of ultra-high field imaging [5, 7].
DWI is a MRI technique which enables the measurement of the random Brownian motion of water molecules within the brain [8]. This movement can be quantified via diffusion tensor imaging (DTI), which helps to better understand the underlying white matter neurobiology on the macroscopic level. Commonly used measures are the fractional anisotropy (FA), which quantifies the preferred diffusion direction of water molecules and fiber mixture, the mean diffusivity (MD), which represents the diffusion magnitude, the radial diffusivity (RD), which is perpendicular to the aligned axons and reflects myelination, and the axial diffusivity (AD), which is parallel to axons and reflects organization [9, 10]. DTI can be used for the reconstruction of fiber tracts, which allows to perform a virtual dissection of white matter on the voxel level.
The decreased ability to smell and to detect odors is one of the classical early symptoms of PD. The pathological mechanism is poorly understood but possibly involves neurodegeneration of the olfactory tract (OT) [1]. In fact, from a neuropathological point of view, the OT and olfactory bulb are often recognized as one of the first structures affected, according to the well accepted Braak staging of PD pathology [11]. Previously, a meta-analysis highlighted that the OT could potentially serve as a biomarker for PD [12]. However, previous work studying diffusion measures of the OT or olfactory areas showed varying results. Based on DTI subregion analyses in PD patients and HC, lower FA was reported in the anterior olfactory regions of the PD patients without overlapping distributions between groups [13]. Furthermore, the MD of the OT was higher in PD patients compared to HC and correlated positively with OFF-medication motor scores [14]. In addition, AD was lower in the white matter adjacent to the olfactory sulcus, which can be attributed to potential axonal degeneration [15]. When comparing PD patients with HC, it was shown that both FA and tract volume of the OT were decreased in PD [16].
When comparing hyposmic/anosmic PD patients with normosmic HC, results can be interpreted along two axis; Hyposmic versus normosmic, and PD versus HC. This study therefore includes three groups to determine whether DWI measures of the OT may be able to serve as an early biomarker for PD; hyposmic/anosmic early stage PD patients (HA-PD), normosmic early stage PD patients (N-PD), and normosmic HC (N-HC).
This report is part of the TRACK-PD study, an observational ultra-high field imaging study aiming to provide more information on diagnosing PD and its subtypes [7]. We hypothesize that diffusion measures will differ between groups. More specific, we hypothesize that FA values in the OT will be decreased in HA-PD compared to N-HC, while MD values will be increased in HA-PD. Additionally, the association between age and diffusion measures of the OT and PD symptom scores and diffusion measures of the OT will be explored.
MATERIALS AND METHODS
Participants
Data collection was performed between July 2019 and December 2021 as part of the TRACK-PD study. The inclusion procedure, in- and exclusion criteria, and the study procedure are described elsewhere [7]. In short, patients were diagnosed with PD maximally three years before the first testing day and were excluded when diagnosed with neurodegenerative diseases other than PD. Overall, participants were excluded when they scored <24 points on the Montreal Cognitive Assessment [MoCA [17]] or when they had any MRI contraindications (claustrophobia or ferromagnetic implants). During the testing day, patients took their prescribed PD medication. The TRACK-PD study was approved by the Institutional Review Committee (IRB) of the Maastricht University Medical Centre and written informed consent was obtained from all participants.
Clinical assessments
During the testing day motor functions were assessed by trained and certified investigators using the unified Parkinson’s Disease rating scale (MDS-UPDRS) and the Hoehn and Yahr scale. The MDS-UPDRS consists of four parts, including a motor evaluation (MDS-UPDRSIII) [18]. The Hoehn and Yahr scale is used to estimate the global disease stage of PD patients [19]. In addition, participants were asked to complete the Self-Reported Mini Olfactory Questionnaire (Self-MOQ) at home [20]. According to previous work, a cut-off score of 3.5 was used to distinguish normosmic versus hyposmic/anosmic participants [20].
MRI acquisition
Participants were scanned in a 7T MRI scanner (Magnetom, Siemens, Erlangen, Germany) equipped with a Nova Medical 32-channel head coil. PD patients were scanned in the ON-medication state for practical reasons such as a lower chance of motion artifacts by OFF-related tremors (if present). In addition, previous work shows that diffusion measures are not affected by antiparkinsonian medication [21]. When possible, dielectric pads were applied to enhance the signal in especially the temporal brain regions [22]. During the scan session, participants had the possibility to watch a movie projected on a screen, which was visible via a mirror.
The MRI protocol of the TRACK-PD study was described elsewhere [7]. First a localizer sequence was acquired for optimal planning, and B0 and B1 mapping and shimming were used to correct for field inhomogeneities. A whole brain DWI scan was acquired using an echo-planar imaging (EPI) sequence, along 66 random directions with an average B-value of 2000 s/mm2 mixed with six B0-volumes. One B0-volume and five DWI volumes were acquired with an opposite phase encoding direction. Technical details of the DWI scan included; TE = 60.6 ms, TR = 7000 ms, flip angle = 90 degrees, FOV = 192×192 mm, resolution = 1.5 mm isotropic, number of slices = 80, orientation = interleaved axial, GeneRalized Autocalibrating Partial Parallel Acquisition (GRAPPA) [23] acceleration factor = 3, and acquisition time = 9:48 minutes.
MRI preprocessing
After conversion of the raw DICOM data to nifti format [24], DWI scans were denoised and potential Gibbs ringing artifacts were removed using MRtrix version 3 [25–27]. Following this, the DWI scans were corrected for susceptibility induced distortions using topup, for eddy currents and subject motion [28–30], and b-matrix reorientation was performed using software from the FMRIB software library of FSL 5.0 (https://www.fmrib.ox.ac.uk/fsl). After this the generated mask was manually enlarged to include the area covering the OT. Data quality control was performed by visual inspection and quantification of the mean displacement values per volume based on the eddy current correction routine [31].
OT tractography
Seed regions of interest (ROI) were manually drawn by two raters (MH and AW) blinded to the clinical status of the participants. For each dataset, the average image of movement corrected B0 volumes was visualized. Next, an empty mask was created and seed ROIs were drawn for each participant according to the following guidelines; 1) Two axial slices of the average B0 image were selected in which the OT was best visible (Fig. 1A). 2) Within these slices, five conjoined squares of 2×2 voxels were drawn for both the left and right OT, resulting in 40 voxels per slice and 80 voxels in total (Fig. 1B).
Fig. 1
A) Four axial slices of the average corrected B0 volumes. The two middle images were selected as the ones having the best visible olfactory tract. B) Coronal, axial, and sagittal view of the seed ROI representing the olfactory tract area. C) The same four axial slices as shown in A, showing the olfactory tract tractography results. Images are in radiological orientation.
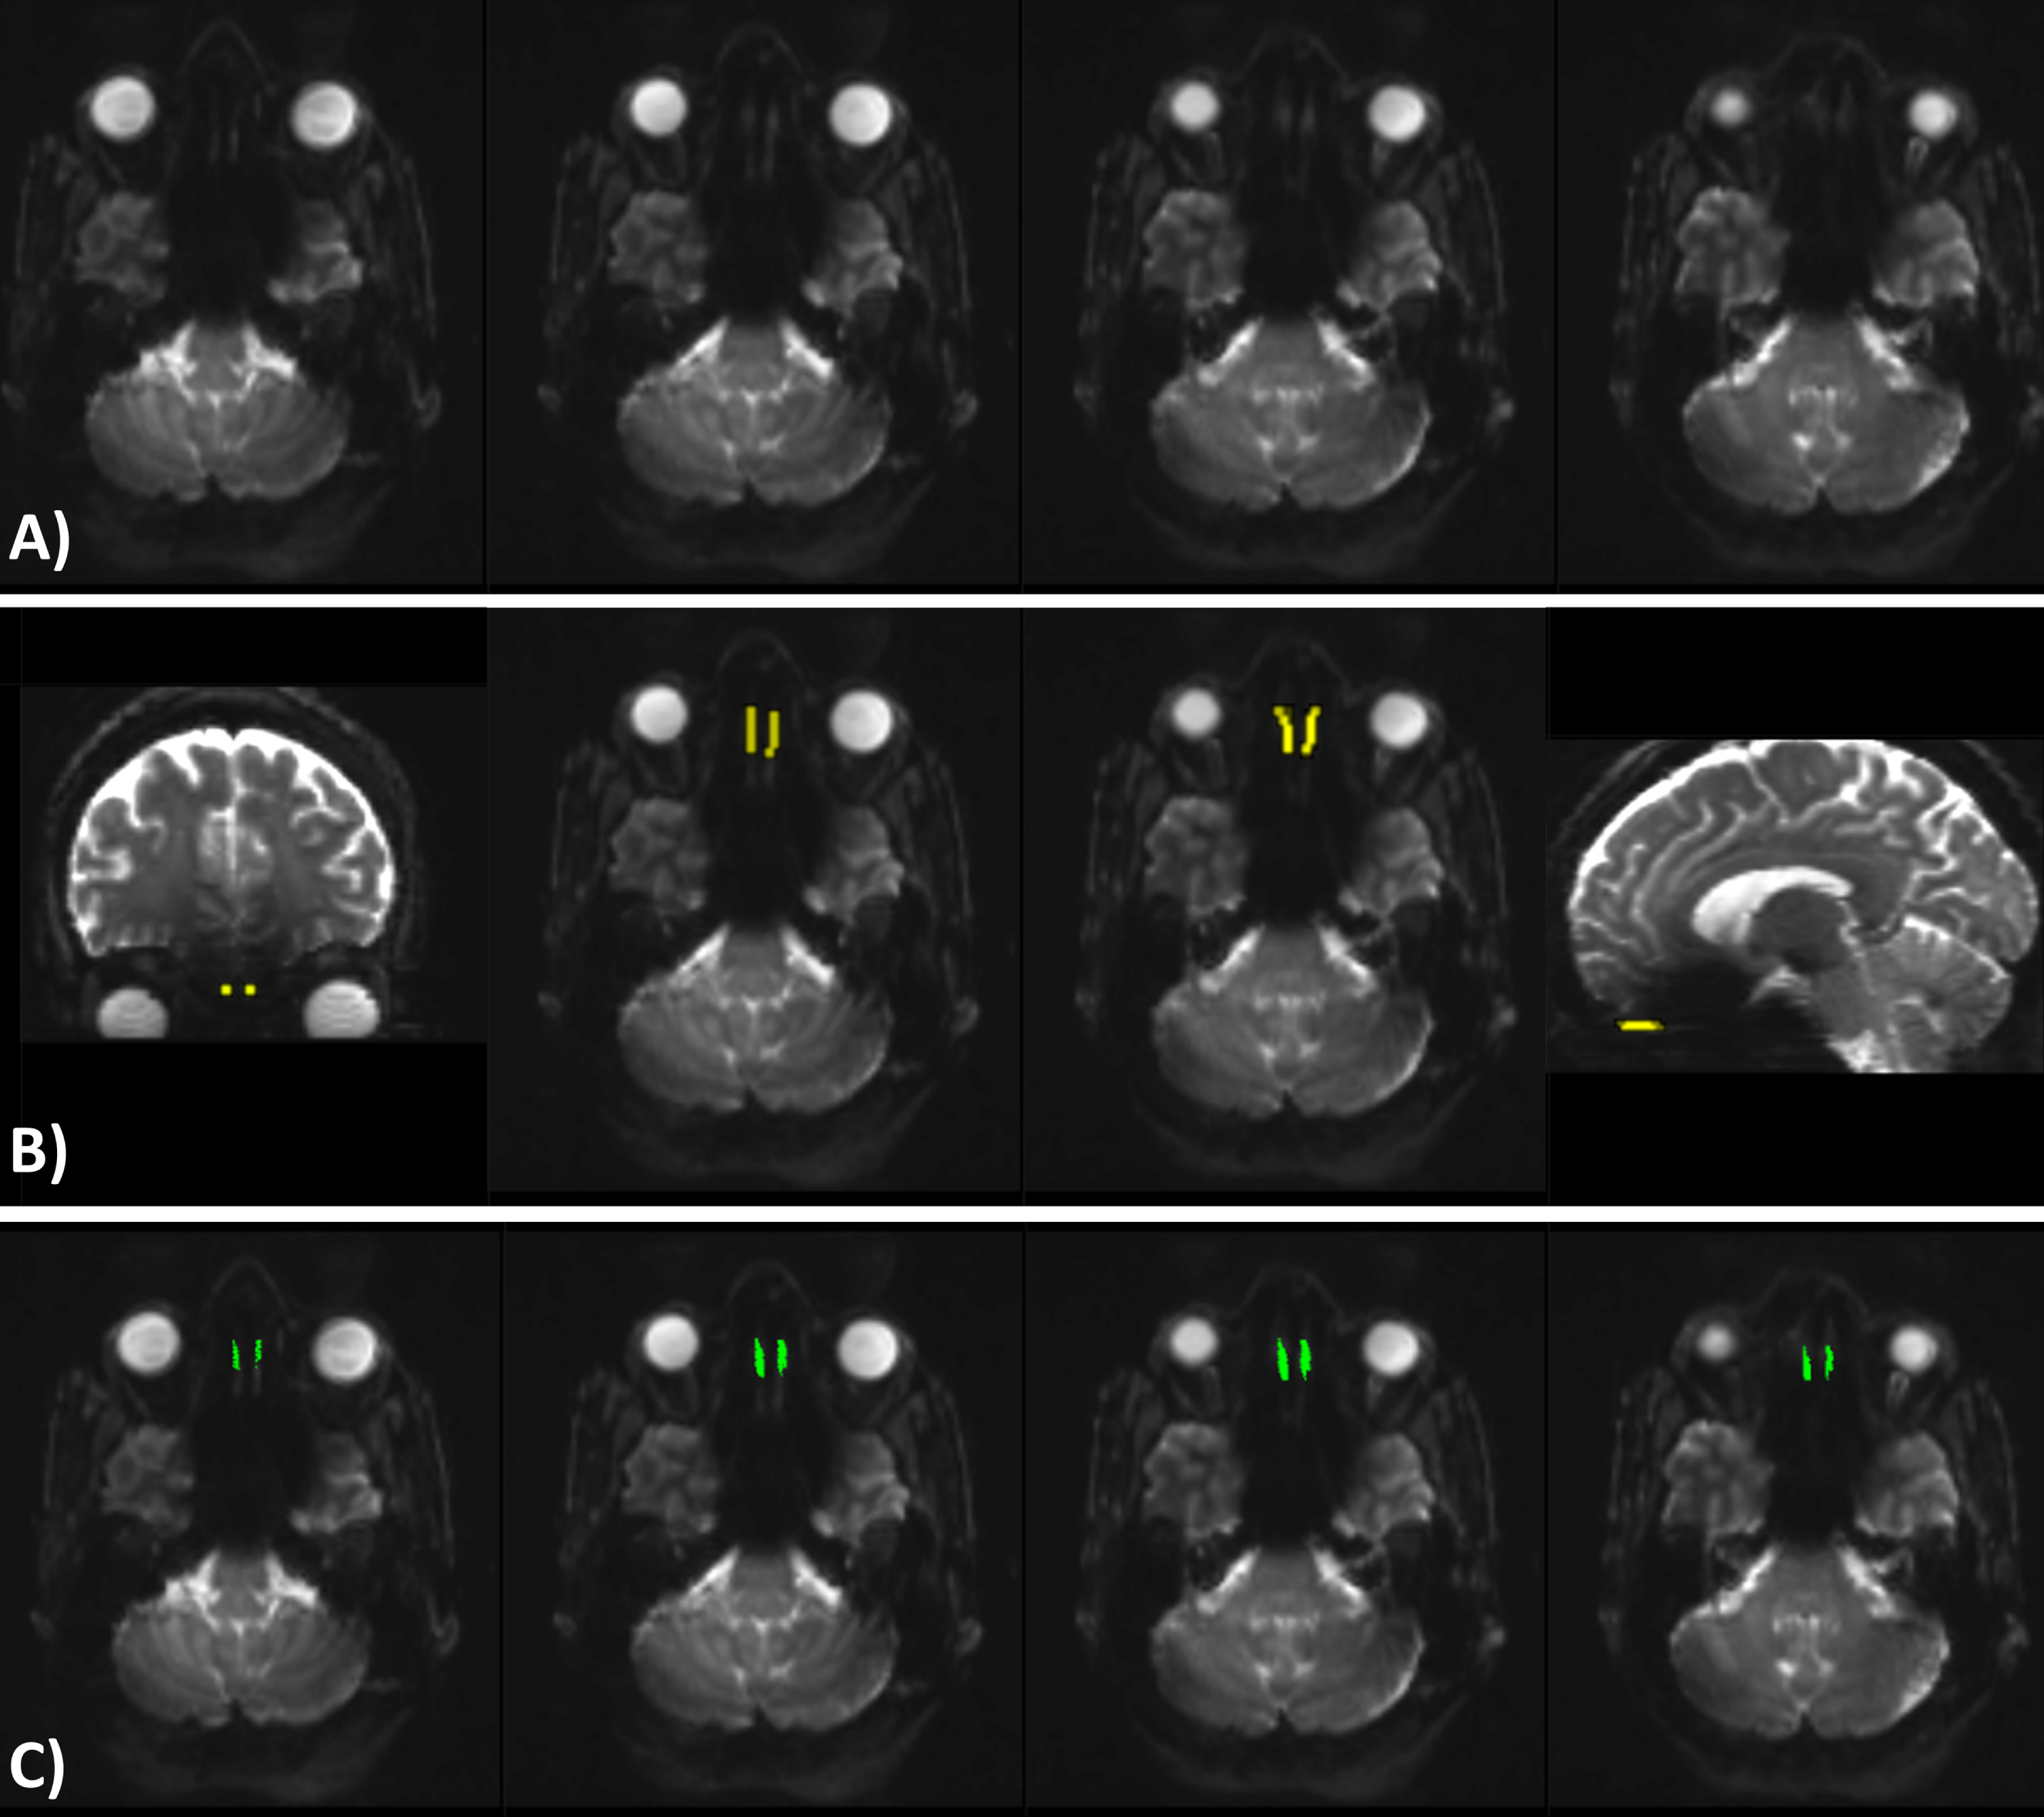
Tractography of the OT was performed using MRtrix3. First, the response function was estimated with the constrained spherical deconvolution algorithm [32] and the fiber orientation distribution was estimated [33]. Next, streamline tractography was performed utilizing the drawn seed ROI as seed and with the deterministic streamlines algorithm based on spherical deconvolution [34] (angle threshold = 30 degree, minimum track length = 5 mm, seeding direction = anterior-posterior). An example of the tractography results are shown in Fig. 1C. Finally, tensors were fitted [35] and metrics were calculated in MRtrix3 to generate FA, MD, AD, and RD maps. The total number of tracts, mean FA, MD, AD, and RD values of the generated streamlines were calculated. The average diffusion measures of both raters were used for further analysis.
Statistical analyses
Statistical analyses were performed using Rstudio version 1.4.1103. Demographic variables were compared between groups with Pearson’s chi-squared test for categorical variables and student’s t-test or one-way ANOVA for continuous variables. Any differences in diffusion measures of the OT between the PD and HC groups were tested utilizing student’s t-test. Any differences in diffusion measures of the OT between the HA-PD, N-PD, and N-HC groups were tested utilizing the one-way ANOVA. The Shapiro-Wilk test was used to assess the normality of the data. Non-parametric tests were used in case the assumption of normality was violated. The inter-rater reliability of the two ROI raters was assessed using the Intraclass Correlation Coefficient (ICC) [36]. Correlations between diffusion measures of the OT and age and correlations between diffusion measures of the OT and PD symptom scores (MDS-UPDRSIII score and PD disease duration) were assessed using Spearman correlation. Bonferroni corrections were applied to correct for multiple comparisons, leading to a significance level of 0.0125 for the correlation analyses.
RESULTS
MRI quality control
Data quality control resulted in the exclusion of 11 datasets, resulting in a total of 123 participants. Four datasets were excluded since they contained multiple volumes which had a mean displacement larger than the voxel size (1.5 mm). Six datasets were excluded since the field of view did not cover the OT area. One dataset was excluded since the OT region showed an unacceptable amount of noise.
Demographics
In addition to the exclusions based on MRI quality control, one HC was excluded because of being classified as hyposmic (Self-MOQ>3.5). Further, one PD patient was excluded because this participant was classified as outlier based on age. The resulting participant characteristics (n = 121) are shown in Table 1.
Table 1
Participant characteristics
| HA-PD (n = 20) | N-PD (n = 65) | N-HC (n = 36) | P | |
| Male/female, n | 15/5 | 45/20 | 22/14 | 0.529 |
| Age, y | 65.1 (7.7) | 62.6 (8.0) | 60.0 (8.4) | 0.090 |
| MoCA | 27.7 (1.9) | 27.7 (1.5) | 27.7 (1.5) | 0.994 |
| Self-MOQ | 4.8 (0.4) | 0.7 (1.0) | 0.3 (0.8) | <0.001 |
| Time since PD diagnosis, mo | 18.2 (8.9) | 19.9 (9.3) | – | 0.430 |
| Levodopa Equivalent Daily Dose | 354.0 (229.8) | 417.4 (223.7) | – | 0.083 |
| MDS-UPDRSIII | 18.0 (7.3) | 18.9 (7.5) | – | 0.686 |
| Hoehn and Yahr stage, n | Stage 1:8 | Stage 1:20 | – | 0.644 |
| Stage 2:12 | Stage 2:42 | |||
| Stage 3:0 | Stage 3:3 | |||
| Stage 4:0 | Stage 4:0 |
Data are presented as mean (std). HA-PD, hyposmic/anosmic Parkinson’s disease patients; N-PD, normosmic Parkinson’s disease patients; N-HC, normosmic healthy controls; MoCA, Montreal Cognitive Assessment score; Self-MOQ, Self-Reported Mini Olfactory Questionnaire; MDS-UPDRS III, Movement Disorders Society Unified Parkinson Disease Rating Scale.
No significant association was found between sex and group (χ2(2) = 1.273, p = 0.529), indicating an equal sex distribution between groups. No significant differences were found for age and MoCA scores between the groups (p = 0.090 and p = 0.994 respectively). Self-MOQ scores differed between groups (p < 0.001). Post-hoc tests showed that Self-MOQ scores differed between HA-PD and N-PD (p < 0.001) and between HA-PD patients and N-HC (p < 0.001), but not between N-PD and N-HC (p = 0.090). Time since PD diagnosis, LEDD, and MDS-UPDSRIII scores did not differ between the PD groups (p = 0.430, p = 0.083, and p = 0.686 respectively). No significant association was found between Hoehn and Yahr score and PD groups (p = 0.644), indicating an equal Hoehn and Yahr distribution between groups.
Inter-rater reliability
The diffusion measures extracted from the tracts of the two ROI raters showed a good (FA ICC = 0.89, MD ICC = 0.90, RD ICC = 0.89) and excellent (AD ICC = 0.916) inter-rater reliability.
Group comparison of diffusion measures of the OT: PD vs. HC
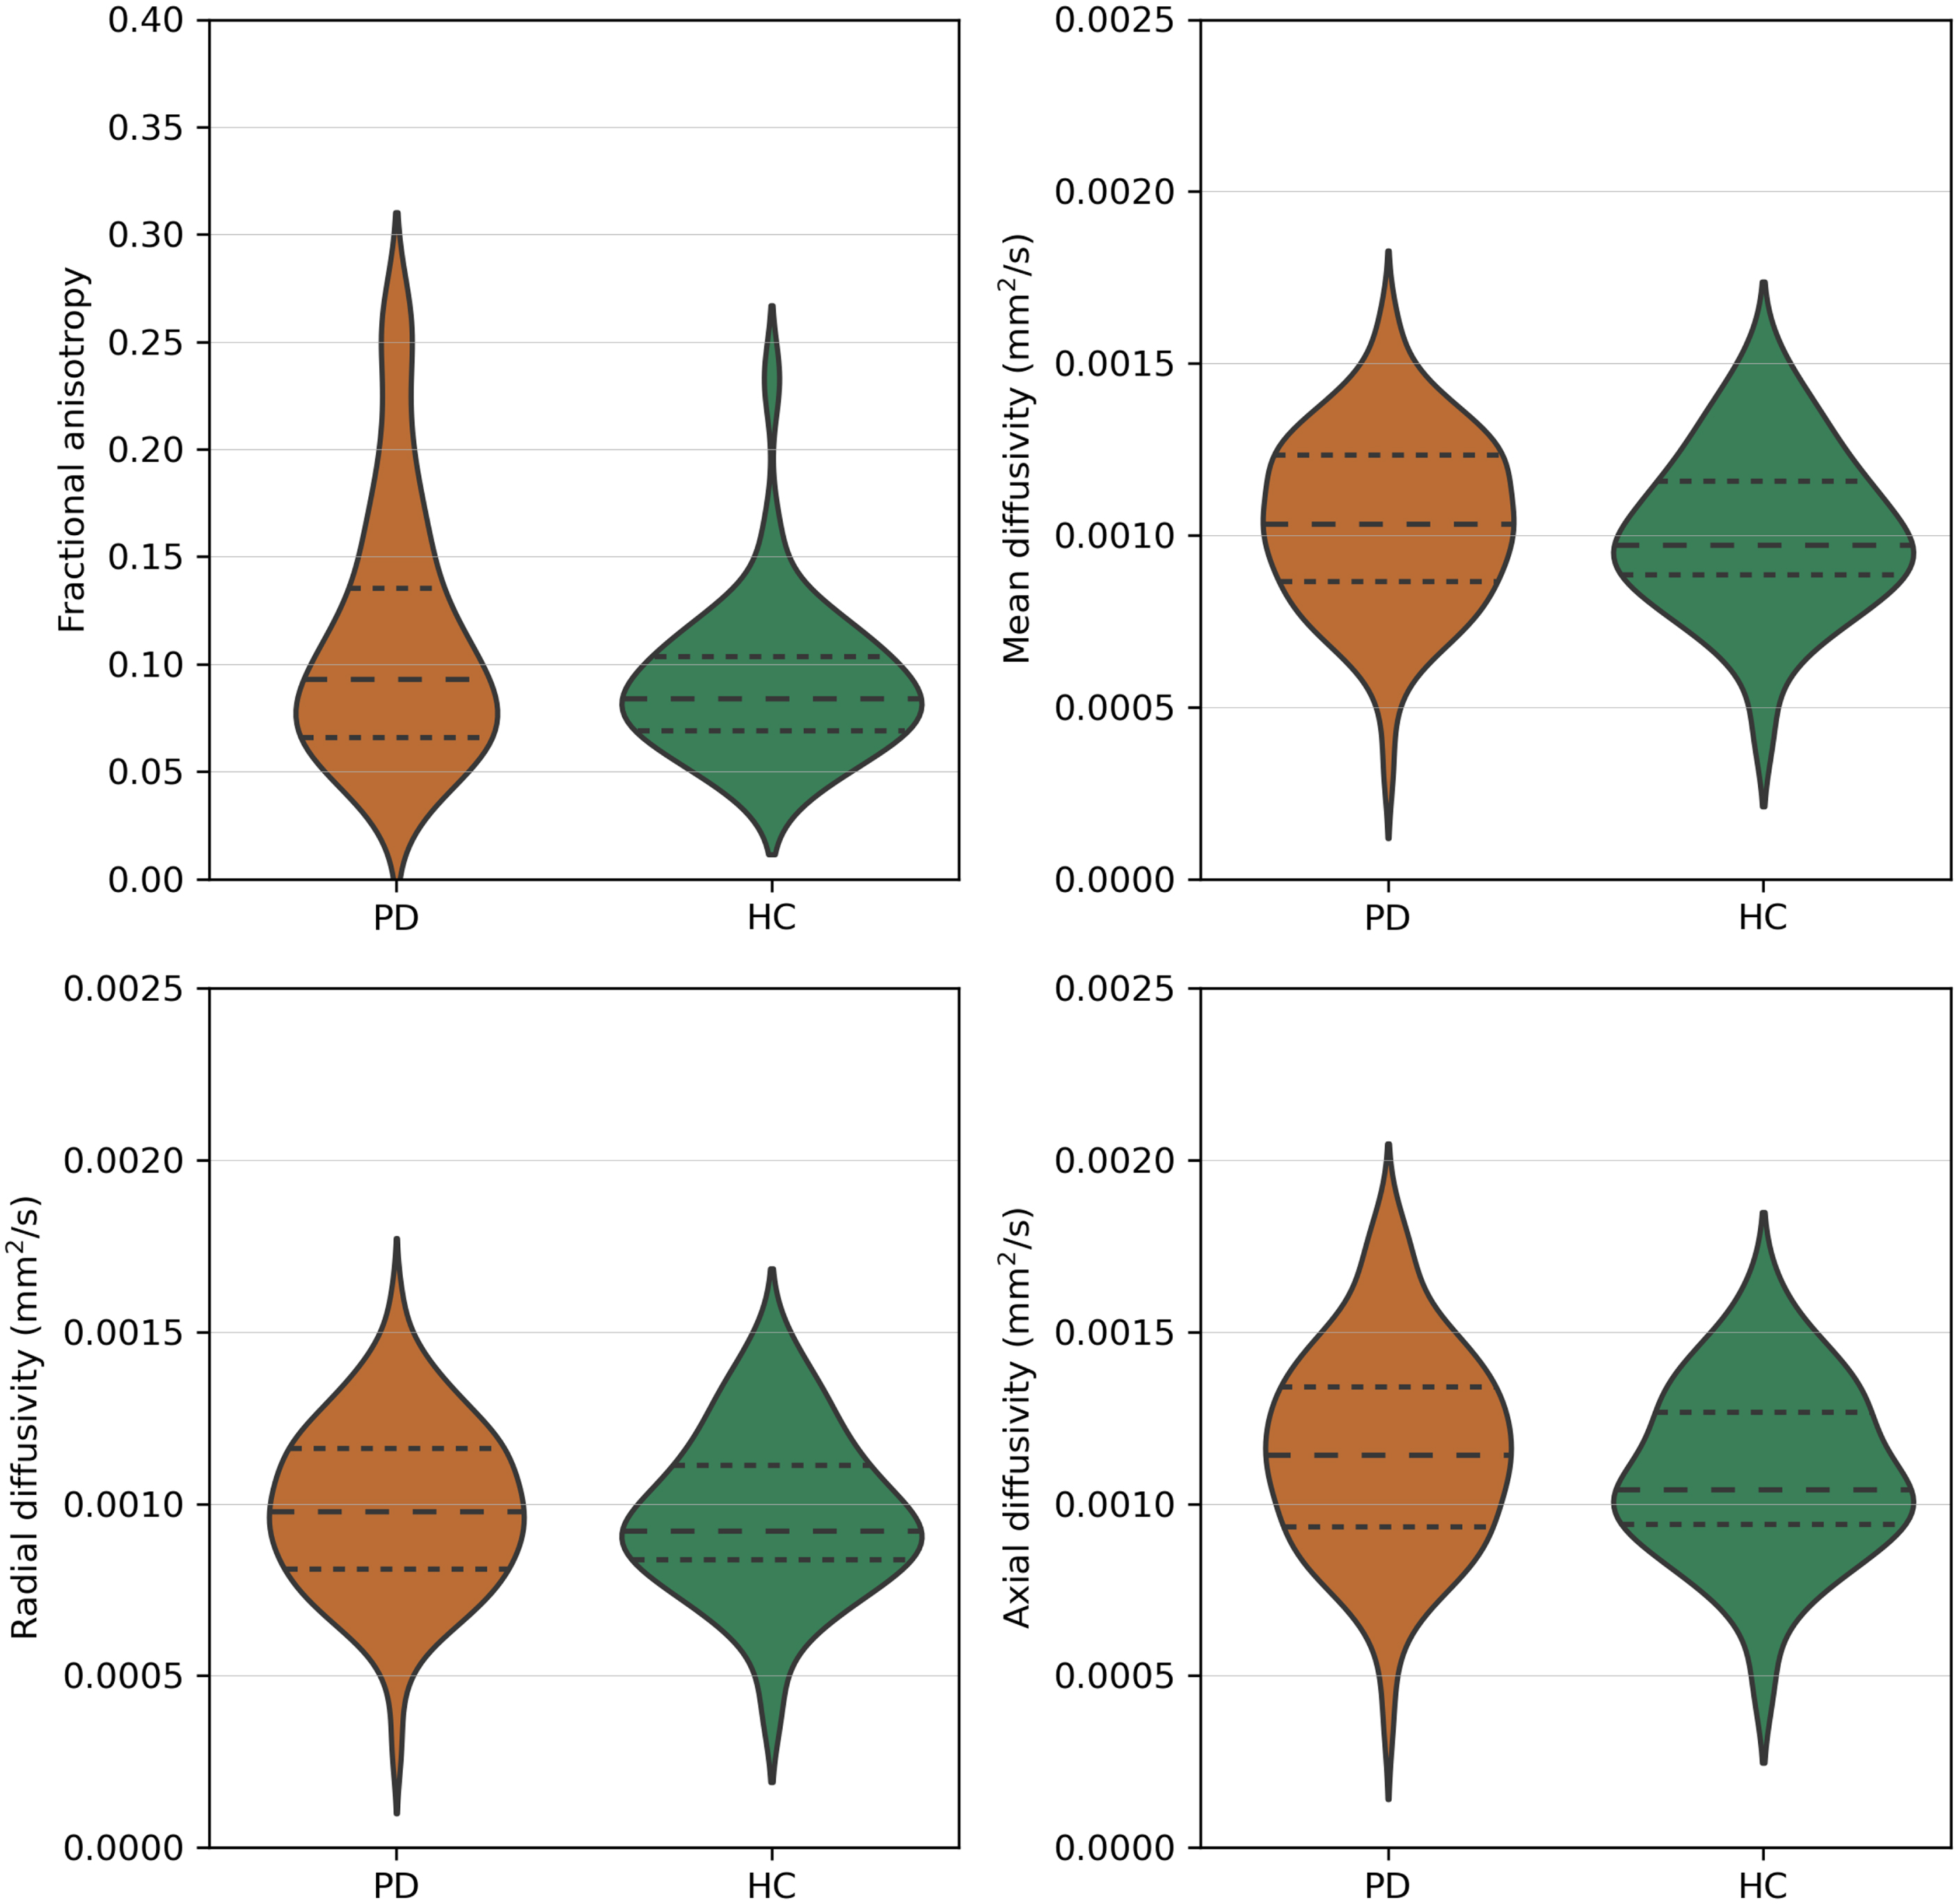
The number of tracts did not significantly differ between PD (mean = 381.2, std = 79.3) and HC (mean = 406.1, std = 111.1). There was no significant difference in FA (p = 0.211), MD (p = 0.505), RD (p = 0.735), and AD values (p = 0.220) between PD and HC (Fig. 2).
Fig. 2
Fractional anisotropy, mean diffusivity, radial diffusivity, and axial diffusivity values of the olfactory tract of Parkinson’s disease patients (PD) and healthy controls (HC). Dashed lines represent the quartiles of the distribution.
3.5Group comparison of diffusion measures of the OT: HA-PD vs. N-PD vs. N-HC
The number of tracts did not significantly differ between HA-PD (mean = 374.6, std = 76.2), N-PD (mean = 383.2, std = 80.7), and N-HC (mean = 406.1, std = 111.1). There was no significant difference in FA (p = 0.313), MD (p = 0.750), RD (p = 0.825), and AD values (p = 0.509) between the HA-PD, N-PD, and N-HC groups (Fig. 3, Table 2).
Fig. 3
Fractional anisotropy, mean diffusivity, radial diffusivity, and axial diffusivity values of the olfactory tract of hyposmic/anosmic Parkinson’s disease patients (HA-PD), normosmic Parkinson’s disease patients (N-PD), and normosmic healthy controls (N-HC). Dashed lines represent the quartiles of the distribution.
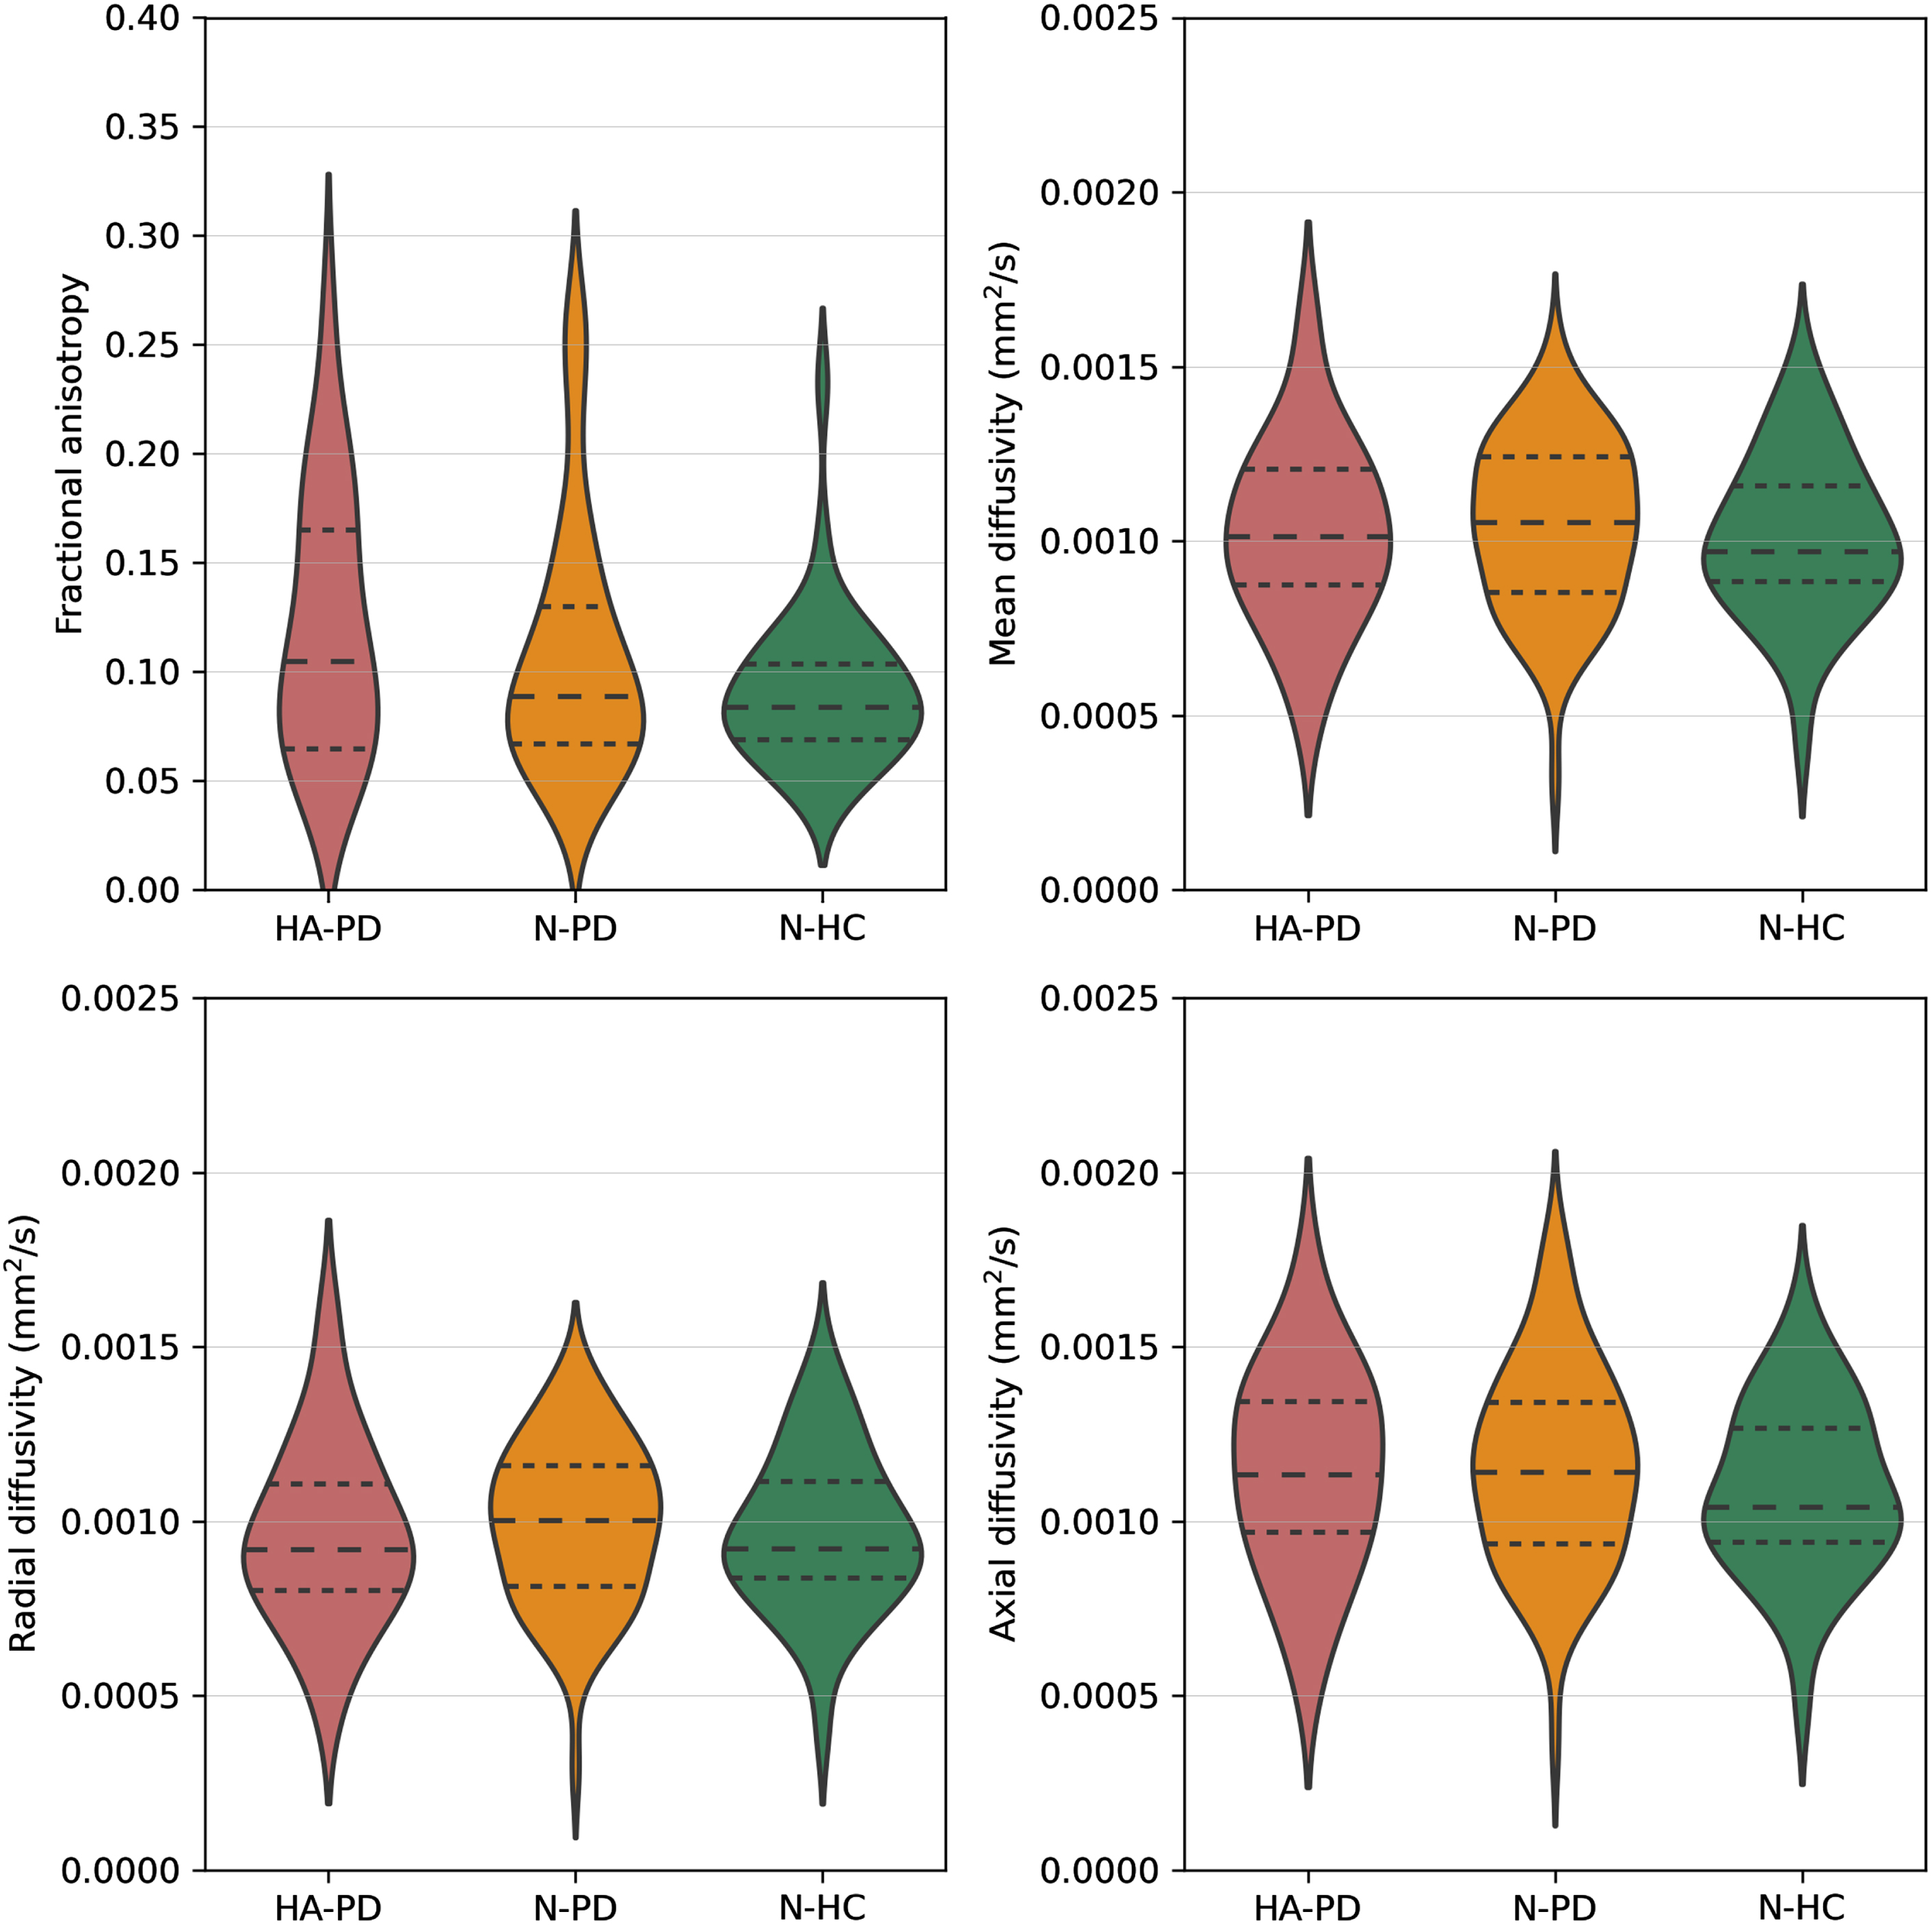
Table 2
Diffusion measures of the olfactory tract
| HA-PD (n = 20) | N-PD (n = 65) | N-HC (n = 36) | p | |
| FA | 0.1212 (0.0600) | 0.1087 (0.0577) | 0.0911 (0.0350) | 0.313 |
| MD (mm2/s) | 0.0010 (0.0003) | 0.0010 (0.0002) | 0.0010 (0.0002) | 0.750 |
| RD (mm2/s) | 0.0010 (0.0003) | 0.0010 (0.0002) | 0.0010 (0.0002) | 0.825 |
| AD (mm2/s) | 0.0011 (0.0003) | 0.0012 (0.0003) | 0.0011 (0.0002) | 0.509 |
Data are presented as mean (std). HA-PD, hyposmic/anosmic Parkinson’s disease patients; N-PD, normosmic Parkinson’s disease patients; N-HC, normosmic healthy controls; FA, fractional anisotropy; MD, mean diffusivity; RD, radial diffusivity; AD, axial diffusivity.
Clinical correlations of diffusion measures of the OT
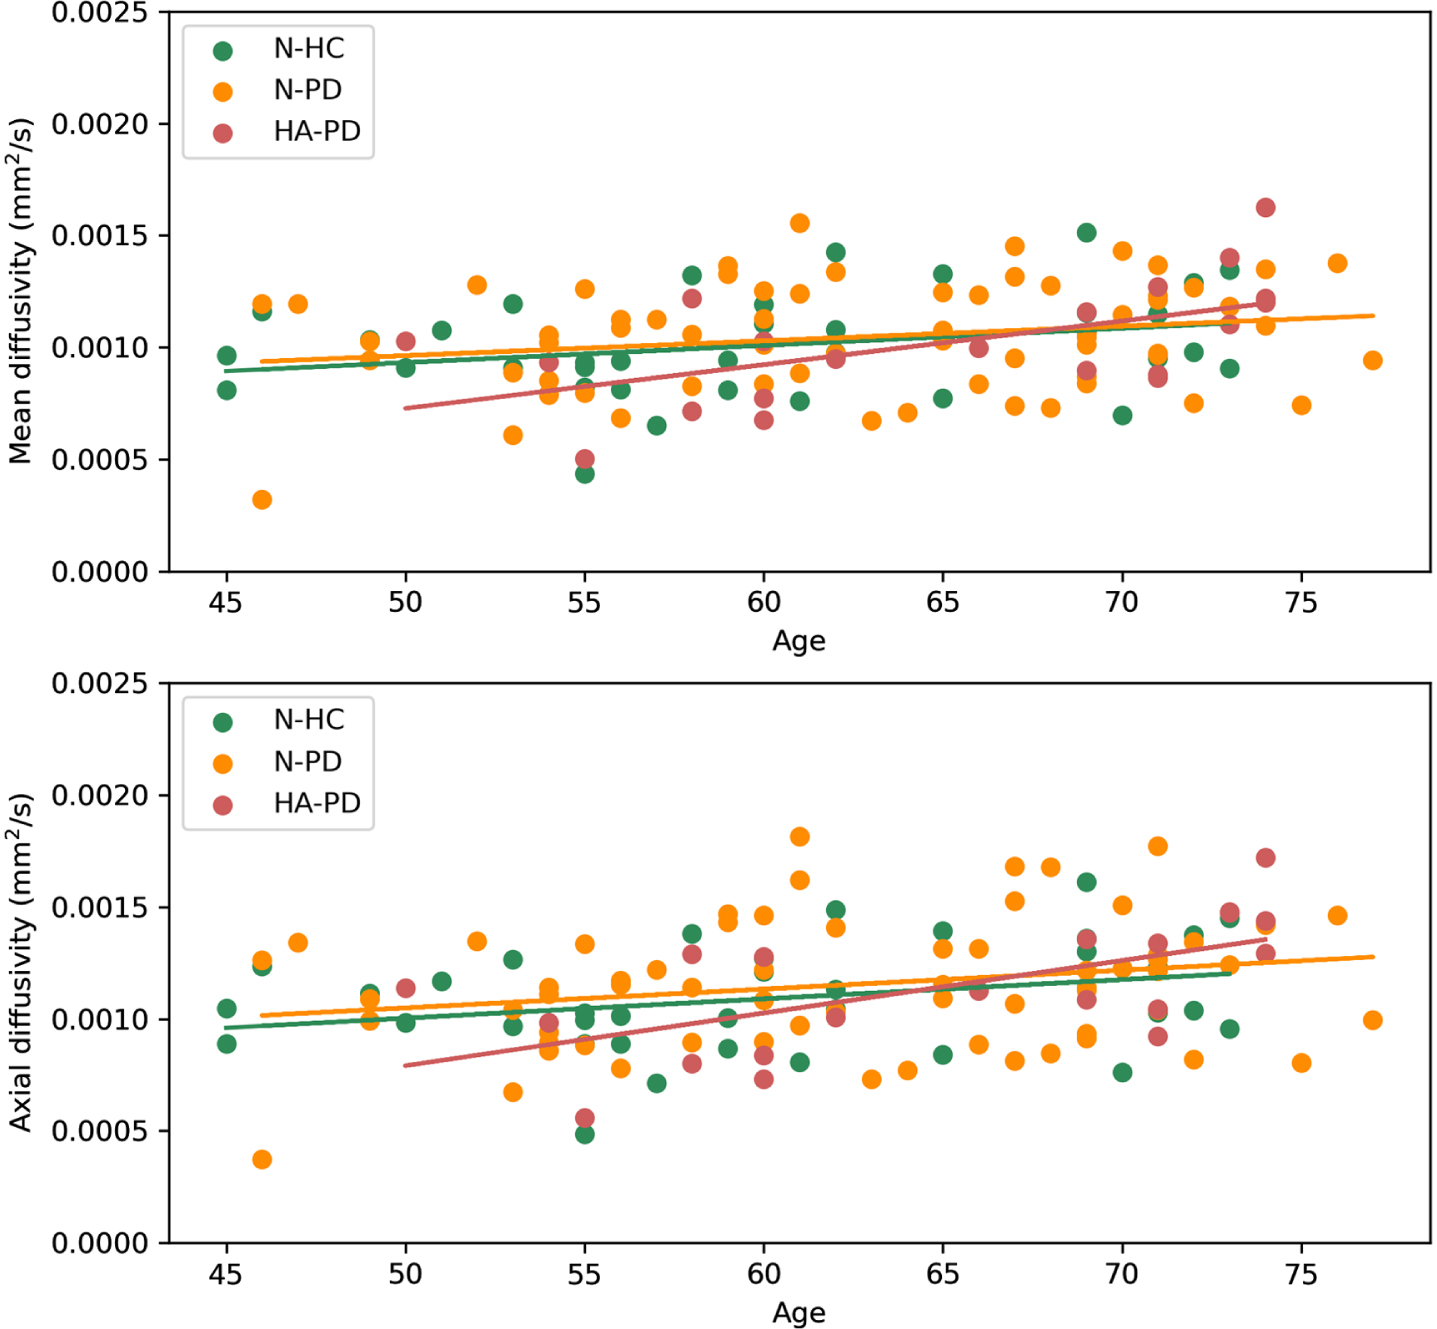
For the total group, significant positive correlations were found between MD and age (r = 0.283, p = 0.006), RD and age (r = 0.246, p = 0.007), and AD and age (r = 0.317, p < 0.001), but not between FA and age (r = –0.072, p = 0.434). When groups were compared separately regarding the association of MD, RD, and AD with age, significant positive correlations were found between MD and age (r = 0.576, p = 0.008) and AD and age (r = 0.667, p = 0.001) for only the HA-PD group (Fig. 4). In contrast, no significant correlations were found between MD and age (N-PD r = 0.191, p = 0.128; N-HC r = 0.265 p = 0.119) and AD and age (N-PD r = 0.212 p = 0.089; N-HC r = 0.270 p = 0.111) for the N-PD and N-HC groups. No significant correlations were found between RD and age for the separate groups (HA-PD r = 0.538, p = 0.015; N-PD r = 0.157, p = 0.210; N-HC r = 0.270, p = 0.111).
Fig. 4
Correlation between mean diffusivity and age per group, and correlation between axial diffusivity and age per group. For the hyposmic/anosmic Parkinson’s disease patients (HA-PD) significant correlations were found between age and mean diffusivity (r = 0.576, p = 0.008) and between age and axial diffusivity (r = 0.667, p = 0.001).
In the PD group, a significant positive correlation was found between MDS-UPDRSIII (ON-medication) and FA (r = 0.304, p = 0.005). When PD groups were compared separately, no significant correlations were found for both the HA-PD (r = 0.359, p = 0.120) and the N-PD group (r = 0.302, p = 0.015). No significant correlations were found for PD duration and OT diffusion measures (FA r = –0.056, p = 0.608; MD r = 0.091, p = 0.407; RD r = 0.097, p = 0.377; AD r = 0.076, p = 0.489).
DISCUSSION
This is the first study which shows feasible and reliable fiber tracking of the OT in both early stage PD and HC using 7T DWI data. We showed that diffusion measures of the OT did not differ between PD and HC and between HA-PD, N-PD, and N-HC. A positive correlation was found for age with MD, RD, and AD. More specific, a correlation was found for age with MD and AD within the HA-PD group, but not within the N-PD and N-HC group. A significant positive correlation between MDS-UPDRSIII (ON-medication state) and FA was found, but not for the other diffusion measures. No significant correlations were found between disease duration and diffusion measures of the OT.
The positive correlation found in this study between MDS-UPDRSIII (ON-medication) and FA of the OT paradoxically suggests that OT integrity increases with PD severity. However, due to the presence of many crossing fibers in the white matter, FA can also increase as a result of disproportionate degradation of one or more of these fiber bundles, even despite an actual decrease in local fiber density and myelination [10, 37]. This would indicate that the white matter fibers in the OT are less complex as PD severity increases, while myelin and axons are preserved. FA results should therefore be interpreted carefully. Recent work also emphasizes that MD measures are far more robust and interpretable compared to FA, AD, and RD [37]. A previous study found a positive correlation between MD and MDS-UPDRSIII (OFF-medication), which is in the expected direction [14]. These previous results should, however, be interpreted with caution, since the sample size in this study was small (n = 16). The question therefore remains in which direction diffusion measures change in relation to neurodegenerative processes in different brain regions.
The positive correlation found in this study between age and MD supports the idea that aging plays an important role in OT alternations [38, 39]. Since the positive correlation of MD with age was found only within the HA-PD subgroup, and an increase in MD can be related to higher axonal degeneration [9, 10], we suggest that aging is accelerated within the HA-PD group compared to the normosmic group. Another recent tractography study showed a negative correlation between FA values of the OT and age for only the HC group and not for the hyposmic PD group [16]. It was suggested that hyposmic PD patients show a more constant and already early degenerated OT, while the OT degenerates with age in the HC group [16]. This would infer that when comparing hyposmic PD with HC of a relatively low mean age, differences in OT degeneration should already be present. Future work comparing PD and HC groups of varying ages should be performed to replicate findings and to unravel how these correlations between FA and MD of the OT and age should be interpreted.
Results from previous studies [13–16] can be interpreted along two axis; hyposmic versus normosmic, and PD versus HC. By using three subgroups, this study ruled out this interpretation along two axis. Our results did, however, not show any differences in diffusion measures between HA-PD, N-PD, and N-HC. Our methods most resemble the recent study by Nigro et al. (2020) [16], which also used OT tractography of DWI images of a recently diagnosed PD group and a HC group. PD and HC groups were comparable to the groups in our study regarding age and disease duration. The main difference between the study performed by Nigro et al. (2020) [16] and our study is the difference in MRI field strength (3T versus 7T). The fact that we did not replicate differences in diffusion measures of the OT between groups may be caused by the higher field strength used in this study. Although the use of 7T DWI may result in more precise targeting of the OT, DWI is one of the techniques for which the actual gain of using 7T may be limited [40], especially since the OT is anatomically close to air-filled sinuses which make this region more prone to susceptibility artifacts. Current results should be replicated using another 7T dataset.
There are several limitations of our study. First, we used a questionnaire, the Self-MOQ, to assess smell capabilities, while previous work used olfactory testing. The Self-MOQ was previously tested extensively and has a good internal reliability and validity [20]. By taking the cut-off score of 3.5 points, normosmic and hyposmic/anosmic participants were classified with an area under the curve of 0.85 [20]. Although the Self-MOQ has been shown to be able to screen olfactory dysfunction, it cannot replace olfactory testing. It should also be taken into account that the incidence of hyposmic/anosmic PD patients in this study according to the Self-MOQ was 24%, while previous work reports percentages of over 60% [41]. Second, we did not have any knowledge about potential COVID-19 infections at the time the Self-MOQ questionnaire was completed by the participants. It might be that a COVID-19 infection was the reason participants were classified as (temporarily) hyposmic/anosmic. Last, we used a fairly standard 7T MRI sequence in the TRACK-PD study, which was not optimized to measure the OT, and maybe multi-shell DWI is more sensitive. Extensive quality control of the diffusion data was, however, performed and we were able to reliably trace the OT for all participants.
In conclusion, this study showed that fiber tracking of the OT was feasible in both early stage PD and HC using 7T DWI data. In order to serve as a clinically relevant biomarker, the diffusion measures of the OT should differ between N-PD and N-HC. We therefore conclude, based on the presented results, that 7T diffusion measures of the OT are not useful as an early clinical biomarker for PD. Future work is needed to clarify the role of other OT measurements as a biomarker for PD.
ACKNOWLEDGMENTS
MRI data included in this study were acquired on the 7T system at Scannexus (Maastricht, The Netherlands). This study was funded by a grant from the Weijerhorst Foundation (Stichting de Weijerhorst). This foundation supports and promotes activities in the public interest, in particular scientific research. The sponsor has no role in the design of the study and collection, analysis, and interpretation of data. Also, the sponsor was not involved in writing this manuscript.
CONFLICT OF INTEREST
The authors have no conflict of interest to report.
REFERENCES
[1] | Postuma RB , Berg D , Stern M , Poewe W , Olanow CW , Oertel W , Obeso J , Marek K , Litvan I , Lang AE , Halliday G , Goetz CG , Gasser T , Dubois B , Chan P , Bloem BR , Adler CH , Deuschl G ((2015) ) MDS clinical diagnostic criteria for Parkinson’s disease. Mov Disord 30: , 1591–1601. |
[2] | Hughes AJ , Daniel SE , Ben-Shlomo Y , Lees AJ ((2002) ) The accuracy of diagnosis of parkinsonian syndromes in a specialist movement disorder service. Brain J Neurol 125: , 861–870. |
[3] | Isaias IU , Trujillo P , Summers P , Marotta G , Mainardi L , Pezzoli G , Zecca L , Costa A ((2016) ) Neuromelanin imaging and dopaminergic loss in Parkinson’s disease. Front Aging Neurosci 8: , 196. |
[4] | Lehericy S , Vaillancourt DE , Seppi K , Monchi O , Rektorova I , Antonini A , McKeown MJ , Masellis M , Berg D , Rowe JB , Lewis SJG , Williams-Gray CH , Tessitore A , Siebner HR , International Parkinson and Movement Disorder Society (IPMDS)-Neuroimaging Study Group ((2017) ) The role of high-field magnetic resonance imaging in parkinsonian disorders: Pushing the boundaries forward. Mov Disord 32: , 510–525. |
[5] | Prange S , Metereau E , Thobois S ((2019) ) Structural imaging in Parkinson’s disease: New developments. Curr Neurol Neurosci Rep 19: , 50. |
[6] | Schwarz ST , Afzal M , Morgan PS , Bajaj N , Gowland PA , Auer DP ((2014) ) The ‘swallow tail’ appearance of the healthy nigrosome –a new accurate test of Parkinson’s disease: A case-control and retrospective cross-sectional MRI study at 3T. PLoS One 9: , e93814. |
[7] | Wolters AF , Heijmans M , Michielse S , Leentjens AFG , Postma AA , Jansen JFA , Ivanov D , Duits AA , Temel Y , Kuijf ML ((2020) ) The TRACK-PD study: Protocol of a longitudinal ultra-high field imaging study in Parkinson’s disease. BMC Neurol 20: , 292. |
[8] | Basser PJ , Mattiello J , LeBihan D ((1994) ) MR diffusion tensor spectroscopy and imaging. Biophys J 66: , 259–267. |
[9] | Alexander AL , Lee JE , Lazar M , Field AS ((2007) ) Diffusion tensor imaging of the brain. Neurotherapeutics 4: , 316–329. |
[10] | Mori S , Zhang J ((2006) ) Principles of diffusion tensor imaging and its applications to basic neuroscience research. Neuron 51: , 527–539. |
[11] | Braak H , Ghebremedhin E , Rüb U , Bratzke H , Del Tredici K ((2004) ) Stages in the development of Parkinson’s disease-related pathology. Cell Tissue Res 318: , 121–134. |
[12] | Atkinson-Clement C , Pinto S , Eusebio A , Coulon O ((2017) ) Diffusion tensor imaging in Parkinson’s disease: Review and meta-analysis. Neuroimage Clin 16: , 98–110. |
[13] | Rolheiser TM , Fulton HG , Good KP , Fisk JD , McKelvey JR , Scherfler C , Khan NM , Leslie RA , Robertson HA ((2011) ) Diffusion tensor imaging and olfactory identification testing in early-stage Parkinson’s disease. J Neurol 258: , 1254–1260. |
[14] | Scherfler C , Esterhammer R , Nocker M , Mahlknecht P , Stockner H , Warwitz B , Spielberger S , Pinter B , Donnemiller E , Decristoforo C , Virgolini I , Schocke M , Poewe W , Seppi K ((2013) ) Correlation of dopaminergic terminal dysfunction and microstructural abnormalities of the basal ganglia and the olfactory tract in Parkinson’s disease. Brain 136: , 3028–3037. |
[15] | Georgiopoulos C , Warntjes M , Dizdar N , Zachrisson H , Engström M , Haller S , Larsson E-M ((2017) ) Olfactory impairment in Parkinson’s disease studied with diffusion tensor and magnetization transfer imaging. J Parkinsons Dis 7: , 301–311. |
[16] | Nigro P , Chiappiniello A , Simoni S , Paolini Paoletti F , Cappelletti G , Chiarini P , Filidei M , Eusebi P , Guercini G , Santangelo V , Tarducci R , Calabresi P , Parnetti L , Tambasco N ((2021) ) Changes of olfactory tract in Parkinson’s disease: A DTI tractography study. Neuroradiology 63: , 235–242. |
[17] | Nasreddine ZS , Phillips NA , Bédirian V , Charbonneau S , Whitehead V , Collin I , Cummings JL , Chertkow H ((2005) ) The Montreal CognitiveAssessment, MoCA: A brief screening tool for mild cognitiveimpairment. J Am Geriatr Soc 53: , 695–699. |
[18] | Goetz CG , Tilley BC , Shaftman SR , Stebbins GT , Fahn S , Martinez-Martin P , Poewe W , Sampaio C , Stern MB , Dodel R , Dubois B , Holloway R , Jankovic J , Kulisevsky J , Lang AE , Lees A , Leurgans S , LeWitt PA , Nyenhuis D , Olanow CW , Rascol O , Schrag A , Teresi JA , van Hilten JJ , LaPelle N , Movement Disorder Society UPDRS Revision Task Force ((2008) ) Movement Disorder Society-sponsored revision of the Unified Parkinson’s Disease Rating Scale (MDS-UPDRS): Scale presentation and clinimetric testing results. Mov Disord 23: , 2129–2170. |
[19] | Goetz CG , Poewe W , Rascol O , Sampaio C , Stebbins GT , Counsell C , Giladi N , Holloway RG , Moore CG , Wenning GK , Yahr MD , Seidl L , Movement Disorder Society Task Force on Rating Scales for Parkinson’s Disease ((2004) ) Movement Disorder Society Task Force report on the Hoehn and Yahr staging scale: Status and recommendations. Mov Disord 19: , 1020–1028. |
[20] | Zou L-Q , Linden L , Cuevas M , Metasch M-L , Welge-Lüssen A , Hähner A , Hummel T ((2020) ) Self-reported mini olfactory questionnaire (Self-MOQ): A simple and useful measurement for the screening of olfactory dysfunction. Laryngoscope 130: , E786–E790. |
[21] | Chung JW , Burciu RG , Ofori E , Shukla P , Okun MS , Hess CW , Vaillancourt DE ((2017) ) Parkinson’s disease diffusion MRI is not affected by acute antiparkinsonian medication. NeuroImage Clin 14: , 417–421. |
[22] | Teeuwisse WM , Brink WM , Webb AG ((2012) ) Quantitative assessment of the effects of high-permittivity pads in 7 Tesla MRI of the brain. Magn Reson Med 67: , 1285–1293. |
[23] | Griswold MA , Jakob PM , Heidemann RM , Nittka M , Jellus V , Wang J , Kiefer B , Haase A ((2002) ) Generalized autocalibrating partially parallel acquisitions (GRAPPA). Magn Reson Med 47: , 1202–1210. |
[24] | Li X , Morgan PS , Ashburner J , Smith J , Rorden C ((2016) ) The first step for neuroimaging data analysis: DICOM to NIfTI conversion. J Neurosci Methods 264: , 47–56. |
[25] | Kellner E , Dhital B , Kiselev VG , Reisert M ((2016) ) Gibbs-ringing artifact removal based on local subvoxel-shifts. Magn Reson Med 76: , 1574–1581. |
[26] | Veraart J , Fieremans E , Novikov DS ((2016) ) Diffusion MRI noise mapping using random matrix theory. Magn Reson Med 76: , 1582–1593. |
[27] | Veraart J , Novikov DS , Christiaens D , Ades-Aron B , Sijbers J , Fieremans E ((2016) ) Denoising of diffusion MRI using random matrix theory. NeuroImage 142: , 394–406. |
[28] | Andersson JLR , Skare S , Ashburner J ((2003) ) How to correct susceptibility distortions in spin-echo echo-planar images: Application to diffusion tensor imaging. Neuroimage 20: , 870–888. |
[29] | Andersson JLR , Sotiropoulos SN ((2016) ) An integrated approach to correction for off-resonance effects and subject movement in diffusion MR imaging. NeuroImage 125: , 1063–1078. |
[30] | Smith SM , Jenkinson M , Woolrich MW , Beckmann CF , Behrens TE , Johansen-Berg H , Bannister PR , De Luca M , Drobnjak I , Flitney DE , Niazy RK , Saunders J , Vickers J , Zhang Y , De Stefano N , Brady JM , Matthews PM ((2004) ) Advances in functional and structural MR image analysis and implementation as FSL. Neuroimage 23: (Suppl 1), S208–S219. |
[31] | Bastiani M , Cottaar M , Fitzgibbon SP , Suri S , Alfaro-Almagro F , Sotiropoulos SN , Jbabdi S , Andersson JLR ((2019) ) Automated quality control for within and between studies diffusion MRI data using a non-parametric framework for movement and distortion correction. Neuro Image 184: , 801–812. |
[32] | Tournier J-D , Calamante F , Connelly A ((2013) ) Determination of the appropriate b value and number of gradient directions for high-angular-resolution diffusion-weighted imaging. NMR Biomed 26: , 1775–1786. |
[33] | Tournier J-D , Calamante F , Connelly A ((2007) ) Robust determination of the fibre orientation distribution in diffusion MRI: Non-negativity constrained super-resolved spherical deconvolution. NeuroImage 35: , 1459–1472. |
[34] | Tournier J-D , Calamante F , Connelly A ((2012) ) MRtrix: Diffusion tractography in crossing fiber regions. Int J Imaging Syst Technol 22: , 53–66. |
[35] | Basser PJ , Mattiello J , LeBihan D ((1994) ) Estimation of the effective self-diffusion tensor from the NMR spin echo. J Magn Reson B 103: , 247–254. |
[36] | Bartko JJ ((1966) ) The intraclass correlation coefficient as a measure of reliability. Psychol Rep 19: , 3–11. |
[37] | Figley CR , Uddin MN , Wong K , Kornelsen J , Puig J , Figley TD ((2022) ) Potential pitfalls of using fractional anisotropy, axial diffusivity, and radial diffusivity as biomarkers of cerebral white matter microstructure. Front Neurosci 15: , 799576. |
[38] | Felix C , Chahine LM , Hengenius J , Chen H , Rosso AL , Zhu X , Cao Z , Rosano C ((2021) ) Diffusion tensor imaging of the olfactory system in older adults with and without hyposmia. Front Aging Neurosci 13: , 648598. |
[39] | Kondo K , Kikuta S , Ueha R , Suzukawa K , Yamasoba T ((2020) ) Age-related olfactory dysfunction: Epidemiology, pathophysiology, and clinical management. Front Aging Neurosci 12: , 208. |
[40] | Polders DL , Leemans A , Hendrikse J , Donahue MJ , Luijten PR , Hoogduin JM ((2011) ) Signal to noise ratio and uncertainty in diffusion tensor imaging at 1.5, 3.0, and 7.0 Tesla. J Magn Reson Imaging 33: , 1456–1463. |
[41] | Kanavou S , Pitz V , Lawton MA , Malek N , Grosset KA , Morris HR , Ben-Shlomo Y , Grosset DG ((2021) ) Comparison between four published definitions of hyposmia in Parkinson’s disease.. Brain Behav 11: , e2258. |


