
Comparative Analysis of Total Alpha-Synuclein (αSYN) Immunoassays Reveals That They Do Not Capture the Diversity of Modified αSYN Proteoforms
Abstract
Background:
The development of therapeutics for Parkinson’s disease (PD) requires the establishment of biomarker assays to enable stratifying patients, monitoring disease progression, and assessing target engagement. Attempts to develop diagnostic assays based on detecting levels of the α-synuclein (αSYN) protein, a central player in the pathogenesis of PD, have yielded inconsistent results.
Objective:
To determine whether the three commercial kits that have been extensively used for total αSYN quantification in human biological fluids (from Euroimmun, MSD, and Biolegend) are capable of capturing the diversity and complexity of relevant αSYN proteoforms.
Methods:
We investigated and compared the ability of the different assays to detect the diversity of αSYN proteoforms using a library of αSYN proteins that comprise the majority of disease-relevant αSYN variants and post-translational modifications (PTMs).
Results:
Our findings showed that none of the three tested immunoassays accurately capture the totality of relevant αSYN species, and that these assays are unable to recognize most disease-associated C-terminally truncated variants of αSYN. Moreover, several N-terminal truncations and phosphorylation/nitration PTMs differentially modify the level of αSYN detection and recovery by different immunoassays, and a CSF matrix effect was observed for most of the αSYN proteoforms analyzed by the three immunoassays.
Conclusion:
Our results show that the tested immunoassays do not capture the totality of the relevant αSYN species and therefore may not be appropriate tools to provide an accurate measure of total αSYN levels in samples containing modified forms of the protein. This highlights the need for next generation αSYN immunoassays that capture the diversity of αSYN proteoforms.
INTRODUCTION
Parkinson’s disease (PD) is a neurodegenerative disorder whose exact cause is still unknown and for which no therapy is available today. The number of patients suffering from PD is projected to increase from 6.1 million (reported in 2016 [1]) to 9.3 million by 2030 [2], making PD one of the fastest growing neurological disorders worldwide. Dopaminergic therapies represent the gold standard for symptom management of PD, but intervention to modify and slow down the clinical course of the disease remains a major unmet need, as many disease-modifying therapies targeting different pathogenic pathways in PD have recently failed to meet their primary endpoints in clinical trials [3–7]. Among the different reasons underlying these recent failures is the clinical heterogeneity of PD, and the lack of sensitive biomarkers and assays that enable early diagnosis of PD, patient stratification, assessment of target engagement, and monitoring of disease progression.
Currently, the diagnosis of PD is mainly based on the medical history of the patients, a review of clinical symptoms, and neurological and physical examination following the International Parkinson and Movement Disorder criteria [8]. Given that the first symptoms of PD are also common to other neurodegenerative movement disorders or medical conditions, PD is often misdiagnosed. In fact, accurate clinical diagnosis is often made only when ∼70% of the dopaminergic neurons have already degenerated, a very late stage of disease progression [9]. This, combined with the fact that the disease starts 10–15 years before the manifestation of the characteristic clinical symptoms of the disease, underscores the critical importance of developing biomarker assays not only to support accurate and early diagnosis, but also to monitor disease progression, enable patient stratification and interrogate the efficacy of therapeutics in the clinic.
Over the past 20 years, the protein α-synuclein (αSYN) has attracted increasing interest as a central player in the pathogenesis of PD and as one of the primary therapeutic targets for the treatment of PD. This was mainly following the seminal discovery that mutations in the SNCA gene encoding αSYN cause familial PD [10, 11], and that aggregated and post-translationally modified (PTM) forms of αSYN, including phosphorylated, nitrated, ubiquitinated, and truncated species, are key components of Lewy bodies (LB) and Lewy neurites, the main neuropathological hallmark of PD and other synucleinopathies [12–15]. Furthermore, the finding that different αSYN proteoforms could be detected in biological fluids (cerebrospinal fluid (CSF), plasma, red blood cells (RBC), and saliva [16–29] as well as in peripheral tissues (skin, intestinal mucosa, submandibular gland) [30–33] stimulated interest in αSYN as a potential disease biomarker for early diagnosis of PD, and for the differentiation between PD and other synucleinopathies [27, 34–36].
Several αSYN-targeting therapeutic approaches are being pursued in academia and industry underscoring the need for sensitive αSYN assays to assess target engagement and therapeutic efficacy. Nevertheless, accurate detection and quantification of total αSYN (which includes known unmodified and post-translationally modified forms of αSYN) continues to represent a major challenge, as demonstrated by the marked discrepancies in αSYN levels reported by different studies and laboratories.
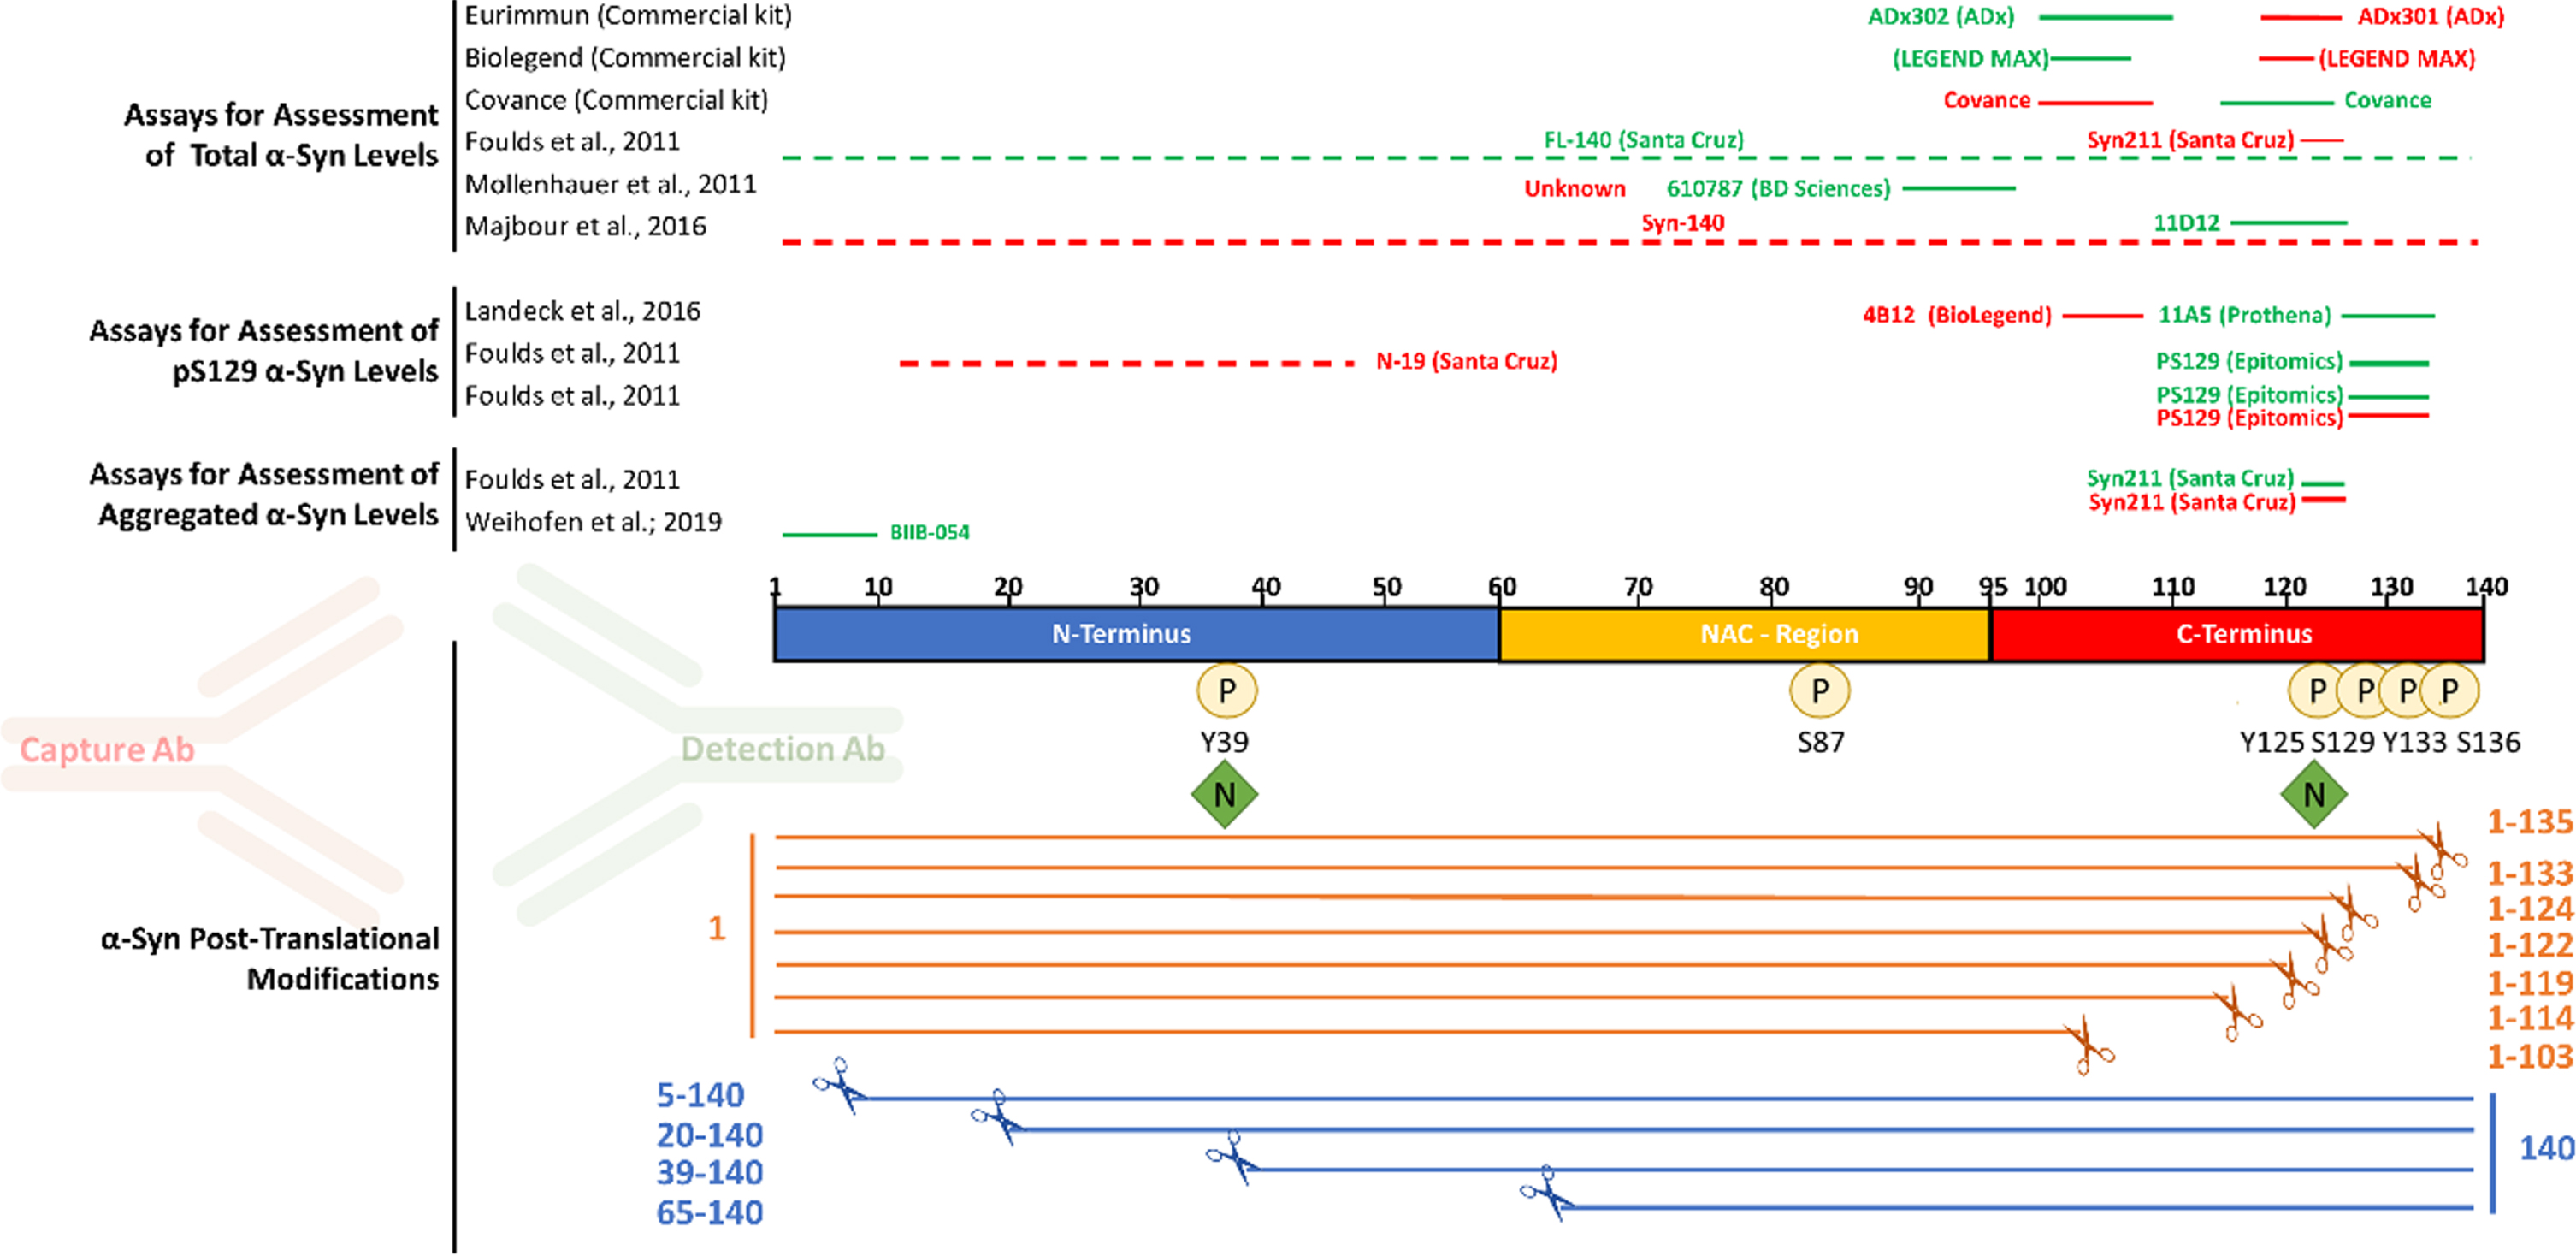
Fig. 1
Most antibodies used in immunoassays target the C-terminal post-translationally modified region of αSYN. The main αSYN PTMs (phosphorylation, nitration, and truncation) are depicted. Red and green bars above the sequence of αSYN show the epitopes of capture and detection antibodies, respectively, that have been used in immunoassays to measure total αSYN, pS129 αSYN, and aggregated αSYN levels in human biological specimens.
Whereas several independent groups have reported lower total αSYN levels in the CSF of PD patients compared to control subjects [18–20, 24–28], other groups have found no significant differences [29, 32]. Similarly, attempts to use total CSF αSYN levels to distinguish among different types of synucleinopathies, including PD, multiple system atrophy, dementia with Lewy bodies, and progressive supranuclear palsy, have yielded inconsistent results [27, 34–36]. Furthermore, large variations and discrepancies have been reported in the quantified levels of total αSYN using different assays. For instance, in a recent comparative study using the same human CSF samples [37], although four of the most commonly used commercial immunoassays for total αSYN detection revealed similar overall correlations across cohorts of patients and controls, large variations in the absolute concentrations of total αSYN have been reported. Indeed, the Euroimmun (Euroimmun AG, Lübeck, Germany, developed by ADx Neurosciences, Gent, Belgium) and BioLegend Legendmax (San Diego, CA, USA) immunoassays gave much higher concentrations than the MSD U-PLEX® (Meso Scale Discovery, Rockville, Maryland) and Roche Elecsys® (Roche Diagnostics, Penzberg, Germany) assays (334–3547 pg/mL, compared to 35.1–607 pg/mL).
Several factors have been proposed to explain such variations in total αSYN detection, including: 1) the clinical heterogeneity of patients; 2) differences in sample-handling procedures; 3) differences in the sensitivity of the assay platforms; and 4) the use of different protein standards in absence of a certified reference material. In addition, we hypothesized that the antibodies deployed in most of these assays might not capture the full diversity of relevant αSYN proteoforms in biological samples. Indeed, increasing evidence shows that αSYN in brain LBs, peripheral tissues, and biological fluids exists as a mixture of different PTM forms and conformations, including different phosphorylated, truncated, nitrated, and ubiquitinated forms of αSYN [38–41]. Moreover, the levels of several modified αSYN proteoforms have been reported to be higher in biological fluids and tissues of PD patients than in those of healthy controls, although many of these findings need to be validated in larger cohorts. Furthermore, the distribution of αSYN proteoforms was recently shown to differ between the soluble and insoluble states of the protein and between brain tissues and peripheral tissues (e.g., appendix [33]). Altogether, these observations suggest that assays that do not account for this diversity may not accurately report on the total levels of αSYN.
Notably, most of the antibodies deployed in commercial immunoassays for total αSYN target the C-terminal domain of αSYN (Fig. 1), which is known to harbor the majority of αSYN PTMs, including phosphorylation, nitration and C-terminal truncations [38, 39]. The most likely reason for the selection of these antibody pairs is that the C-terminus of αSYN is the most immunogenic region and results in high affinity antibodies and thus better assay performance, as compared to N-terminal αSYN antibodies which exhibit in general a lower affinity thereby resulting in lower sensitivity assays. Nevertheless, it is possible that the multitude of C-terminal PTMs neighboring the epitopes of these antibodies could either eliminate or mask the epitope [42], or interfere with antibody binding to αSYN resulting in a biased analyte concentration. In addition, the great majority of αSYN immunoassays were developed based on the use of a single protein standard (full-length αSYN), which may have led to the downstream development of assays that do not necessarily capture the diversity of αSYN proteoforms.
In this study, we sought to test this hypothesis by systematically investigating whether the three commercial kits that have been extensively used for total αSYN quantification in human biological fluids (from Euroimmun, MSD, and Biolegend) are capable of detecting the diversity and complexity of αSYN proteoforms. For this purpose, we capitalized on our ability to reconstitute the diversity of αSYN PTM species under controlled conditions [43–48]. Specifically, we assessed the ability of the different assays to detect different αSYN proteoforms harboring N- and C-terminal truncations and other site-specific PTMs, such as phosphorylation and nitration at different residues. Altogether, our findings show that the three analyzed immunoassays do not capture the totality of the relevant αSYN species. More specifically, the three assays fail to detect the most common disease- and pathology-associated truncated αSYN species. Furthermore, N-terminal truncations and PTMs (phosphorylation/nitration) differentially modify the level of αSYN detection and recovery by different immunoassays. The implications for developing assays that allow the accurate quantification of total αSYN levels and the assessment of αSYN as a diagnostic biomarker for PD and other synucleinopathies are discussed. These findings suggest that these assays are not appropriate tools to provide an accurate estimate of total αSYN levels in biological samples that are likely to contain modified forms of the protein.
MATERIALS AND METHODS
Preparation and characterization of the αSYN protein library
All proteins except pS129 αSYN were generated at the Lashuel laboratory using recombinant protein expression, protein semisynthesis, or previously described total chemical synthesis strategies [43–46], [47–49]. The purity of all proteins was independently validated by the Lashuel laboratory and at ND Biosciences by multiple techniques, including Coomassie staining, mass spectrometry and ultra performance liquid chromatography (UPLC), which together established the purity and integrity of the generated proteins. Lyophilized samples were resuspended in 1x Tris-buffered saline and passed through a 100 kDa filter. Human alpha-synuclein phospho-Ser129 protein (Cat. No. RP-004) was purchased from Proteos (Proteos, Inc., USA) and resuspended according to the manufacturer’s instructions. All proteins were quantified by amino-acid analysis to establish accurate protein concentrations (Functional Genomics Center Zurich, ETH Zürich).
Human CSF samples
Commercial pooled human CSF was acquired from Innovative Research Inc. (Cat. No. IRHUCSF5ML) and stored in aliquots frozen at -20°C until use.
Assessment of the in-house αSYN protein library using total αSYN commercial immunoassay kits
The LEGEND MAX trademark Human α-Synuclein ELISA Kit (BioLegend; Cat. No. 844101) was kindly provided by Biolegend. The assay was performed according to the manufacturer’s instructions. In brief, full dilution curves of the 10 proteins with the same dynamic range as the standard curve of the kit-standard (6.1–1500 pg/ml) were obtained by serial dilutions in assay buffer. Calibration curve points and protein samples were loaded in duplicate. Luminescence was measured using a FLUOstar plate reader (BMG Labtech). The results were fitted to a 4-parameter sigmoid curve and plotted against the kit standard curve. Further technical and handling considerations can be found in Supplementary Figure 1.
Spike recovery experiments were performed by spiking high (900 pg/ml), medium (300 pg/ml), and low (50 pg/ml) amounts of each protein (according to the dynamic range of the kit’s standard curve) into assay buffer and into commercial human CSF (hCSF). hCSF samples were diluted 1:20 according to the manufacturer’s instructions. Recovery was assessed as the percentage of the back-calculated values of the spiked samples (subtracted of the unspiked sample) with respect to the nominal spiked protein amount. The high, medium, and low recovery percentages were averaged.
U-PLEX Plus Human Alpha-Synuclein Kit (Mesoscale Discovery; Cat. No. K151 WKP-2) was purchased from Meso Scale Diagnostics. The assay was performed according to the manufacturer’s instructions. In brief, full dilution curves of the 10 proteins with the same dynamic range as the standard curve of the kit-standard (2.44–10000 pg/ml) were obtained by serial dilutions in assay buffer. Calibration curve points and protein samples were loaded in duplicate. Plates were read using a MESO QuickPlex SQ 120 (Mesoscale Discovery). The results were fitted to a 4-parameter sigmoid curve and plotted against the kit standard curve. Further technical and handling considerations can be found in Supplementary Figure 1.
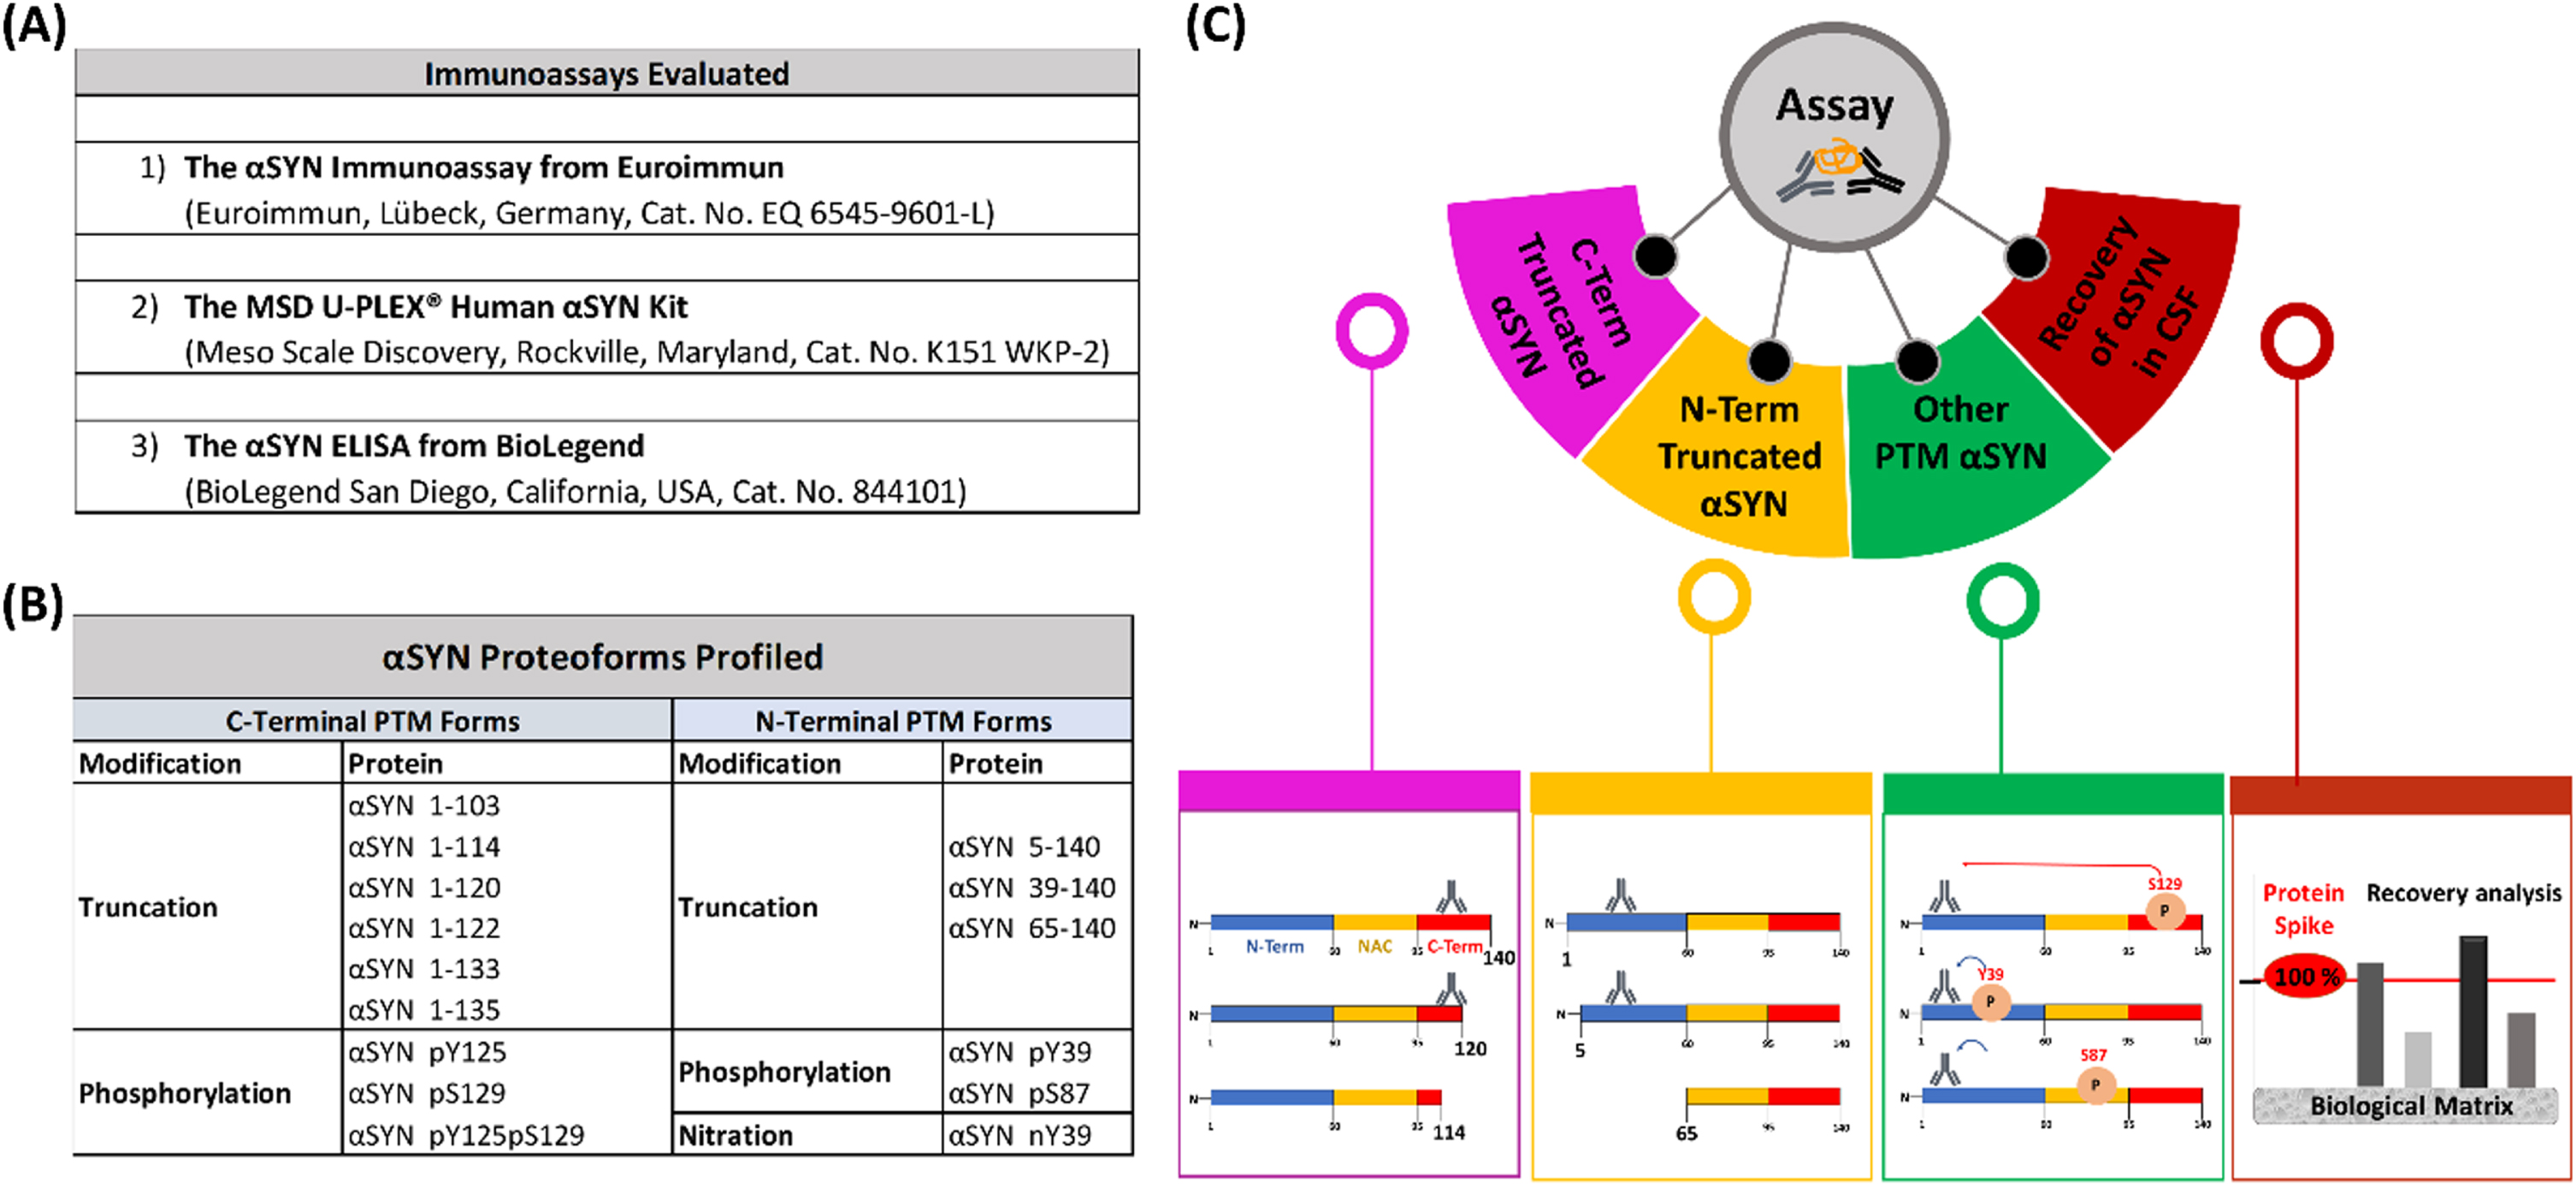
Fig. 2
Tables of the evaluated immunoassays (A) and profiled αSYN proteins (B) and schematic depiction of the workflow (C) deployed to evaluate and characterize the three immunoassays.
Spike recovery experiments were performed by spiking high (7000 pg/ml), medium (1000 pg/ml), and low (100 pg/ml) amounts of each protein (according to the dynamic range of the kit’s standard curve) into assay buffer and into commercial hCSF. hCSF samples were diluted 1:20 according to the manufacturer’s instructions. Recovery was assessed as the percentage of the back-calculated values of the spiked samples (subtracted of the unspiked sample) with respect to the nominal spiked protein amount. The high, medium, and low recovery percentages were averaged.
The Euroimmun Alpha-Synuclein ELISA Kit (Euroimmun; Cat. No. EQ 6545-9601-L) was kindly provided by ADx (ADx NeuroSciences NV, Gent, Belgium) and detects the C-terminus of α-synuclein [50, 51]. The assay was performed according to the manufacturer’s instructions. In brief, full dilution curves of the 10 proteins with the same dynamic range as the standard curve of the kit standard (150–5988 pg/ml) were obtained by serial dilutions in assay buffer. Calibration curve points and protein samples were loaded in duplicate. Absorbance was measured using a VarioSkan Lux plate reader (Thermo Scientific). The results were fitted to a 4-parameter sigmoid curve and plotted against the kit standard curve. Further technical and handling considerations can be found in Supplementary Figure 1.
Spike recovery experiments were performed by spiking high (4000 pg/ml), medium (1535 pg/ml), and low (348 pg/ml) amounts of each protein (according to the dynamic range of the kit’s standard curve) into assay buffer and into commercial hCSF. hCSF samples were diluted 1:10. Recovery was assessed as the percentage of the back-calculated values of the spiked samples (with the unspiked sample subtracted) with respect to the nominal spiked protein amount. High, medium, and low recovery percentages were averaged.
Data analysis
Data analysis and creation of the corresponding graphs were performed using GraphPad Prism 9 (GraphPad Software, Inc., San Diego, CA, USA).
RESULTS
Generation and characterization of protein standards
To determine the capability of the three commercial immunoassays (from Euroimmun, BioLegend and MSD) to capture the diversity of αSYN species, we first assembled a library of 15 highly pure αSYN proteins bearing the most commonly occurring PTMs as previously described [43–46] (Fig. 2). The purity and integrity of all of these proteins was validated by multiple orthogonal techniques, including Coomassie staining, mass spectrometry and UPLC (Supplementary Figure 2). Furthermore, to ensure that any slight differences in assay detection were attributable to different affinities of deployed antibodies toward different proteins and not to differences in protein loading onto assay plates, the concentration of all proteins was determined by amino acid analysis, which is the gold standard allowing the most precise determination of protein concentrations [52, 53]
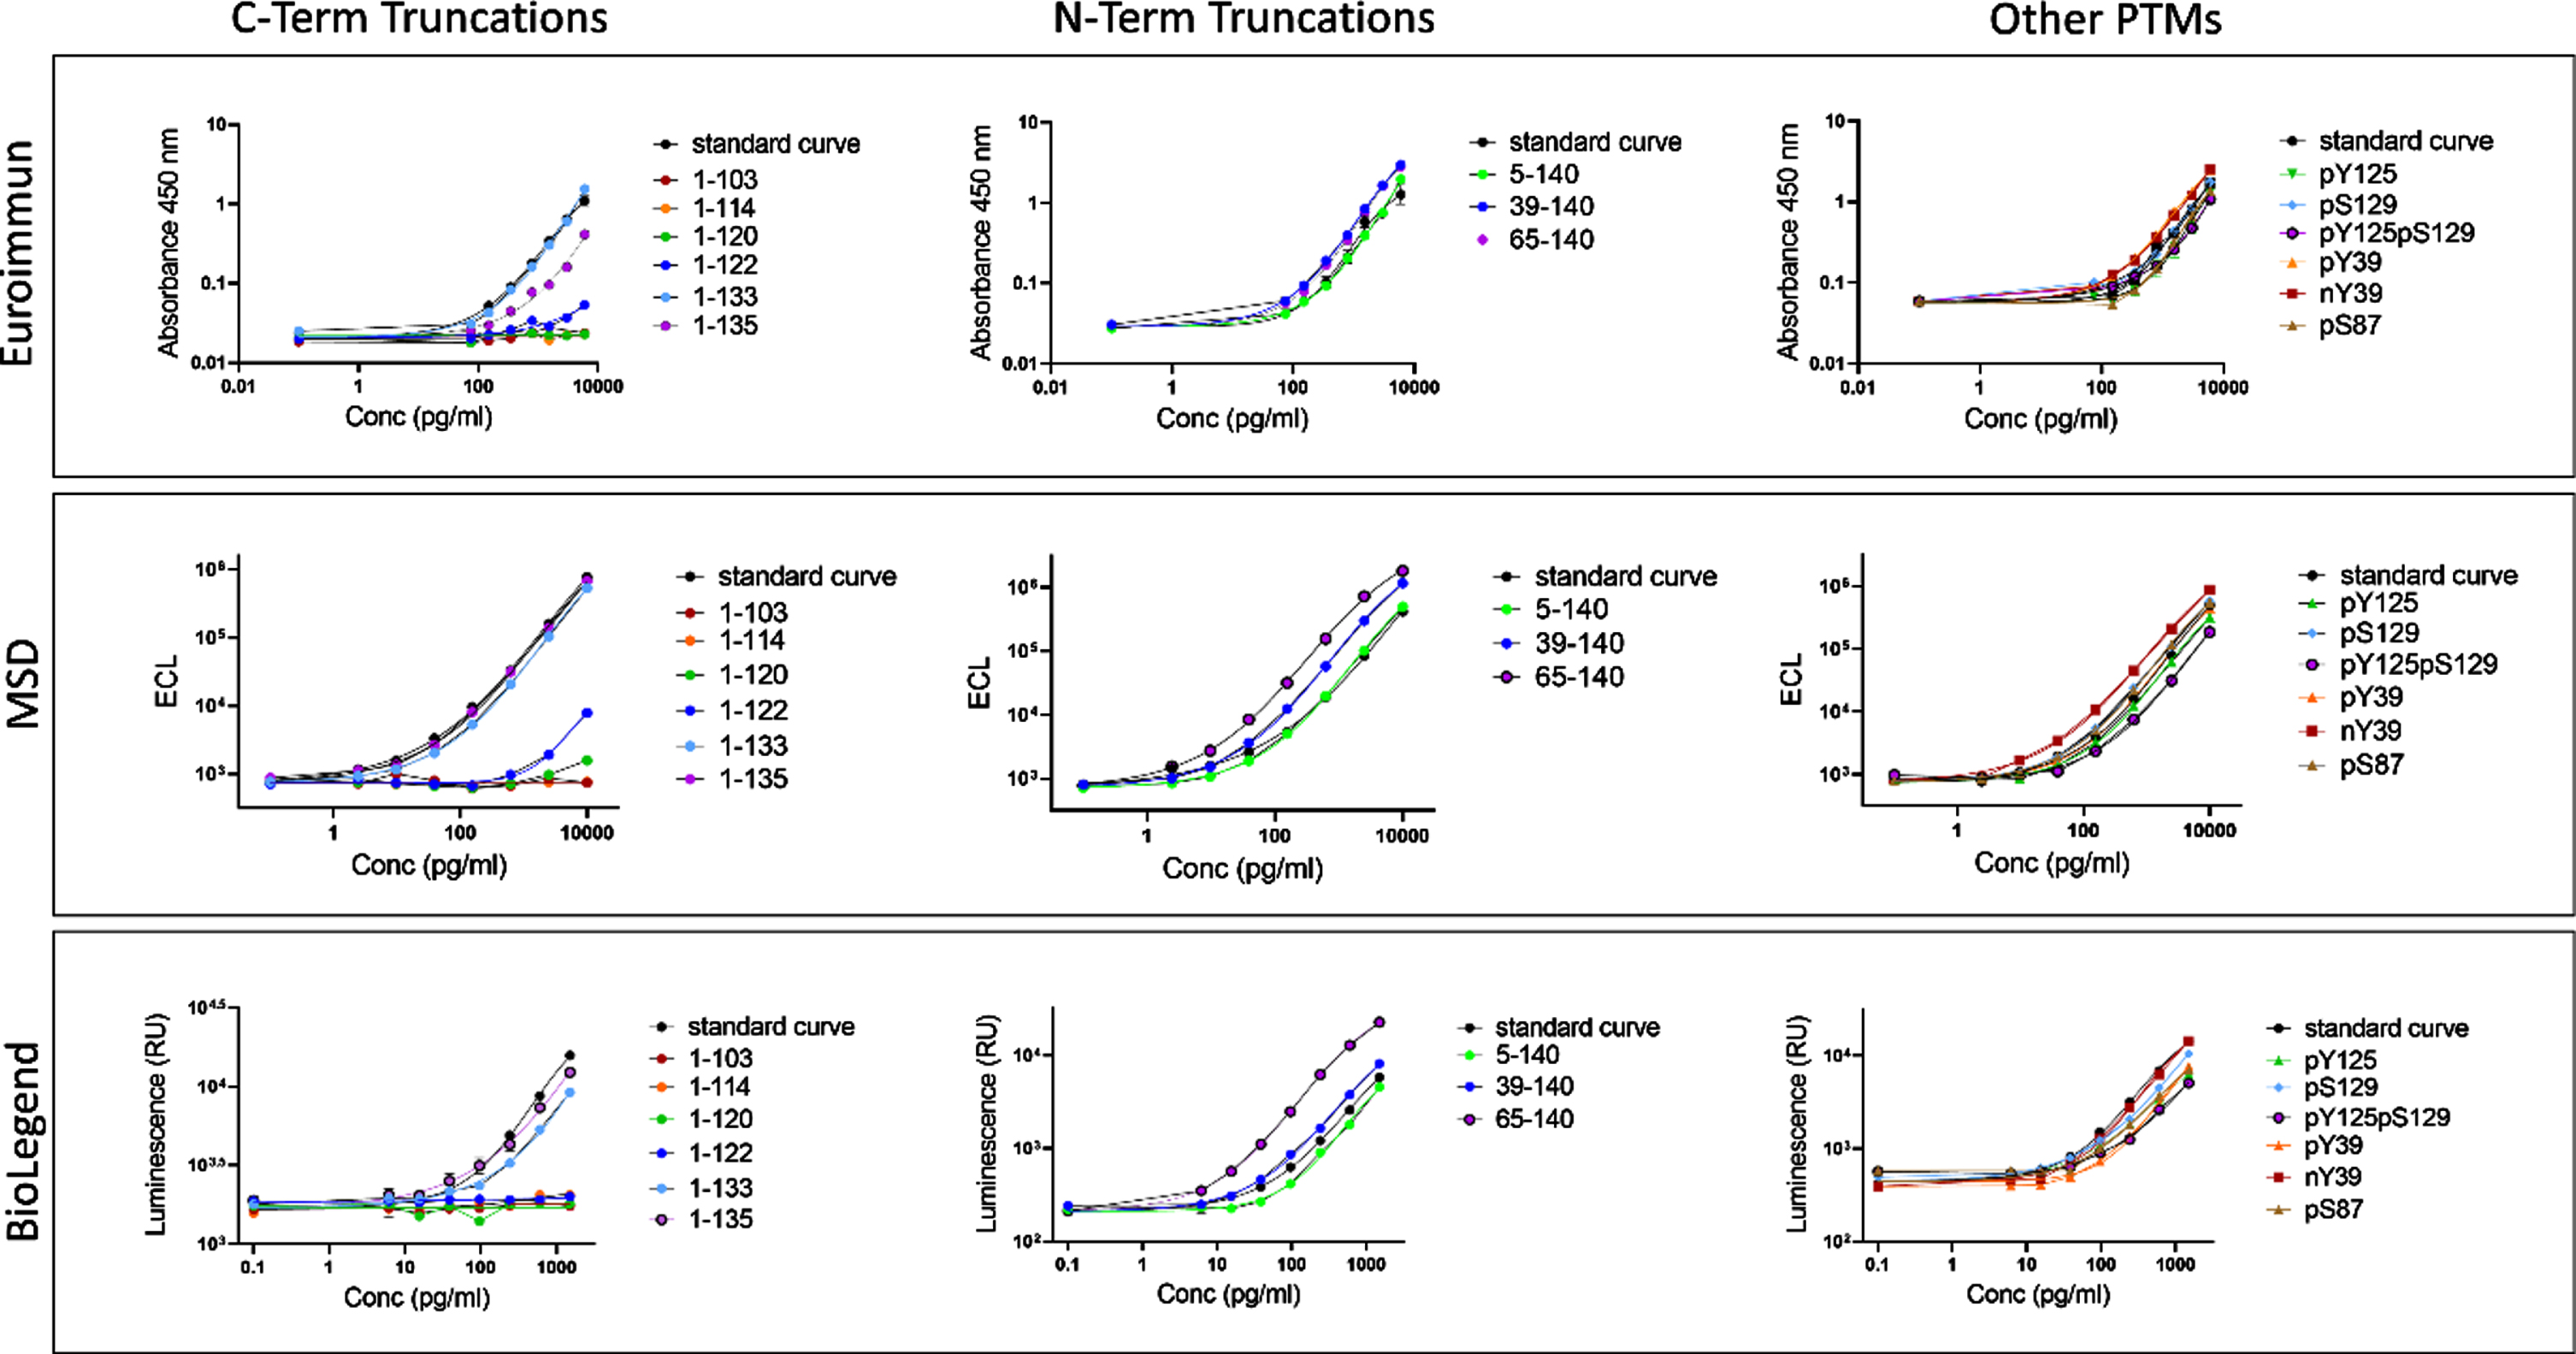
Fig. 3
The three assessed immunoassays do not capture the totality of the relevant αSYN species. Full dilution curves of the proteins with the same dynamic range as the standard curve fitted to a 4-parameter sigmoid curve and plotted against the kit standard curve. Data obtained from each assay are detailed separately. C-terminal truncations ranging from 103 to 122 were not recognized by any of the three analyzed assays.
The Euroimmun, Legendmax BioLegend and MSD U-PLEX® immunoassays do not recognize C-terminal truncations ranging from AA 103 to AA 122
A review of the literature on αSYN immunoassays revealed that most antibodies that have been deployed for αSYN detection and measurements target the C-terminus of the protein, spanning residues 103–140 (Fig. 1). The situation is similar for the three total αSYN commercial immunoassays used in this study (from Euroimmun, BioLegend, and MSD), with the Euroimmun capture and detection antibodies targeting αSYN 118–125 and αSYN 100–110, respectively, and the Biolegend capture and detection antibodies targeting αSYN 118–122 and αSYN 103–108, respectively. For the MSD immunoassay, only the epitope of the capture antibody (αSYN 110–125) has been disclosed. The C-terminal region of αSYN is known to harbor several PTMs that occur at multiple residues, including serine (at S129) and tyrosine phosphorylation (Y125, S129, Y133, and Y136), nitration (Y125/Y133/Y136), and truncations (at 103, 114, 119, 120, 122, 133, and 135) [38, 39]. Therefore, we first sought to assess the ability of the three immunoassays to detect C-terminally truncated variants of αSYN cleaved at 103, 114, 120, 122, 133, and 135. We reasoned that this would provide early information on the putative epitopes of the antibodies deployed in these assays and guide the next set of experiments. As such, the specificity of the three assays towards a library of truncated αSYN proteins was analyzed through full dilution curves within the same dynamic range of the kit standard curves obtained by serial dilutions. The results were then fitted to a 4-parameter sigmoid curve and plotted against the kit standard curve. As shown in Fig. 3, C-terminally truncated variants of αSYN at amino acid (AA) 103, AA 114, AA 120, and AA 122 were not recognized by any of the three assays (Fig. 3 and Supplementary Figures 3–5). In contrast, C-terminally truncated αSYN variants at AA 133 and AA 135 were well detected by all three assays, which is in line with the reported epitopes of some of the antibodies deployed as capturers and detectors. These observations suggest that the presence of truncated αSYN species in biological fluids of interest would not be detected by these antibodies, causing underestimation of the levels of total αSYN by these assays. Furthermore, these findings suggest that the presence of physiological and disease-related C-terminal PTMs that occur in close proximity to the epitopes of the antibodies is likely to interfere with antibody binding and detection of αSYN [42].
Several N-terminal truncations and phosphorylation/nitration PTMs differentially influence the detection of αSYN by different immunoassays
Next, we evaluated the ability of the three assays to detect N-terminally truncated forms of αSYN (5–140, 39–140, and 65–140), as well as different forms of nitrated and phosphorylated full length αSYN (nY39, pY39, pS87, pY125, pS129, and pY125/pS129), all of which have been detected in pathological and physiological states in the brain and other tissues [38–41]. As expected, all tested N-terminal truncations distant from the disclosed epitopes were well detected by the three kits. Surprisingly, the αSYN protein truncated at position 65 was recognized better than the full-length (FL) standards by all three assays (Fig. 3 and Supplementary Figures 3–5). This suggests that certain N-terminal modifications, although distant from the epitopes of the capture and detection antibodies, could induce changes in the conformation of the protein and/or increase epitope exposure/availability compared to the FL standard protein.
Similarly, although phosphorylation and nitration, in general, did not seem to have a major effect on αSYN detection by the different assays, some modifications were recognized slightly better than the FL protein by the Euroimmun and MSD assays (pY39 and nY39 by the Euroimmun assay, and nY39 by the MSD assay), and the Biolegend assay showed less detection of the pY39-, pY125-, and pY125/pS129-modified proteins than the FL αSYN kit standard (Fig. 3 and (Supplementary Figures 3–5). These observations suggest that the presence of these PTMs in biological tissues or fluids of interest could lead to overestimation of total αSYN levels by the Euroimmun and MSD assays and underestimation of the same total αSYN levels by the Biolegend assay.
A human CSF matrix effect is observed for most of the analyzed αSYN proteoforms in all three tested immunoassays
To investigate a potential matrix effect of hCSF in the different immunoassays, a selection of 10 PTM αSYN proteins was subjected to spike recovery experiments by spiking assay buffer (AB) and commercial hCSF with high, medium, and low amounts of each protein, according to the dynamic range of the kit’s standard curve. The high, medium, and low spikes for the Euroimmun assay were 4000 pg/ml, 1535 pg/ml, and 384 pg/ml; 7000 pg/ml, 1000 pg/ml, and 100 pg/ml for the MSD assay; and 900 pg/ml, 300 pg/ml, and 50 pg/ml for the Biolegend assay, respectively. Recovery was assessed as the percentage of the back-calculated values of the spiked samples (with the unspiked sample subtracted) relative to the quantity of nominal spiked protein. High, medium, and low recovery percentages were then averaged, and recoveries falling within 80–120% were considered acceptable. The single interpolated values of the three spikes to the standard curve are shown in (Supplementary Figures 6–8, and the percentage recovery rates obtained at high, medium, and low protein spikes are shown in (Supplementary Figure 9. Averaged rates obtained at high, medium, and low protein spikes across the two matrices (AB and CSF) are presented in Fig. 4A and 4B. Importantly, this analysis shows that there are indeed differences in how some of the proteins are recovered from the two different matrices. For some of the proteins, the recoveries in AB and hCSF are aligned and mostly reflect the differences previously seen in comparison to the full titration curve of the protein (shown in Fig. 3). For example, whereas C-terminally truncated αSYN at 114 (the full titration curve of which was previously not detected) was not recovered in AB or hCSF, N-terminally truncated αSYN at 65 (the full titration curve of which previously showed higher detection than the FL standard) showed high recovery rates in both matrices by all three assays.
Fig. 4
Most PTM αSYN proteins are not fully recovered from human CSF. Recovery is assessed as the percentage of the back-calculated values of the spiked samples subtracted from the unspiked sample with respect to the nominal spiked protein amount. The high, medium, and low recovery percentages are averaged. The data obtained from each assay are detailed separately. (A) Average percentage recovery of spiked PTM αSYN proteins in assay buffer and (B) a commercial pool of human CSF. (C) Tables listing the ratios of the average percentage recovery of hCSF to the percentage recovery of assay buffer. Ratio = 1 indicates no difference in recovery from the two matrices. Ratio > 1 <indicates a matrix effect.
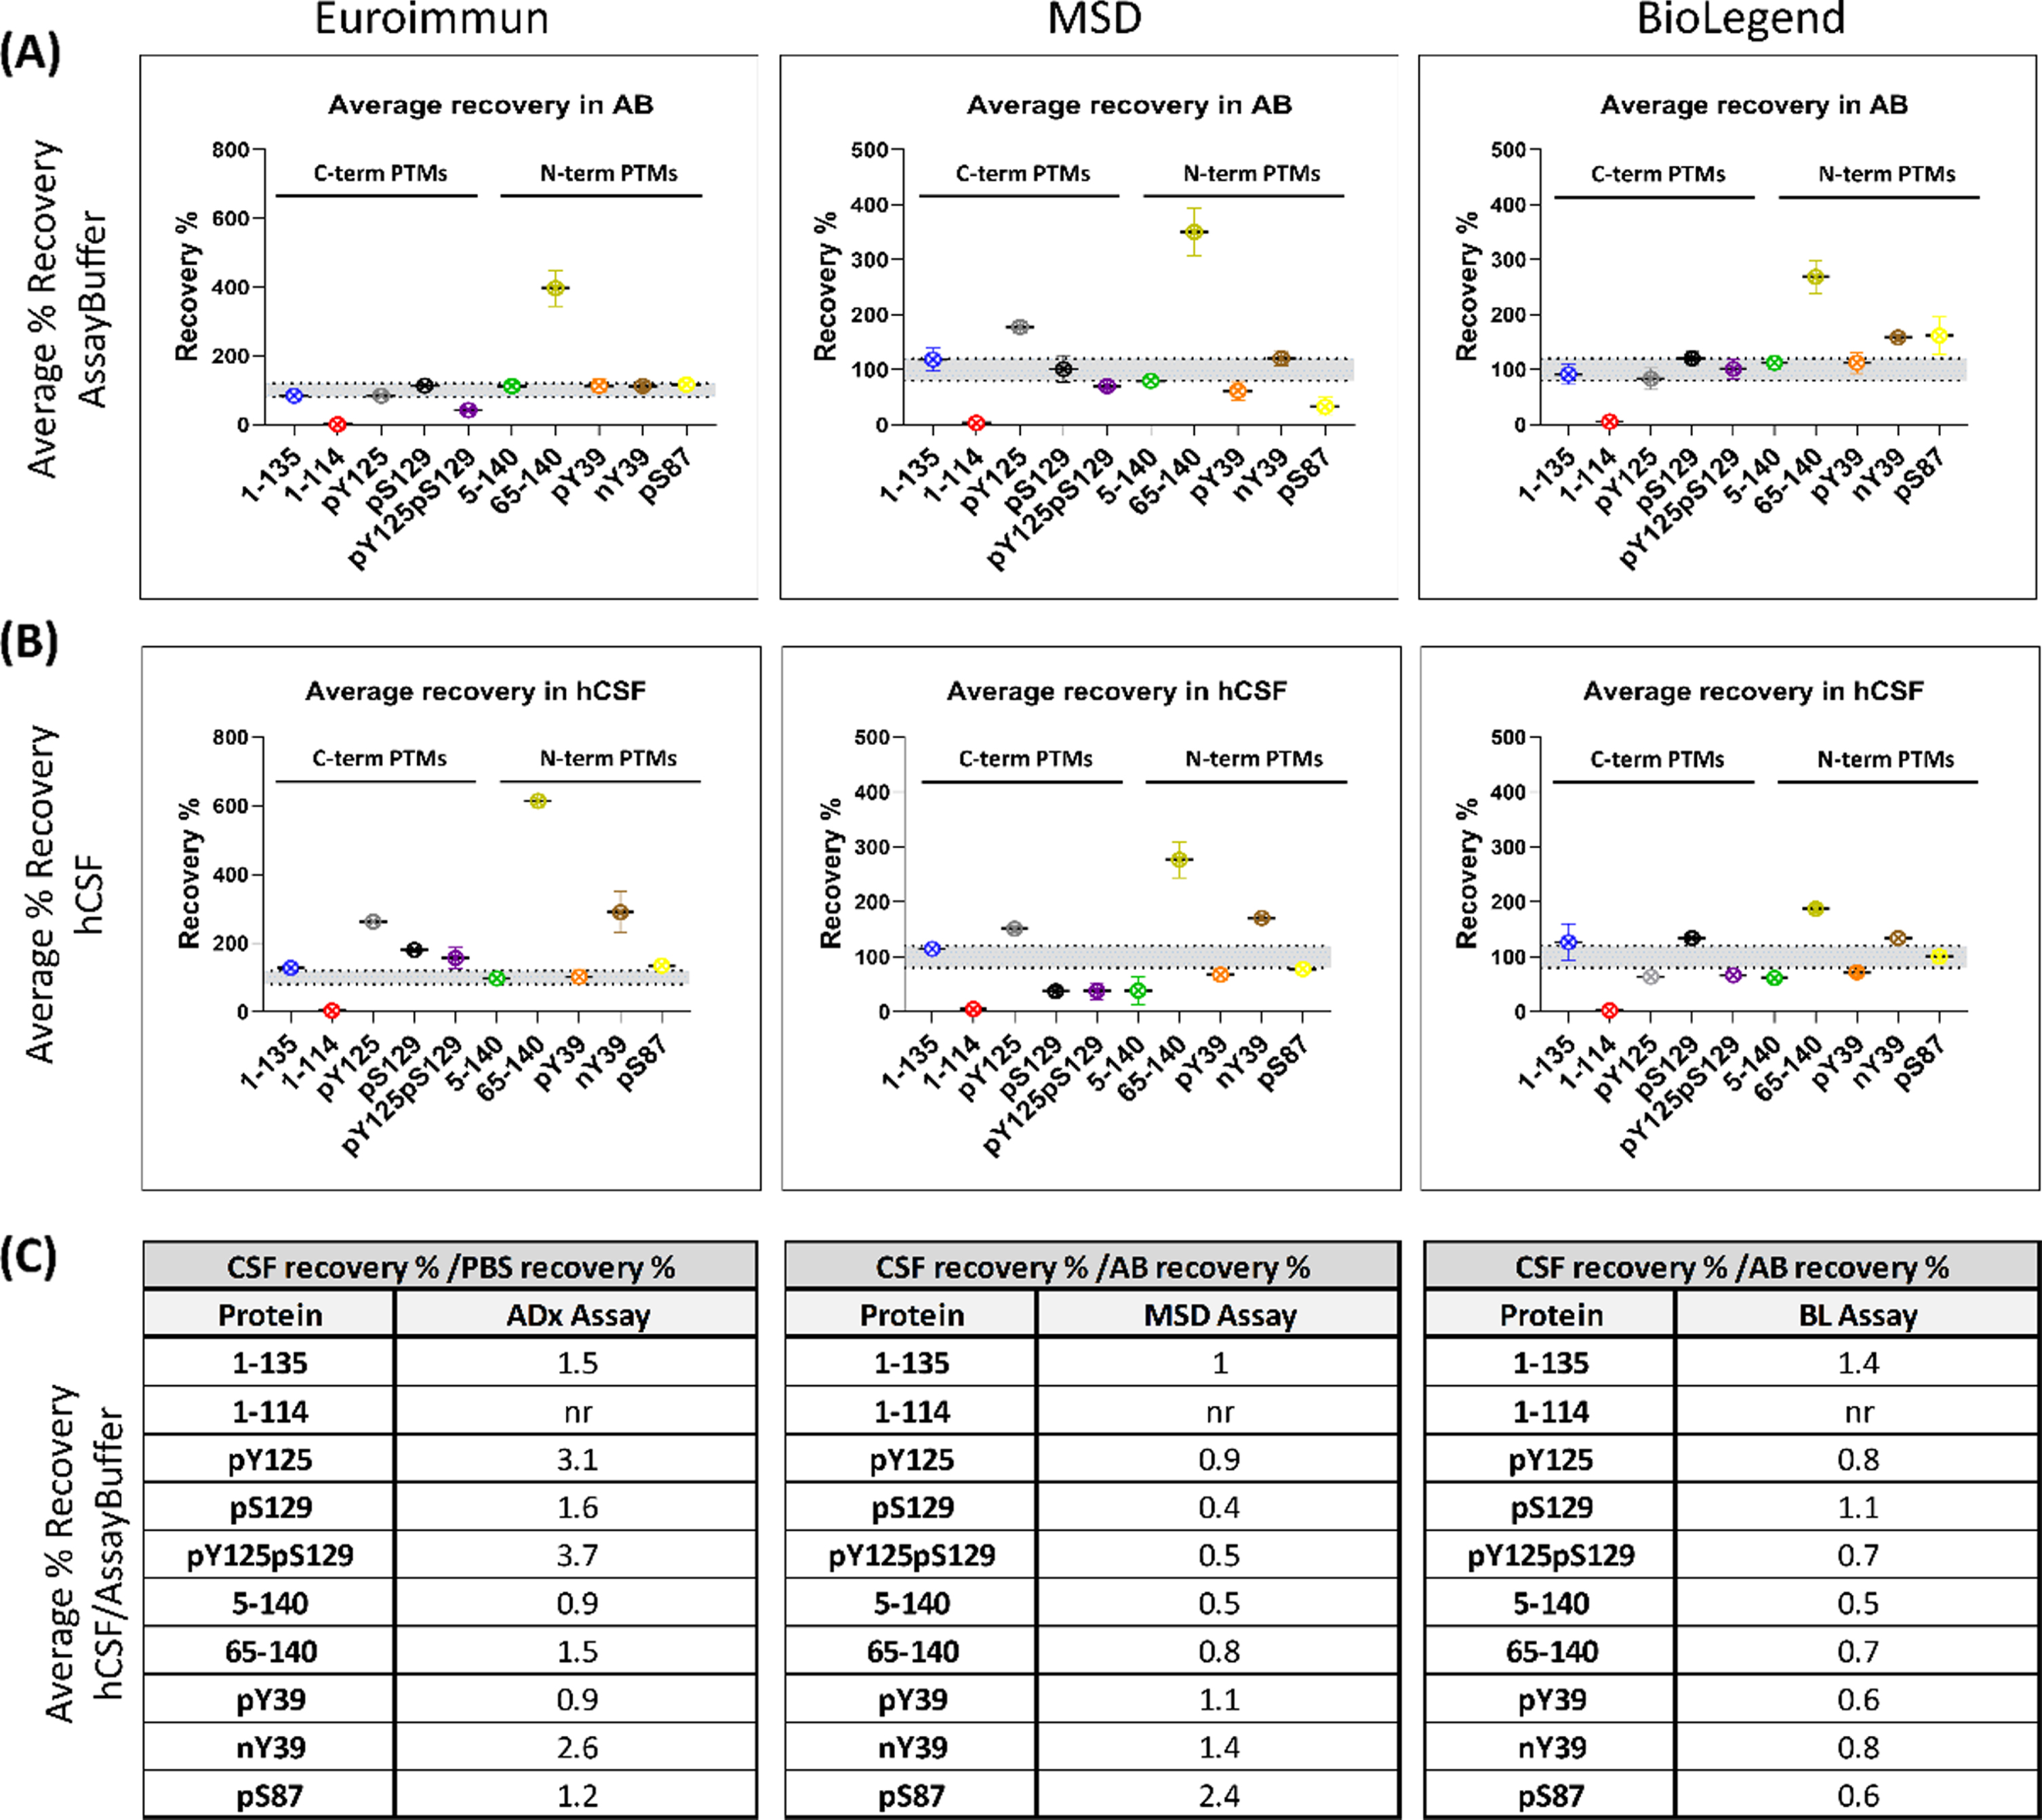
Notably, other proteins showed different matrix effects in AB and hCSF across the different assays. For instance, phosphorylation at S129 showed high recovery rates with the Euroimmun and Biolegend assays in hCSF but not AB, and lower recoveries in hCSF with the MSD assay. Furthermore, phosphorylation at Y39 (pY39), but not nitration on the same residue (nY39), was fully recovered with the Euroimmun assay from AB and hCSF but showed lower recovery in both matrices with the MSD and Biolegend assays. On the other hand, nitration at Y39 (nY39) displayed high recovery rates with all the analyzed assays, mostly in hCSF as compared to AB. Indeed, for all 3 assays, different recovery rates and different matrix effects were observed for pY39 vs. nY39 αSYN, except for recovery in AB by the Euroimmun assay. Interestingly, 1–135 αSYN was the only protein that was mostly recovered from both matrices by all three assays, suggesting little matrix effect on this specific proteoform.
To better understand the extent to which different αSYN species are recovered in hCSF compared to AB, we determined the fold-change of the percentage recovery in hCSF over the percentage recovery in AB (Fig. 4C). When hCSF recovery rates are divided by the recovery rates in AB, the resulting fold increase/decrease indicates how much better/worse the protein is recovered from the hCSF compared to the AB and, consequently, how strong the matrix effect is for the given protein in the given assay. Ratios of approximately 1 indicate that the recovery in hCSF is approximately the same as that in AB; therefore, there is no matrix effect for the given protein in the given assay. This analysis revealed that most of the proteins show a different extent of fold-change across the two matrices, which is most notable for the pY125pS129, pY125, and nY39 proteins; for the pS87, pS129, pY125pS129, 5–140, and 65–140 proteins; and for the 1–135, 5–140, pY39, 65–140, pS87, and pY125pS129 proteins using the Euroimmun, MSD and Biolegend assays, respectively (Fig. 4C). These differences may be caused by the dilution of components in solution that inhibit or enhance the detection of certain proteoforms in the assay method. Lower recoveries in hCSF than in AB for some αSYN proteins could indicate that these species are picked up less due to a matrix effect. It cannot be excluded that endogenous proteases might act on these proteins themselves (as no inhibitors were added to the hCSF) [37, 54, 55], or that the species might be sequestered in interactions with other components of the matrix. On the other hand, proteins showing higher recoveries in hCSF than in AB either could be endogenously expressed in the matrix and recovered together with the spiked amount or could undergo significant conformational changes that alter their interactions with the antibodies. Altogether, these results demonstrate that none of the three analyzed assays is completely free of hCSF matrix effects on the totality of the analyzed proteins. Furthermore, our findings underscore the importance of validating and/or assessing the suitability of assays, procedures, and antibodies to accurately detect the diversity of αSYN species in different types of samples (e.g., CSF, plasma, saliva, or tissue homogenates).
DISCUSSION
In this work, we used a library that reconstitutes the diversity of different αSYN proteoforms to determine to what extent three of the most commonly used commercially available total αSYN immunoassays can capture the diversity of αSYN species and provide accurate measurements of total αSYN in biological samples. The library did not cover differences between α-, β-, and γ-synuclein nor αSYN isoforms (140, 126, and 112 kD), but focused on truncated forms and single PTMs of full length αSYN. Our results demonstrate that all three assays failed to recognize C-terminal truncations from AA 103 to AA 122. These findings are in line with the disclosed epitopes of two of the assays. The MSD detection antibody epitope is not disclosed, but our results indicate that it is most likely similar to the those of the other two assays. Moreover, our results demonstrate that truncated αSYN species with cleavages that occur within or near the epitopes of the antibodies used in these assays will not be detected by any of the three assays, leading to underestimation of total αSYN levels in biological samples.
These findings have significant implications since several C-terminal truncated forms of αSYN (including 1–101, 1–103, 1–115, 1–122, 1–124, 1–135, and 1–139) have been found in the brains of PD patients [39, 56], and truncations starting at 103 or 119–120 produced by aberrant proteolysis are among the most abundant modified forms of αSYN detected in pathological aggregates [57]. Furthermore, previous immunohistochemical studies and more recent STED microscopy studies demonstrate that C-terminally truncated αSYN accumulates within LBs and is preferentially localized within their cores [58, 59]. Increasing evidence also indicates that post-aggregation C-terminal cleavage is an essential step that promotes the efficient packaging of fibrils within LB-like inclusions [41, 49].
Importantly, in addition to their prominent role in pathology initiation and progression, C-terminal truncations have also been proposed to occur under physiological conditions [13, 41]. For instance, soluble fractions of aged brains that have not been diagnosed with any type of synucleinopathy show certain truncated αSYN species, particularly 1–119, albeit to a much lesser extent than insoluble fractions from patient brains. It has been postulated that these truncated species are produced by proteases during the physiological clearance of endogenous αSYN, including autophagic or lysosomal degradation pathways [41]. Altogether, these findings indicate that truncated αSYN species are prevalent under both physiological and pathogenic conditions and should be considered when developing assays to quantify total αSYN in different types of biological samples. Failure to detect these species will result in underestimation of αSYN levels and may contribute to the large variation in the levels of αSYN reported by different groups. It is important to emphasize that the level of C-terminal-truncated αSYN species in biological fluids has not been investigated, and there are no existing assays that allow the specific detection and quantification of these species.
N-terminal truncations at residues 5–140, 39–140, and 65–140 have also been found in the brains of PD patients [39, 56]. A recent study of αSYN in the human appendix showed the presence of a mixture of αSYN species that are cleaved at the N- terminus, as well as of αSYN species that are cleaved at both the N- and C-terminal domains of the protein [33]. Herein, we showed that all three assays recognize the three major N-terminally truncated species found in the brain. However, truncation at AA 65 is consistently recognized better than the FL αSYN kit standard by the assays.
Since monomeric αSYN exists as an ensemble of disordered conformations that are stabilized by long-range interactions between the C-terminal domain and the NAC region and N-terminal domain [60], disruption of these interactions can lead to increased exposure of these domains and enhanced antibody binding [61, 62]. Indeed, we observed that pY39 and nY39 were recognized better than the standard protein by the Euroimmun assay, and that nY39 was better recognized by the MSD assay, while pY39-, pY125-, and pY125/pS129-modified proteins were detected less effectively with the Biolegend assay (Fig. 3 and (Supplementary Figures 3–5). Therefore, it is plausible to assume that some of the PTMs (such as nitration or phosphorylation at AA 39 or truncation at AA 65) disrupt the long-range interactions between the N- and C-termini of αSYN, leading to better epitope exposure. The possibility that these modifications could also significantly alter the overall conformation of the protein, beyond the modification of N- and C-termini long-range interactions, likewise cannot be excluded.
The relative abundance of some of the αSYN PTMs we studied in human biological fluids has not yet been determined. Nevertheless, one could speculate that the high recovery rates in the hCSF matrix might indicate that some of the modified proteins are endogenously present and recovered along with the spiked protein. This has significant implications for the accuracy of immunoassays that detect certain PTM species better than the FL, as this would lead to significant overestimation of total αSYN levels in biological samples. To the best of our knowledge, N-terminal variants of αSYN have never been used as standards or tools to validate αSYN antibodies and immunoassays.
For the three analyzed assays, we observed that human CSF exerts a matrix effect on several αSYN proteins, as shown by changes in the relative recovery. When the recoveries in hCSF were normalized to the recoveries in AB, the results diverged considerably among the 3 assays. Some proteins were recovered better/worse in hCSF than in AB, and the identity of these proteins was not the same for all 3 assays. Interestingly, phosphorylation at S129 (pS129) was fully recovered in AB by all three analyzed assays but showed high recovery in hCSF with the Euroimmun assay and the Biolegend assays, and low recovery in hCSF with the MSD assay. For the Euroimmun and Biolegend assays, only 4 out of the 10 proteins analyzed were not influenced by the hCSF matrix, while for the MSD assay, 5 out of 10 showed little matrix effect. As the identity of these matrix-insensitive proteins is different across the three assays, measurements of “total αSYN levels” of the same hCSF sample containing PTMs using these three assays would differ considerably, and would provide a solid explanation for the previously observed large variation in the absolute concentrations of total αSYN quantified by these three assays using the same CSF samples [37]. Notably, a similar impact of the CSF matrix on the detection and quantitation of analytes has been previously reported for amyloid-beta [63, 64], where the matrix affecting the measurements is discussed as a possible contributor to the low diagnostic power of these assays.
Although the capture antibodies used in the three immunoassays target similar epitopes in the C-terminal domain of αSYN, the assays exhibit significantly different sensitivities to different αSYN species and show different matrix effects, all of which impact homogenous protein recovery in hCSF. Other factors contributing to these differences include whether and how the antibody is immobilized on the surface, or if the analyte recognition is carried out in solution. The sensitivity of the platform itself could also account for differences, as low-abundance species might contribute to the total αSYN signal in a different way when an ultrasensitive platform is used. Less sensitive platforms might not be able to measure low-abundance species, therefore overlooking and de facto flattening the contribution of these proteins to total αSYN levels, compared to measurements obtained by ultrasensitive platforms with a much lower limit of detection. For instance, the increased αSYN levels in plasma of PD patients observed with the ultrasensitive Quanterix assay compared to other less sensitive methods could be related to the increased sensitivity of this platform, which may facilitate the detection and quantitation of low-abundance forms of αSYN, as discussed recently in [21]. On the other hand, assays with low dynamic ranges of their standard curves and low upper limits of quantification (ULOQ) would have decreased sensitivity and might account for saturation of the signal when certain species are highly abundant in the analyzed matrix. Accordingly, in both cases, these assays would not provide a reliable measurement of total αSYN levels.
Altogether, our results show that the three immunoassays (Euroimmun, MSD, and Biolegend) do not capture the totality of the relevant αSYN species and therefore may not be appropriate tools to provide an accurate estimate of total αSYN levels, at least until the distribution and levels of different αSYN-modified proteins in different biological samples are accurately determined. Moreover, we have identified a matrix effect of hCSF that differs across different proteins and immunoassays. It cannot be ascribed only to the different antibody epitopes, as they are shared among the assays. Our work highlights the critical importance of pre-assay development including the thorough validation of deployed antibodies and assays using well-characterized αSYN proteins, as this will dictate the downstream specificity of the immunoassay and ensure that the antibodies deployed accurately capture the diversity and complexity of αSYN proteoforms in biological fluids. Previous studies have attributed discrepancies in the absolute values of total αSYN measured by different research teams to different factors, including heterogeneity of patient populations, differences in sample preparation and handling procedures, matrix effects, and the use of poorly characterized protein standards. Our work here supports some of these findings and highlights that insufficient pre-assay validation of antibodies and lack of validation of the assays using standards that reproduce the complexity of the αSYN proteome are two other major contributing factors.
The development of a robust and quantitative total αSYN assay is urgently needed. It would enable the discovery of novel biomarkers based on measuring the ratios of specific forms of αSYN to total αSYN. As most PTMs represent a small percentage of total αSYN, depending on the sensitivity of the detection method used, the ratio of one PTM to the total αSYN levels could be more informative and might better correlate with disease than the levels of total αSYN, or individual PTMs alone. Indeed, all existing commercially available assays were developed to target predominantly monomeric and/or unmodified aggregated forms of αSYN [65]. Given the tight association between αSYN PTMs and αSYN aggregation and pathology initiation, the development and validation of future assays must incorporate the need to capture and detect modified aggregated forms of the protein. The development of immunoassays capable of capturing and measuring the complexity of αSYN in human biological fluids would enable more systematic studies to determine if levels of total αSYN or certain αSYN proteoforms could serve as useful diagnostic biomarkers for early PD diagnosis, monitoring of disease progression and assessment of target engagement for novel αSYN-targeting therapies. The identification of capture and detection antibodies that detect all of the relevant αSYN species, including pathogenic conformations and PTM forms of the protein, would represent an important step toward achieving this goal.
CONFLICT OF INTEREST
Hilal Lashuel (HAL) has received funding from industry to support research on neurodegenerative diseases, including from Merck Serono, UCB, Idorsia, and Abbvie. These companies had no specific role in the in the conceptualization and preparation of and decision to publish this work. HAL is also the Co-founder and Chief Scientific Officer of ND Biosciences SA, a company that develops diagnostics and treatments for neurodegenerative diseases based on platforms that reproduce the complexity and diversity of proteins implicated in neurodegenerative diseases and their pathologies.
Mohamed-Bilal Fares (MBF) is the Co-founder and Director of R&D of ND Biosciences SA.
Lara Petricca (LP) is the Head of Biomarkers and Diagnostic Development of ND Biosciences SA.
Erik Stoops is an employee and shareholder of ADx NeuroSciences.
ACKNOWLEDGMENTS
This work was supported by the Michael J. Fox Foundation under Research Grants MJFF-15995 and MJFF-007894, and by the EPFL. We are grateful to Peggy Taylor, Jesse Ni and the Neuroscience team at Biolegend, and to Erik Stoops and his team at ADx NeuroSciences NV for providing the necessary kits for this study, and for independently validating some of our results, and for their support and assistance throughout the project.
SUPPLEMENTARY MATERIAL
[1] The supplementary material is available in the electronic version of this article: https://dx.doi.org/10.3233/JPD-223285.
REFERENCES
[1] | Dorsey ER , Elbaz A , Nichols E , Abbasi N , Abd-Allah F , Abdelalim A , Adsuar JC , Ansha MG , Brayne C , Choi J-YJ , Collado-Mateo D , Dahodwala N , Do HP , Edessa D , Endres M , Fereshtehnejad S-M , Foreman KJ , Gankpe FG , Gupta R , Hamidi S , Hankey GJ , Hay SI , Hegazy MI , Hibstu DT , Kasaeian A , Khader Y , Khalil I , Khang Y-H , Kim YJ , Kokubo Y , Logroscino G , Massano J , Mohamed Ibrahim N , Mohammed MA , Mohammadi A , Moradi-Lakeh M , Naghavi M , Nguyen BT , Nirayo YL , Ogbo FA , Owolabi MO , Pereira DM , Postma MJ , Qorbani M , Rahman MA , Roba KT , Safari H , Safiri S , Satpathy M , Sawhney M , Shafieesabet A , Shiferaw MS , Smith M , Szoeke CEI , Tabarés-Seisdedos R , Truong NT , Ukwaja KN , Venketasubramanian N , Villafaina S , weldegwergs gidey K , Westerman R , Wijeratne T , Winkler AS , Xuan BT , Yonemoto N , Feigin VL , Vos T , Murray CJL ((2018) ) Global, regional, and national burden of Parkinson’s disease, 1990–2016: A systematic analysis for the Global Burden of Disease Study 2016. Lancet Neurol 17: , 939–953. |
[2] | Dorsey ER , Constantinescu R , Thompson JP , Biglan KM , Holloway RG , Kieburtz K , Marshall FJ , Ravina BM , Schifitto G , Siderowf A , Tanner CM ((2007) ) Projected number of people with Parkinson disease in the most populous nations, 2005 through 2030. Neurology 68: , 384–386. |
[3] | AlDakheel A , Kalia LV , Lang AE ((2014) ) Pathogenesis-targeted, disease-modifying therapies in Parkinson disease. Neurotherapeutics 11: , 6–23. |
[4] | Bartus RT , Weinberg MS , Samulski RJ ((2014) ) Parkinson’s disease gene therapy: Success by design meets failure by efficacy. Mol Ther 22: , 487–497. |
[5] | Poewe W , Seppi K , Marini K , Mahlknecht P ((2020) ) New hopes for disease modification in Parkinson’s disease. Neuropharmacology 171: , 108085. |
[6] | Prasad EM , Hung S-Y ((2021) ) Current therapies in clinical trials of Parkinson’s disease: A 2021 update. Pharmaceuticals 14: , 717. |
[7] | Ganguly U , Singh S , Pal S , Prasad S , Agrawal BK , Saini RV , Chakrabarti S ((2021) ) Alpha-synuclein as a biomarker of Parkinson’s disease: Good, but not good enough. Front Aging Neurosci 13: , 702639. |
[8] | Goetz CG , Tilley BC , Shaftman SR , Stebbins GT , Fahn S , Martinez-Martin P , Poewe W , Sampaio C , Stern MB , Dodel R , Dubois B , Holloway R , Jankovic J , Kulisevsky J , Lang AE , Lees A , Leurgans S , LeWitt PA , Nyenhuis D , Olanow CW , Rascol O , Schrag A , Teresi JA , van Hilten JJ , LaPelle N ((2008) ) Movement Disorder Society-sponsored revision of the Unified Parkinson’s Disease Rating Scale (MDS-UPDRS): Scale presentation and clinimetric testing results. Mov Disord 23: , 2129–2170. |
[9] | Cheng H-C , Ulane CM , Burke RE ((2010) ) Clinical progression in Parkinson disease and the neurobiology of axons. Ann Neurol 67: , 715–725. |
[10] | Ahn T-B , Kim SY , Kim JY , Park S-S , Lee DS , Min HJ. , Kim YK , Kim SE , Kim J-M , Kim H-J , Cho J , Jeon BS ((2008) ) α-Synuclein gene duplication is present in sporadic Parkinson disease. Neurology 70: , 43–49. |
[11] | Polymeropoulos MH , Lavedan C , Leroy E , Ide SE , Dehejia A , Dutra A , Pike B , Root H , Rubenstein J , Boyer R , Stenroos ES , Chandrasekharappa S , Athanassiadou A , Papapetropoulos T , Johnson WG , Lazzarini AM , Duvoisin RC , Di Iorio G , Golbe LI , Nussbaum RL ((1997) ) Mutation in the α-synuclein gene identified in families with Parkinson’s disease. Science 276: , 2045–2047. |
[12] | Alafuzoff I , Hartikainen P ((2078) ) Alpha-synucleinopathies. Handb Clin Neurol 145: , 339–353. |
[13] | Spillantini MG , Schmidt ML , Lee VM-Y , Trojanowski JQ , Jakes R , Goedert M ((1997) ) α-synuclein in Lewy bodies. Nature 388: , 839–840. |
[14] | Takeda A , Mallory M , Sundsmo M , Honer W , Hansen L , Masliah E ((1998) ) Abnormal accumulation of NACP/alpha-synuclein in neurodegenerative disorders. Am J Pathol 152: , 367–72. |
[15] | Schmid AW , Fauvet B , Moniatte M , Lashuel HA ((2013) ) Alpha-synuclein post-translational modifications as potential biomarkers for Parkinson disease and other synucleinopathies. Mol Cell Proteomics 12: , 3543–3558. |
[16] | Barbour R , Kling K , Anderson JP , Banducci K , Cole T , Diep L , Fox M , Goldstein JM , Soriano F , Seubert P , Chilcote TJ ((2008) ) Red blood cells are the major source of alpha-synuclein in blood. Neurodegener Dis 5: , 55–59. |
[17] | Vicente Miranda H , Cássio R , Correia-Guedes L , Gomes MA , Chegão A , Miranda E , Soares T , Coelho M , Rosa MM , Ferreira JJ , Outeiro TF ((2017) ) Posttranslational modifications of blood-derived alpha-synuclein as biochemical markers for Parkinson’s disease.. Sci Rep 7: , 13713. |
[18] | Tateno F , Sakakibara R , Kawai T , Kishi M , Murano T ((2012) ) Alpha-synuclein in the cerebrospinal fluid differentiates synucleinopathies (Parkinson disease, dementia with Lewy bodies, multiple system atrophy) from Alzheimer disease. Alzheimer Dis Assoc Disord 26: , 213–216. |
[19] | Locascio JJ , Eberly S , Liao Z , Liu G , Hoesing AN , Duong K , Trisini-Lipsanopoulos A , Dhima K , Hung AY , Flaherty AW , Schwarzschild MA , Hayes MT , Wills A-M , Shivraj Sohur U , Mejia NI , Selkoe DJ , Oakes D , Shoulson I , Dong X , Marek K , Zheng B , Ivinson A , Hyman BT , Growdon JH , Sudarsky LR , Schlossmacher MG , Ravina B , Scherzer CR ((2015) ) Association between α-synuclein blood transcripts and early, neuroimaging-supported Parkinson’s disease. Brain 138: , 2659–2671. |
[20] | Öhrfelt A , Grognet P , Andreasen N , Wallin A , Vanmechelen E , Blennow K , Zetterberg H ((2009) ) Cerebrospinal fluid α-synuclein in neurodegenerative disorders— A marker of synapse loss? Neurosci Lett 450: , 332–335. |
[21] | Youssef P , Kim WS , Halliday GM , Lewis SJG , Dzamko N ((2021) ) Comparison of different platform immunoassays for the measurement of plasma alpha-synuclein in Parkinson’s disease patients. J Parkinsons Dis 11: , 1761–1772. |
[22] | Sacino AN , Brooks M , Thomas MA , McKinney AB , Lee S , Regenhardt RW , McGarvey NH , Ayers JI , Notterpek L , Borchelt DR , Golde TE , Giasson BI ((2014) ) Intramuscular injection of -synuclein induces CNS -synuclein pathology and a rapid-onset motor phenotype in transgenic mice. Proc Natl Acad Sci U S A 111: , 10732–10737. |
[23] | Mollenhauer B , Trautmann E , Otte B , Ng J , Spreer A , Lange P , Sixel-Döring F , Hakimi M , VonSattel J-P , Nussbaum R , Trenkwalder C , Schlossmacher MG ((2012) ) α-Synuclein in human cerebrospinal fluid is principally derived from neurons of the central nervous system. J Neural Transm 119: , 739–746. |
[24] | Tokuda T , Salem SA , Allsop D , Mizuno T , Nakagawa M , Qureshi MM , Locascio JJ , Schlossmacher MG , El-Agnaf OMA ((2006) ) Decreased α-synuclein in cerebrospinal fluid of aged individuals and subjects with Parkinson’s disease. Biochem Biophys Res Commun 349: , 162–166. |
[25] | Hall S , Öhrfelt A , Constantinescu R , Andreasson U , Surova Y , Bostrom F , Nilsson C , Widner H , Decraemer H , Nägga K , Minthon L , Londos E , Vanmechelen E , Holmberg B , Zetterberg H , Blennow K , Hansson O ((2012) ) Accuracy of a panel of 5 cerebrospinal fluid biomarkers in the differential diagnosis of patients with dementia and/or parkinsonian disorders. Arch Neurol 69: , 1445. |
[26] | Hong Z , Shi M , Chung KA , Quinn JF , Peskind ER , Galasko D , Jankovic J , Zabetian CP , Leverenz JB , Baird G , Montine TJ , Hancock AM , Hwang H , Pan C , Bradner J , Kang UJ , Jensen PH , Zhang J ((2010) ) DJ-1 and α-synuclein in human cerebrospinal fluid as biomarkers of Parkinson’s disease. Brain 133: , 713–726. |
[27] | Kasuga K , Tokutake T , Ishikawa A , Uchiyama T , Tokuda T , Onodera O , Nishizawa M , Ikeuchi T ((2010) ) Differential levels of α-synuclein, β-amyloid42 and tau in CSF between patients with dementia with Lewy bodies and Alzheimer’s disease. J Neurol Neurosurg Psychiatry 81: , 608–610. |
[28] | Mollenhauer B , Cullen V , Kahn I , Krastins B , Outeiro TF , Pepivani I , Ng J , Schulz-Schaeffer W , Kretzschmar HA , McLean PJ , Trenkwalder C , Sarracino DA , VonSattel J-P , Locascio JJ , El-Agnaf OMA , Schlossmacher MG ((2008) ) Direct quantification of CSF α-synuclein by ELISA and first cross-sectional study in patients with neurodegeneration. Exp Neurol 213: , 315–325. |
[29] | Parnetti L , Chiasserini D , Bellomo G , Giannandrea D , De Carlo C , Qureshi MM , Ardah MT , Varghese S , Bonanni L , Borroni B , Tambasco N , Eusebi P , Rossi A , Onofrj M , Padovani A , Calabresi P , El-Agnaf O ((2011) ) Cerebrospinal fluid Tau/α-synuclein ratio in Parkinson’s disease and degenerative dementias. Mov Disord 26: , 1428–1435. |
[30] | Malek N , Swallow D , Grosset KA , Anichtchik O , Spillantini M , Grosset DG ((2014) ) Alpha-synuclein in peripheral tissues and body fluids as a biomarker for Parkinson’s disease - a systematic review. Acta Neurol Scand 130: , 59–72. |
[31] | Ma L-Y , Liu G-L , Wang D-X , Zhang M-M , Kou W-Y , Feng T ((2019) ) Alpha-synuclein in peripheral tissues in Parkinson’s disease. ACS Chem Neurosci 10: , 812–823. |
[32] | Chahine LM , Beach TG , Brumm MC , Adler CH , Coffey CS , Mosovsky S , Caspell-Garcia C , Serrano GE , Munoz DG , White CL , Crary JF , Jennings D , Taylor P , Foroud T , Arnedo V , Kopil CM , Riley L , Dave KD , Mollenhauer B ((2020) ) In vivodistribution of α-synuclein in multiple tissues and biofluids in Parkinson disease.. Neurology 95: , e1267–e1284. |
[33] | Killinger BA , Madaj Z , Sikora JW , Rey N , Haas AJ , Vepa Y , Lindqvist D , Chen H , Thomas PM , Brundin P , Brundin L , Labrie V ((2018) ) The vermiform appendix impacts the risk of developing Parkinson’s disease. Sci Transl Med 10: , eaar5280. |
[34] | Kapaki E , Paraskevas GP , Emmanouilidou E , Vekrellis K ((2013) ) The diagnostic value of CSF α-synuclein in the differential diagnosis of dementia with Lewy bodies vs. normal subjects and patients with Alzheimer’s disease. PLoS One 8: , e81654. |
[35] | Noguchi-Shinohara M , Tokuda T , Yoshita M , Kasai T , Ono K , Nakagawa M , El-Agnaf OMA , Yamada M ((2009) ) CSF α-synuclein levels in dementia with Lewy bodies and Alzheimer’s disease. Brain Res 1251: , 1–6. |
[36] | Spies PE , Melis RJF , Sjögren MJC , Olde Rikkert MGM , Verbeek MM ((2009) ) Cerebrospinal fluid α-synuclein does not discriminate between dementia disorders. J Alzheimers Dis 16: , 363–369. |
[37] | Mollenhauer B , Bowman FD , Drake D , Duong J , Blennow K , El-Agnaf O , Shaw LM , Masucci J , Taylor P , Umek RM , Dunty JM , Smith CL , Stoops E , Vanderstichele H , Schmid AW , Moniatte M , Zhang J , Kruse N , Lashuel HA , Teunissen C , Schubert T , Dave KD , Hutten SJ , Zetterberg H ((2019) ) Antibody-based methods for the measurement of α-synuclein concentration in human cerebrospinal fluid – method comparison and round robin study. J Neurochem 149: , 126–138. |
[38] | Beyer K , Domingo-Sábat M , Lao JI , Carrato C , Ferrer I , Ariza A ((2008) ) Identification and characterization of a new alpha-synuclein isoform and its role in Lewy body diseases. Neurogenetics 9: , 15–23. |
[39] | Kellie JF , Higgs RE , Ryder JW , Major A , Beach TG , Adler CH , Merchant K , Knierman MD ((2015) ) Quantitative measurement of intact alpha-synuclein proteoforms from post-mortem control and parkinson’s disease brain tissue by intact protein mass spectrometry. Sci Rep 4: , 5797. |
[40] | Oueslati A , Fournier M , Lashuel HA (2010) Chapter 7 - Role of post-translational modifications in modulating the structure, function and toxicity of α-synuclein: Implications for Parkinson’s disease pathogenesis and therapies. In Recent Advances in Parkinson’s Disease: Basic Research,Björklund A, CenciMABT-P in BR, eds. Elsevier, pp. 115–145. |
[41] | Sorrentino ZA , Giasson BI ((2020) ) The emerging role of α-synuclein truncation in aggregation and disease. J Biol Chem 295: , 10224–10244. |
[42] | Lashuel HA , Mahul-Mellier A-L , Novello S , Hegde RN , Jasiqi Y , Altay MF , Donzelli S , DeGuire SM , Burai R , Magalhães P , Chiki A , Ricci J , Boussouf M , Sadek A , Stoops E , Iseli C , Guex N (2022) Neighbouring modifications interfere with the detection of phosphorylated alpha-synuclein at Serine 129: Revisiting the specificity of pS129 antibodies. bioRxiv2022.03.30.486322. |
[43] | Hejjaoui M , Butterfield S , Fauvet B , Vercruysse F , Cui J , Dikiy I , Prudent M , Olschewski D , Zhang Y , Eliezer D , Lashuel HA ((2012) ) Elucidating the role of C-terminal post-translational modifications using protein semisynthesis strategies: α-synuclein phosphorylation at tyrosine 125. J Am Chem Soc 134: , 5196–5210. |
[44] | Burai R , Ait-Bouziad N , Chiki A , Lashuel HA ((2015) ) Elucidating the role of site-specific nitration of α-synuclein in the pathogenesis of Parkinson’s disease via protein semisynthesis and mutagenesis.5041-. J Am Chem Soc 137: , 5052. |
[45] | Dikiy I , Fauvet B , Jovićić A , Mahul-Mellier A-L , Desobry C , El-Turk F , Gitler AD , Lashuel HA , Eliezer D ((2016) ) Semisynthetic and in vitro phosphorylation of alpha-synuclein at Y39 promotes functional partly helical membrane-bound states resembling those induced by PD mutations. ACS Chem Biol 11: , 2428–2437. |
[46] | Fauvet B , Lashuel HA ((2016) ) Semisynthesis and enzymatic preparation of post-translationally modified α-synuclein. Methods Mol Biol 1345: , 3–20. |
[47] | Paleologou KE , Oueslati A , Shakked G , Rospigliosi CC , Kim H-Y , Lamberto GR , Fernandez CO , Schmid A , Chegini F , Gai WP , Chiappe D , Moniatte M , Schneider BL , Aebischer P , Eliezer D , Zweckstetter M , Masliah E , Lashuel HA ((2010) ) Phosphorylation at S87 is enhanced in synucleinopathies, inhibits alpha-synuclein oligomerization, and influences synuclein-membrane interactions. J Neurosc 30: , 3184–3198. |
[48] | Fauvet B , Mbefo MK , Fares M-B , Desobry C , Michael S , Ardah MT , Tsika E , Coune P , Prudent M , Lion N , Eliezer D , Moore DJ , Schneider B , Aebischer P , El-Agnaf OM , Masliah E , Lashuel HA ((2012) ) α-Synuclein in central nervous system and from erythrocytes, mammalian cells, and Escherichia coli exists predominantly as disordered monomer. J Biol Chem 287: , 15345–15364. |
[49] | Mahul-Mellier A-L , Burtscher J , Maharjan N , Weerens L , Croisier M , Kuttler F , Leleu M , Knott GW , Lashuel HA ((2020) ) The process of Lewy body formation, rather than simply α-synuclein fibrillization, is one of the major drivers of neurodegeneration. Proc Natl Acad Sci U S A 117: , 4971–4982. |
[50] | Chiasserini D , Biscetti L , Eusebi P , Salvadori N , Frattini G , Simoni S , De Roeck N , Tambasco N , Stoops E , Vanderstichele H , Engelborghs S , Mollenhauer B , Calabresi P , Parnetti L ((2017) ) Differential role of CSF fatty acid binding protein 3, α-synuclein, and Alzheimer’s disease core biomarkers in Lewy body disorders and Alzheimer’s dementia. Alzheimers Res Ther 9: , 52. |
[51] | Vanderstichele H , Demeyer L , Janelidze S , Coart E , Stoops E , Mauroo K , Herbst V , FranÇois C , Hansson O ((2017) ) Recommendations for cerebrospinal fluid collection for the analysis by ELISA of neurogranin trunc P75, α-synuclein, and total tau in combination with Aβ(1-42)/Aβ(1-40). Alzheimers Res Ther 9: , 40. |
[52] | Rutherfurd SM , Gilani GS ((2009) ) Amino acid analysis. Curr Protoc Protein Sci 58: , 11.9.111.9.37. |
[53] | Ozols J ((1990) ) Amino acid analysis. Methods Enzymol 182: , 587–601. |
[54] | Simonsen AH , Bahl JMC , Danborg PB , Lindstrom V , Larsen SO , Grubb A , Heegaard NHH , Waldemar G ((2013) ) Pre-analytical factors influencing the stability of cerebrospinal fluid proteins. J Neurosci Methods 215: , 234–240. |
[55] | Mollenhauer B , Batrla R , El-Agnaf O , Galasko DR , Lashuel HA , Merchant KM , Shaw LM , Selkoe DJ , Umek R , Vanderstichele H , Zetterberg H , Zhang J , Caspell-Garcia C , Coffey C , Hutten SJ , Frasier M , Taylor P ((2017) ) A user’s guide for α-synuclein biomarker studies in biological fluids: Perianalytical considerations. Mov Disord 32: , 1117–1130. |
[56] | Öhrfelt A , Zetterberg H , Andersson K , Persson R , Secic D , Brinkmalm G , Wallin A , Mulugeta E , Francis PT , Vanmechelen E , Aarsland D , Ballard C , Blennow K , Westman-Brinkmalm A ((2011) ) Identification of Novel α-Synuclein Isoforms in Human Brain Tissue by using an Online NanoLC-ESI-FTICR-MS Method. Neurochem Res 36: , 2029–2042. |
[57] | Tofaris GK , Razzaq A , Ghetti B , Lilley KS , Spillantini MG ((2003) ) Ubiquitination of α-synuclein in Lewy bodies is a pathological event not associated with impairment of proteasome function. J Biol Chem 278: , 44405–44411. |
[58] | Moors TE , Maat CA , Niedieker D , Mona D , Petersen D , Timmermans-Huisman E , Kole J , El-Mashtoly SF , Spycher L , Zago W , Barbour R , Mundigl O , Kaluza K , Huber S , Hug MN , Kremer T , Ritter M , Dziadek S , Geurts JJG , Gerwert K , Britschgi M , van de Berg WDJ ((2021) ) The subcellular arrangement of alpha-synuclein proteoforms in the Parkinson’s disease brain as revealed by multicolor STED microscopy. Acta Neuropathol 142: , 423–448. |
[59] | Baba M , Nakajo S , Tu PH , Tomita T , Nakaya K , Lee VM , Trojanowski JQ , Iwatsubo T ((1998) ) Aggregation of alpha-synuclein in Lewy bodies of sporadic Parkinson’s disease and dementia with Lewy bodies. Am J Pathol 152: , 879–884. |
[60] | Dedmon MM , Lindorff-Larsen K , Christodoulou J , Vendruscolo M , Dobson CM ((2005) ) Mapping long-range interactions in α-synuclein using spin-label NMR and ensemble molecular dynamics simulations. J Am Chem Soc 127: , 476–477. |
[61] | McGlinchey RP , Ni X , Shadish JA , Jiang J , Lee JC ((2021) ) The N terminus of α-synuclein dictates fibril formation. Proc Natl Acad Sci U S A 118: , e2023487118. |
[62] | Stephens AD , Zacharopoulou M , Moons R , Fusco G , Seetaloo N , Chiki A , Woodhams PJ , Mela I , Lashuel HA , Phillips JJ , De Simone A , Sobott F , Schierle GSK ((2020) ) Extent of N-terminus exposure of monomeric alpha-synuclein determines its aggregation propensity. Nat Commun 11: , 2820. |
[63] | Slemmon JR , Meredith J , Guss V , Andreasson U , Andreasen N , Zetterberg H , Blennow K ((2012) ) Measurement of Aβ1-42 in cerebrospinal fluid is influenced by matrix effects. J Neurochem 120: , 325–333. |
[64] | Slemmon JR , Shapiro A , Mercken M , Streffer J , Romano G , Andreasen N , Zetterberg H , Blennow K ((2015) ) Impact of cerebrospinal fluid matrix on the detection of Alzheimer’s disease with Aβ42 and influence of disease on the total-Aβ42/Aβ40 ratio. J Neurochem 135: , 1049–1058. |
[65] | Simonsen AH , Kuiperij B , El-Agnaf OMA , Engelborghs S , Herukka S-K , Parnetti L , Rektorova I , Vanmechelen E , Kapaki E , Verbeek M , Mollenhauer B ((2015) ) The utility of α-synuclein as biofluid marker in neurodegenerative diseases: A systematic review of the literature. Biomark Med 10: , 19–34. |

