
Taste Impairments in a Parkinson’s Disease Model Featuring Intranasal Rotenone Administration in Mice
Abstract
Background:
Taste impairments are often accompanied by olfactory impairments in the early stage of Parkinson’s disease (PD). The development of animal models is required to elucidate the mechanisms underlying taste impairments in PD.
Objective:
This study was conducted to clarify whether the intranasal administration of rotenone causes taste impairments prior to motor deficits in mice.
Methods:
Rotenone was administrated to the right nose of mice once a day for 1 or 4 week(s). In the 1-week group, taste, olfactory, and motor function was assessed before and after a 1-week recovery period following the rotenone administration. Motor function was also continuously examined in the 4-weeks group from 0 to 5 weeks. After a behavioral test, the number of catecholamine neurons (CA-Nos) was counted in the regions responsible for taste, olfactory, and motor function.
Results:
taste and olfactory impairments were simultaneously observed without locomotor impairments in the 1-week group. The CA-Nos was significantly reduced in the olfactory bulb and nucleus of the solitary tract. In the 4-week group, locomotor impairments were observed from the third week, and a significant reduction in the CA-Nos was observed in the substantia nigra (SN) and ventral tegmental area (VTA) at the fifth week along with the weight loss.
Conclusion:
The intranasal administration of rotenone caused chemosensory and motor impairments in an administration time-period dependent manner. Since chemosensory impairments were expressed prior to the locomotor impairments followed by SN/VTA CA neurons loss, this rotenone administration model may contribute to the clarification of the prodromal symptoms of PD.
INTRODUCTION
Parkinson’s disease (PD) is a neurodegenerative disorder, characterized by the neurodegeneration of dopaminergic (DA) neurons in the substantia nigra (SN) or ventral tegmental area (VTA) [1]. Although the cardinal features of PD are distinctive motor symptoms, PD also characteristically presents multiple non-motor symptoms (NMSs) [2]. Olfactory impairments occur in PD patients with a frequency between 75 to 90% [3], and these impairments predate the onset of motor symptoms by at least 4 years. The existence of olfactory hallucinations (phantosmia) [4], but not smell loss (anosmia), in PD patients has prompted debate and consideration about the occurrence of dysfunction in the central olfactory system. In addition, taste impairments also occur in PD patients with a frequency between 9 to 70% [3, 5], usually in the early phase of the PD pathology, that is, 2 to 10 years before the appearance of PD-related motor symptoms [5]. It is interesting to note that PD-related taste impairments in humans are mainly involved in aversive tastes, such as bitter stimuli [6–11]. The amount of quantitative data on taste impairments in PD patients has been increasing since the first report [12], but the mechanisms underlying PD-related taste impairments remain unknown.
Rotenone is an organic pesticide and one of the environmental risk factors for human PD [13, 14]. The mechanism of rotenone toxicity, which is related with neurodegeneration, has been revealed as a higher permeability of the blood-brain barrier, a mitochondrial complex I inhibitor, and an enhancer of intracellular reactive oxygen species (ROS) [15]. Following the chronic administration of rotenone to rodents, pathological changes in the areas of the brain responsible for human PD are induced, along with motor deficits and multiple NMSs. Furthermore, gastrointestinal dysfunction, olfactory impairment (hyposmia), sleep disturbance, cognitive impairment, depression, and somatosensory disturbances have been demonstrated in PD rotenone models [16]. Nevertheless, the differences in the route employed, as well as the dosage and duration of the rotenone administration have induced varied results [16]. Although some environmental toxicants may enter the body via various routes simultaneously, such as ingestion, cutaneous contact or inhalation [17], some forms of PD may be caused by the delivery of toxins to the brain via the olfactory mucosa [18]. Intranasal administration can directly deliver rotenone from the nasal mucosa to the central nervous system (CNS) in a short time period, as shown with other chemicals [19, 20]. In fact, early studies showed that the intranasal administration of rotenone (0.35 mg/kg; lower than oral administration [21]) for 1 week simultaneously induced catecholamine (CA) neuron loss in the olfactory bulb (OB) and olfactory impairments in mice [22]. In addition, prolonging the rotenone exposure to 2 weeks caused degeneration of the CA neuronal fibers in the SN without neural loss [23]. In our previous study, we also found that with the intranasal administration of rotenone (0.35 mg/kg) for 1 week, mice exhibited a mild impaired memory of conditioned taste aversion to bitter taste [24]. Interestingly, the impaired taste associative memory was also shown in the genetic fly model of PD (DJ-1 mutant fly), accompanied by the reduction of taste sensitivity [25]. There may be a common pathophysiological characteristic between the genetic and the toxic-induced PD animal models, but, little evidence has been shown regarding the effects of rotenone administration on taste sensitivity in contrast to smell sensitivity in mice.
The aim of this study was to determine whether or not the intranasal administration of a low-dose of rotenone to mice would cause taste, olfactory and motor impairments. In order to discriminate the rotenone-induced taste and olfactory impairments as NMSs, the rotenone administration period was divided into two groups, a short (1 week) group (hereafter, the 1w-Rot group) and a long (4 weeks) group (hereafter, the 4w-Rot group) for evaluating the chemical senses and motor functions, respectively. In addition, the population of tyrosine hydroxylase (TH) immunoreactive (TH-ir) neuron/fiber in the CNS was also investigated for each experimental period to confirm the temporal relationship between the impairments of chemical senses and behavior, and morphological changes.
MATERIALS AND METHODS
All of the animal experiments conducted in this study were approved by the Animal Ethics Committees of Osaka University Graduate School of Dentistry and Meikai University School of Dentistry and were conducted according to the guidelines issued thereby for the care and use of laboratory animals (project identification code: 29-001-2 and A2045/A2112, respectively). Every possible effort was made to reduce the suffering of the animals.
Experimental animals and rotenone administration
There were differential patterns of licking behavior [26] and estrous cycles [27] between the sex of the rodents. In addition, the activity of the ROS scavenging enzymes and the superoxide dismutase antioxidant enzymes in the Swiss albino mouse brain varied among sexes [28]. In order to exclude these factors, a total of 140 male C57BL/6J mice at 20–25 weeks of age (Japan SLC, Hamamatsu, Japan and Sankyo Labo Service Corporation, Tokyo, Japan) were used. These mice were randomly divided into the rotenone (n = 70) and vehicle (n = 70) groups, housed with a 12-h light/dark cycle at a constant room temperature (20–24°C), and given ad libitum access to food. We previously described the method employed for the intranasal administration of rotenone [24]. Briefly, the rotenone (Sigma-Aldrich, MO, USA) was first dissolved in 100% dimethyl sulfoxide (DMSO; Fujifilm Wako Pure Chemical Corporation, Osaka, Japan) to derive a stock solution at a concentration of 0.1 M. The stock solution was then diluted with distilled water (DW) just before the administration to the mice to prevent any degradation of rotenone in the DW. The mice were anesthetized with 3% isoflurane (Wako Pure Chemical Industries, Osaka, Japan) and a polyethylene micro tube (ID: 0.2 mm, OD: 0.4 mm, length: 8 mm), connected to a peristaltic pump (ATTO, Tokyo, Japan), was inserted into the right side of the nose cavity. The intranasal administration (7.0μl/10g body weight) of rotenone (0.35 mg/kg) or vehicle (3.5% DMSO) was delivered once a day for 1 or 4 weeks. The dose of the rotenone employed was determined based on the two reports [22, 23].
Measurement of the pilocarpine-induced saliva secretion and the serum zinc level
Saliva volume in the 1w-Rot group (n = 10) and the group of mice administrated with a vehicle for 1-week (the 1w-Veh group: n = 10) was determined by a gravimetric method using paper plugs, as described in our previous study [29]. One week after finishing the rotenone or vehicle administration, pilocarpine (Fujifilm Wako Pure Chemical Corporation, Osaka, Japan) was injected intraperitoneally at 0.5 mg/kg under anesthesia (0.75 mg/kg medetomidine, 4.0 mg/kg midazolam and 5.0 mg/kg butorphanol) at a dose of 50μl/10g body weight (Fig. 1A, black down arrows). The secreted saliva was then absorbed by paper plugs (United Dental Manufactures Inc., TN, USA) inserted into the oral cavity for 60 s every 1 min after the pilocarpine injection (Fig. 1A, gray arrowheads). The saliva-saturated plugs were weighed, and the resulting values were then corrected for the original weight of the paper plug. The volume of secreted saliva was calculated from the increase in the weight of each paper plug. The total saliva volume was calculated by adding the increase in weight of each paper plug in each 60 s measurement segment from 1 to 20 min after the pilocarpine injection. All of the saliva volume values were normalized for body weight. Blood samples (0.6–0.9 ml) in other 1w-Rot (n = 10) and 1w-Veh (n = 10) groups were collected by cardiac puncture 1 day after the behavioral test using water intake (see the explanation below). The samples were centrifuged at 3,000 rpm for 5 min at 4°C. The serum was separated and stored at –20°C until measurements of the serum levels of zinc were conducted using the Nitro PAPS method (BML, Inc., Tokyo, Japan) [30].
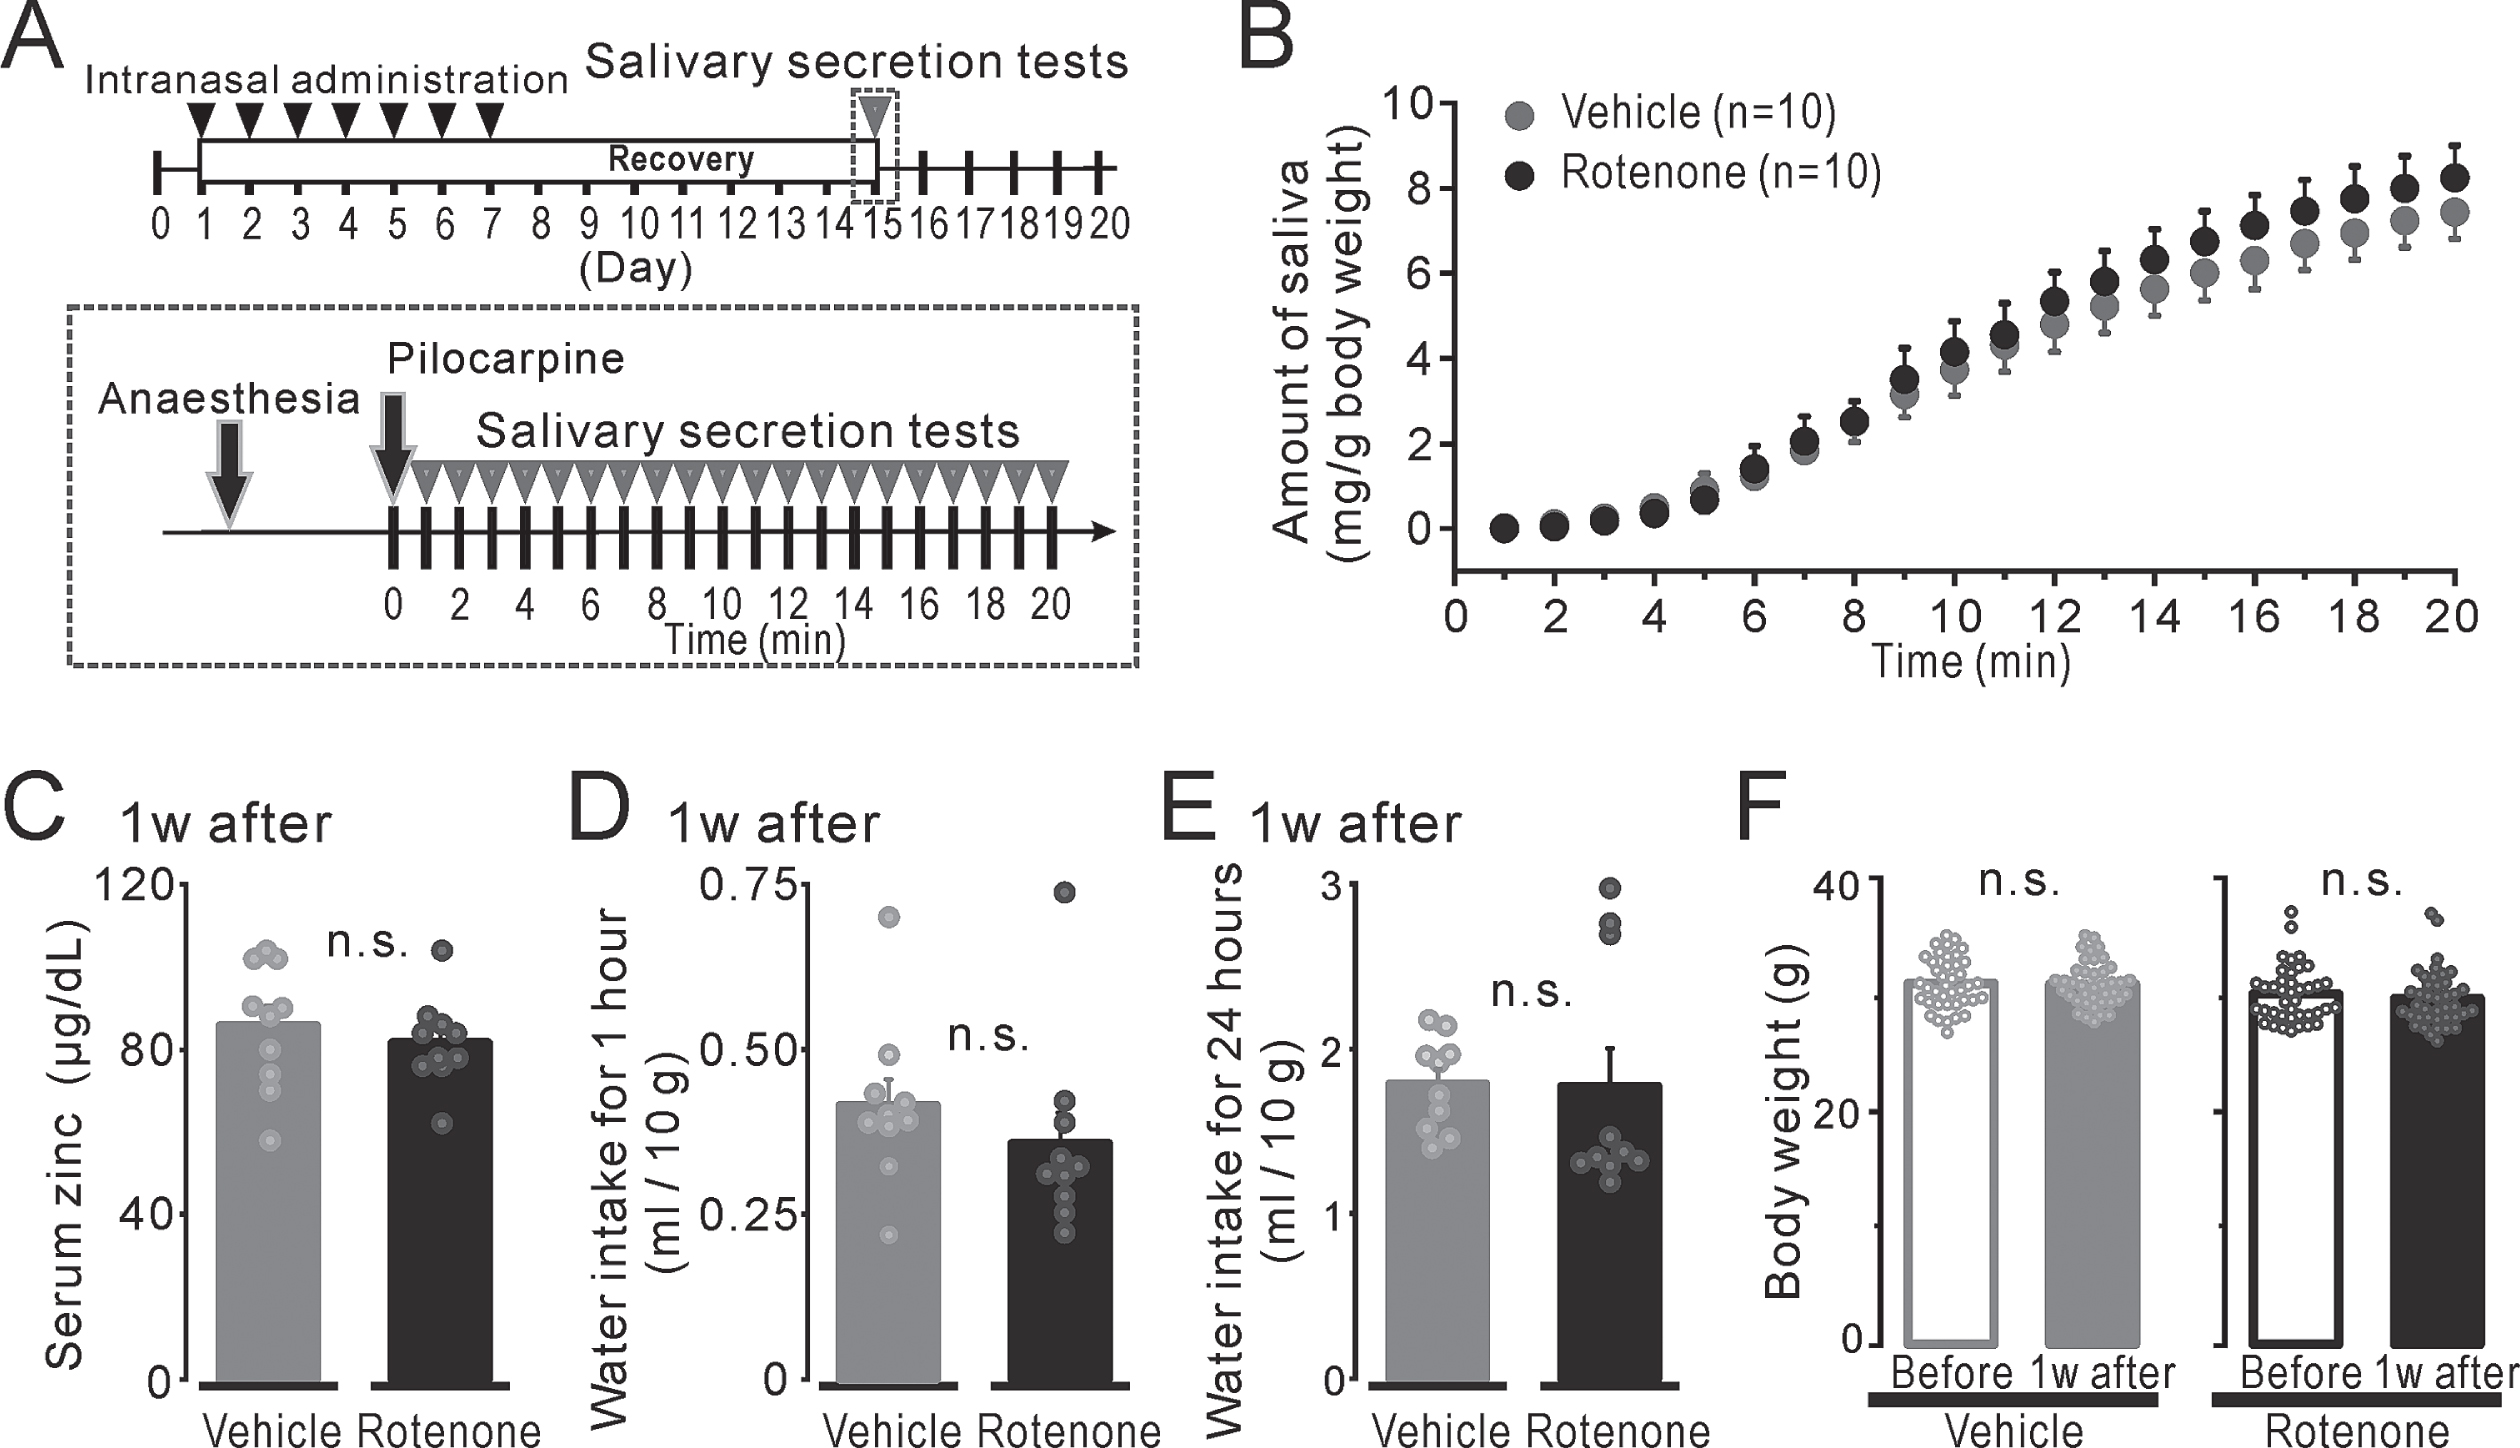
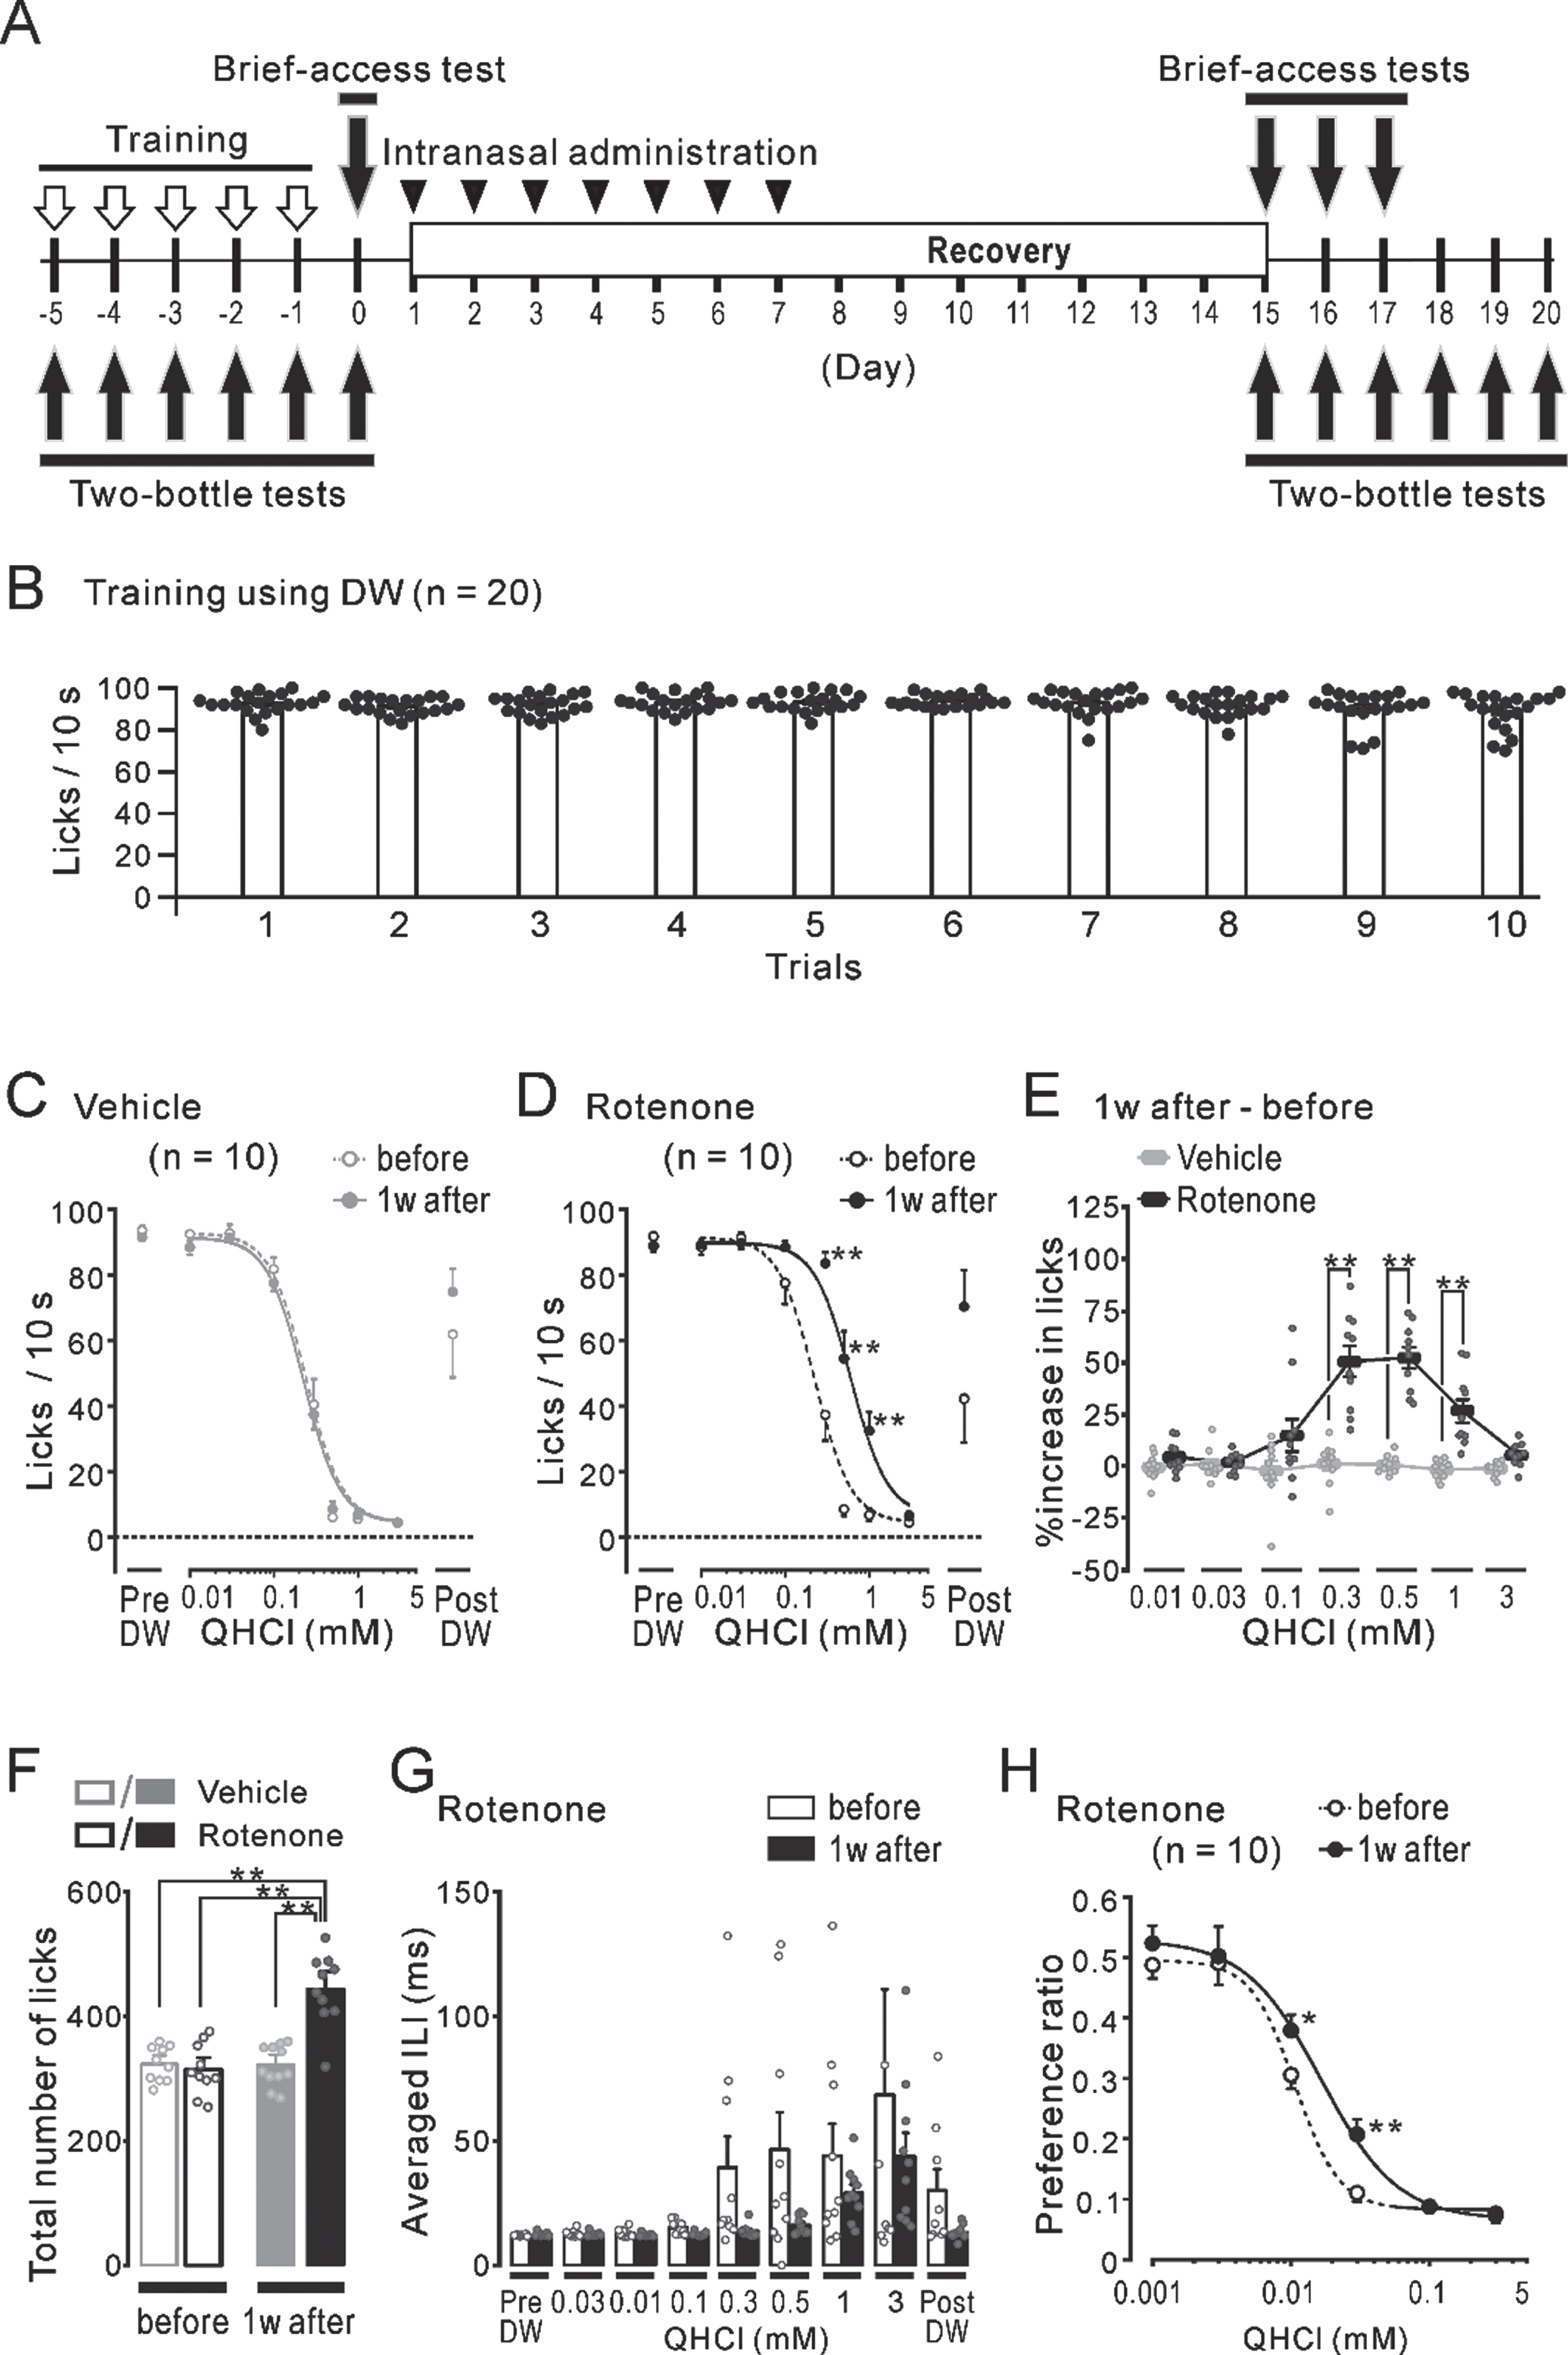
Fig. 1
The mouse condition after 1-week intranasal rotenone/vehicle administration. A) Top: The time course of the pilocarpine-induced salivary secretion tests (gray arrowheads) and intranasal administration (black arrowheads). Bottom: The protocol for pilocarpine-induced salivary secretion tests. B) The volume of the secreted saliva, which indicated as total up to each period, normalized for body weight from 1 to 20 min after a pilocarpine injection in the 1w-Veh (gray circles) and the 1w-Rot (black circles) groups. C) The serum zinc concentration normalized for body weight in the 1w-Veh (gray bar) and the 1w-Rot (black bar) groups. D, E) The amount of water intake for 1-hour (D) or 24-hours (E) in the 1w-Veh (gray bar) and the 1w-Rot (black bar) groups. F) The body weights of the mice before (hollow bars) and 1 week after (filled bars) the vehicle (gray) or the rotenone (black) treatment.
Thirst evaluation by water intake for 1 h and 24 h
In order to examine the changes in the drinking behavior by measuring the water intake in the mice, the 22.5 h water-deprived mice in the 1w-Rot (n = 10) and 1w-Veh (n = 10) groups were caged individually (28×17.5×13 cm) and were freely given access to a bottle with DW for 24 h before the intranasal administration and 1 week after finishing the intranasal administration. The amount of DW consumed from a bottle was measured for 1 h and then for 23 h. This data was normalized for body weight. After the thirst evaluation, the mice were given access to DW ad libitum for 24 h. All animals involved in the water intake tests were used for the blood tests, as mentioned above.
Olfactory avoidance tests conducted using the Y maze apparatus with an aversive odor
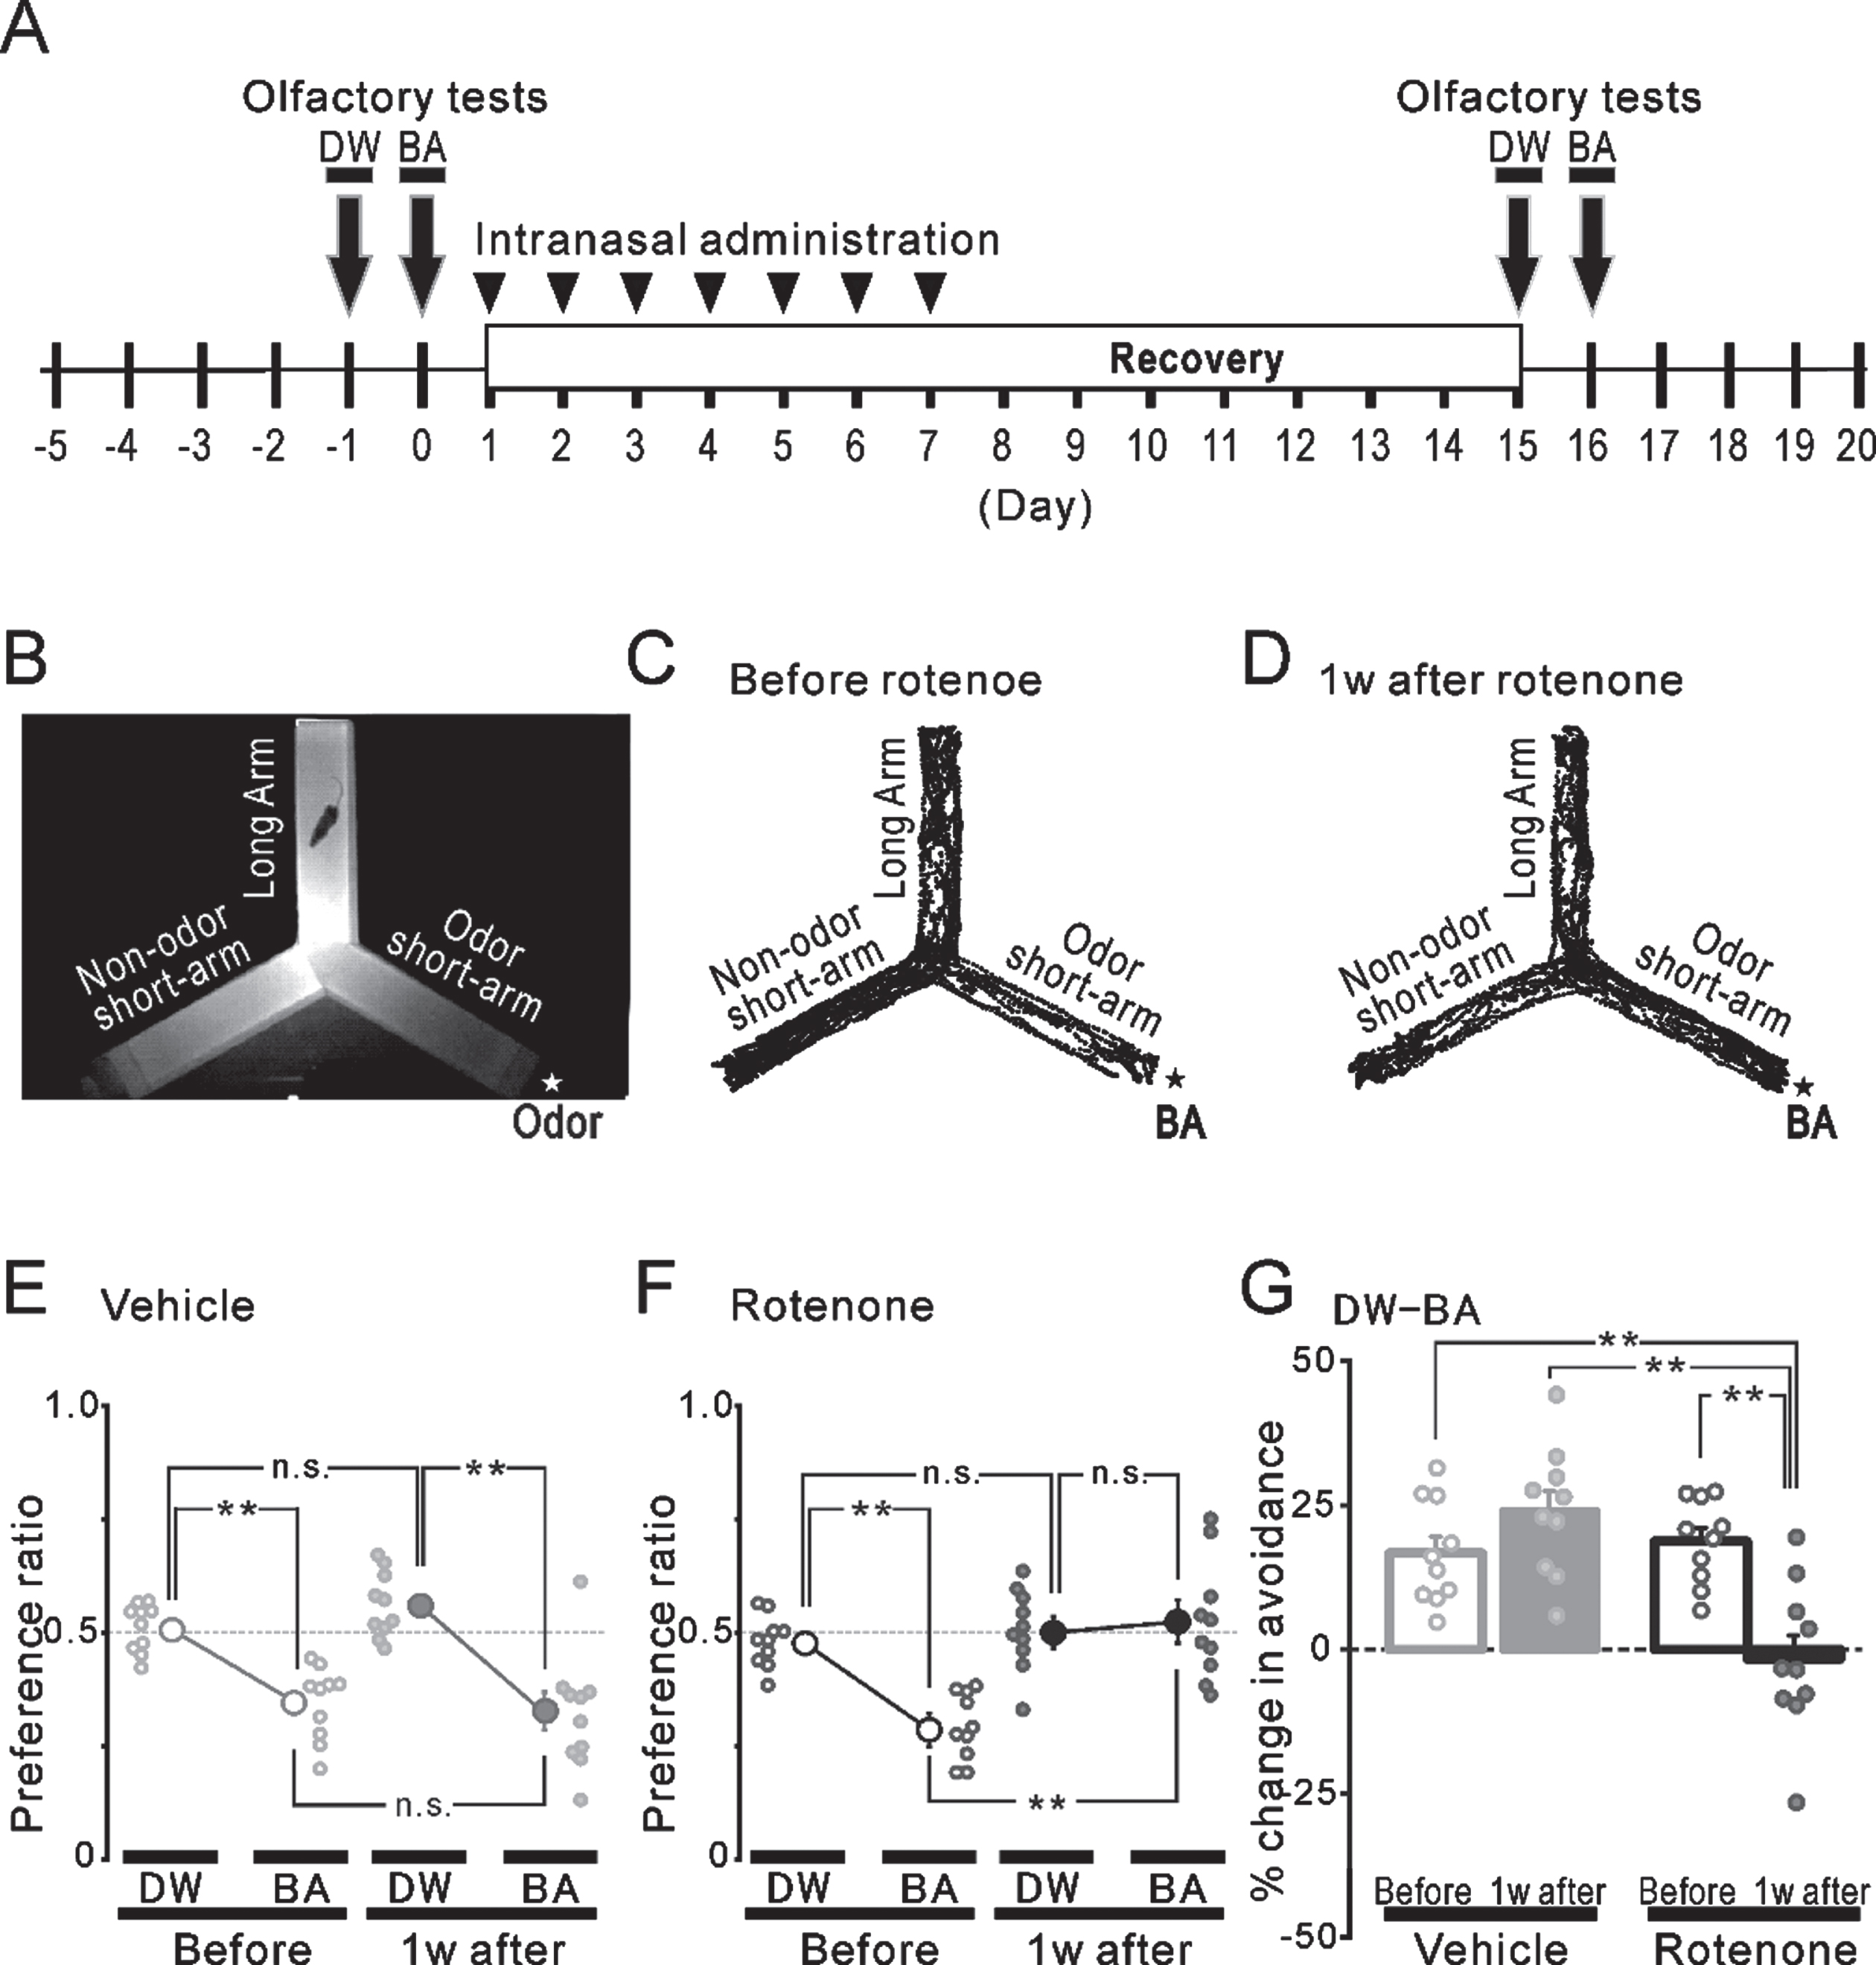
The olfactory function of the mice in the 1w-Rot (n = 10) and 1w-Veh (n = 10) groups was examined from 20:00 p.m. for 2 consecutive days just before and 1 week after the rotenone or vehicle administration (Fig. 4A, black arrows). The avoidance behavior of the mice reacting to odor stimuli was examined using the methods described in the study of Utsugi et al. [31] using a plexiglass Y-maze apparatus (Fig. 4B), which consisted of three arms: one long-arm (10×45×15 cm) and two short arms (10×40×15 cm). We used DW or butyric acid (BA, Fujifilm Wako Pure Chemical Corporation, Osaka, Japan) as odor stimuli. A piece of filter paper (1×1 cm2) which had absorbed an aliquot of BA or DW (20μl) was then placed outside a 1 cm gap under the end wall of a short-arm (Fig. 4B). The free movement of the mice in the Y-maze apparatus was recorded for 4 min at a frame rate of 30 FRS using an infrared video camera (HDR-CX500, Sony, Tokyo, Japan). The center of the body mass was estimated from a captured image using Gaussian mixture model and then the coordination of the pixels was decided with MATLAB (The MathWorks, MA, USA) (Fig. 4C, D). The time spent in each short arm was calculated from the tracks and then the ratio of the time in the odor short arm to that in the non-odor short arm was obtained (Fig. 4E, F) as the odor preference ratio. Finally, the rate of avoidance change was estimated by subtracting the preference ratio of BA from that of the DW (Fig. 4G). After the behavioral test, the mice were sacrificed for the histological analysis (see the explanation shown below).
Brief-access tests conducted using a gustometer with an aversive taste
The short-term bitter taste function of 22.5 h water-deprived mice in the 1w-Rot (n = 10) and 1w-Veh (n = 10) groups was assessed using brief-access tests [32]. The shutter of the gustometer (LKT-1, MELQUEST, Toyama, Japan) was opened to present the spout of the taste solution bottle to the mice. Mice were allowed to access the spout for 10s from the first lick, then the shutter was closed automatically in 10 s. If a mouse did not lick the spout within 90 s, the shutter was closed once and reopened after 20 s. In order to conduct brief-access tests with the mice functioning at their full-effort limits, the mice were trained for 5 days before the tests were conducted (Fig. 5A, black open down-arrows). On the 1st and 2nd day, the mice had free access to the bottle with DW in the gustometer for 30 min. On the following 3 days, the mice were trained enough to run 10 trials using only DW (Fig. 5B). After training, the short-term taste function of trained-mice was assessed from 20:00 p.m. before and 1 week after finishing the rotenone or vehicle administration (Fig. 5A, black filled down-arrows). The brief-access tests consisted of DW and Taste sessions. In the DW sessions (2 trials), DW was presented to the mice before (Pre DW) and after (Post DW) the taste session. In the taste sessions, 7 concentrations (0.01–3.0 mM) of Quinine HCl (QHCl, NACALAI TESQUE, Kyoto, Japan) solutions were presented in ascending order to the mice (7 trials). A total of 9 trials in a test were continuously run with inter-trial intervals for 20 s. During the trials, the number of licks and the duration of each lick were simultaneously recorded at a sampling frequency of 500 Hz through the A/D converter (PCD320A, KYOWA, Tokyo, Japan) and the data was stored on a PC. The concentration-lick relationship, obtained from the number of licks in each concentration of the QHCl solutions, was established and the approximate curve was obtained (Fig. 5C and D, dotted and solid curves) using the logistic function described below.
In order to examine the group differences, the increase (%) in licks in each group was calculated by subtraction of the lick numbers counted before the rotenone (or vehicle) administration from that obtained after the rotenone (or vehicle) administration (Fig. 5E). Furthermore, the total number of licks at all of the concentrations of the QHCl employed was summated in the before/after vehicle and rotenone groups (Fig. 5F). In addition, the inter-lick-interval (ILI) for each concentration of the QHCl solutions was obtained to estimate the motor function related to licking behavior (Fig. 5G). In order to minimize the influence of the liquid administration to the nasal area during water intake, the results obtained on 3 consecutive days in the 1w-Rot and 1w-Veh groups were averaged. After the behavioral test, the mice were sacrificed for the histological analysis (see the explanation shown below).
Two-bottle preference tests conducted using distilled water and an aversive solution
Additional mice from the non-water-deprived 1w-Rot (n = 10) and 1w-Veh (n = 10) groups were involved in only 2-bottle tests to evaluate the long-term bitter taste function [33]. Mice without water-deprivation were caged individually (28×17.5×13 cm) and presented with two bottles every day for 6 days (Fig. 5A, black filled up-arrows): One bottle contained DW and the other contained any one of 6 concentrations (0.001–0.3 mM) of the QHCl solution. The QHCl solutions were presented in a randomized order and the bottles were left in the cage for 24 h for each concentration (with a position switch at 12 h). The taste preferential ratio was calculated by dividing the consumed-volume of the QHCl solutions by the total consumed-volume of the DW and the QHCl solutions. A taste preferential ratio >0.5, and taste preferential ratio <0.5 indicate preference and avoidance for the QHCl solution, respectively (Fig. 5H). The concentration preferential ratio relationship, obtained from the taste preferential ratio for each concentration of the QHCl solutions, was established and the approximate curve was obtained using the same logistic function described above (Fig. 5H, dotted and solid curves).
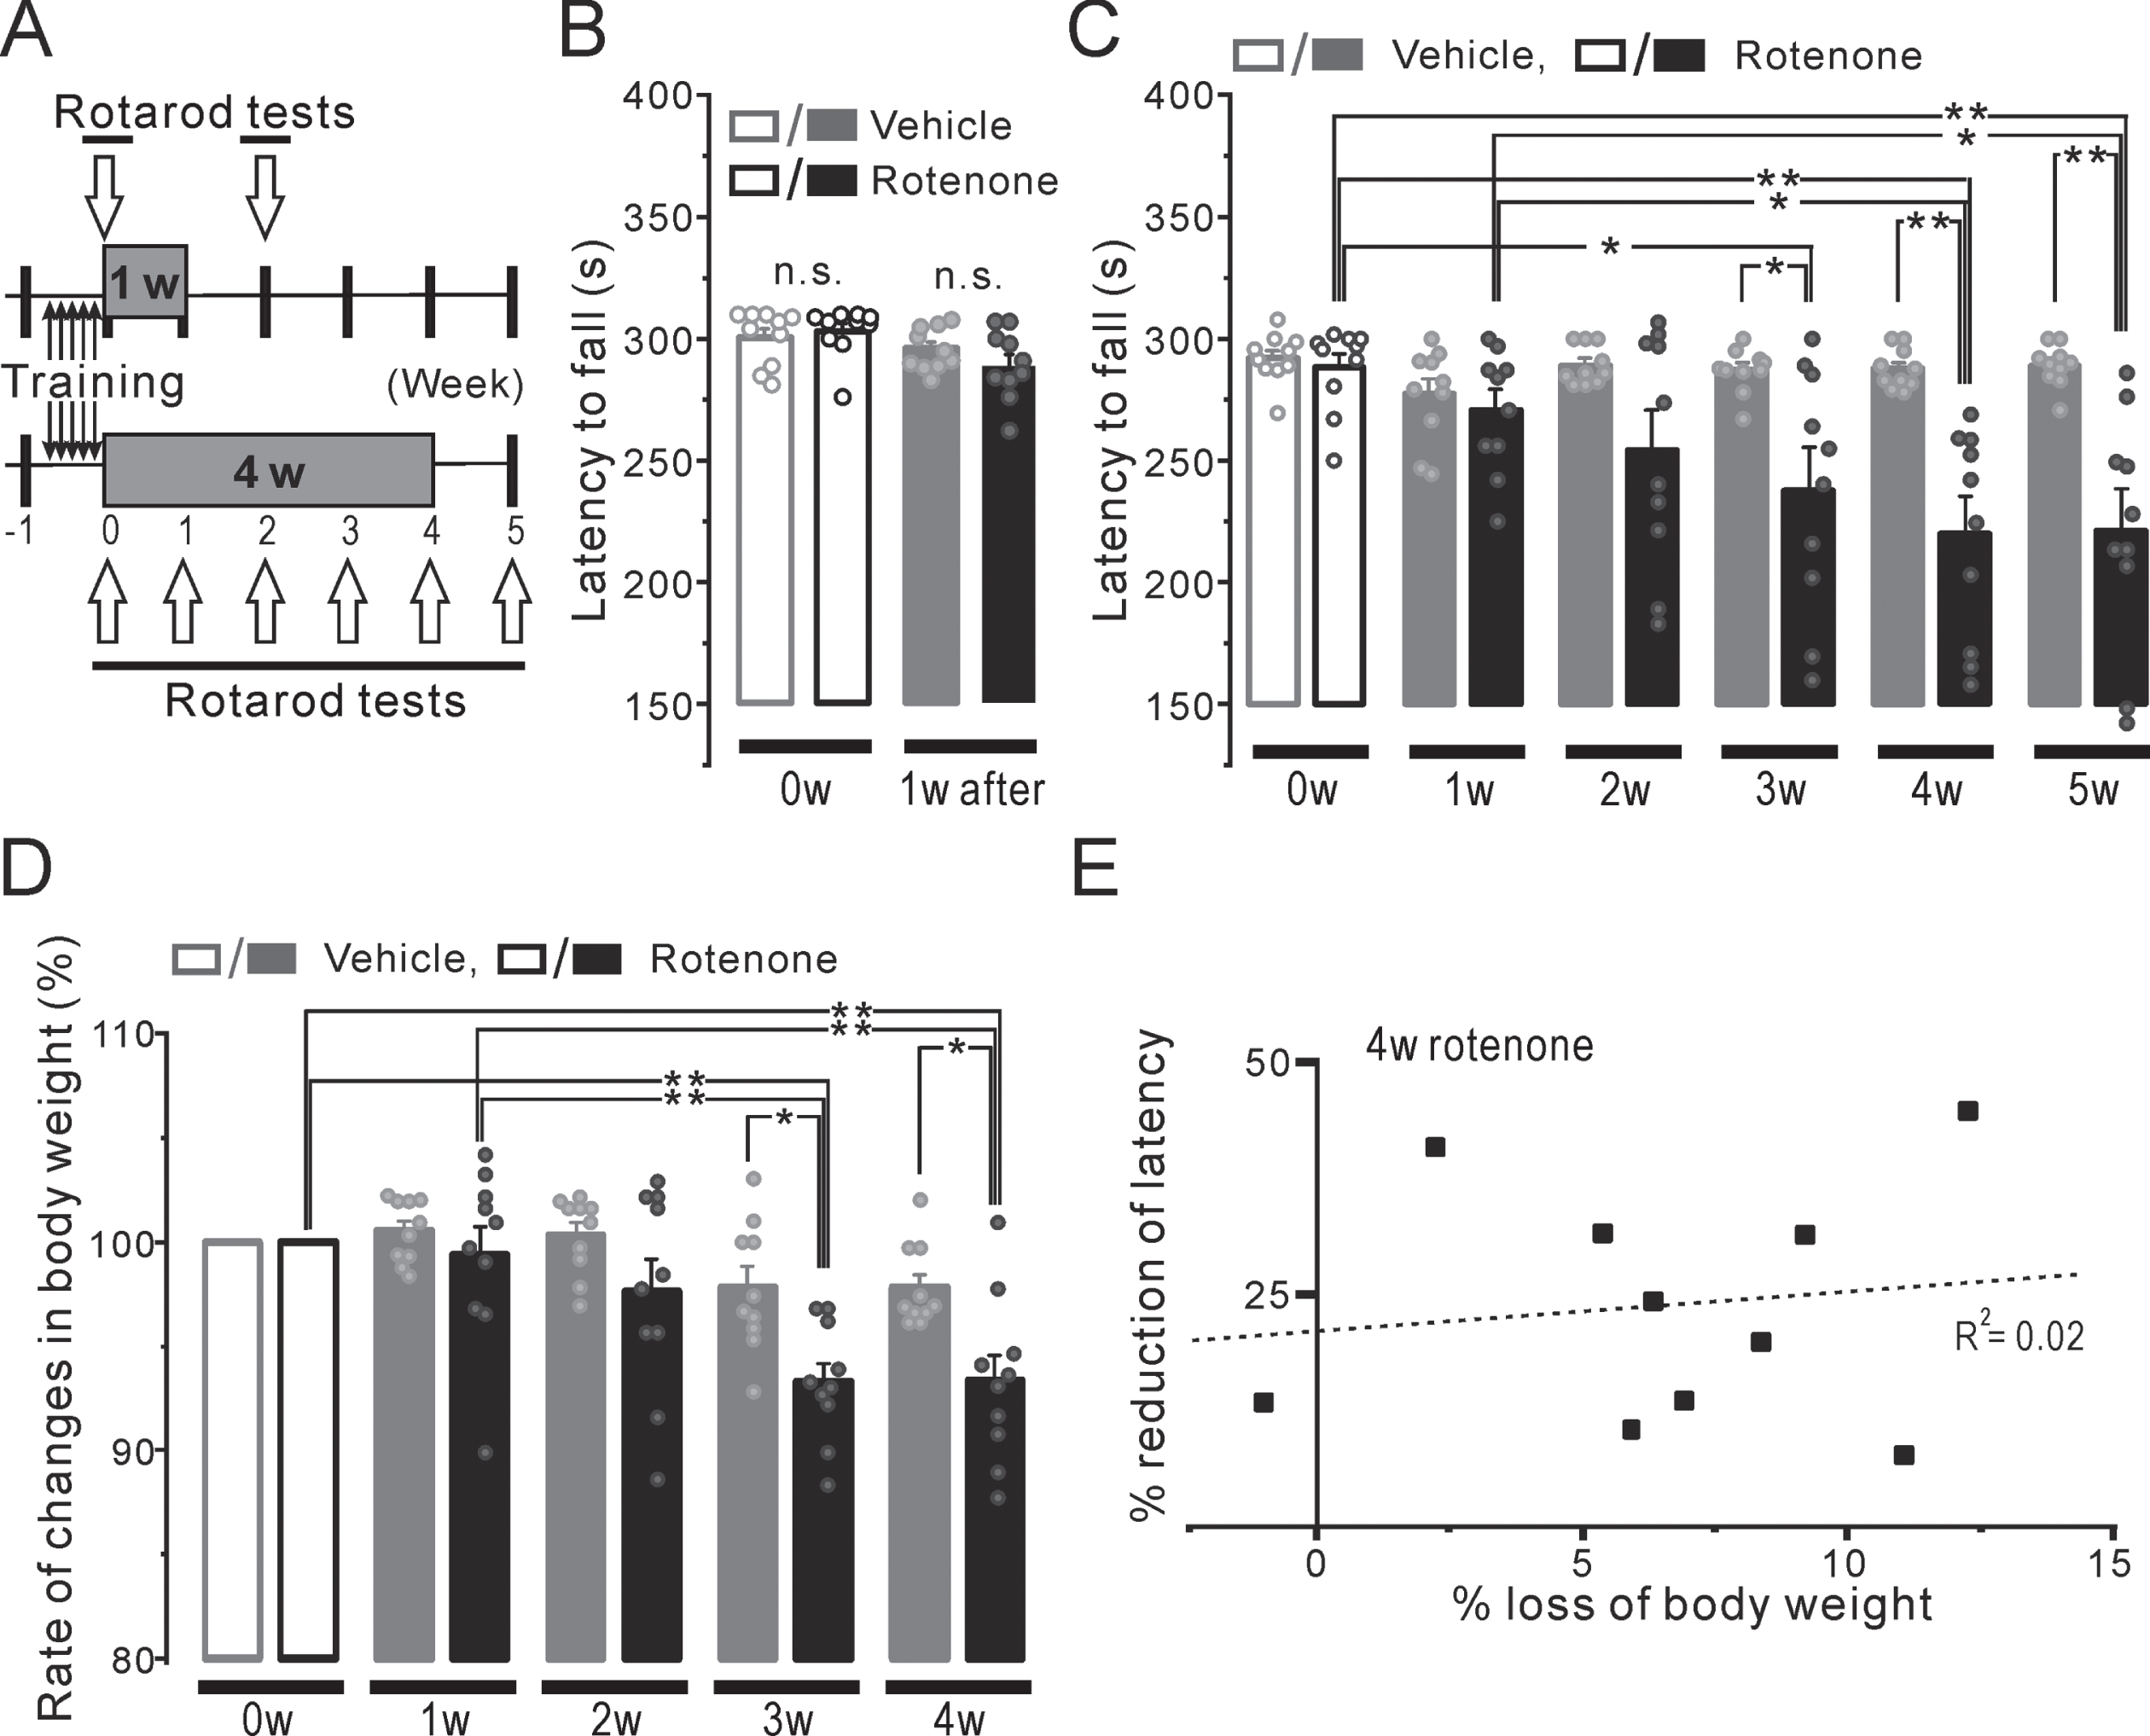
The locomotor function assessment was conducted using accelerating rotarod tests
The locomotor function of the 1w-Rot (n = 10) and 1w-Veh (n = 10) group mice was assessed using rotarod tests [34] employing a portable single-lane rotarod treadmill (MK-630B, Muromachi Kikai Co, Tokyo, Japan). Prior to the rotarod tests, the mice were trained with a fixed rod speed (24 rpm) for 5 days before the intranasal administration (Fig. 6A, black up/down-arrows) in order to ensure that the mice could walk on the rod for more than 250 seconds. Just before and 1 week after finishing the rotenone or vehicle administration (Fig. 6A, open down-arrows), the falling-off latency for the accelerating rod (4.0–40 rpm) was examined from 20:00 p.m. in the trained-mice. In addition, to examine the effect of long-term rotenone administration on locomotor function, the administration period of the rotenone and vehicle groups (4w-Rot and 4w-Veh groups: n = 10 each) was extended to 4 weeks (Fig. 6A, 4w). The falling-off latency was measured from 0 to 5 weeks after starting the rotenone or vehicle administration (Fig. 6A, open up-arrows). After the behavioral test, the mice were sacrificed for the histological analysis (see the explanation shown below).
Immunohistochemistry
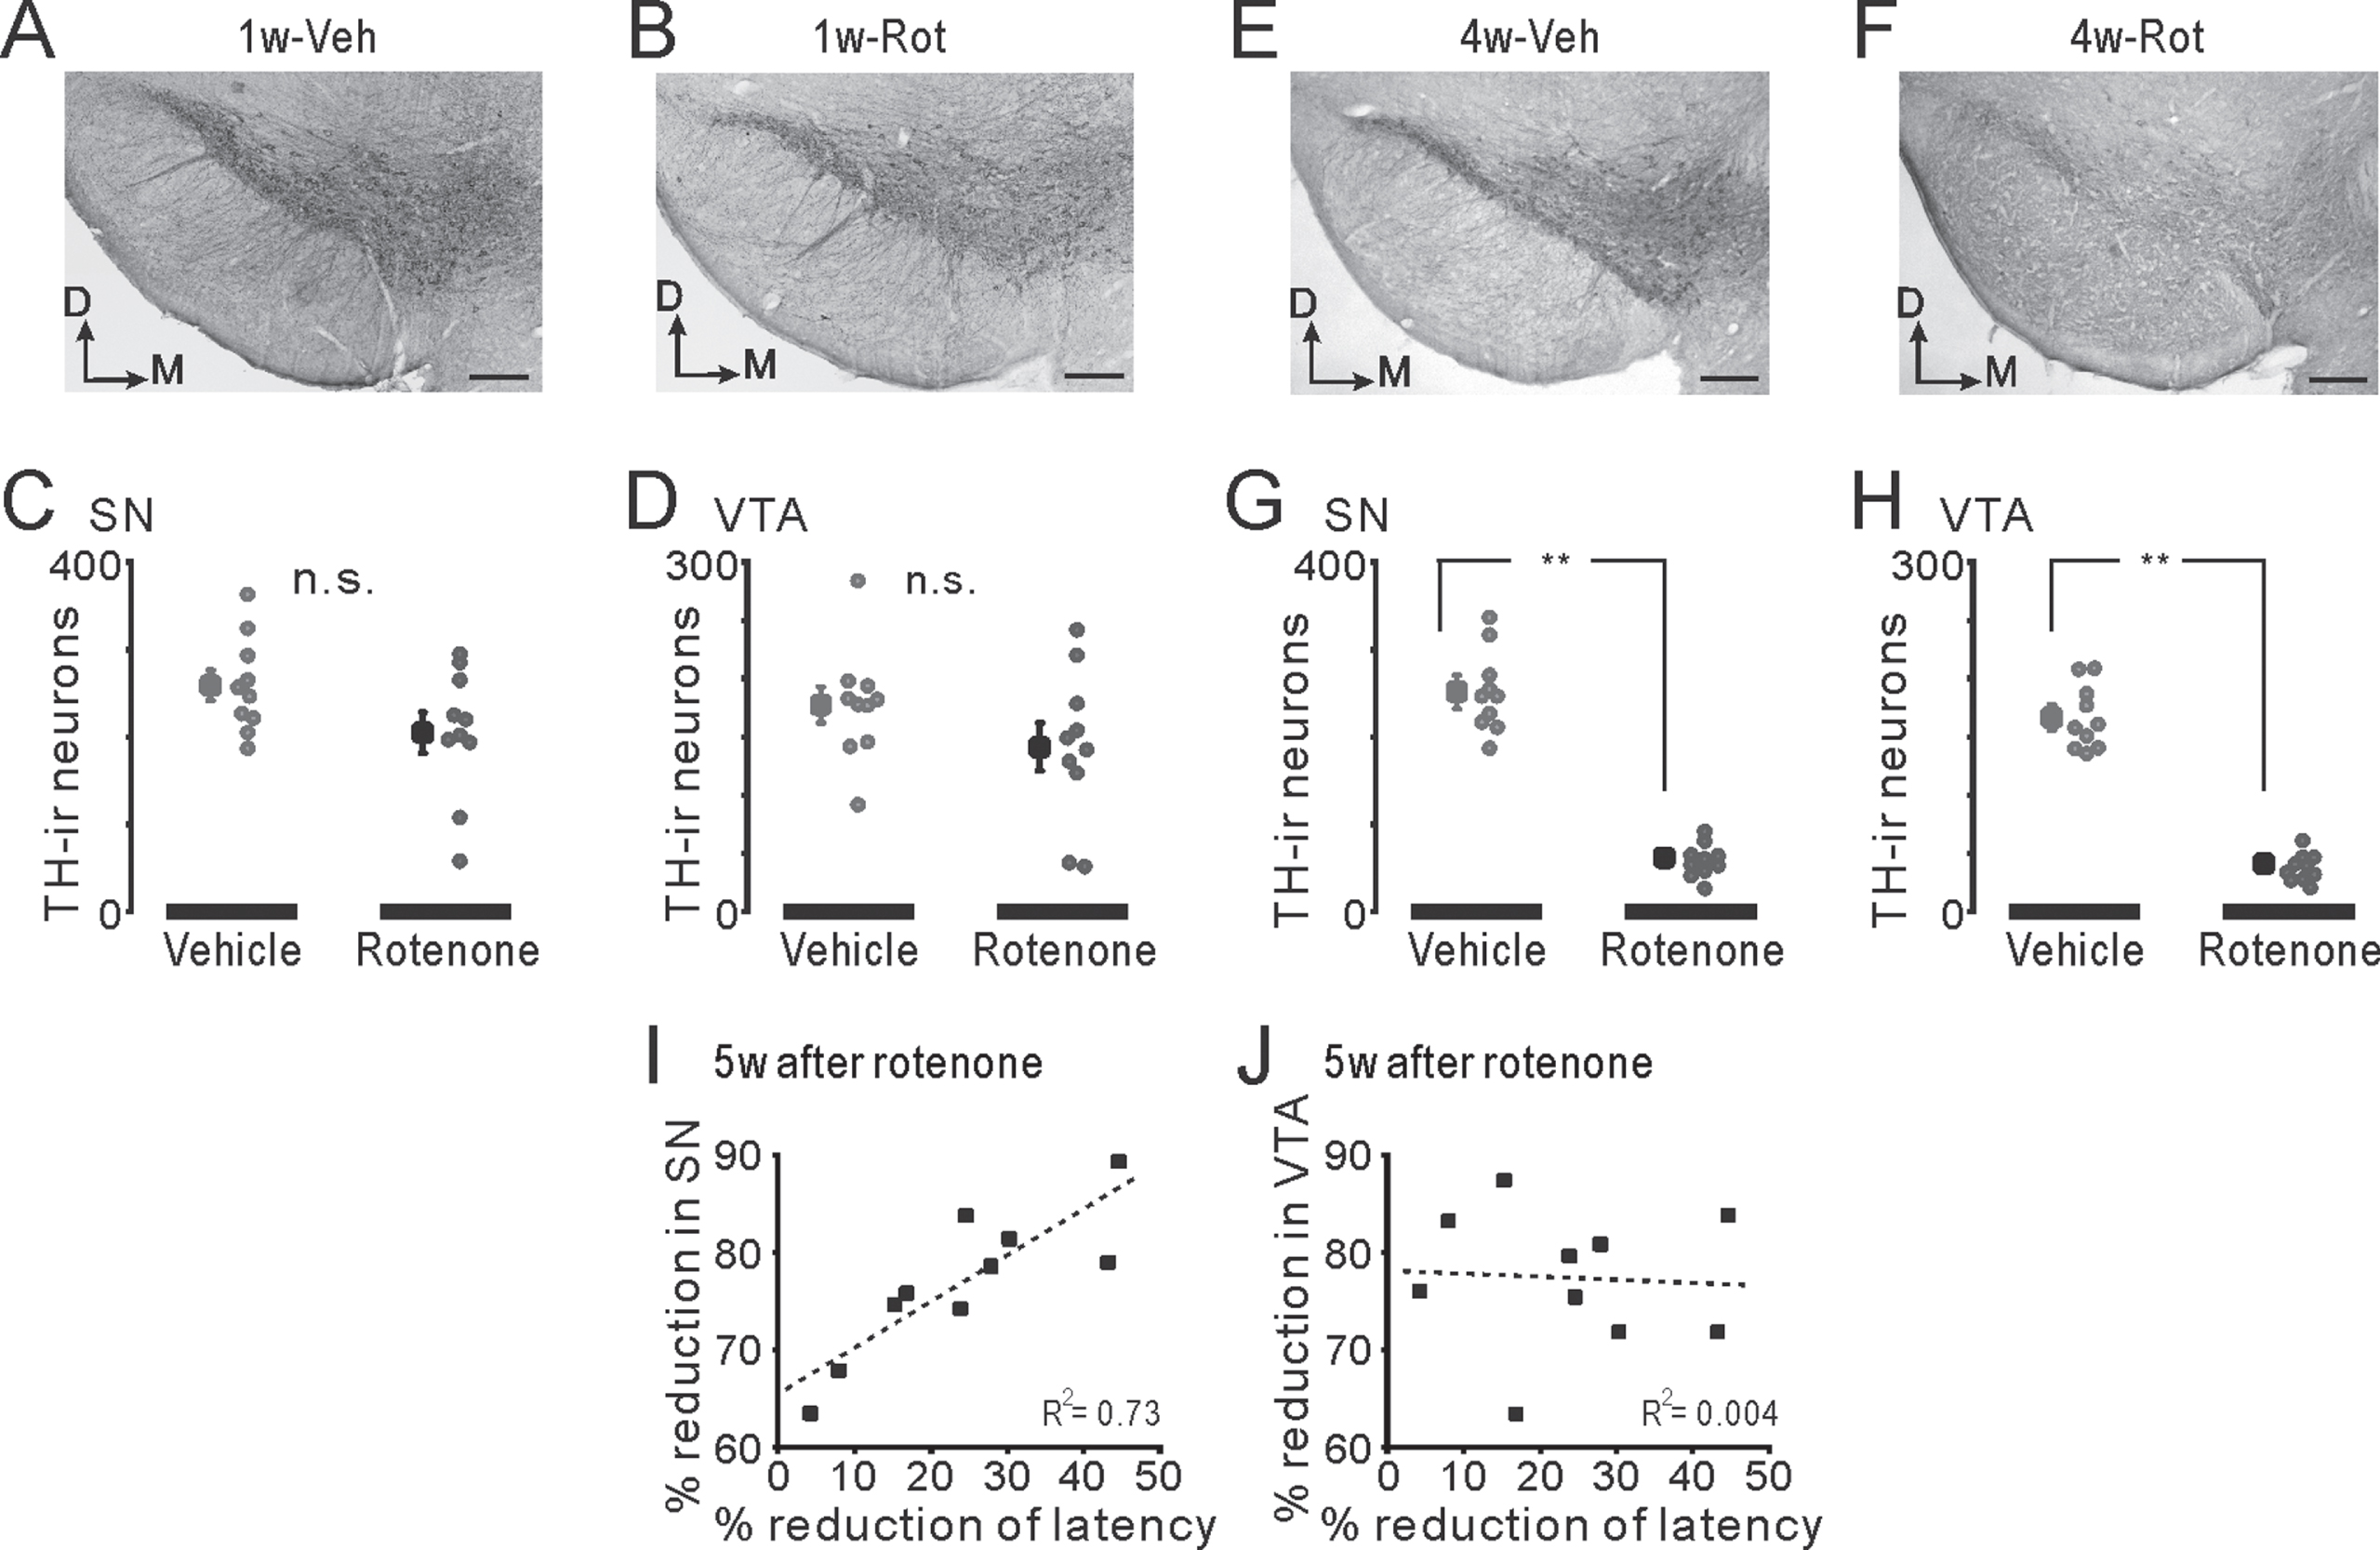
After the olfactory avoidance tests, the brief-access tests and the rotarod tests in the 1w-Rot (n = 10) and 1w-Veh (n = 10) groups, the immunohistochemistry was performed in the OB, the nucleus of the solitary tract (NTS)/the insular cortex (IC), and the SN/VTA, respectively. The immunohistological changes in the SN/VTA were examined in the 4w-Rot (n = 10) and 4w-Veh (n = 10) groups at 1 week after finishing the 4-week rotenone or vehicle administration. The mice were processed by cardiac perfusion with 0.1 M phosphate buffer saline (PB) and 4% paraformaldehyde in 0.1 M PB. The brain was dissected and cut into coronal/parasagittal sections at a thickness of 30μm with a microslicer (SM2000R, Leica Microsystems, Wetzlar, Germany). For the detection of CA neurons with TH, these sections were first incubated in 0.02 M PBS with 0.75% Triton X-100 and 1% H2O2 (PBSx) for 2 h. After incubation in 0.02 M PBS with 3% normal goat serum (s-1000, Vector Laboratories,Newark, CA) for 1 h, these sections were incubated in PBSx with polyclonal rabbit anti-TH (1:8000; ab112, Abcam, Cambridge, UK) overnight at 4°C. These sections were incubated in 0.02 M PBS with Goat anti-rabbit IgG antibody (1:400; BA-1000, Vector Laboratories, Newark, CA) for 2 h and then incubated in 0.02 M PBS with ABC complex (PK-6100, Vector Laboratories, Newark, CA) for 1 h. Finally, these sections were incubated in 0.05 M Tris Buffer Saline with 0.025% Diaminobenzidine, 0.03% H2O2, and 0.06% Nickel ammonium. Half of the sections were also stained with Nissl’s stain. All of the sections were mounted onto slide glasses using Permount (Fisher Scientific Inc, NH, USA) and then covered. In order to conduct a histological assessment, the brain areas considered to express regional functional differences (e.g., NTS) [35] were divided to facilitate the analysis. The rostro-caudal levels in the NTS and the boundary between the SN and VTA were determined based on two reports [36, 37]. The number of TH-ir neurons (TH-ir Nos) were counted in OB (+4.52 to +3.62 mm from the bregma), rostral NTS (rNTS: –6.36 to –6.96 mm from the bregma), intermediate NTS (iNTS: –7.08 to –7.56 mm from the bregma), and SN/VTA (–2.95 to –3.15 mm from the bregma) manually, using an optical microscope (Nikon Eclipse Ci, Nikon, Tokyo, Japan). We calculated the reduction (%) of the TH-ir Nos in the SN and VTA by dividing the TH-ir-Nos of the 4w-Rot group by the averaged TH-ir-Nos of the 4w-Veh group. In addition, the area (%) of the TH-ir fibers was measured in layers II-V of the dysgranular IC (DI, enclosed area in Fig. 2C) that mainly respond to the bitter taste (+0.19, +0.01 and –0.17 mm from the bregma) [38], and the area (%) showing Nissl-stained particles in the brain stem sections, including the rNTS in the 1w-Veh and the 1w-Rot groups were measured using ImageJ software.
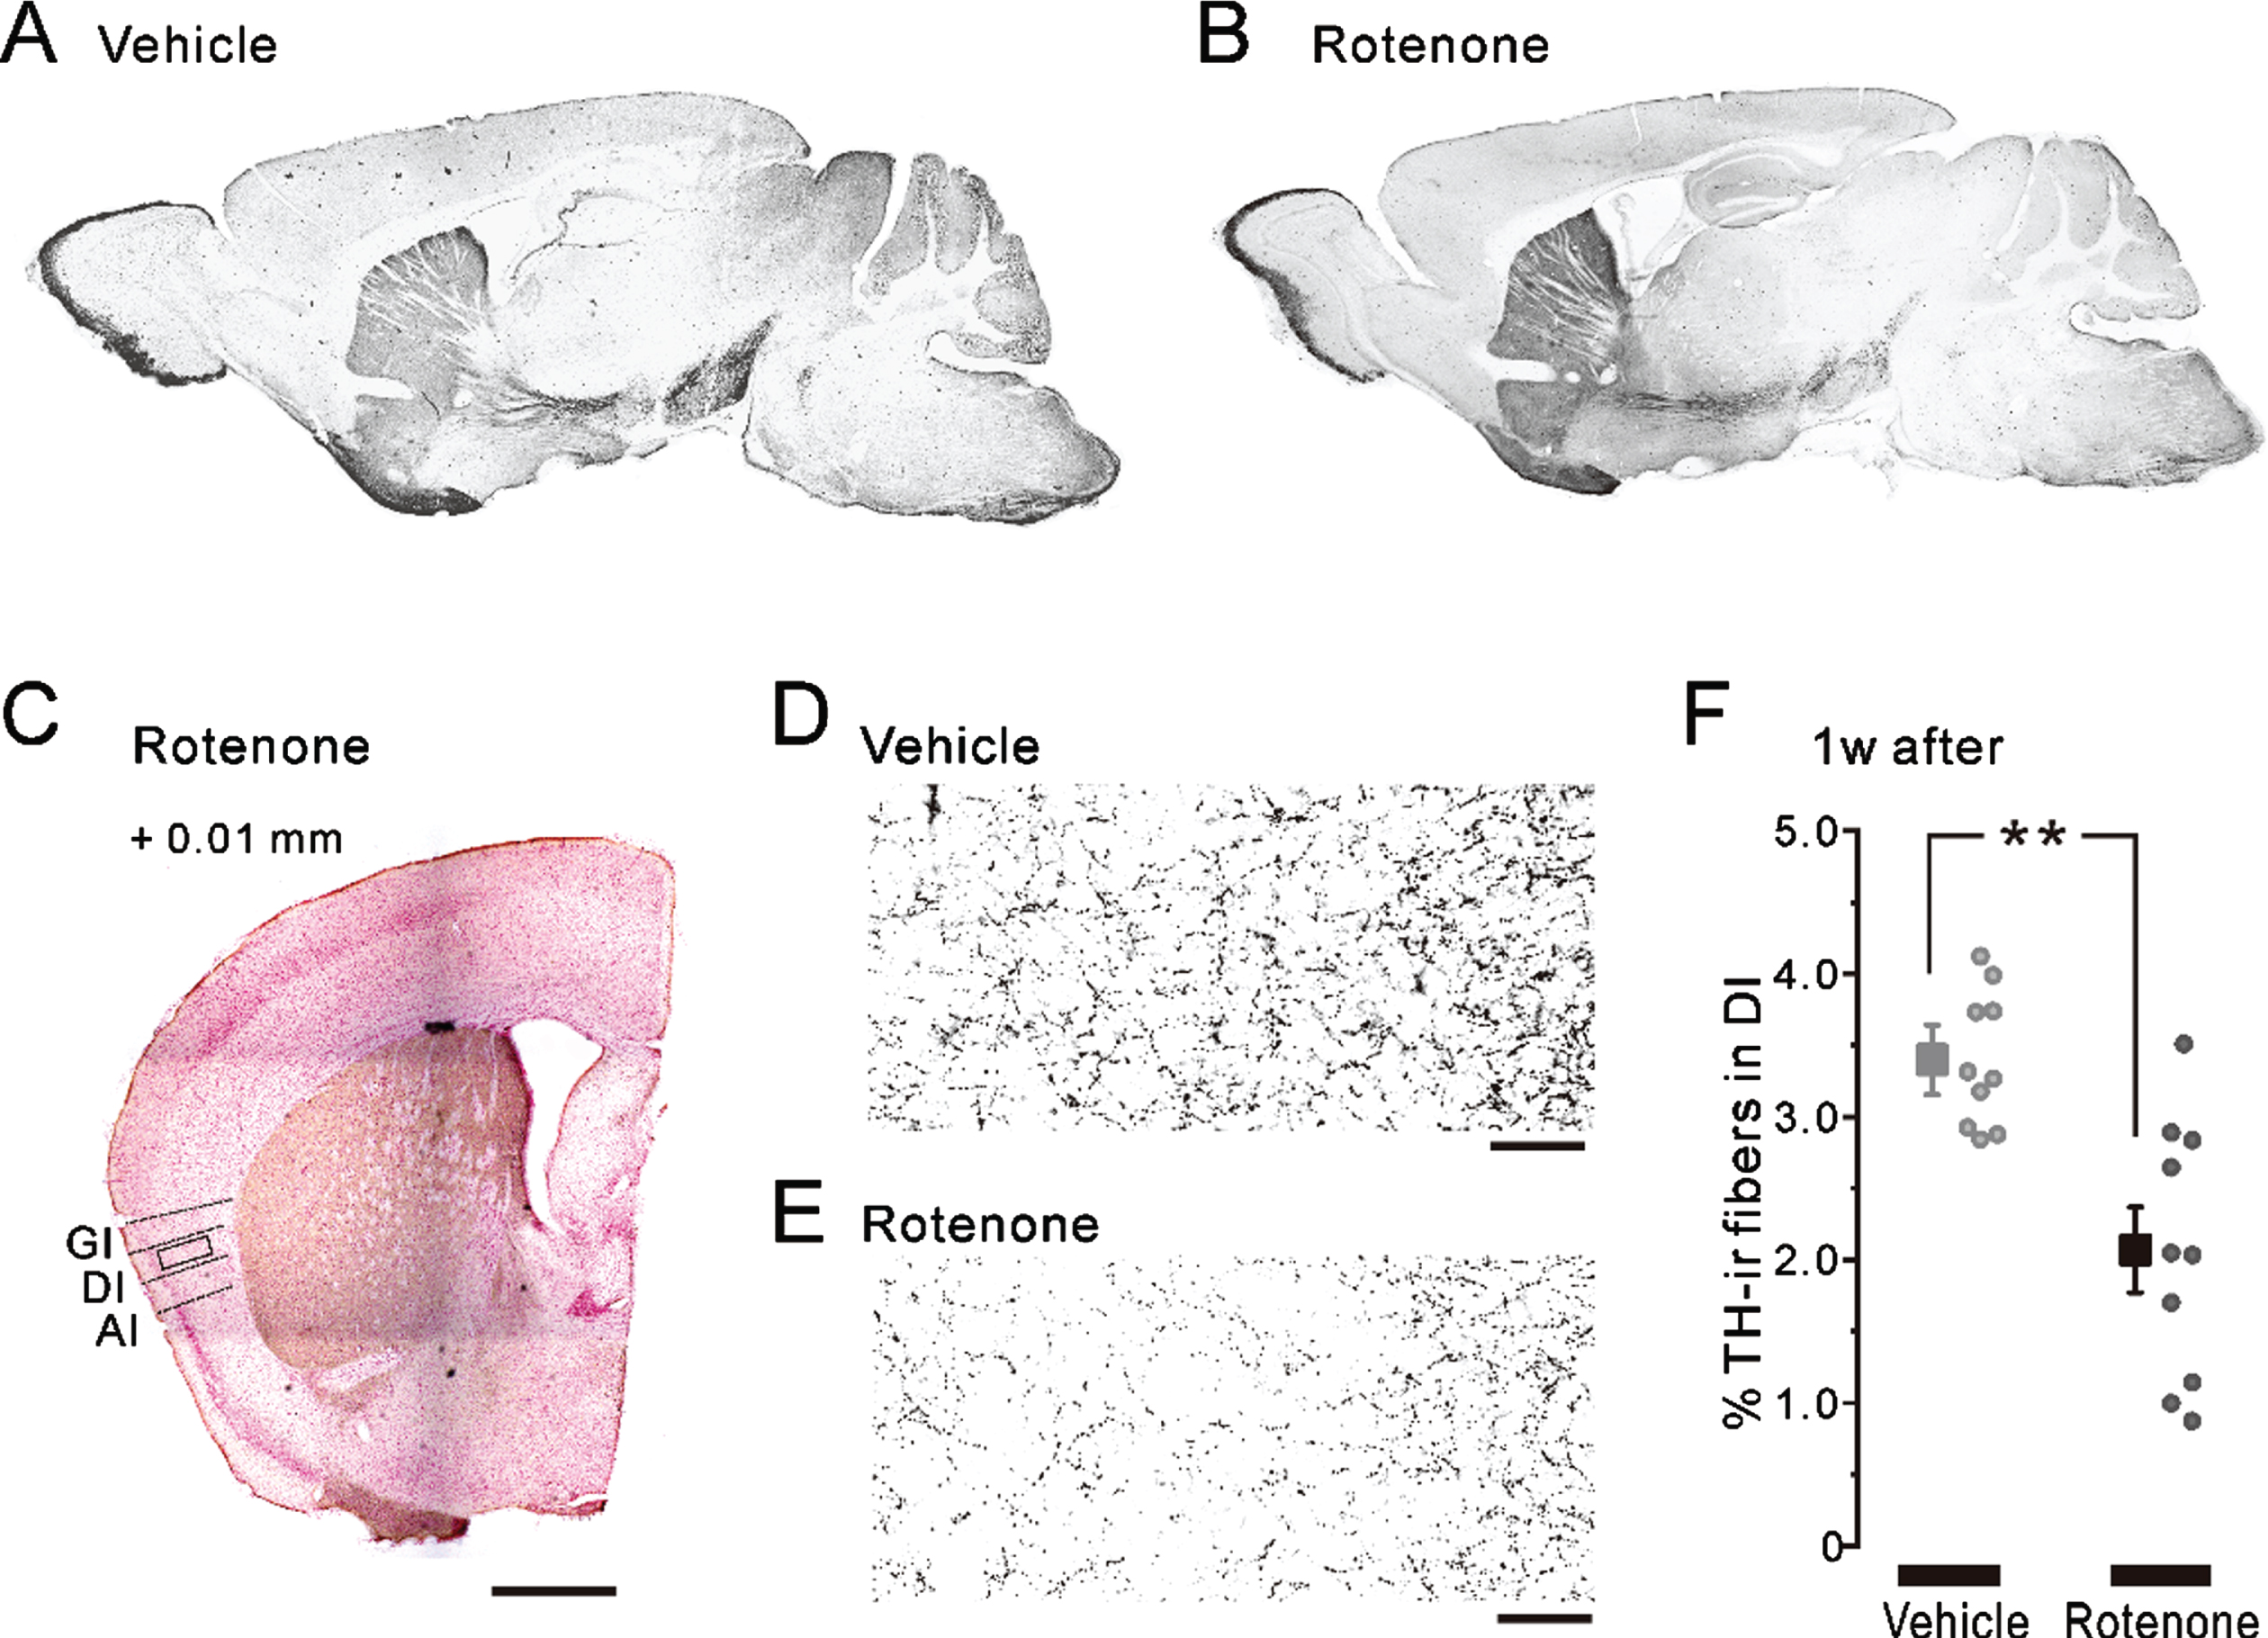
Fig. 2
TH-ir fibers in the nigrostriatal pathway and in the insular cortex after 1-week intranasal rotenone/vehicle administration. A, B) The representative parasagittal images of the TH expression in the 1w-Veh (A) and the 1w-Rot (B) groups. C) Half of the representative coronal images captured after TH/Nissl double staining in the 1w-Rot group. The coordinate of the coronal section was at +0.01 mm from the bregma. The enclosed areas (black frames) were used to measure the TH-ir fibers in the DI. Scale bars: 500μm. D, E) TH-ir fibers in the DI bitter taste area in the 1w-Veh (D) and the 1w-Rot (E) groups. Scale bars: 50μm. F) The area (%) of the TH-ir fibers in the DI bitter taste area of the 1w-Veh (gray square) and the 1w-Rot (black square) groups. **p < 0.01. GI, granular insular cortex; DI, dysgranular insular cortex; AI, agranular insular cortex; TH, tyrosine hydroxylase.
Data expression and statistical analysis
All of the data were expressed as the mean±SEM and considered statistically significant at p < 0.05 Results were statistically analyzed by two-way repeated-measures fractional ANOVA and two-way fractional ANOVA, followed by the Turkey HSD post-hoc test. Student’s t-test was used to compare the amount of water intake, the serum zinc level, the area (%) of TH-ir fibers in the DI, and the area (%) showing Nissl-stained particles in the brain stem. The paired t-test was also used to compare the mouse weight. The Pearson correlation coefficient was used to assess the strength of the linear relationship between weight loss/locomotor impairments and TH-ir-Nos loss. Origin Pro 2021 software (LightStone Corp, MA, USA) was used for all of the statistical analyses.
RESULTS
Changes in the factors affecting taste function
The volume of the pilocarpine-induced saliva secretion for 20 min in the 1w-Rot group showed a similar increase to that shown in the 1w-Veh group (Fig. 1B, compare black and gray circles). There were no significant differences in total pilocarpine-induced saliva volume between the 1w-Veh (7.4±0.6 mg) and the 1w-Rot (8.2±0.8 mg) groups. The serum zinc level showed insignificant values (Fig. 1C) in the 1w-Rot (81.6±3.4μg/dl) and in the 1w-Veh (85.8±4.8μg/dl) groups. In addition, there were no significant differences in the amount of the consumed DW for 1 h (Fig. 1D) and 24 h (Fig. 1E) between water-deprived 1w-Veh (0.45±0.04 ml and 1.79±0.09 ml, respectively) and 1w-Rot (0.36±0.05 ml and 1.77±0.23 ml, respectively) groups. The body weights before and after vehicle (30.9±0.3 g and 30.9±0.3 g, respectively) or rotenone (30.0±0.4 g and 29.6±0.4 g, respectively) administration also showed insignificant values in each group (Fig. 1F).
Changes in CA fiber/neuron caused by the intranasal administration of rotenone
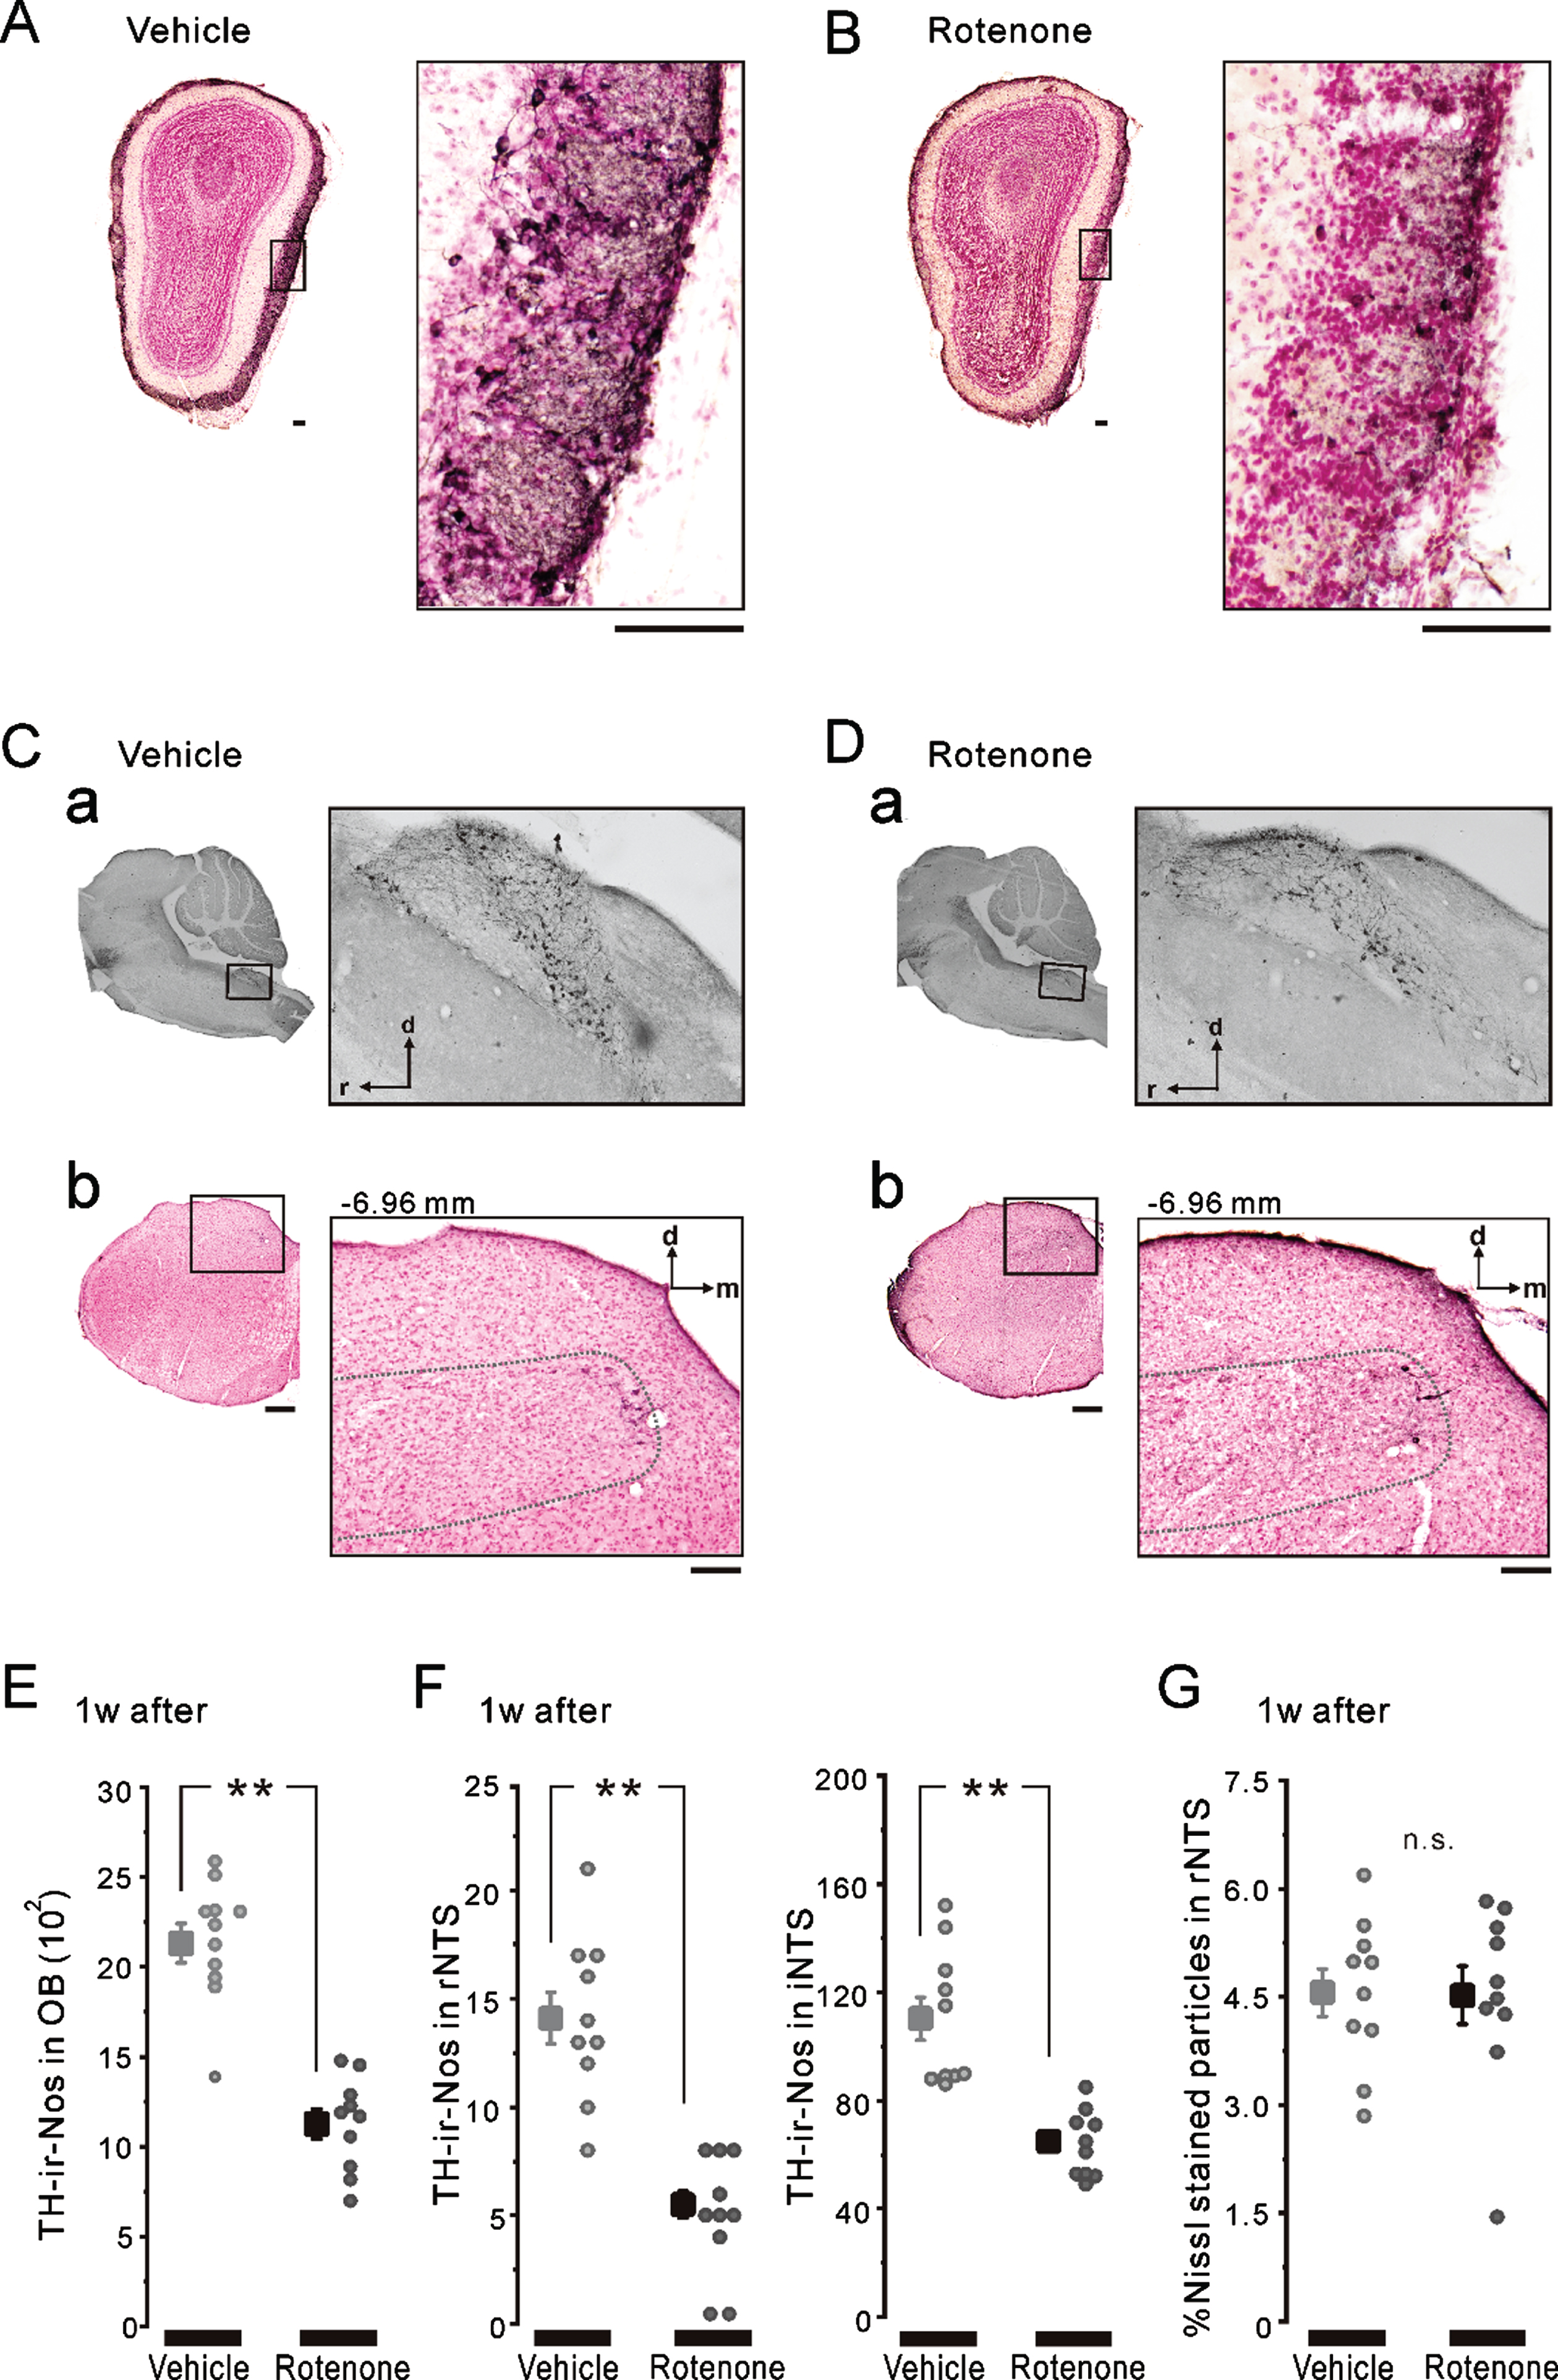
There was no apparent difference in the TH-ir nigrostriatal fibers of the parasagittal brain sections between the 1w-Veh (Fig. 2A) and the 1w-Rot (Fig. 2B) groups. In contrast, intranasal administration of rotenone for 1 week caused an apparent reduction in the TH-ir fibers in the bitter taste areas of the DI (Fig. 2D, E). On the other hand, the laminar structures of the cortex were maintained in the 1w-Rot group (Fig. 2C). The area (%) showing TH-ir fibers was significantly (p < 0.01) decreased in the DI bitter taste areas of the 1w-Rot group, compared with the 1w-Veh group (Fig. 2F). The 1w-Rot group showed TH-ir-Nos loss in the glomerular cell layer of the OB, compared to the 1w-Veh group (Fig. 3A, B). The TH-ir-Nos was significantly (p < 0.01) decreased in the 1w-Rot group (1,126±82) compared to that of the 1w-Veh group (2,131±110) (Fig. 3E). The significant (p < 0.01) TH-ir-Nos loss was also shown in the rNTS (6±1 vs. vehicle: 14±1) and the iNTS (65±12 vs. vehicle: 110±25) in the 1w-Rot group (Fig. 3Ca, Da, F), regardless of the fact that no apparent changes were demonstrated in the Nissl-stained particles (Fig. 3Cb, Db, G).
Fig. 3
TH-ir-Nos in OB and NTS after 1-week intranasal rotenone/vehicle administration. A, B) The representative coronal images of OB TH/Nissl double staining in the 1w-Veh (A) and the 1w-Rot (B) groups. TH-ir neurons were stained with a brown color. The left enclosed areas (black frames) were enlarged in right, respectively. Scale bars: 50μm. C, D) The representative parasagittal images of the NTS TH staining (a) and the coronal images of rNTS TH/Nissl double staining (b). The coordinate of the coronal brain stem section shown in b was at –6.96 mm from the bregma. The left enclosed areas (black frames) were enlarged in right, respectively. Scale bars: 50μm. The dashed-line in b indicates the border line of the rNTS. E) The averaged TH-ir-Nos of OB in the 1w-Veh (gray square) and the 1w-Rot (black square) groups. **p < 0.01. F) The averaged TH-ir-Nos of rNTS (left) and iNTS (right) in the 1w-Veh (gray squares) and the 1w-Rot (black squares) groups. **p < 0.01. G) The area (%) with Nissl-stained particles in the coronal brain stem sections, including rNTS in the 1w-Veh (gray square) and the 1w-Rot (black square) groups. d, dorsal; m, medial; r, rostral; i, intermediate; OB, olfactory bulb; NTS, the nucleus of solitary tract.
Decreased avoidance behavior to an aversive odor in the 1w-Rot group
The avoidance behavior to an aversive odor was attenuated 1 week after the intranasal administration of rotenone (compare Fig. 4C and 4D). In the 1w-Veh group, the preference ratio to BA (0.35±0.03) was significantly (p < 0.01) lower, compared to that of the DW (0.51±0.02) before the vehicle administration (Fig. 4E left). One-week vehicle treatment did not alter the preference ratio to chemicals (BA: 0.32±0.04, DW: 0.56±0.02) (Fig. 4E right). When calculating the change (%) in the avoidance based on these results, there were no significant differences between before (gray hollow bar, 16.7±2.9%) and 1 week after the vehicle administration (gray filled bar, 23.9±3.5%) (Fig. 4G left). In the 1w-Rot group, although a similar and significant (p < 0.01) preference to DW and BA was observed before the rotenone administration (DW: 0.48±0.02, BA: 0.29±0.02) (Fig. 4F left), the 1-week rotenone administration significantly increased the preference to BA (DW: 0.51±0.03, BA: 0.52±0.04) (Fig. 4F right). These results showed a significant decrease (p < 0.01) in the change (%) in the avoidance in the 1w-Rot group (Fig. 4G right) between before (black hollow bar, 18.8±2.3%) and after (black filled bar, –1.7±4.1%) the rotenone administration.
Fig. 4
Olfactory avoidance tests before and after the intranasal rotenone/vehicle administration. A) The time course of the olfactory avoidance tests (arrows) and the intranasal administration (arrowheads). B) An infrared image of the plexiglass Y-maze apparatus. A filter paper with an odor (★) was placed outside the end wall of one short-arm. We used DW or BA as odor stimuli. C, D) The trajectories of a freely moving mouse for 4 min in the olfactory test using BA stimuli (★) before (C) and 1 week after (D) the rotenone treatment. E, F) The preference ratio before (open circles) and 1 week after (filled circles) the vehicle (E, gray) or the rotenone (F, black) treatment. **p < 0.01. G) The changes (%) in the avoidance before (hollow bars) and 1 week after (filled bars) the vehicle (gray) or the rotenone (black) treatment. **p < 0.01. DW, distilled water; BA, butyric acid.
Reduction of bitter taste sensitivity in the 1w-Rot group
Prior to the brief-access tests, the mice were trained for 5 days. At the end of the training period, there were no significant differences in the number of licks for DW between 10 trials (Fig. 5B). After the training period was terminated, we examined the short-term taste function in water-deprived mice (Fig. 5C, D). When the concentration of the QHCl solutions was increased, the number of licks was gradually decreased (Fig. 5C). The concentration-lick curve in the 1w-Veh group was similarly observed before (gray dotted curve) and 1 week after the vehicle treatment (gray solid curves). In contrast, there were significant (p < 0.01) differences in the number of licks with the 0.3, 0.5, and 1 mM, but not 3 mM, QHCl solutions between before (black open circles, 37±8, 9±2, and 7±2, respectively) and 1 week after the rotenone treatment (black filled circles, 83±4, 54±8, and 32±6, respectively) (Fig. 5D). The increase (%) in the licks with 0.3, 0.5, and 1 mM QHCl solutions were significantly (p < 0.01) higher in the rotenone group (black squares, 50±7%, 52±5%, and 26±6%, respectively), compared with that in the vehicle group (gray squares, 1±3%, 0.5±1%, and –2±1%, respectively) (Fig. 5E). In addition, the total number of licks for all of the trials at all of the concentrations of QHCl (0.01–3 mM QHCl) was significantly (p < 0.01) higher after the rotenone administration (black bar), compared with the other groups (Fig. 5F). No change was shown in the rhythm of the licks in the brief-access tests between before/after the rotenone treatment in each QHCl concentration (Fig. 5G). The results of the long-term taste function in another group of mice without water-deprivation is shown in Fig. 5H. In contrast to the brief-access test, the mice avoided the QHCl solutions with a lower concentration in the 2-bottle test. However, there were significant (p < 0.05) differences in the number of licks when using 0.01 and 0.03 mM QHCl solutions between before (black open circles, 0.31±0.02 and 0.11±0.01, respectively) and 1 week after the rotenone treatment (black filled circles, 0.38±0.03 and 0.21±0.03, respectively) (Fig. 5H).
Fig. 5
Taste preference tests before and after the intranasal rotenone/vehicle administration. A) The time course of the brief-access tests (down filled arrows), training before the tests (down open arrows), 2-bottle tests (up filled arrows) and the intranasal administration (arrowheads). B) The number of licks at 10 trials for DW on the last training day (–1 day). C, D) The relationship between the QHCl concentration and the number of licks in the brief-access tests before (open circles and dotted curve) and 1 week after (filled circles and solid curve) the vehicle (C, gray) or the rotenone (D, black) treatment. Pre and post DW indicate the DW sessions before and after taste sessions, respectively. **p < 0.01. E) The increase (%) in licks in the 1w-Veh (gray) and the 1w-Rot (black) groups. **p < 0.01. F) The total number of licks at all of the concentrations of the QHCl (0.01–3 mM QHCl) in all groups. **p < 0.01. G) The relationship between the QHCl concentration and the averaged inter-lick intervals (ILI) in the brief-access tests before (hollow bars) and 1 week after (filled bars) the rotenone treatment. Pre and post DW indicate the DW sessions before and after the QHCl sessions, respectively. H) The relationship between the QHCl concentration and the preference ratio in the 2-bottle tests before (black open circles and dotted curve) and 1 week after (black filled circles and solid curve) the rotenone treatment. *p < 0.05, **p < 0.01. DW, distilled water; ILI, inter-lick interval.
The effects of short- or long-term rotenone administration on locomotor function and the population of TH-ir-Nos in the SN/VTA
Regardless of the difference between the 1w-Veh (gray bars) and the 1w-Rot (black bars) groups, there were no significant differences in the falling-off latency (Fig. 6B) between the data obtained before (hollow bars, 301±4 s and 303±3 s, respectively) and 1 week after the intranasal administration (filled bars, 296±3 s and 289±4 s, respectively). While the falling-off latency in the mice administrated with a vehicle for 4 weeks (4w-Veh, gray bars) did not show any significant changes throughout the test period (Fig. 6C), the data for the 4w-Rot group (black bars) showed a significant (p < 0.05) decrease from the 3rd to the 5th week after starting the intranasal administration (black filled bars, 238±17 s, 220±15 s, and 221±17 s, respectively), compared to the data obtained before the intranasal administration (black hollow bar, 288±6 s). In contrast, the continuous administration of rotenone resulted in a significant (p < 0.01) decrease in body weight at the 3rd and the 4th week after starting the 4-week rotenone treatment, compared to the data obtained before the rotenone treatment (averaged % weight loss: 6.7±0.9% and 6.7±1.2%, respectively). However, no massive weight loss above 15% (Fig. 6D) was demonstrated. There was no significant correlation (R2 = 0.02) between the loss (%) of body weight and the reduction (%) of the falling-off latency (Fig. 6E) at the 4th week after starting the intranasal rotenone administration.
There was no apparent change in the CA neurons in the SN/VTA between the 1w-Veh and the 1w-Rot groups (Fig. 7A, B). There were no significant differences between the 1w-Veh and the 1w-Rot groups in the TH-ir-Nos of SN (Fig. 7C, 259±17 and 205±24, respectively) and VTA (Fig. 7D, 178±16 and 141±21, respectively). In contrast, the 4w-Rot group exhibited marked CA neuron loss in the SN/VTA (Fig. 7F), compared to the 4w-Veh group (Fig. 7E). There were significant (p < 0.01) differences between the 4w-Veh and the 4w-Rot groups in the TH-ir-Nos of SN (Fig. 7G, 252±19 and 62±8, respectively) and VTA (Fig. 7H , 167±11 and 41±3). In addition, there was a significant correlation (R2 = 0.73) between the reduction (%) of the TH-ir-Nos in the SN (Fig. 7I), but not in the VTA (Fig. 7J, R2 = 0.004), and the reduction (%) of the falling-off latency at the 5th week after starting the rotenone treatment.
Fig. 6
Locomotor function in the mice with either the 1-week or 4-week intranasal rotenone/vehicle administration. A) The time course of the rotarod tests (open arrows) and the intranasal administration (gray bars) for 1 week (1w) or 4 weeks (4w). Mice were trained with a fixed rod speed (24 rpm) for 5 days (up and down arrows) before the rotarod tests. B) The falling-off latency before (hollow bars) and 1 week after (filled bars) the vehicle (gray) and the rotenone (black) treatment. C) The falling-off latency before (hollow bars) and during the 5 weeks (filled bars) of the vehicle (gray) or the rotenone (black) treatment. *p < 0.05, **p < 0.01. D) The rate of changes in the body weight of the mice before (hollow bars) and during the 4 weeks (filled bars) of the vehicle (gray) or the rotenone (black) treatment. *p < 0.05, **p < 0.01. E) The relationship between the reduction (%) of the falling-off latency and the loss (%) of body weight at the 4th week of the rotenone treatment. The dotted line and R2 indicate the regression line and the correlation coefficient, respectively.
DISCUSSION
The 1w-Rot group simultaneously exhibited bitter taste as well as olfactory impairments, followed by the decreases in the NTS/OB TH-ir-Nos and the DI TH-ir fibers. In contrast, no changes in the serum zinc level, water intake or weight loss were observed in the 1W-Rot group. The 4w-Rot group, but not the 1w-Rot group, exhibited locomotor impairments and a marked reduction of TH-ir-Nos in the SN and VTA regions. These results suggested that the continuous intranasal administration of low-dose rotenone induced both the chemosensory/motor impairments and the toxicity in the CNS in an administration time-period dependent manner.
Rotenone toxicity caused by the intranasal administration
Unlike classical toxin-induced models (e.g., 2,4,5-trihydroxyphenethylamine (6-OHDA), 1-methyl-4 -phenyl-1,2,5,6-tetrahydropyridine (MPTP)), rotenone models show pathological features similar to those seen in human PD, including the α-synuclein accumulation that resembles Lewy bodies (LB), morphologically [39, 40]. The administration of a higher dose of rotenone (2.0–3.0 mg/kg, s.c. or i.p. for 4–6 weeks) triggers central and peripheral α-synuclein aggregation in rodents [16]. Moreover, the intranasal administration of low-dose (0.1 mg/kg for 9 weeks) rotenone has been reported to induce the aggregation of α-synuclein in OB, but not SN or striatum, with olfactory/motor impairment [41]. Interestingly, in this recent report, both the olfactory impairments and OB α-synuclein aggregation in this rotenone model were obtained for an additional 16 weeks after finishing the intranasal rotenone administration. In this study, the 1w-Rot group exhibited TH-ir-Nos loss in the OB and NTS without changes in the other neurons of the brain stem (Fig. 3G). In contrast, a significant attenuation of the TH-ir fibers was observed in the DI bitter taste areas of the 1w-Rot group (Fig. 2D-F) without apparent changes in the TH-ir fibers of the nigrostriatal pathway (Fig. 2B). These results suggest that a low-dose and/or short-term administration of rotenone may have selective toxicity for specific regions or cells associated with PD. Interestingly, a reduction in the number of TH-ir shaggy dendrites in the SN pars reticulata was observed by 2 weeks of intranasal administration of rotenone [23], as well as TH-ir-Nos loss in the SN by 4 weeks (Fig. 7). These results suggest that the rotenone toxicity progresses in an administration time-period dependent manner. Although there were no significant correlations between the weight loss and TH-ir-Nos loss in the SN (Supplementary Figure 1), the weight loss may be associated with SN dysfunction [42]. Considering the progression of low-dose rotenone toxicity in our model (1–5 weeks), the differential vulnerability to rotenone toxicity of the peripheral/central regions may cause the sequential pathological changes and the multiple impairments, before the α-synuclein aggregation/propagation. Future longitudinal studies employing the intranasal rotenone model will be necessary to verify the global effect of the toxicity on the central/peripheral systems, conducted along with whole-brain 3D imaging.
Fig. 7
Neurodegeneration in the SN/VTA in the mice with either the 1-week or 4-week rotenone/vehicle administration. A, B) The representative coronal images of TH expression in the SN and VTA of the 1w-Veh (A) and the 1w-Rot (B) groups. C, D) TH-ir-Nos of the SN (C) and VTA (D) in the 1w-Veh (gray squares) and the 1w-Rot (black squares) groups. E, F) The representative coronal images of TH expression in the SN and VTA of the 4w-Veh (E) and the 4w-Rot (F) groups. G, H) TH-ir-Nos of the SN (G) and VTA (H) in the 4w-Veh (gray squares) and 4w-Rot (black squares) groups. **p < 0.01. I, J) The correlation between the reduction (%) of the TH-ir-Nos in the SN (I) or VTA (J) and the reduction (%) of the falling-off latency at the 5th week in the 4w-Rot group. D, dorsal; M, medial; SN, substantia nigra; VTA, ventral tegmental area; R2, correlation coefficient.
Presumed peripheral or central mechanisms of taste impairments in the 1w-Rot group
Taste impairments in the 1w-Rot group may occur depending on some other factors affecting the sense of taste. However, in our results, the rotenone treatment did not alter the salivary secretion, serum zinc level, water intake or weight loss, but it did alter the QHCl intake (the number of licking incidents). Olfaction can be partly involved in taste function. However, the bulbectomy mice, in which the OB was surgically disconnected from the brain, did not exhibit the blunted concentration-lick relationship for aversive taste such as QHCl [43]. The concept that mammals lick at a constant rate under a variety of conditions has been accepted [26]. It is also considered that the total number of licks reflects taste preferences more than the ILI [44]. In this study, after the rotenone administration, the total number of licks, but not the ILI, was significantly increased in the 1w-Rot group (Fig. 5), although the 1w-Rot group could detect the 3 mM QHCl solution. Taking into account a slight avoidance of low concentration of QHCl in the 2-bottle tests (Fig. 5H), the oropharyngeal gustatory effect, rather than the non-gustatory or postingestive effect, might be involved in the occurrence of PD-related taste impairments. In addition, since the dysregulated expression of human taste 2 receptors (T2Rs: bitter taste receptors) has been shown in the prefrontal cortex, but not in the peripheral tissues, of PD patients [45], the involvement of the central gustatory system in the PD-related taste (e.g., bitter) impairment is suggested.
With an intranasal administration of lidocaine, all orofacial structures, including the tongue, received the high concentration of lidocaine [20] through the trigeminal nerve pathway [19, 46]. Therefore, intranasal rotenone can directly affect oral tissues. One interesting study reported that taste nerve (glossopharyngeal nerve) response to 0.1 mM QHCl solution applied to the frog tongue was almost diminished by the perfusion of 0.3 mM rotenone via the lingual artery [47]. The half-lives of rotenone for excretion following intravenous and oral administration were 14 h and 18 h, respectively, in rats [21]. Despite the differences in the species, the rapid and short action of rotenone on the peripheral gustatory system must have been mostly eliminated during the recovery period (a 1-week period after the rotenone termination) in the 1w-Rot group. Further study is required to examine the morphological changes and the electrophysiological changes in the taste cells/nerves of the 1w-Rot group.
In contrast, the brain, especially the OB and the lower brain stem, had a higher concentration of chemicals following intranasal administration, compared with intravenous administration [20]. Braak and his colleagues presented a dual-hit hypothesis in which the human PD pathological hallmark (LB) within the CNS, appeared first in the OB or in the lower brainstem nuclei, and then spread progressively through the SN, eventually leading to motor deficits [48, 49]. It is well known that rNTS and caudal NTS (cNTS) receive gustatory and visceral inputs, respectively [35]. Davis and Jang identified the existence of CA neurons in hamster rNTS, and hypothesized that those neural networks are involved in food rejection and gustatory-visceromotor integration [50, 51]. In addition, CA neurons in the rNTS and iNTS, which are located in the border region between the rNTS and the cNTS, receive direct synaptic inputs with half of the ascending fibers from the mouse T2R5-expressing cells that receive bitter taste [52]. Although there were only a few CA neurons in the rNTS of the mice, but not the iNTS, the bitter taste impairments in the 1w-Rot group may be partly induced by the TH-ir-Nos loss of the second-order gustatory system. Since the aggregation of α-synuclein (LB) was not observed in the human NTS, even in the late-stage of PD [53], our results shed some light on the importance of conducting future investigations to clarify the involvement of CA neurons in the NTS for PD-related taste impairment.
The attenuation of the TH-ir fibers in the DI bitter taste area, as shown in this study, also might be involved in the taste impairments seen in the 1w-Rot group. This hypothesis is supported by the in vivo data obtained from transgenic mice with Alzheimer’s disease [54]. In this model, the amyloid-β induced depletion of the TH-ir fibers in the IC induced an impairment of the gustatory recognition memory following the alteration of the synaptic plasticity of the IC. This result was corroborated by the experiments using the microinjection of 6-OHDA into the IC, which reduced the existence of axon terminals. In our previous study, the 1w-Rot group also showed impaired conditioned taste aversion memory to bitter taste and simultaneously the alteration of the synaptic plasticity of layer V pyramidal neurons in the IC [24]. Although these studies provided the controversial results in the synaptic plasticity of the IC for the differences between the experimental conditions (e.g., stimulating/recording sites, recording methods, and in vitro/vivo), the change of the synaptic plasticity by TH-ir fiber loss of the IC probably caused the impaired taste memory. This may have at least partially impacted the bitter taste sensitivity in the 1w-Rot group, because the button rich projection fibers, principally from the ipsilateral VTA/SN [55], were distributed to almost all of the IC area.
The role of the intranasal rotenone model as the prodromal PD model
Considering the need to develop early diagnostic methods for PD and new treatment methods for NMSs, our study has shown that rodent models with prodromal symptoms similar to those of human PD can respond to these development needs. While models employing 6-OHDA and MPTP could produce sufficiently accurate results in regard to the nigrostriatal pathway-related motor symptoms, these models cannot respond sufficiently regarding the prodromal symptoms of human PD [56]. The rapid progress (i.e., days not years) of the degeneration of DA neurons associated with such toxins may induce difficulty in the assessment of the NMSs [57, 58]. In fact, the comprehensive alterations in the NMSs have not been noticed in any studies using MPTP-treated mice [2]. In contrast, rotenone exerted not only the neurodegenerative pathologies implicated in human PD, but also the developmental pathologies such as the inhibition of the axogenesis [59]. Therefore, chronic exposure of low-dose rotenone to rodents may allow for assessing the NMSs, and subsequently the motor deficits. Since it is thought that the oral and nasal pathway is a common environmental exposure route of pesticides [17], the continuous administration of rotenone through oral gavage or intranasal route in rodents may more accurately, but incompletely, replicate the etiology of human PD. However, orally administrated rotenone is slightly absorbed from the gastrointestinal tract, and metabolized in the liver by NADP-linked hepatic microsomal enzymes [60]. Due to the lower bioavailability of orally administrated rotenone, higher doses (5–40 mg/kg) of rotenone are required to produce PD symptoms (e.g., motor deficits) in mice, and may cause acute toxicity [21]. Despite the fact that nasal route may be more effective for the delivery of rotenone to the CNS, only a few research groups have published reports on the intranasal rotenone model [22–24, 41, 61, 62]. Taking advantage of the slowly evolving nature of this method, the intranasal administration constantly produced a viable rotenone model of PD in male C57BL/6J mice, as shown in female BALB/c [22]. A subsequent study evaluating a human epidemiological cohort study [13] revealed that rotenone usage was associated with a significant increase in the risk of PD in men, but not in women [63]. This male model may be a key to elucidate the critical mechanisms of PD pathogenesis, because other male strains (Swiss albino [28] and B6C2F1 [64]) showed a lower sensitivity for rotenone, compared with the female. However, it remains unclear whether C57BL/6J mice show the sex differences in rotenone sensitivity, a limitation that we expect will be clarified in future studies.
In addition, our chemical preparation (e.g., the use of DMSO for a stock solution and dilution by DW at the time of use) and administration methods (e.g., using a peristaltic pump under dose-controlled light anesthesia by 3% isoflurane) may contribute to the refinement of the model production (e.g., obtaining zero mortality and without any acute toxicity). Taken together, the intranasal rotenone model may be quite useful for clarifying the pathophysiology of PD in the prodromal stage. NMSs associated with PD are not only the impaired olfactory/taste function seen in patients. Future studies may clarify whether the 1w-Rot group will exhibit other NMSs, such as hedonic olfactory/taste impairments, gastrointestinal impairments, or any rapid eye movement (REM) sleep behavior disorder.
The limitations of this intranasal rotenone model as a progressive PD model
As suggested by a case control human study [65], environmental rotenone may be absorbed through nasal, but not dermal routes. The validity of the absorption of rotenone via nasal routes may be supported by the intranasal rotenone model, but this model only mimics one aspect of the environmental exposure of rotenone. The environmental-contact administration of rotenone to male C57BL/6J mice reproduced many key aspects of PD progression in some brain areas [66]. In contrast, rotenone neurotoxicity during continuous administration may not stay in the nigrostriatal DA pathway, but non-specifically extend to other brain areas [67]. It remains unclear whether the 4w-Rot group we employed exhibited progressive/specific neurodegeneration in the brain. Further studies will be necessary to verify the PD-like pathology in this type of intranasal rotenone model.
Conclusions
This was the first study to show taste impairments in a PD rodent model. The short-term intranasal administration employed rotenone, which caused chemosensory impairments without locomotor impairments in male mice. Subsequent neurodegeneration was observed in the first CNS and the DI bitter taste areas for these information relays. In contrast, long-term intranasal administration of rotenone induced locomotor impairments, and finally decreased TH-ir-Nos in the SN and VTA along with the body weight loss. These results suggest that this animal model using male C57BL/6J mice and employing short-term intranasal administration of rotenone will be useful for the elucidating the prodromal stage of PD pathophysiology. Furthermore, it can be expected that the use of this model will contribute to the clarification of the complicated PD-related non-motor symptoms, as well as the connections between the environmental and genetic risk factors of PD.
ACKNOWLEDGMENTS
This study was supported by the Japan Society for the Promotion of Science (20K09877 to H.S.) and by Miyata A. Research Foundation at Meikai University.
CONFLICT OF INTEREST
The authors hereby state that they have no conflicts of interest to report.
SUPPLEMENTARY MATERIAL
[1] The supplementary material is available in the electronic version of this article: https://dx.doi.org/10.3233/JPD-223273.
REFERENCES
[1] | Damier P , Hirsch EC , Agid Y , Graybiel AM ((1999) ) The substantia nigra of the human brain. II. Patterns of loss of dopamine-containing neurons in Parkinson’s disease. Brain 122: (Pt 8), 1437–1448. |
[2] | Schapira AHV , Chaudhuri KR , Jenner P ((2017) ) Non-motor features of Parkinson disease. Nat Rev Neurosci 18: , 435–450. |
[3] | Oppo V , Melis M , Melis M , Tomassini Barbarossa I , Cossu G ((2020) ) “Smelling and tasting” Parkinson’s disease: Using senses to improve the knowledge of the disease. Front Aging Neurosci 12: , 43. |
[4] | Landis BN , Burkhard PR ((2008) ) Phantosmias and Parkinson disease. Arch Neurol 65: , 1237–1239. |
[5] | Melis M , Haehner A , Mastinu M , Hummel T , Tomassini Barbarossa I ((2021) ) Molecular and genetic factors involved in olfactory and gustatory deficits and associations with microbiota in Parkinson’s disease. Int J Mol Sci 22: , 4286. |
[6] | Sienkiewicz-Jarosz H , Scinska A , Kuran W , Ryglewicz D , Rogowski A , Wrobel E , Korkosz A , Kukwa A , Kostowski W , Bienkowski P ((2005) ) Taste responses in patients with Parkinson’s disease. J Neurol Neurosurg Psychiatry 76: , 40–46. |
[7] | Doty RL , Nsoesie MT , Chung I , Osman A , Pawasarat I , Caulfield J , Hurtig H , Silas J , Dubroff J , Duda JE , Ying GS , Tekeli H , Leon-Sarmiento FE ((2015) ) Taste function in early stage treated and untreated Parkinson’s disease. J Neurol 262: , 547–557. |
[8] | Liu G , Zong G , Doty RL , Sun Q ((2016) ) Prevalence and risk factors of taste and smell impairment in a nationwide representative sample of the US population: A cross-sectional study. BMJ Open 6: , e013246. |
[9] | Cecchini MP , Osculati F , Ottaviani S , Boschi F , Fasano A , Tinazzi M ((2014) ) Taste performance in Parkinson’s disease. J Neural Transm (Vienna) 121: , 119–122. |
[10] | Moberg PJ , Balderston CC , Rick JH , Roalf DR , Weintraub D , Kleiner-Fisman G , Stern MB , Duda JE ((2007) ) Phenylthiocarbamide (PTC) perception in Parkinson disease. Cogn Behav Neurol 20: , 145–148. |
[11] | Cossu G , Melis M , Sarchioto M , Melis M , Melis M , Morelli M , Barbarossa T ((2018) ) 6-n-propylthiouracil taste disruption and TAS2R38 nontasting form in Parkinson’s disease. Mov Disord 33: , 1331–1339. |
[12] | Travers JB , Akey LR , Chen SC , Rosen S , Paulson G , Travers SP ((1993) ) Taste preferences in Parkinson’s disease patients. Chem Senses 18: , 47–55. |
[13] | Tanner CM , Kamel F , Ross GW , Hoppin JA , Goldman SM , Korell M , Marras C , Bhudhikanok GS , Kasten M , Chade AR , Comyns K , Richards MB , Meng C , Priestley B , Fernandez HH , Cambi F , Umbach DM , Blair A , Sandler DP , Langston JW ((2011) ) Rotenone, paraquat, and Parkinson’s disease. Environ HealthPerspect 119: , 866–872. |
[14] | Pouchieu C , Piel C , Carles C , Gruber A , Helmer C , Tual S , Marcotullio E , Lebailly P , Baldi I ((2018) ) Pesticide use in agriculture and Parkinson’s disease in the AGRICAN cohort study. Int J Epidemiol 47: , 299–310. |
[15] | Thirugnanam T , Santhakumar K ((2022) ) Chemically induced models of Parkinson’s disease. Comp Biochem Physiol C Toxicol Pharmacol 252: , 109213. |
[16] | Miyazaki I , Asanuma M ((2020) ) The rotenone models reproducing central and peripheral features of Parkinson’s disease. NeuroSci 1: , 1–14. |
[17] | Chen H , Ritz B ((2018) ) The search for environmental causes of Parkinson’s disease: Moving forward. J Parkinsons Dis 8: , S9–S17. |
[18] | Prediger RD , Aguiar AS Jr. , Matheus FC , Walz R , Antoury L , Raisman-Vozari R , Doty RL ((2012) ) Intranasal administration of neurotoxicants in animals: Support for the olfactory vector hypothesis of Parkinson’s disease. Neurotox Res 21: , 90–116. |
[19] | Thorne RG , Pronk GJ , Padmanabhan V , Frey WH 2nd ((2004) ) Delivery of insulin-like growth factor-I to the rat brain and spinal cord along olfactory and trigeminal pathways following intranasal administration. Neuroscience 127: , 481–496. |
[20] | Johnson NJ , Hanson LR , Frey WH ((2010) ) Trigeminal pathways deliver a low molecular weight drug from the nose to the brain and orofacial structures. Mol Pharm 7: , 884–893. |
[21] | Innos J , Hickey MA ((2021) ) Using rotenone to model Parkinson’s disease in mice: A review of the role of pharmacokinetics. Chem Res Toxicol 34: , 1223–1239. |
[22] | Sasajima H , Miyazono S , Noguchi T , Kashiwayanagi M ((2015) ) Intranasal administration of rotenone in mice attenuated olfactory functions through the lesion of dopaminergic neurons in the olfactory bulb. Neurotoxicology 51: , 106–115. |
[23] | Sasajima H , Miyazono S , Noguchi T , Kashiwayanagi M ((2017) ) Intranasal administration of rotenone to mice induces dopaminergic neurite degeneration of dopaminergic neurons in the substantia nigra. Biol Pharm Bull 40: , 108–112. |
[24] | Toyoda H , Katagiri A , Kato T , Sato H ((2020) ) Intranasal administration of rotenone reduces GABAergic inhibition in the mouse insular cortex leading to impairment of LTD and conditioned taste aversion memory. Int J Mol Sci 22: , 259. |
[25] | Poudel S , Lee Y ((2018) ) Impaired taste associative memory and memory enhancement by feeding Omija in Parkinson’s disease fly model. Mol Cells 41: , 646–652. |
[26] | Murakami H ((1977) ) Rhythmometry on licking rate of the mouse. Physiol Behav 19: , 735–738. |
[27] | Becker JB , Koob GF ((2016) ) Sex differences in animal models: Focus on addiction. Pharmacol Rev 68: , 242–263. |
[28] | Mitra S , Chakrabarti N , Dutta SS , Ray S , Bhattacharya P , Sinha P , Bhattacharyya A ((2015) ) Gender-specific brain regional variation of neurons, endogenous estrogen, neuroinflammation and glial cells during rotenone-induced mouse model of Parkinson’s disease. Neuroscience 292: , 46–70. |
[29] | Satoh K , Narita T , Matsuki-Fukushima M , Okabayashi K , Ito T , Senpuku H , Sugiya H ((2013) ) E2f1-deficient NOD/SCID mice have dry mouth dueto a change of acinar/duct structure and the down-regulation of AQP5in the salivary gland. Pflugers Arch 465: , 271–281. |
[30] | Kawano A , Honma S , Inui-Yamamoto C , Ito A , Niwa H , Wakisaka S ((2017) ) c-Fos expression in the parabrachial nucleus following intraoral bitter stimulation in the rat with dietary-induced zinc deficiency. Brain Res 1659: , 1–7. |
[31] | Utsugi C , Miyazono S , Osada K , Sasajima H , Noguchi T , Matsuda M , Kashiwayanagi M ((2014) ) Hard-diet feeding recovers neurogenesis in the subventricular zone and olfactory functions of mice impaired by soft-diet feeding. PLoS One 9: , e97309. |
[32] | Nomura K , Nakanishi M , Ishidate F , Iwata K , Taruno A ((2020) ) All-electrical Ca(2+)-independent signal transduction mediates attractive sodium taste in taste buds. Neuron 106: , 816–829 e816. |
[33] | Tordoff MG , Bachmanov AA ((2002) ) Influence of test duration on the sensitivity of the two-bottle choice test. Chem Senses 27: , 759–768. |
[34] | Kanno K , Kokubo H , Takahashi A , Koide T , Ishiura S ((2014) ) Enhanced prepulse inhibition and low sensitivity to a dopamine agonist in HESR1 knockout mice. J Neurosci Res 92: , 287–297. |
[35] | Cutsforth-Gregory JK , Benarroch EE ((2017) ) Nucleus of the solitary tract, medullary reflexes, and clinical implications. Neurology 88: , 1187–1196. |
[36] | Miyazaki I , Isooka N , Wada K , Kikuoka R , Kitamura Y , Asanuma M ((2019) ) Effects of enteric environmental modification by coffee components on neurodegeneration in rotenone-treated mice. Cells 8: , 221. |
[37] | Stratford JM , Thompson JA , Finger TE ((2017) ) Immunocytochemical organization and sour taste activation in the rostral nucleus of the solitary tract of mice. J Comp Neurol 525: , 271–290. |
[38] | Peng Y , Gillis-Smith S , Jin H , Trankner D , Ryba NJ , Zuker CS ((2015) ) Sweet and bitter taste in the brain of awake behaving animals. Nature 527: , 512–515. |
[39] | Jagmag SA , Tripathi N , Shukla SD , Maiti S , Khurana S ((2015) ) Evaluation of models of Parkinson’s disease. Front Neurosci 9: , 503. |
[40] | De Miranda BR , Rocha EM , Bai Q , El Ayadi A , Hinkle D , Burton EA , Timothy Greenamyre J ((2018) ) Astrocyte-specific DJ-1 overexpression protects against rotenone-induced neurotoxicity in a rat model of Parkinson’s disease. Neurobiol Dis 115: , 101–114. |
[41] | Sharma M , Kaur J , Rakshe S , Sharma N , Khunt D , Khairnar A ((2022) ) Intranasal exposure to low-dose rotenone induced alpha-synuclein accumulation and Parkinson’s like symptoms without loss of dopaminergic neurons. Neurotox Res 40: , 215–229. |
[42] | Faivre F , Sanchez-Catalan MJ , Dovero S , Bido S , Joshi A , Bezard E , Barrot M ((2020) ) Ablation of the tail of the ventral tegmental areacompensates symptoms in an experimental model of Parkinson’sdisease. Neurobiol Dis 139: , 104818. |
[43] | Inui-Yamamoto C , Blonde GD , Schmid F , Mariotti L , Campora M , Inui T , Schier LA , Spector AC ((2020) ) Neural isolation of the olfactory bulbs severely impairs taste-guided behavior to normally preferred, but not avoided, stimuli. eNeuro 7: , ENEURO.0026-20.2020. |
[44] | St John SJ , Lu L , Williams RW , Saputra J , Boughter JD Jr ((2017) ) Genetic control of oromotor phenotypes: A survey of licking and ingestive behaviors in highly diverse strains of mice. Physiol Behav 177: , 34–43. |
[45] | Garcia-Esparcia P , Schluter A , Carmona M , Moreno J , Ansoleaga B , Torrejon-Escribano B , Gustincich S , Pujol A , Ferrer I ((2013) ) Functional genomics reveals dysregulation of cortical olfactory receptors in Parkinson disease: Novel putative chemoreceptors in the human brain. J Neuropathol Exp Neurol 72: , 524–539. |
[46] | Lochhead JJ , Wolak DJ , Pizzo ME , Thorne RG ((2015) ) Rapid transport within cerebral perivascular spaces underlies widespread tracer distribution in the brain after intranasal administration. J Cereb Blood Flow Metab 35: , 371–381. |
[47] | Nagahama S , Kurihara K ((1984) ) Effects of respiratory inhibitors and ionophore A23187 on frog gustatory nerve responses. Comp Biochem Physiol A Comp Physiol 79: , 431–435. |
[48] | Braak H , Del Tredici K , Bratzke H , Hamm-Clement J , Sandmann-Keil D , Rub U ((2002) ) Staging of the intracerebral inclusion body pathology associated with idiopathic Parkinson’s disease (preclinical and clinical stages). J Neurol 249: (Suppl 3), III/1–5. |
[49] | Hawkes CH , Del Tredici K , Braak H ((2007) ) Parkinson’s disease: A dual-hit hypothesis. Neuropathol Appl Neurobiol 33: , 599–614. |
[50] | Davis BJ , Jang T ((1988) ) Tyrosine hydroxylase-like and dopamine beta-hydroxylase-like immunoreactivity in the gustatory zone of the nucleus of the solitary tract in the hamster: Light- and electron-microscopic studies. Neuroscience 27: , 949–964. |
[51] | Davis BJ ((1998) ) Synaptic relationships between the chorda tympani and tyrosine hydroxylase-immunoreactive dendritic processes in the gustatory zone of the nucleus of the solitary tract in the hamster. J Comp Neurol 392: , 78–91. |
[52] | Sugita M , Yamamoto K , Hirono C , Shiba Y ((2013) ) Information processing in brainstem bitter taste-relaying neurons defined by genetic tracing. Neuroscience 250: , 166–180. |
[53] | Braak H , Del Tredici K , Rub U , de Vos RA , Jansen Steur EN , Braak E ((2003) ) Staging of brain pathology related to sporadic Parkinson’sdisease. Neurobiol Aging 24: , 197–211. |
[54] | Moreno-Castilla P , Rodriguez-Duran LF , Guzman-Ramos K , Barcenas-Femat A , Escobar ML , Bermudez-Rattoni F ((2016) ) Dopaminergic neurotransmission dysfunction induced by amyloid-beta transforms cortical long-term potentiation into long-term depression and produces memory impairment. Neurobiol Aging 41: , 187–199. |
[55] | Ohara PT , Granato A , Moallem TM , Wang BR , Tillet Y , Jasmin L ((2003) ) Dopaminergic input to GABAergic neurons in the rostral agranular insular cortex of the rat. J Neurocytol 32: , 131–141. |
[56] | Cerri S , Blandini F ((2020) ) In vivo modeling of prodromal stage of Parkinson’s disease. J Neurosci Methods 342: , 108801. |
[57] | Blesa J , Trigo-Damas I , Quiroga-Varela A , del Rey NL-G ((2016) ) Animal models of Parkinson’s disease In Challenges in Parkinson’s Disease, Dorszewska J, Kozubski W, eds. IntechOpen. https://doi.org/10.5772/63328 |
[58] | Han NR , Kim YK , Ahn S , Hwang TY , Lee H , Park HJ ((2020) ) A comprehensive phenotype of non-motor impairments and distribution of alpha-synuclein deposition in parkinsonism induced mice by a combination injection of MPTP and probenecid. Front Aging Neurosci 12: , 599045 |
[59] | Bisbal M , Sanchez M ((2019) ) Neurotoxicity of the pesticide rotenone on neuronal polarization: A mechanistic approach. Neural Regen Res 14: , 762–766. |
[60] | Bove J , Prou D , Perier C , Przedborski S ((2005) ) Toxin-induced models of Parkinson’s disease. NeuroRx 2: , 484–494. |
[61] | Rojo AI , Cavada C , de Sagarra MR , Cuadrado A ((2007) ) Chronic inhalation of rotenone or paraquat does not induce Parkinson’s disease symptoms in mice or rats. Exp Neurol 208: , 120–126. |
[62] | Voronkov DN , Kutukova KA , Ivanov MV , Khudoerkov RM ((2017) ) Immunomorphological changes in the olfactory bulbs of rats after intranasal administration of rotenone. Bull Exp Biol Med 164: , 203–206. |
[63] | Goldman SM , Tanner CM ((2019) ) Rotenone and Parkinson’s disease: Reduced sensitivity in females. Toxicol Sci 170: , 562–563. |
[64] | Abdo KM , Eustis SL , Haseman J , Huff JE , Peters A , Persing R ((1988) ) Toxicity and carcinogenicity of rotenone given in the feed to F344/N rats and B6C3F1 mice for up to two years. Drug Chem Toxicol 11: , 225–235. |
[65] | Furlong M , Tanner CM , Goldman SM , Bhudhikanok GS , Blair A , Chade A , Comyns K , Hoppin JA , Kasten M , Korell M , Langston JW , Marras C , Meng C , Richards M , Ross GW , Umbach DM , Sandler DP , Kamel F ((2015) ) Protective glove use and hygiene habits modify theassociations of specific pesticides with Parkinson’s disease. Environ Int 75: , 144–150. |
[66] | Liu Y , Sun JD , Song LK , Li J , Chu SF , Yuan YH , Chen NH ((2015) ) Environment-contact administration of rotenone: A new rodent model of Parkinson’s disease. Behav Brain Res 294: , 149–161. |
[67] | Wen S , Aki T , Unuma K , Uemura K ((2020) ) Chemically induced models of Parkinson’s disease: History and perspectives for the involvement of ferroptosis. Front Cell Neurosci 14: , 581191. |


