
PTEN-Induced Putative Kinase 1 Dysfunction Accelerates Synucleinopathy
Abstract
Background:
Mutations in PTEN-induced putative kinase 1 (PINK1) cause autosomal recessive Parkinson’s disease (PD) and contribute to the risk of sporadic PD. However, the relationship between PD-related PINK1 mutations and alpha-synuclein (α-syn) aggregation—a main pathological component of PD—remains unexplored.
Objective:
To investigate whether α-syn pathology is exacerbated in the absence of PINK1 after α-syn preformed fibril (PFF) injection in a PD mouse model and its effects on neurodegeneration.
Methods:
In this study, 10-week-old Pink1 knockout (KO) and wildtype (WT) mice received stereotaxic unilateral striatal injection of recombinant mouse α-syn PFF. Then, α-syn pathology progression, inflammatory responses, and neurodegeneration were analyzed via immunohistochemistry, western blot analysis, and behavioral testing.
Results:
After PFF injection, the total α-syn levels significantly increased, and pathological α-syn was markedly aggregated in Pink1 KO mice compared with Pink1 WT mice. Then, earlier and more severe neuronal loss and motor deficits occurred. Moreover, compared with WT mice, Pink1 KO mice had evident microglial/astrocytic immunoreactivity and prolonged astrocytic activation, and a higher rate of protein phosphatase 2A phosphorylation, which might explain the greater α-syn aggravation and neuronal death.
Conclusion:
The loss of Pink1 function accelerated α-syn aggregation, accumulation and glial activation, thereby leading to early and significant neurodegeneration and behavioral impairment in the PD mouse model. Therefore, our findings support the notion that PINK1 dysfunction increases the risk of synucleinopathy.
INTRODUCTION
Parkinson’s disease (PD) is characterized by aberrant alpha-synuclein (α-syn) neuronal aggregates, known as Lewy bodies/neurites, and the progressive loss of midbrain dopaminergic neurons [1]. Several mechanisms have been involved in PD pathogenesis, which include mitochondrial dysfunction, abnormal protein degradation pathways, and neuroinflammation [2, 3]. However, the interaction between these pathways is not completely understood [3].
PTEN-induced putative kinase 1 (PINK1) is a serine/threonine kinase that plays a crucial role in mitochondrial quality control via the autophagic degradation of misfolded proteins and regulation of mitophagy and mitochondrial antigen presentation [4, 5]. Loss-of-function mutations in the PINK1 gene were associated with familial and sporadic early-onset PD [6–9]. Patients with PINK1-related PD have an early mean age at onset of disease (32 years old) and present with slow disease progression and good levodopa responsiveness for the most common motor symptoms (bradykinesia, resting tremors, and rigidity) [10–13] and psychotic/psychiatric symptoms [13–16]. Pathological findings have rarely been evaluated. However, autopsies of three patents with PINK1-linked PD have revealed the presence of Lewy body pathology in the substantia nigra, amygdala, cortex, and brainstem as well as nigral cell loss [17–19]. Meanwhile, one case reported the absence of Lewy-related pathology [20].
Animal models with depleted Pink1 expression have reportedly failed to induce significant nigral dopaminergic neuron loss and definite α-syn pathology [21–23] and Parkinsonian motor symptoms [24, 25]. Fibrils generated from recombinant α-syn (α-syn preformed fibril [α-syn PFF]) can cause misfolding of endogenous α-syn to form inclusions that closely resemble those found in PD brains. This allows researchers to model inclusion formation and assess associated impact on neuronal function and targets that could prevent aggregation. Hence, making the best use of this model, the present study aimed to investigate whether α-syn pathology is altered by the absence of PINK1 in an α-syn PFF-injected mouse model, and its effects on neuronal degeneration and motor function.
MATERIALS AND METHODS
Animals
C57BL/6N mice (Pink1+/+, Pink1 wild-type [WT]) and Pink1 knockout (Pink1–/–, Pink1 KO) mice were obtained, as previously described [26]. All experiments were approved by the animal research committee of Hallym University Sacred Heart Hospital (HMC2019-1-1130-42). Mice with same genetic background were mated and their 10-week-old offspring were used. Six mice were used according to each genotype and the time of sacrifice (Fig. 1).
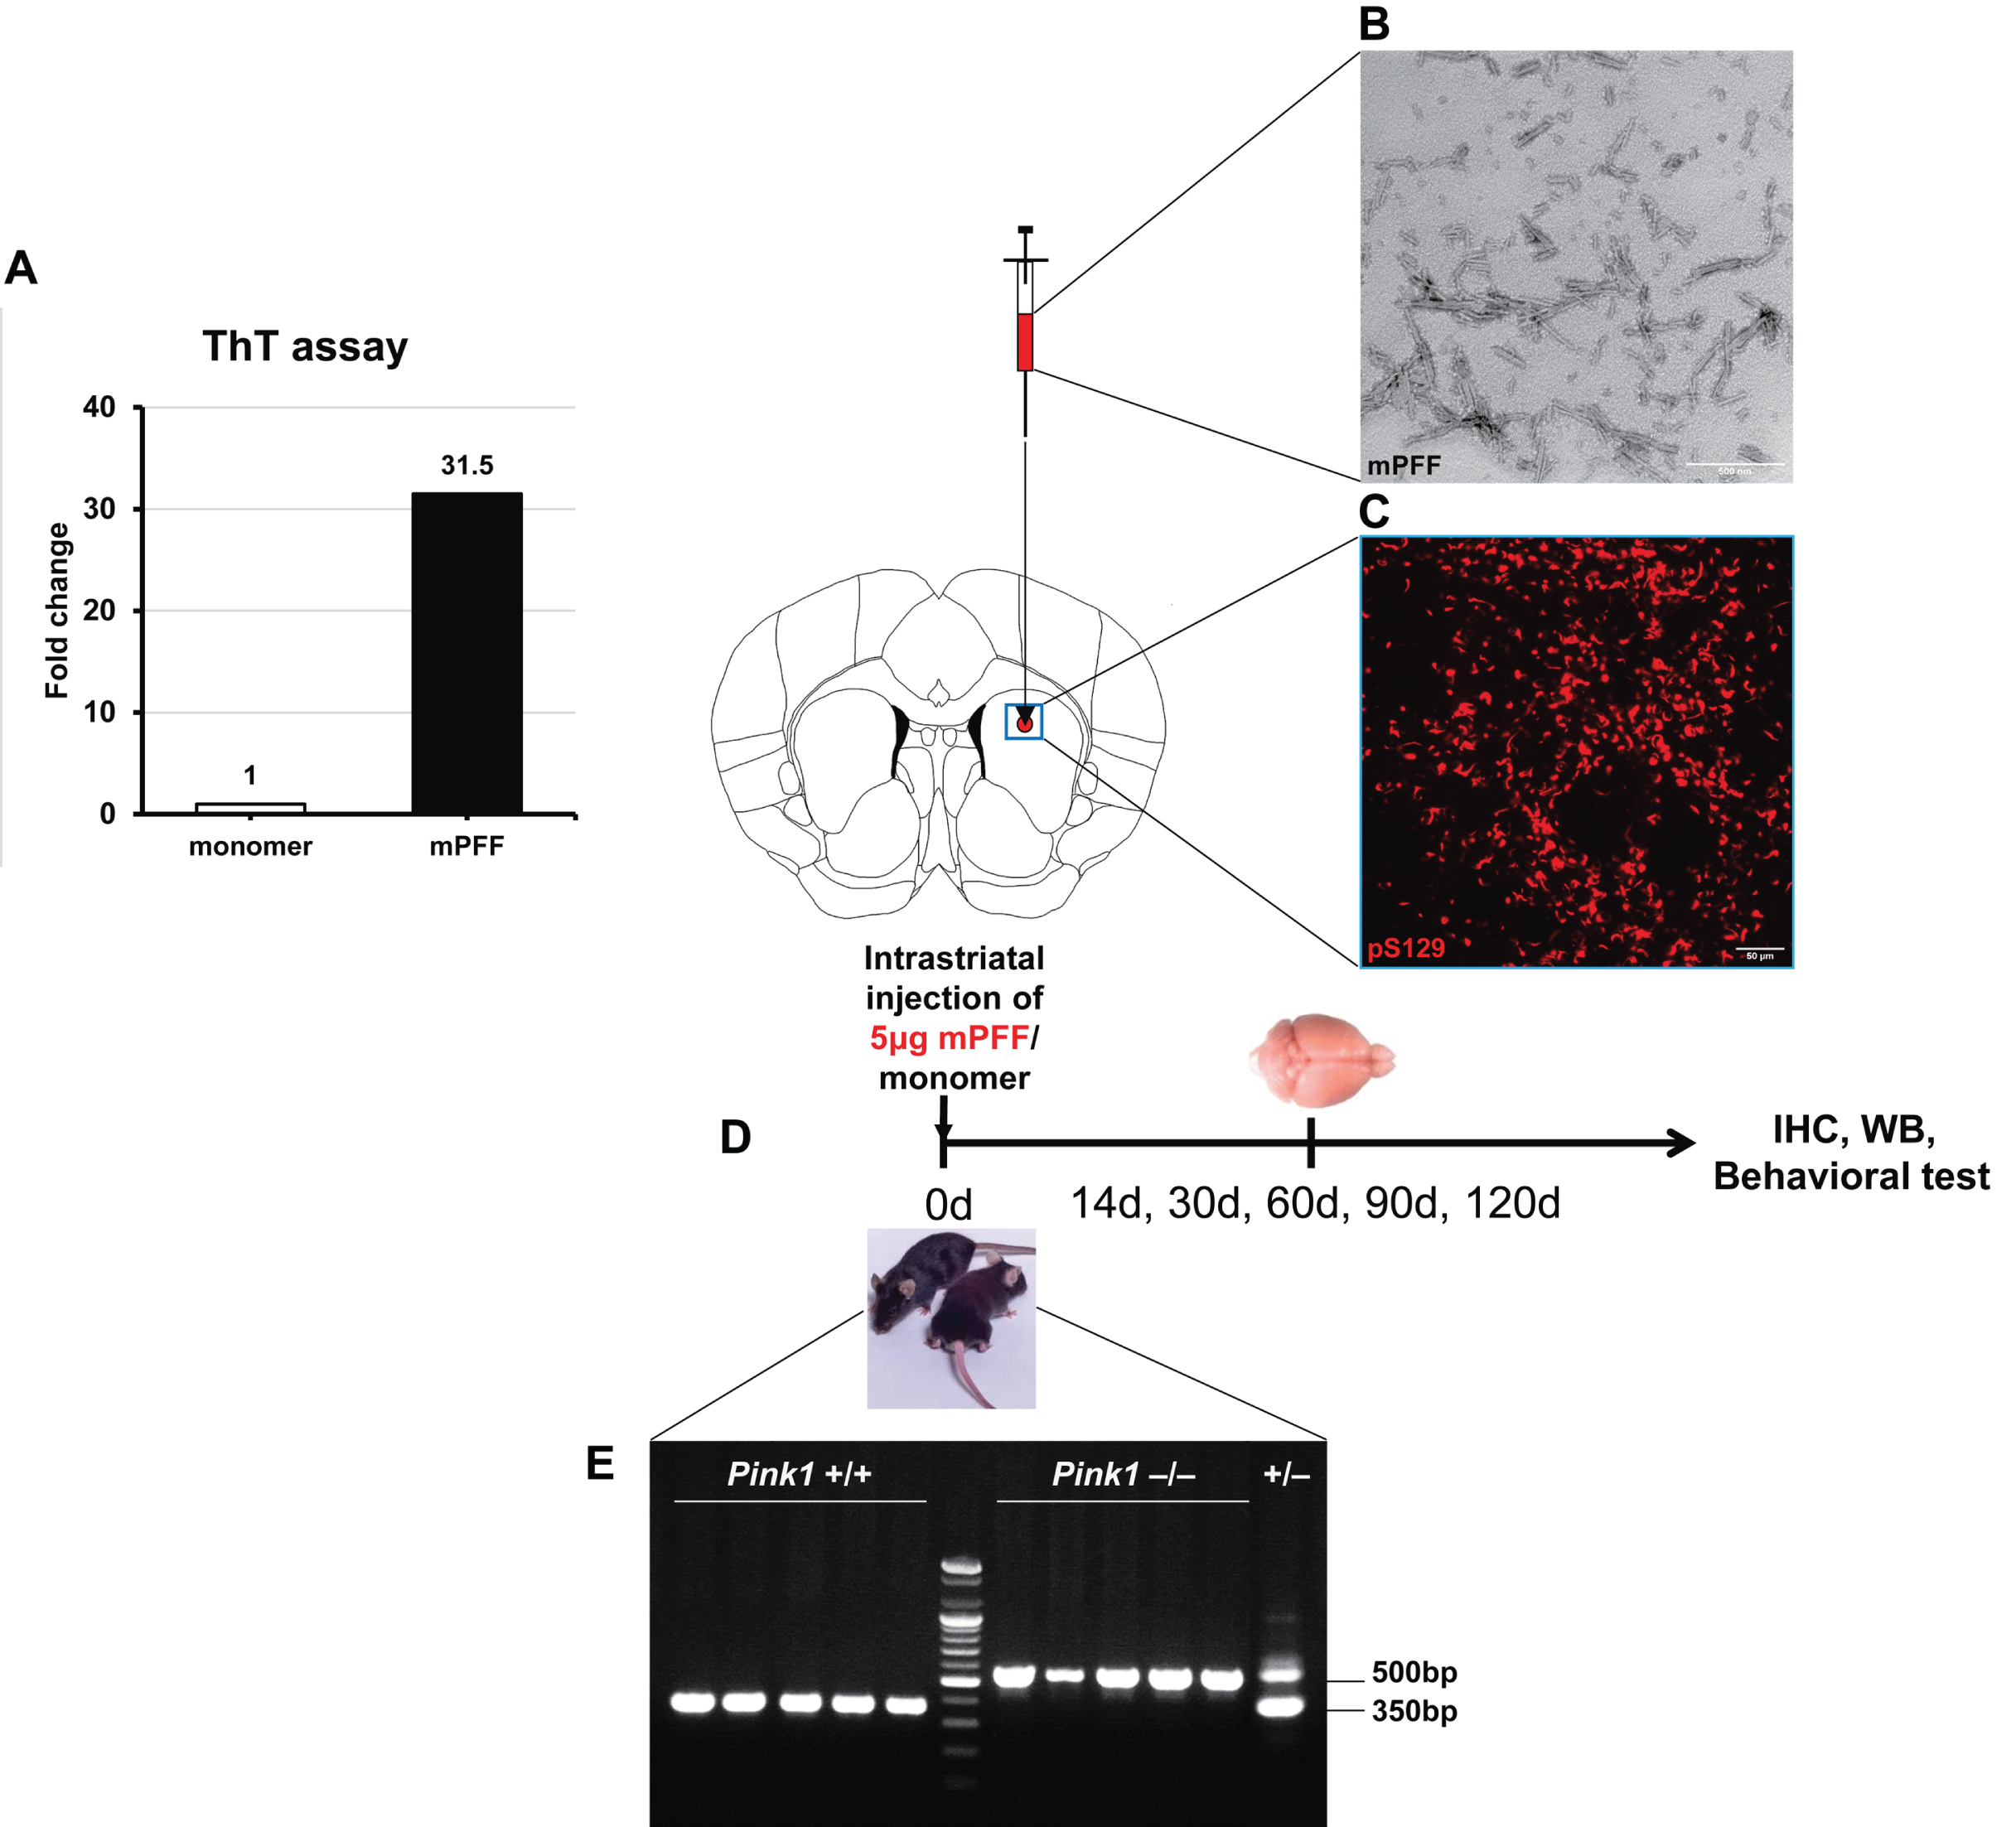
Fig. 1
Experimental design. Thioflavin T (ThT) assay was conducted to examine formation of amyloid-like β-sheet structures from PFF preparation (A). Mouse PFF (mouse α-syn preformed fibril) after sonication, validated by transmission electron microscopy, injected to mouse striatum (B). Scale bar = 500μm. Robust pS129-α-syn positive aggregates at the injected site 90 days after PFF injection of Pink1 KO mice (C). Scale bar = 50μm. Both WT and Pink1 KO animals were unilaterally injected of 5μg of PFF or α-syn monomer as a control at 10 weeks of age and sacrificed at 14, 30, 60, 90, 120 days following injection, and immunohistochemistry (IHC), western blotting (WB), and behavioral tests were done for analysis (D). Genotyping PCR results (E). pS129, antibody detected phosphorylated at serine 129 α-syn; d, day; mPFF, mouse α-syn preformed fibril; Pink1+/+, wild type (WT); Pink1–/–, Pink1 knockout (KO);+/–, Pink1+/–.
For genotyping, DNA genome was isolated from mouse tail biopsies using phenol/chloroform extraction methods. Briefly, 5 mm of tail was removed and lysed in 0.25 mL of DNA digestion buffer containing 50 mM Tris-HCl pH 8.0, 100 mM EDTA pH 8.0, 100 mM NaCl, 1% SDS and 0.5 mg/mL proteinase K at 55°C, 250 rpm (Thermo Shaker) overnight. Supernatants were collected by centrifuged at 10000 rpm (Centrifuge 5430 R with Eppendorf Rotor FA-45-30-11) for 10 min at 20°C, then neutralized with 0.35 mL of phenol/chloroform/iso-amyl alcohol (25 : 24 : 1) for 10 min at room temperature (RT). The mixtures were centrifuged at 10000 rpm for 10 min at 20°C and 0.1 mL of the upper phase obtaining DNA were transfer to new Eppendorf tube. To concentrate DNA samples, 0.2 mL of 100% ethanol was added, and incubated for 1 min at RT. DNA pellets were observed after centrifugation at 10000 rpm for 10 min at 4°C and further washed in 1 mL of 70% ice-cold ethanol. Final DNA pellets were harvested by centrifugation, dried out by air at RT for 5 min and resuspended in 50μL of PCR water for 15 min at RT.
The PCR reaction was performed using Thermo cycler (Applied Biosystems), with the following PCR conditions: 95°C for 10 min as the first step; 40 cycles of 95°C for 20 s, 58°C for 30 s, 72°C for 1 min as the second step followed by 72°C for 5 min. Primer sequences were used as follows: forwards, wild-type (WT), 5’-GCTCTGGCTTCTGAGGAAGA-3’ and knockout (KO), 5’-CTAAAGCGCATGCTCCAGAC-3’; reverse (common), 5’-GAGCCTGAAGTGCAAACTCC-3’. PCR product sizes for WT and KO were approximately 350 bp and 500 bp, respectively. Two bands of 350 bp- and 500 bp-PCR products exhibiting heterozygous background (Pink1+/–) as a control cohort (Fig. 1E).
Preparation of recombinant α-syn monomer and PFF
Mouse recombinant full-length α-syn protein and α-syn PFF were prepared according to protocols in our previous publication [27]. Briefly, expression of recombinant mouse α-syn was performed under the induction of IPTG inducer. A single colony of recombinant E. coli BL21 (DE3) containing pD434-SR vector system (Addgene, plasmid #89073, https://www.addgene.org/89073) was inoculated into 50 mL in LB medium supplemented 100μg/mL ampicillin for approximately 16–18 h. The pre-culture was added to a new 2 L of LB medium supplemented 100μg/μL ampicillin and cultivated then induced by IPTG when reaching OD600 of 0.3–0.6 and incubated for 5 h. The cells were harvested by centrifugation at 3000 rpm for 15 min at 4°C. The pellet then was resuspended in deionized water containing saturated MgCl2. Cells were lysed by heating treatment at 98°C for 30 min. Cell lysates were collected by centrifugation at 13000 rpm for 20 min. Protein samples were dialyzed in 20 mM Tris-HCl pH 8.0 before purification. The purification was performed using HiTrap Q HP anion-exchange column (GE Health Care Life Science, UK) with a running buffer of 20 mM Tris-HCl pH 8.0 and protein was eluted in fractions containing 400 mM NaCl. The pure and enriched fractions of recombinant α-syn protein were determined by SDS-PAGE/Coomassie blue staining and dialyzed against deionized water then freeze-dried. α-syn monomer was dissolved in 20 mM Tris-HCl, 200 mM NaCl, pH 8.0 and stored at –80°C until usage.
α-syn PFF was prepared in 20 mM Tris-HCl, 200 mM NaCl from 5 mg/ml of α-syn monomer by a Thermo Shaker (800 rpm at 37°C) for 10 days. Thioflavin T assay was applied for quality control of PFF preparation that showed the 31.5-fold change in ThT fluorescent signal compared with monomer, revealed of amyloid-like β-sheet structures (Fig. 1A). Fibrils were aliquoted and frozen at –80°C until usage. To effectively induce pathological α-syn forms (Fig. 1C), PFF was sonicated at 37°C for 10 min in an ultrasonic water bath before injection then imaged by transmission electron microscopy (TEM) (Fig. 1B).
Stereotaxic surgery
WT and Pink1 KO animals (10 weeks old) received unilateral intracranial injection of 5μg of PFF or monomeric α-syn in the right striatum using a stereotaxic apparatus, as described previously [27]. The coordination corresponding approximately to Bregma: anterior–posterior (A–P): +0.5 mm, medial–lateral (M–L): –2.0 mm, and dorsal–ventral (D–V): –3 mm according to mouse brain atlas. Mice were monitored regularly after recovery from surgery and were sacrificed at various time points, including at baseline without PFF injection (0-day post-injection [dpi]), 14, 30, 60, 90, and 120 dpi (Fig. 1D). Control mice received monomeric α-syn were sacrificed at 120 dpi.
Immunohistochemistry and quantification
The mouse brains were removed after transcardial perfusion with phosphate buffered saline (PBS), followed by 4% paraformaldehyde (4% PFA), and underwent overnight post-fixation in 4% PFA, before being processed. For immunohistochemistry, brains were sectioned into free-floating coronal slices at the thickness of 40μm and the cutting speed of 0.055 mm/s using vibratome.
For immunofluorescence, free-floating slices were blocked using 10% normal donkey serum in 0.5% Triton X-100/ PBS for 1 h at RT. Slices were then incubated with sheep anti-tyrosine hydroxylase (TH) antibody (Abcam ab113; 1 : 1000) and rabbit anti-phosphorylated Serine S129 α-syn (pS129-α-syn) antibody (Abcam ab51253; 1 : 2000), diluting in 0.5% Triton X-100/PBS overnight at 4°C, following by washing three times for 10 min each in PBS at RT. Next, brain sections were incubated with secondary antibodies conjugated with Alexa fluor 488 (Abcam ab150177; 1 : 1000) and Alexa fluor 555 (Abcam ab150074; 1 : 1000) for 2 h at RT. After washing in PBS three times for 10 min, slices were mounted onto the slides and with the mounting medium with DAPI (Vectashield, Vector Laboratories) for nucleus visualization. Fluorescent images were acquired with an Olympus BX51 conventional fluorescence microscopy with U-RFL-T power supply at a 1.25x/0.04NA and 10X/0.3NA objective lens.
For immunohistochemistry, brain tissues were blocked with endogenous peroxidase in 3% hydrogen peroxide for 15 min at RT and washed in PBS three times for 10 min at RT. Sections were then incubated in blocking solution containing 2% BSA in 0.3% Triton X-100/ PBS for 1 h at RT. Primary antibodies including mouse anti-TH antibody (Immunostar, #22941; 1 : 1000), rabbit anti-pS129-α-syn antibody (Abcam ab51253; 1 : 1000), rabbit anti-Iba1 (Wako, #016-20001; 1 : 500), mouse anti-GFAP (Milipore, #MAB360; 1 : 500), and rabbit anti-NeuN (Abcam ab177487; 1 : 1000) were applied overnight at 4°C then wash by PBS three times for 10 min. Suitable secondary antibodies conjugated horseradish peroxidase (HRP) (Enzo; 1 : 1000) were incubated for 2 h at RT, followed by 3 x 10 min PBS washes. Staining was developed using DAB peroxidase substrate kit (Vector Laboratories). Next, mounting slices were performed onto the slides which then were covered in mounting medium with coverslips and store at 4°C.
Semi-quantitative determination of DAB images was performed using ImageJ Fiji software according to protocols in the previous study [27]. Representative and quantitative images of pS129-α-syn pathology, TH, Iba1, GFAP, and NeuN were acquired with the Olympus BX51 microscopy with all same parameters including brightness, exposure time, contrast, and resolution. Image color was corrected by setting color deconvolution with the H-DAB function in ImageJ. Then, mean gray values (value of 0 for black and 255 for white) from the whole striatum of four 40μm slices or the whole substantia nigra of two 40μm slices or the motor cortex of four 40μm slices from an individual animal was measured repeatedly at each time point by drawing region of interest. The measured gray level was converted into relative optical density (OD) by using the following formula OD = log (255/mean gray level). The average OD value at each time point was represented for the measurement of TH degeneration, pS129-α-syn level, microglial activation, and astrocytic activation.
For cell counts, four 40μm sections of the motor cortex from an individual animal were examined. The number of NeuN-immunopositive cells was calculated using an average of two fields of view per area and using ImageJ as described previously [28]. The results were averaged across the animals in each group.
Western blotting
The standard western blot analysis was performed as described previously [27]. Cerebellum was excluded and mouse brain was dissected into two hemispheres, i.e., ipsilateral to PFF injection and contralateral to PFF injection. Firstly, mouse brain was homogenized in a non-ionic detergent containing 10 mM Tris-HCl, pH 7.4, 5 mM EDTA, 150 mM NaCl, 0.5% Nonidet P-40, 1×proteinase inhibitor cocktail, and 1×phosSTOP. The homogenates were centrifuged at 12000 rpm, 4°C for 20 min. The supernatants were collected as NP40-soluble fraction. The pellets were washed twice in non-ionic buffer, homogenized in the ionic-detergent buffer which containing 10 mM Tris-HCl, pH 7.4, 5 mM EDTA, 150 mM NaCl, 0.5% Nonidet P-40, 0.5% sodium deoxycholate, 1% SDS, 1×proteinase inhibitor cocktail, and 1×phosSTOP and incubated on ice for 5 min. After centrifugation at 12000 rpm, 4°C for 40 min, the suspensions were determined as NP40-insoluble fraction. Protein concentration measurement was done by BCA assay.
An equal protein amount from each group was loaded to 12% or 15% (w/v) SDS-PAGE gel in 2–2.5 h at 80V. Wet transfer with Polyvinylidene fluoride membrane (Immobilon-P, pore size 0.45μm) was performed in transfer buffer (25 mM Tris-base, 190 mM glycine, and 20% methanol) using the Mini Trans-Blot electrophoretic transfer cell (Bio-Rad) with a Model 200/2.0 Power Supply (Bio-Rad) at 90V for 90 min. After transferring, membrane was blocked in 5% (w/v) non-fat dry milk for 1 h at RT. For detection of α-syn and pS129-α-syn, the blot was fixed with 0.4% PFA in PBS for 30 min at RT before blocking. Primary antibodies including rabbit anti-α-syn (Abcam ab212184; 1 : 1000), rabbit anti-pS129-α-syn (Abcam ab51253; 1 : 1000), rabbit anti-PP2A C subunit (Cell signaling, #2038S; 1 : 1000), rabbit anti-phospho-PP2A (pTyr307) (Merck, #SAB4503975; 1 : 1000), mouse anti-TH (Immunostar, #22941; 1 : 1000), rabbit anti-NeuN (Abcam ab177487; 1 : 2000), rabbit anti-Iba1 (Wako, #016-20001; 1 : 1000), mouse anti-GFAP (Milipore, #MAB360; 1 : 1000), and mouse anti-β-actin (Santa cruz biotechnology, #sc47778; 1 : 1000). Protein detection was performed using goat anti-rabbit IgG (Enzo, #ADI-SAB-300-J; 1 : 5000) and anti-mouse IgG (Enzo, #ADI-SAB-100-J; 1 : 5000) HRP-conjugated antibodies. Finally, immunoreactive proteins were developed using chemiluminescence (SuperSignal™ West Pico PLUS Chemiluminescent Substrate; ThermoFisher Scientific) along with the Amersham Image 600 Western Blot imaging system (GE Healthcare Life Sciences). Densitometric analysis of Western blot was performed using ImageJ software. Protein immunoreactivity was normalized by density of β-actin bands used as a control for protein loading (n = 3 per time point in each group).
Behavioral analysis
To evaluate the effects of α-syn pathology on motor behavior, mice underwent behavioral testing, including the wire hang test, rotarod test and hindlimb clasping assessment at baseline before surgery and on the day of sacrifice according to previously published protocols [27] with some modifications.
Wire hang test
The mice were placed on a 55 cm-long-wire and 2 mm-thick at the height of 90 cm. The training was performed by three cycles of 5 min hang and 5 min rest, then ceased for 1 h. The latency of mice to fall of the wire was recorded as the time of the mouse could hold on to the wire and measured in the range from 10 s to 300 s and the average values were computed from three trials (5 min apart).
Rotarod test
For assessment of motor coordination and balance, mice were tested on the Rotarod apparatus. Mice were given a training session of three 5 min trials (5 min apart) to familiarize them to the rotarod apparatus at the speed of 30 rpm. During the test period (1 h later), animals were placed on the rotarod and recorded the latency to fall off the rotarod in the range of 30 s to 300 s. Each mouse received three consecutive trials and the mean values were used for the analysis.
Hindlimb clasping assessment
To assess the behavioral phenotype and disease progression, mice were suspended by the tail for 10–15 s and recorded their hind and forepaw while suspended using hand camera. Score hindlimb clasping from videos of mice suspended by their tail was assigned on a scale from 0–4 based on a modified criteria as following: score 0, no limb clasping, normal escape extension; score 1, one hind limb exhibits and loss of mobility, toes exhibit normal splay; score 1.5, one hindlimb exhibits incomplete splay and loss of mobility, one hindlimb exhibits curled toes; score 2, both hind limbs exhibit incomplete splay, toes exhibit normal splay; score 2.5, both hindlimbs exhibit incomplete splay and loss of mobility, one hindlimb exhibits curled toes; score 3, both hind limbs exhibit clasping with curled toes and immobility; score 4, forelimbs and hind limbs exhibit clasping and are crossed, curled toes and immobility.
Statistical analysis
All statistical analysis of data was performed using Graphpad Prism version 8 software (https://www.graphpad.com/). All graphical data are presented as mean±SEM. For analysis of differences between two genotypes at each time point, one-way ANOVA followed by Sidak’s multiple comparisons or two-way ANOVA followed by Turkey’s multiple comparisons was used. Statistical significance finding was set for the comparison between baseline and each time point post-injection within each genotype as follows: * if p < 0.05, ** if p < 0.01, and *** if p < 0.001 or for the comparison between two animal groups with WT and Pink1 KO at each time point (n = 3 per time point in each group) as follows:
# if p < 0.05, ## if p < 0.01, and ### if p < 0.001.
RESULTS
Wide spreads of pathological α-syn to various anatomical connected brain regions after PFF injection
PFF-induced α-syn aggregates were observed as early as 2 weeks post-injection in both Pink1 WT and KO mouse brains. Phosphorylated α-syn immunoreactive aggregates were prominent in striatum and different brain regions that project to the striatum, such as the motor cortex (MoCx), amygdala, substantia nigra (SN), and hippocampus and were observed in both brain hemispheres (Supplementary Figure 1).
Dominant pathological α-syn accumulation in the striatum, SN, and MoCx of Pink1 KO mice
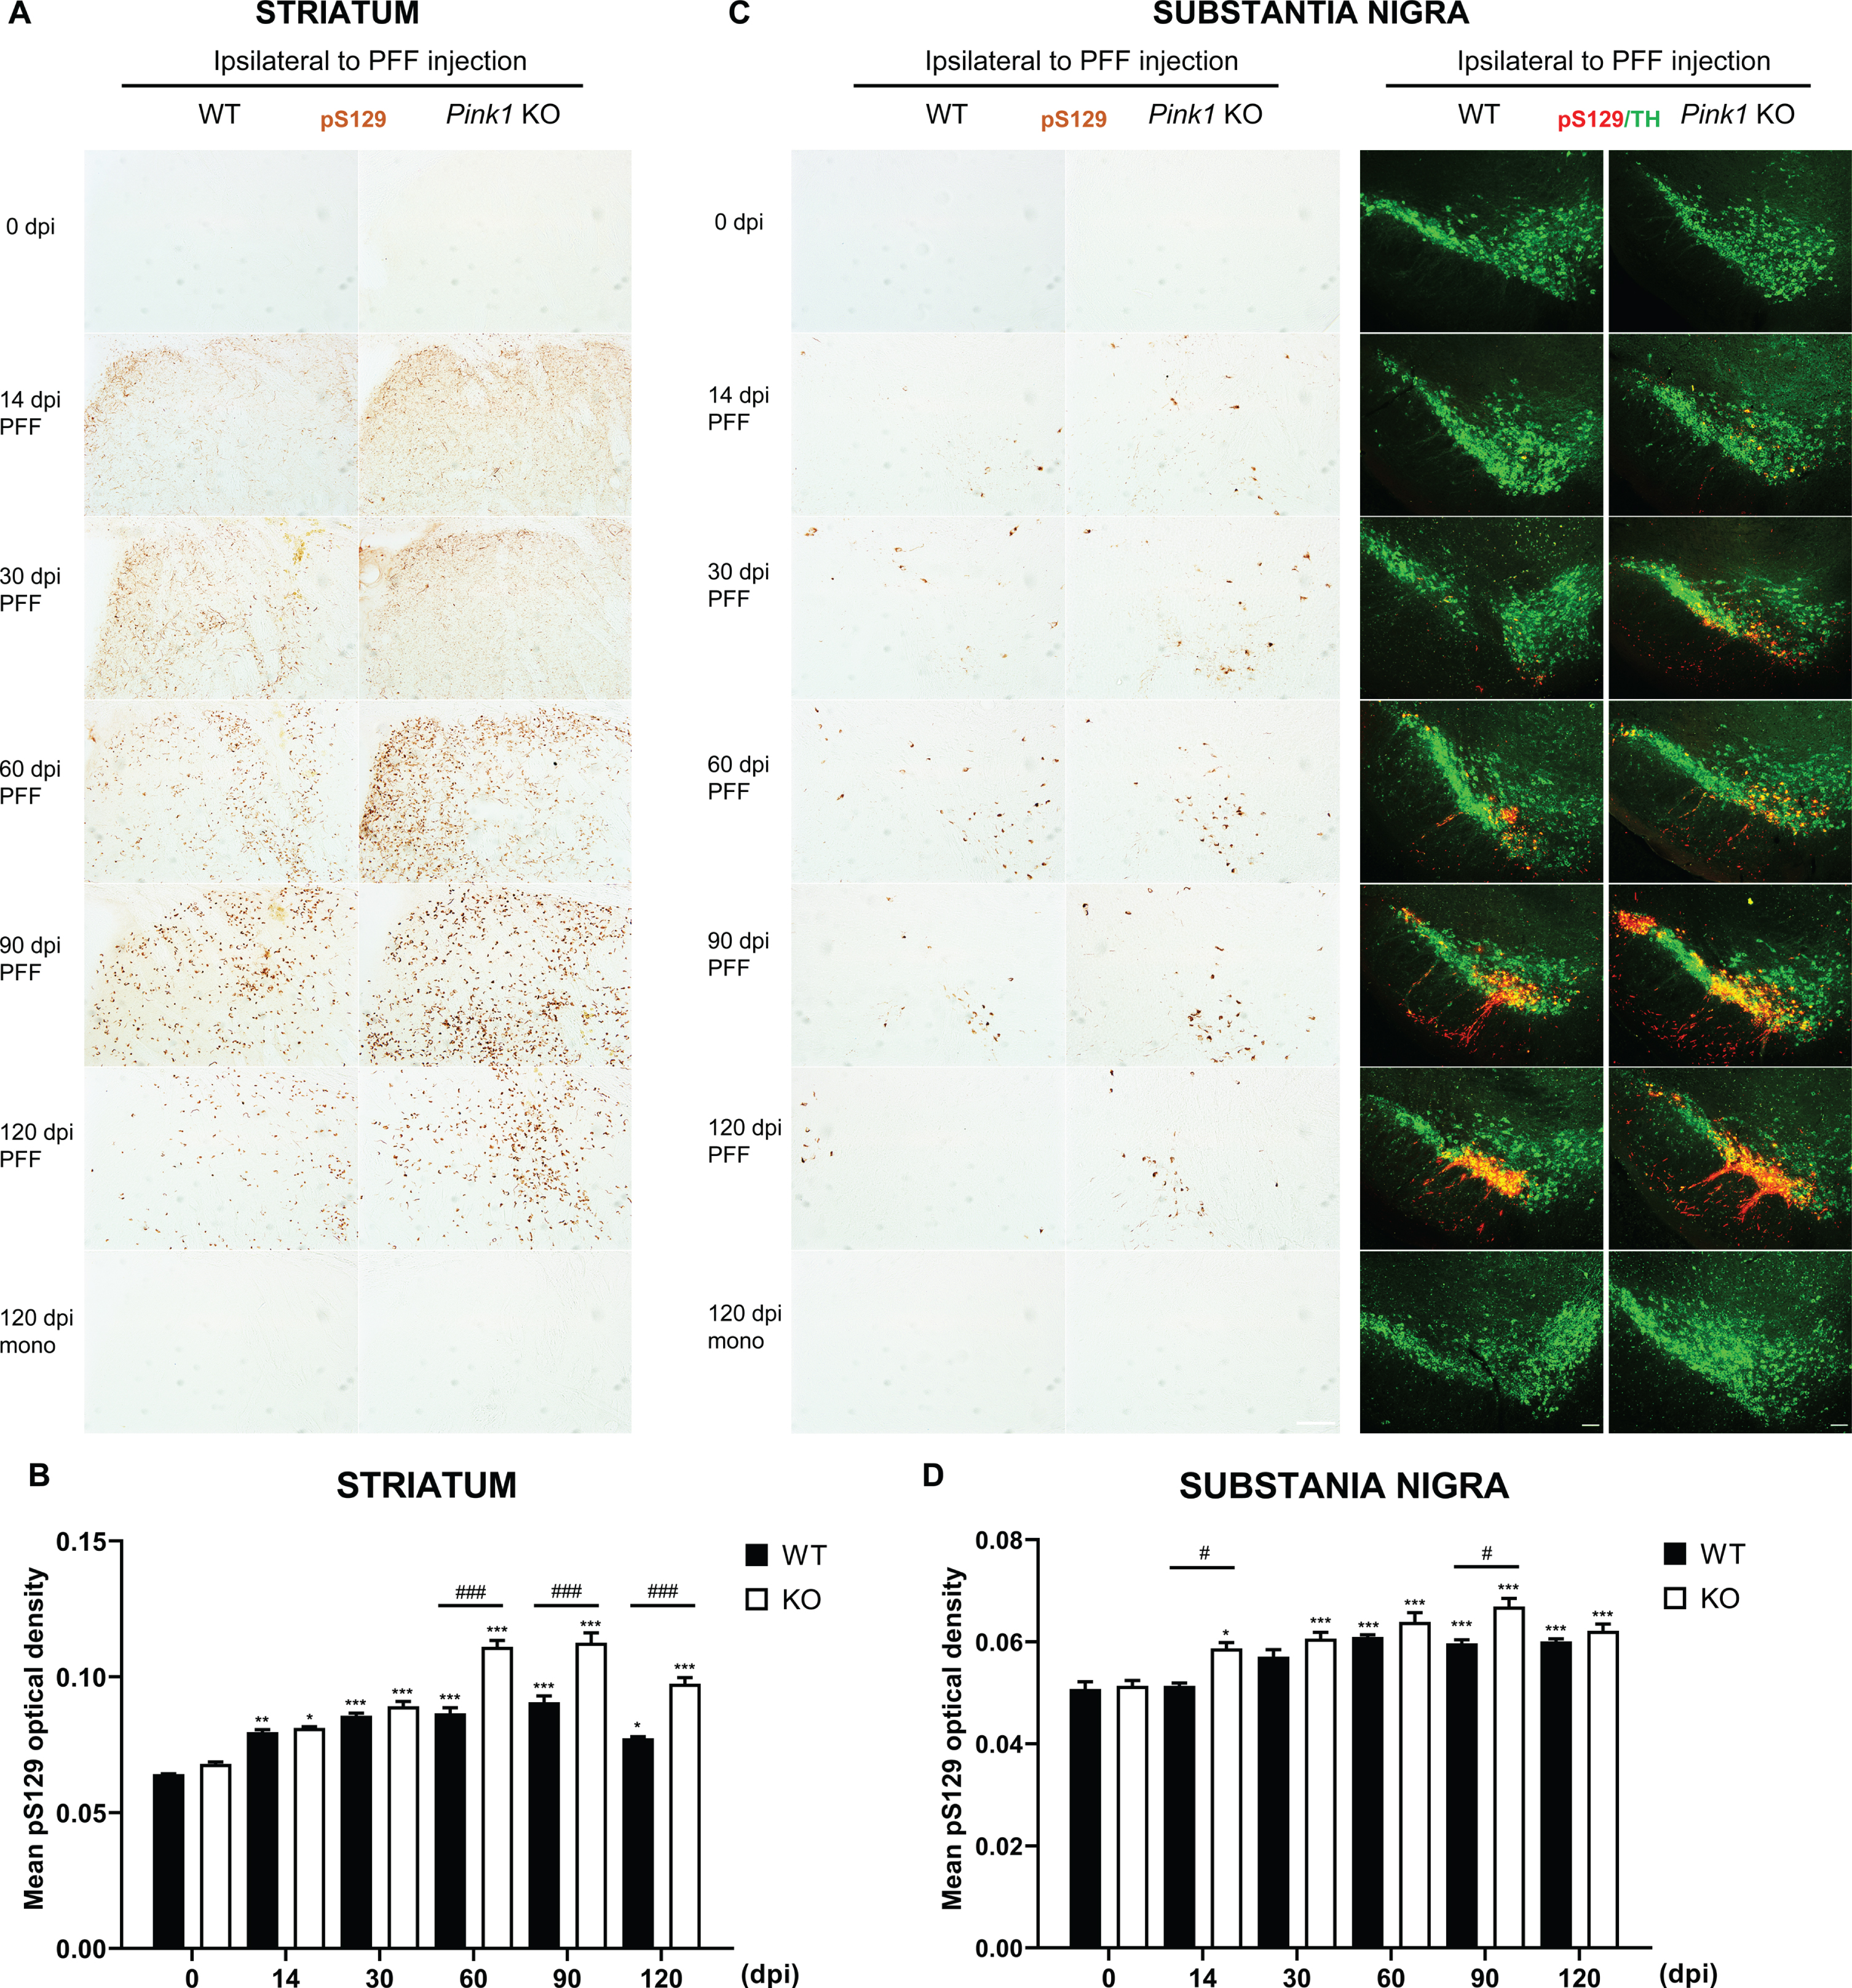
Striatal α-syn PFF injection resulted in a progressive propagation of α-syn aggregates in the whole striatum at 14 dpi, with the greatest proportion of phosphorylated α-syn-positive inclusions at 90 dpi and a reduction at 120 dpi, in both Pink1 WT and KO mice. The ipsilateral striatum of Pink1 KO mice showed significantly greater pS129-α-syn deposits than that of WT controls from 60 to 120 dpi (Fig. 2A, B). Likewise, pathological pS129-α-syn levels increased significantly in the contralateral striatum of PFF-injected Pink1 KO mice compared with WT mice at 14, 30, and 90 dpi (Supplementary Figure 2A, B). Double-staining immunofluorescent analysis of midbrain sections with TH and pS129-α-syn antibodies revealed the presence of Lewy neurite and Lewy body-like inclusions in dopaminergic neurons in the ipsilateral SN of PFF-injected both genotypes at different time points (Fig. 2C, D). In addition, in the ipsilateral SN of Pink1 KO mice, pathological α-syn levels significantly increased from 14 dpi and peaked at 90 dpi; these were remarkably higher in Pink1 KO mice than in WT mice (Fig. 2C, D). In the contralateral SN, pS129-α-syn inclusions were not remarkable during the observation period in Pink1 KO and WT mice (Supplementary Figure 2C, quantification data not shown). Moreover, there was a conspicuously increased burden of pS129-α-syn aggregates at 30, 90, and 120 dpi in the ipsilateral MoCx (Supplementary Figure 3A, B) and at 90 and 120 dpi in the contralateral MoCx (Supplementary Figures 3A, C) of PFF-injected Pink1 KO mice compared with that of WT mice. As expected, there was no pS129-α-syn-positive aggregate in the brains of any animals at baseline and of animals that received an equal amount of monomeric α-syn at 120 dpi (Fig. 2A, C; Supplementary Figure 2A, C; and Supplementary Figure 3A). The findings suggested that PINK1 dysfunction resulted in the abundant α-syn deposition in the striatum, SN, and MoCx.
Fig. 2
Dominant pathological α-syn accumulation in the striatum and SN of Pink1 KO mice. Representative images of pS129-α-syn aggregates with DAB staining in the ipsilateral striatum after PFF or monomeric α-syn injection (A) and its quantification (B). Representative images of pS129-α-syn positive aggregates with DAB staining (left) and double-immunofluorescent staining images showed co-localization of pS129-α-syn positive inclusions with nigral dopaminergic neurons (right) in the ipsilateral SN after PFF or monomeric α-syn injection (C). Scale bar = 100μm. D) Quantification of pS129-α-syn optical density in ipsilateral substantia nigra (D). Statistical significance was performed using one-way ANOVA followed by post-hoc Sidak’s test and two-way ANOVA followed by post-hoc Turkey’s test and for multiple group comparisons. Statistical significance finding was set for the comparison between baseline and each time point post-injection within each genotype as follows: * if p < 0.05, ** if p < 0.01, and *** if p < 0.001 or for the comparison between two animal groups with Pink1 WT and Pink1 KO at each time point (n = 3 per time point in each group) as follows: # if p < 0.05, ## if p < 0.01, and ### if p < 0.001. dpi, day post-injection; mono, monomeric α-syn; PFF, α-syn preformed fibril; TH, tyrosine hydroxylase; otherwise are same as previous figures.
Increased levels of soluble and insoluble α-syn in Pink1 KO mice after PFF injection
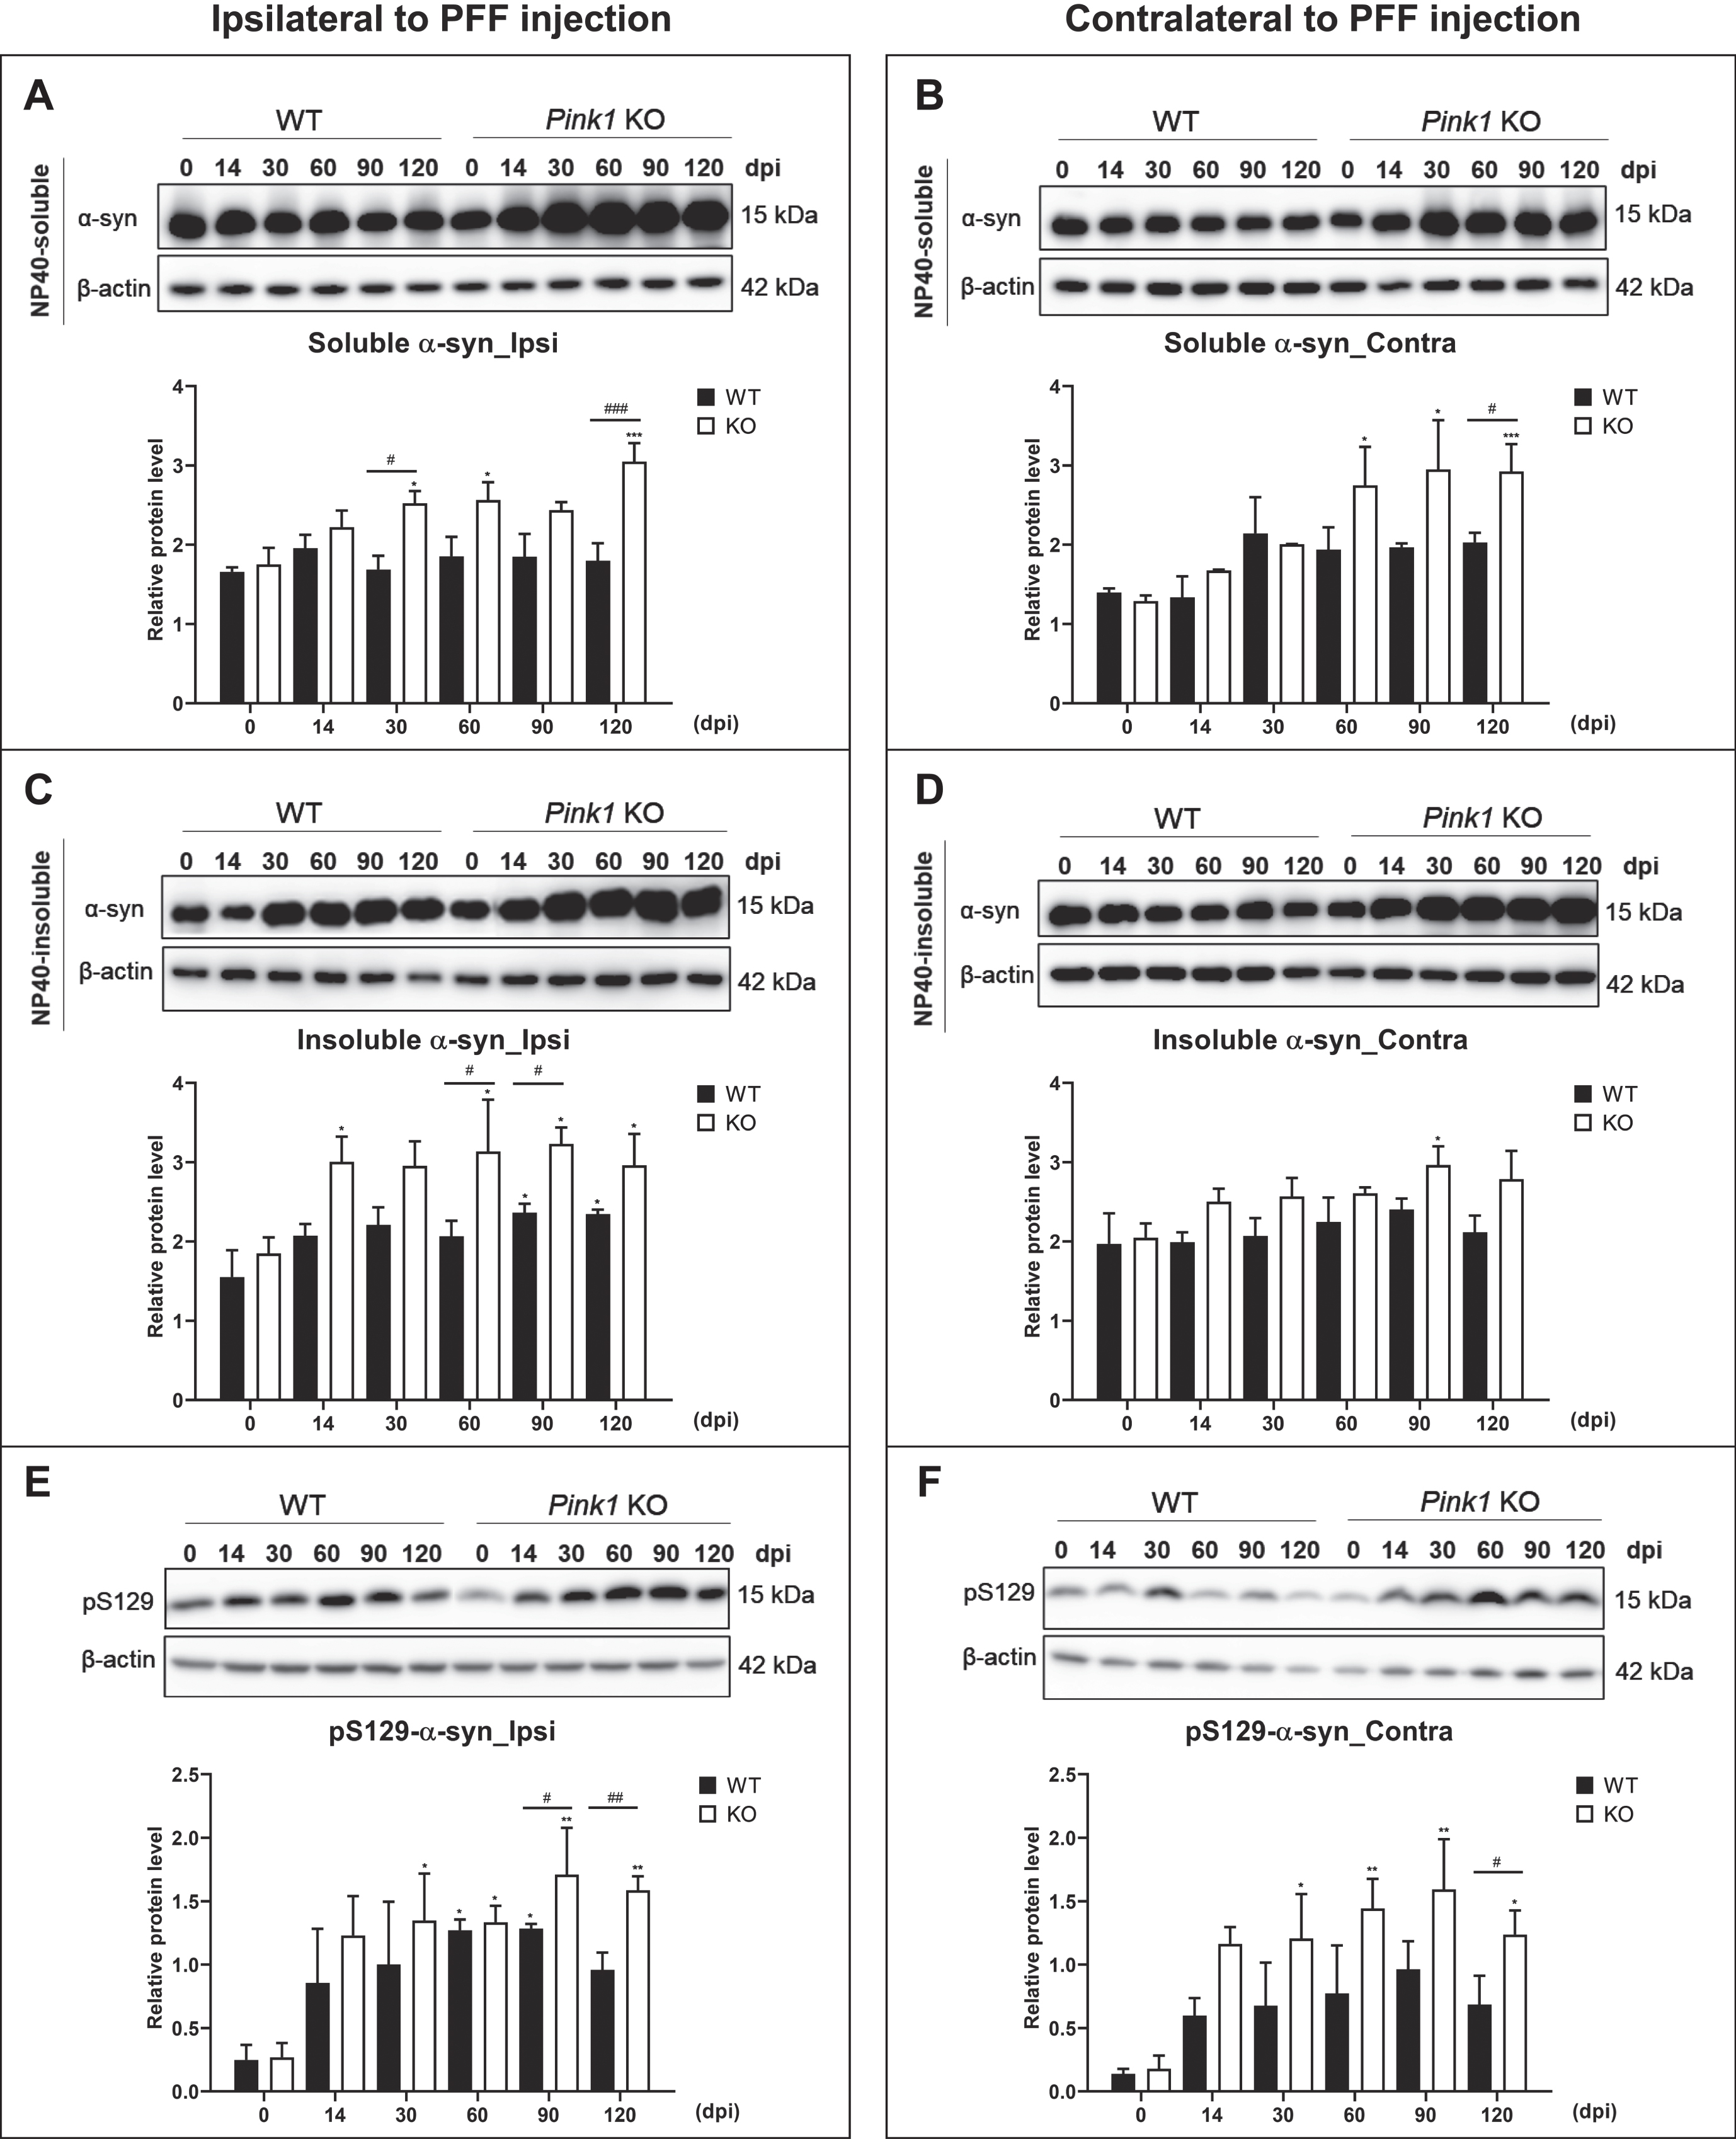
The α-syn aggregates induced by PFF injection have greater insolubility, which is similar to human Lewy body pathology properties [29]. To investigate changes in total α-syn proteins in the whole brain, we extracted proteins from both brain hemispheres, and separated them into NP40-soluble and insoluble fractions in Pink1 KO and WT mice. Pink1 KO mice had higher soluble and insoluble α-syn contents than WT mice after PFF injection (Fig. 3A–D). The NP40-soluble α-syn fraction in PFF-injected Pink1 KO mice was increased from 30 to 120 dpi in the ipsilateral brain and from 60 to 120 dpi in the contralateral brain. Moreover, it significantly differed between Pink1 KO and WT mice at 30 and 120 dpi in the ipsilateral side (Fig. 3A) and at 120 dpi in the contralateral side of the brain (Fig. 3B). The NP40-insoluble α-syn level in the ipsilateral side of WT and Pink1 KO mice increased over time, and it was significantly higher levels at 60 and 90 dpi in Pink1 KO mice compared with WT mice (Fig. 3C). In contrast, a significant increase was only observed in the contralateral brain of Pink1 KO mice, and it peaked at 90 dpi (Fig. 3D). In the same manner, the phosphorylated α-syn levels in the insoluble fraction significantly increased at 60 and 90 dpi in PFF-injected WT mice and from 30 to 120 dpi in Pink1 KO mice. Further, it was significantly greater at 90 and 120 dpi in Pink1 KO mice compared with WT mice (Fig. 3E). In the contralateral brain, the phosphorylated α-syn levels were only significantly increased from 30 to 120 dpi in Pink1 KO mice after PFF injection and were remarkably higher at 120 dpi in Pink1 KO mice than WT mice (Fig. 3F). Hence, the observations suggested that PINK1 dysfunction resulted in higher soluble, insoluble, and phosphorylated α-syn contents.
Fig. 3
Increased levels of soluble and insoluble α-syn in Pink1 KO mice after PFF injection. Representative immunoblots of NP40-soluble α-syn levels in both brain hemispheres after PFF injection and its quantification analysis normalized to β-actin in the ipsilateral brain (A) and contralateral brain (B). Representative immunoblots of NP40-insoluble α-syn levels in the ipsilateral brain (C) and contralateral brain (D). pS129-α-syn levels in both brain hemispheres and its quantification analysis in the ipsilateral brain (E) and contralateral brain (F). Statistical analysis was determined using one-way ANOVA followed by post-hoc Sidak’s test and two-way ANOVA followed by post-hoc Turkey’s test and for multiple group comparisons. Ipsi, ipsilateral; Contra, contralateral; otherwise are same as previous figures.
Loss of Pink1 function increased glial activation after PFF injection
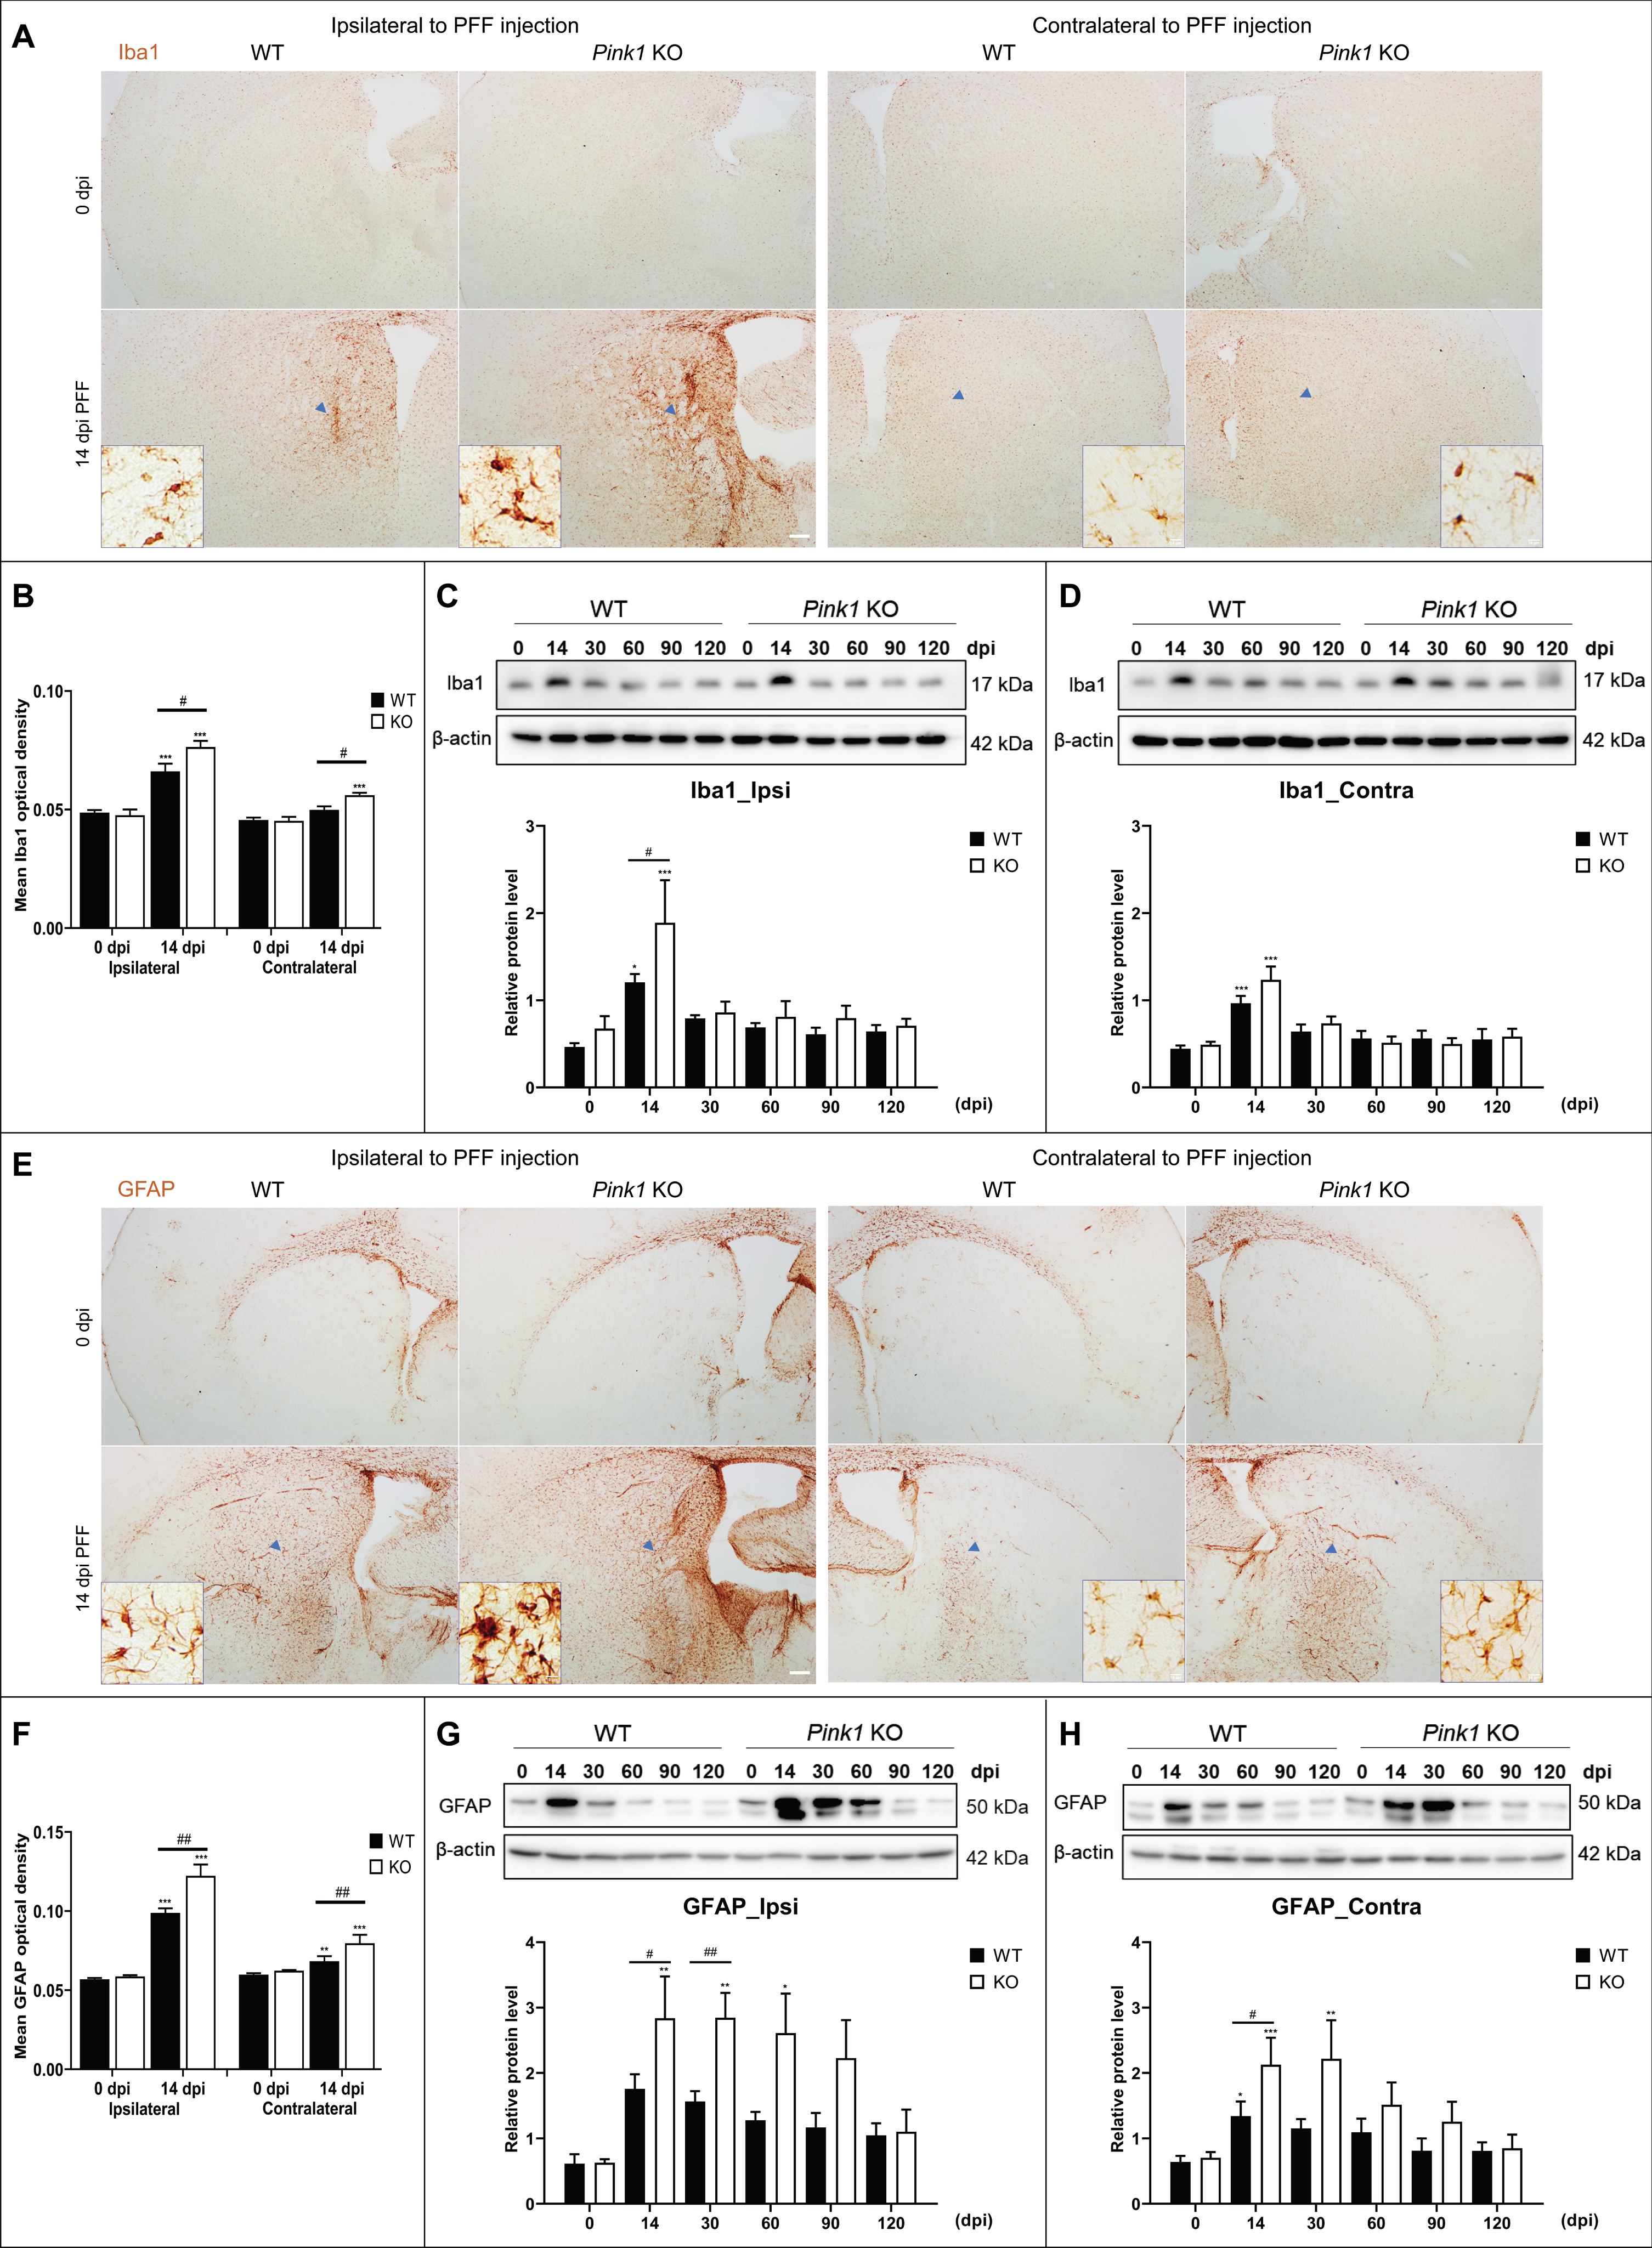
Glial responses were analyzed with the whole brain homogenates using immunoblotting. After PFF injection, the Iba1-positive microglial levels markedly increased at 14 dpi in the whole brain of the two animal genotypes, and they were remarkably higher in the ipsilateral brain of Pink1 KO than that of WT mice (Fig. 4A–D). Furthermore, the GFAP-immunoreactive astrocytic levels peaked at 14 dpi and then decreased in the whole brain of PFF-injected WT mice, while there was a sustained activation of GFAP-positive astrocytes from 14 to 60 dpi in the ipsilateral brain and from 14 to 30 dpi in the contralateral brain of PFF-injected Pink1 KO mice (Fig. 4G, H). Moreover, compared with the GFAP expression levels of WT mice, those of PFF-injected Pink1 KO mice were significantly higher at 14 and 30 dpi in the ipsilateral brain and at 14 dpi in the contralateral brain (Fig. 4E–H). Using immunohistochemistry, the greater gliosis was observed in Pink1 KO mice at 14dpi, which is the peak of glial activation, along with higher Iba1- and GFAP-immunoreactive density (Fig. 4A, B, E, F). The microglial and astrocytic cell shape revealed a more activated form (especially the large cell body shown in the blue box (Fig. 4A, E). Therefore, the PINK1 deficiency provoked increased activation of glial cells after PFF injection.
Fig. 4
Loss of Pink1 function increased glial activation after PFF injection. Iba1-positive microglial immunoreactivity in the whole striatum at baseline and 14 days after PFF injection (A) and its quantification (B). Scale bar = 200μm. Western blot result of Iba1 expression level and its densitometry in the ipsilateral (C) and contralateral (D) brain. GFAP-positive astrocytic immunoreactivity in the striatum at baseline and 14 days after PFF injection (E) and its quantification (F). Scale bar = 200μm. The glial cell morphology revealed with higher magnification in the blue box of A and E at the site of blue arrowhead (Scale bar = 10μm). Immunoblot result for GFAP expression level and its densitometry in the ipsilateral (G) and contralateral (H) brain. β-actin was used as a loading control. Differences were determined using one-way ANOVA followed by post-hoc Sidak’s test and two-way ANOVA followed by post-hoc Turkey’s test and for multiple group comparisons. Iba1, Ionized calcium binding adaptor molecule 1; GFAP, Glial fibrillary acidic protein; otherwise are same as previous figures.
3.5Increased phosphorylation of protein phosphatase 2A in PFF-injected Pink1 KO mice
Protein phosphatase (PP) 2A is the main α-syn Ser/Thr phosphatase whose activity facilitated α-syn dephosphorylation [30, 31]. PP2A attenuated α-syn aggregation with serine 129 phosphorylation by 50% in Lewy bodies with dementia and α-syn triplication brains [32]. PP2A acts downstream of PINK1 to mediate neuroprotection and it is inactivated by the phosphorylation at Tyr307 [33]. In this study, the levels of PP2A and phosphorylated PP2A at Tyr307 (p-PP2A), inactivated form of PP2A, were evaluated. Our study showed an increase in p-PP2A levels at 30 and 90 dpi of the ipsilateral brain and 60 and 90 dpi of the contralateral brain in PFF-injected Pink1 KO mouse compared with WT mice. Meanwhile, there was no significant difference in PP2A levels (Supplementary Figure 4A–D). The p-PP2A/PP2A ratio substantially peaked at 90 dpi in PFF-injected Pink1 KO mice, and it was greater at 30, 90, and 120 dpi in the ipsilateral brain and at 90 dpi in the contralateral brain in Pink1 KO mice compared with WT mice (Supplementary Figure 4E, F). Thus, the findings suggested that Pink1 KO mice after PFF injection increased phosphorylated PP2A.
3.6PFF-induced early and severe neurodegeneration in Pink1 KO mice
The magnitude of nigrostriatal degeneration was assessed by TH immunoreactive quantification in the striatum and SN (Fig. 5A–F). The loss of striatal TH intensity was observed over time in the ipsilateral side of PFF-injected both genotype mice and significantly greater in Pink1 KO mice compared with WT mice at 60 dpi (Fig. 5A, B). The TH density did not change in the contralateral striatum of Pink1 KO and WT mice during the observation period (Fig. 5A, C). The TH intensity in the ipsilateral SN decreased over time and remarkably at 90 and 120 dpi in both the PFF-injected genotype groups, but it was not significantly different between the two genotypes during the observation period (Fig. 5D, E). Meanwhile, it only significantly decreased at 120 dpi in the contralateral SN of PFF-injected Pink1 KO mice (Fig. 5F). Intrastriatal injection of monomeric α-syn did not cause striatal dopaminergic denervation or loss of nigral dopaminergic neurons (Fig. 5A–F).
Fig. 5
PFF-induced neurodegeneration and manifestation of motor symptoms in PD mouse models. TH-positive immunoreactive striatal integration (A) and its densitometric quantification (B, C). Scale bar = 500μm. TH-positive nigral dopaminergic neurons (D) and its quantification data (E, F). Scale bar = 100μm. Western blot result of NeuN-positive immunoreactivity and its densitometric quantification from the whole brain normalized to β-actin (G, H). The latency in rotarod (I) and wire hang (J) performance and hindlimb clasping score analysis (K) of mice after PFF injection (n = 9–12). Statistical significance was performed using one-way ANOVA followed by post-hoc Sidak’s test and two-way ANOVA followed by post-hoc Turkey’s test and for multiple group comparisons. TH, tyrosine hydroxylase; NeuN, neuronal nuclear protein; I, ipsilateral; C, contralateral; otherwise are same as previous figures.
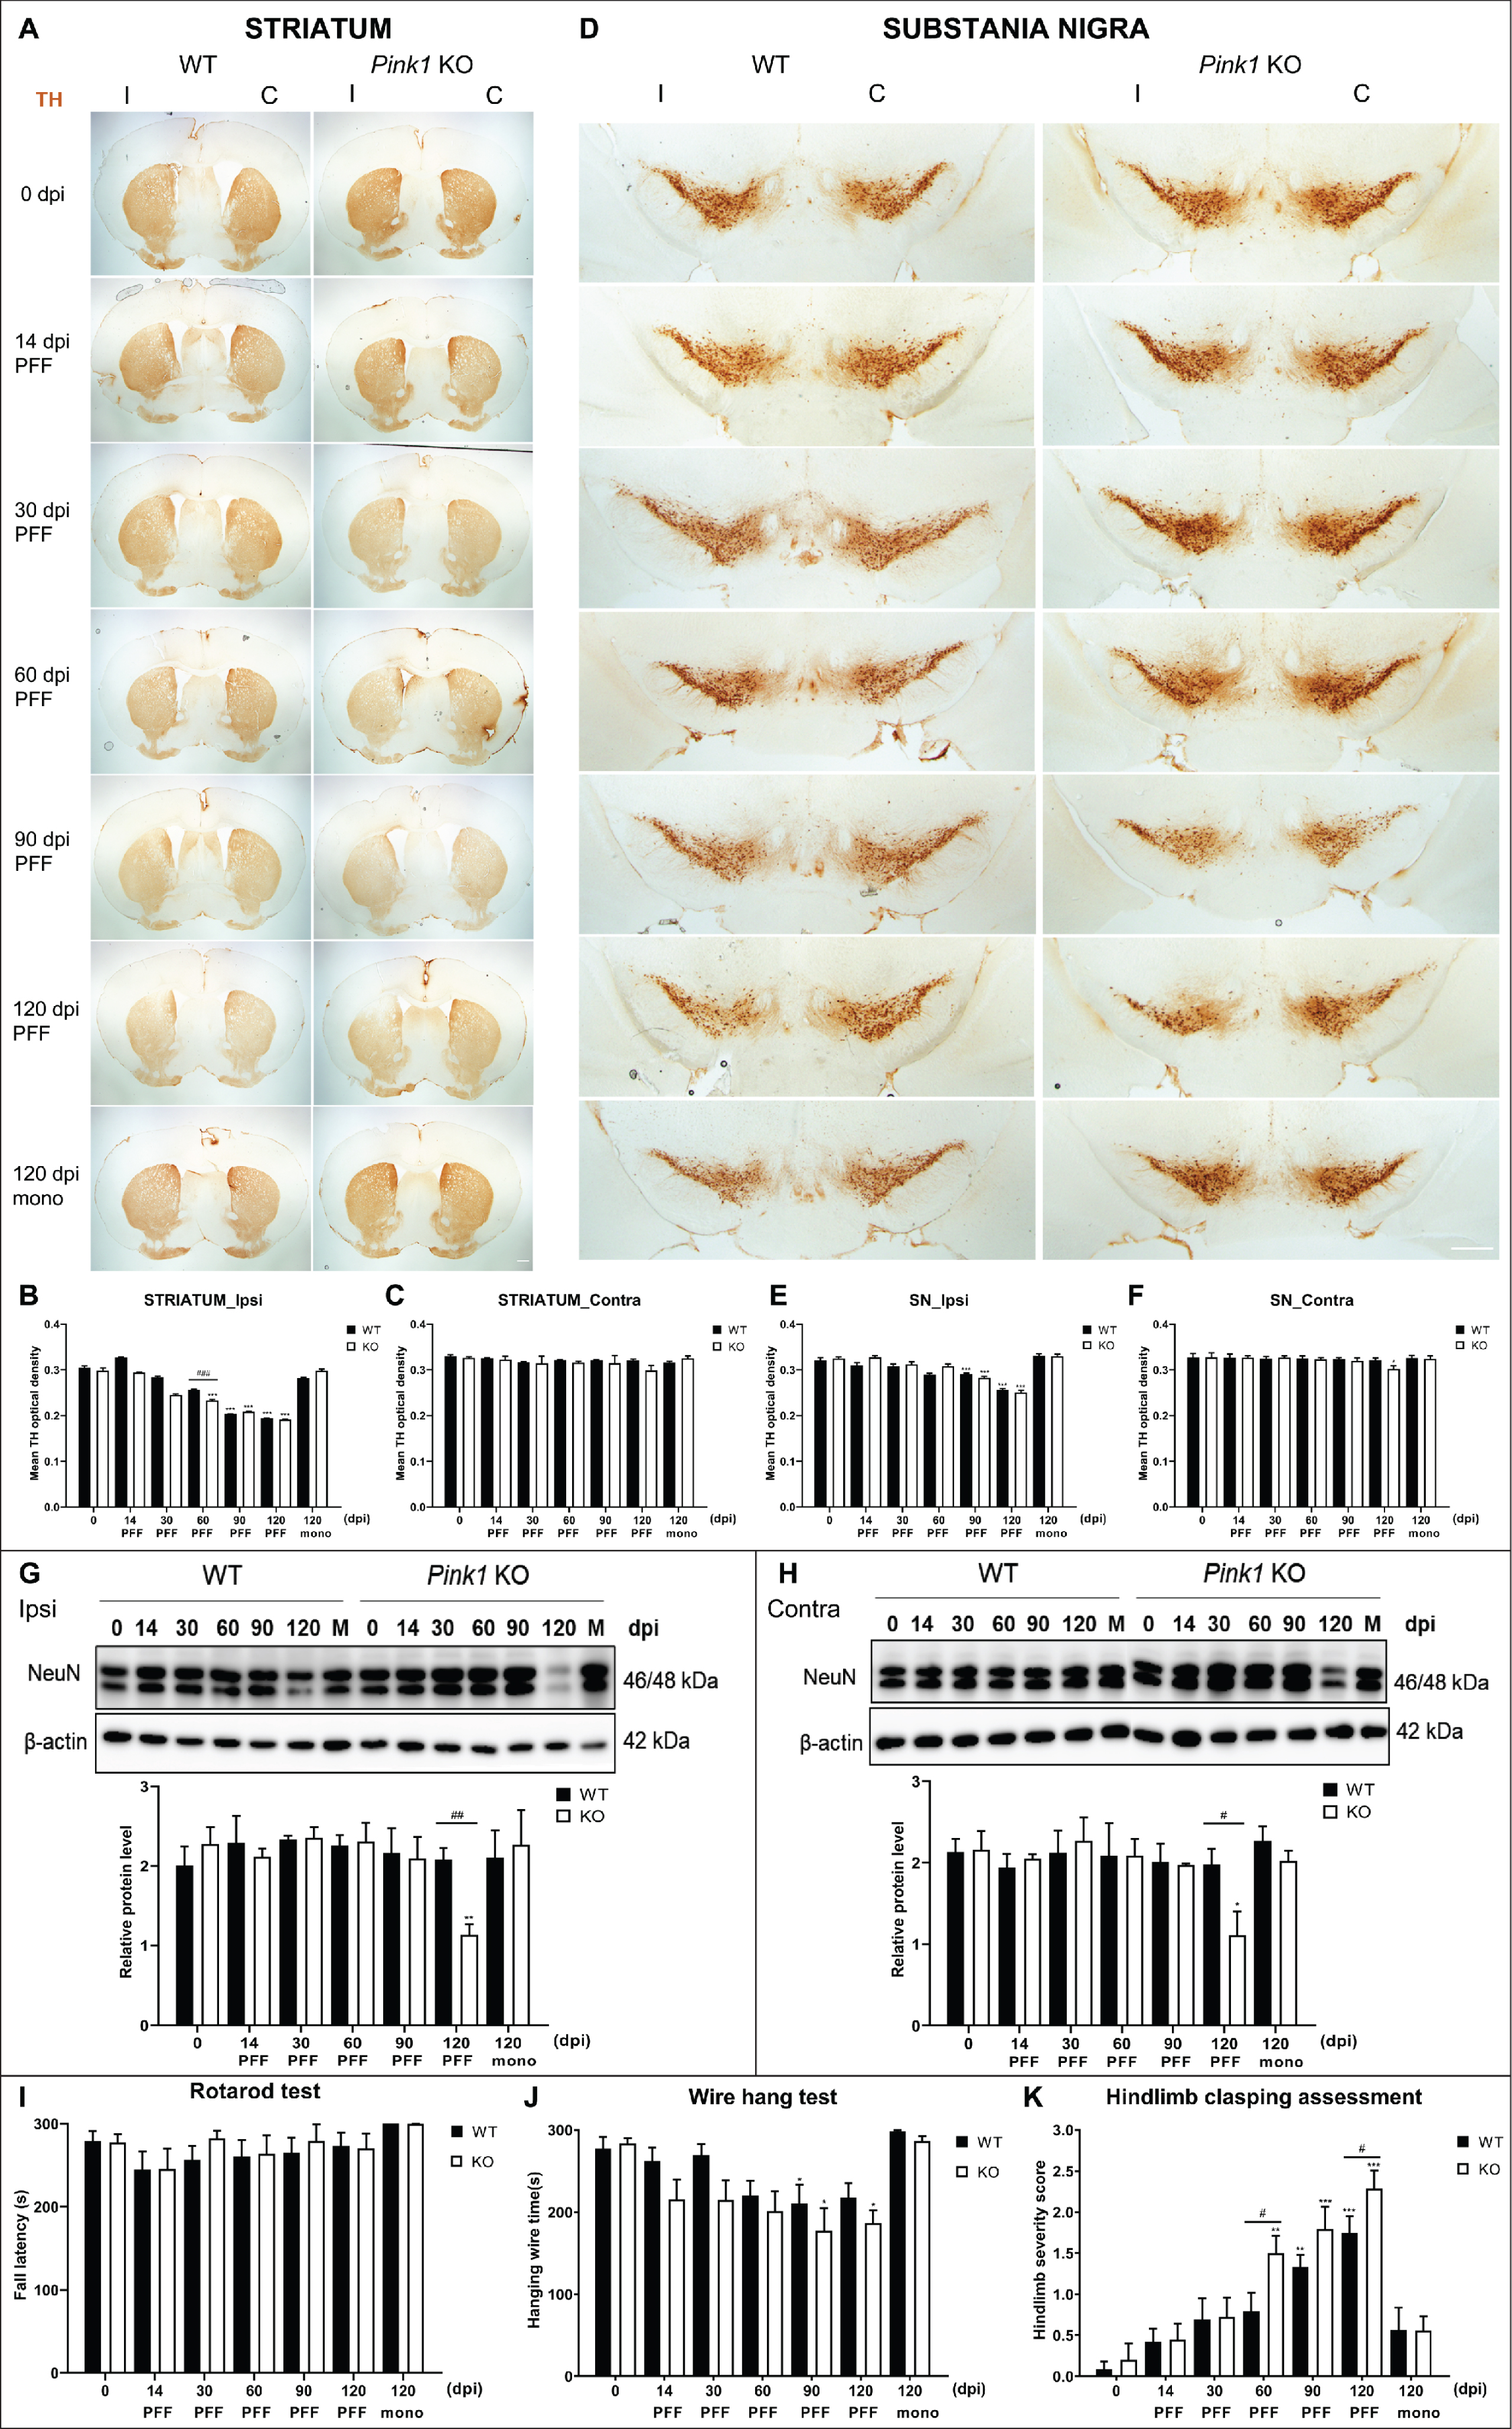
To examine the neurodegeneration of other neurons above the dopaminergic neuron, we used neuronal nuclear protein (NeuN) as a neuronal nuclear antigen and neuron differentiation marker [34]. Western blot analysis revealed a dramatic decrease in NeuN-immunoreactivity at 120 dpi in the whole brain of PFF-injected Pink1 KO mice compared with that of WT mice while the monomeric injected groups did not exhibit neuronal loss (Fig. 5G, H). The NeuN-positive cell numbers at 120 dpi were significantly less in the ipsilateral MoCx and decreased but not statistically in the contralateral MoCx of PFF-injected Pink1 KO mice compared with that of WT mice (Supplementary Figure 3D, E). The findings suggested that neurodegeneration occurred not only in the nigrostriatal system but also in other brain regions, for example, MoCx. Altogether, loss of Pink1 function resulted in early and severe neurodegeneration.
3.7Significant motor deficits in PFF-injected Pink1 KO mice
To evaluate the effects of α-syn pathology on behavioral performances, two animal groups were assessed before injection and at sacrifice days. The latency to fall on the rotarod apparatus did not differ significantly at all time points between the groups (Fig. 5I). Both genotypes showed decreased performance in the wire hang test at 90 dpi after PFF injection (Fig. 5J). The hindlimb clasping score increased over time in both groups. However, it increased significantly earlier at 60 dpi in PFF-injected Pink1 KO mice than in WT mice, and the PFF-injected Pink1 KO mice had a significantly higher score than WT mice at 120 dpi (Fig. 5K). Hence, the sign of motor symptoms was strongly observed in Pink1 KO mice after PFF injection.
4DISCUSSION
In this study, the accumulation of pathological α-syn was observed in both genotype mice after PFF injection. However, the absence of PINK1 led to a significantly higher α-syn level and its accumulation, microglial activation, and prolonged astrocytic activation in the brain, resulting in early neuronal death and, consequently, motor deficits compared with WT control.
In our study, Pink1 KO mice after PFF injection showed significantly greater levels in the soluble and insoluble α-syn and pS129-α-syn in the brain lysates and higher pS129-α-syn aggregates in the ipsilateral striatum and SN compared with WT mice. Consistent with our findings in Pink1 KO animals, previous studies showed significantly greater pS129-α-syn inclusions and more severe nigral dopaminergic neuron loss in Pink1 KO mice compared with WT mice after viral vector of α-syn overexpression treatment [25] and in Pink1 KO rats after PFF injection [35]. During disease progression, α-syn undergoes conformational changes to form oligomers and high molecular weight aggregates including the phosphorylated form of αSyn that tend to make the protein more insoluble. For this reason, the current study evaluated the alteration in content of soluble, insoluble αSyn as well as pS129-α-syn levels in both genotype groups until 4 months while another study using PFF-injected Pink1 KO and WT rats did not assess total α-syn levels but measured pS129-α-syn levels in the soluble and insoluble contents of brain at 4 weeks [24]. Our study showed a significant increase in the soluble α-syn and pS129-α-syn levels from 30 dpi until 120 dpi in PFF-injected Pink1 KO mice compared to that of WT mice. That suggested the greater chance of α-syn to become misfolding and form insoluble aggregates for an extended period in PINK1 dysfunction.
However, the mechanism by which PINK1 loss promotes the α-syn pathology remains unclear. Some studies revealed that the dysfunction of PINK1 increased the production of mitochondrial reactive oxygen species, leading to α-syn accumulation and neuronal death [36–38]. In addition, PINK1 interacts with α-syn via its kinase domain in the cytosol, promotes α-syn degradation by activating autophagy, and prevents α-syn localization in the mitochondria, thereby suppressing α-syn-induced mitochondrial dysfunction [39, 40]. The loss of Pink1 function may impair its downstream signaling pathways, for example, Tank-binding kinase 1 (TBK1)-mediated protein clearance, reduces TBK1 phosphorylation and activity, consequently, failure in mediating proteophagy pathways, which induced increased abnormal α-syn contents [24]. In addition, a global transcriptome analysis of Pink1-deficient mouse cerebellar tissues showed the selective dysregulation of Ube3a encoding ubiquitin-protein ligase E3A, which plays a role in the degradation of cytoplasmic misfolded α-syn [41]. Hence, these studies suggested that failure in several mechanisms affected by PINK1 deficiency caused increased intracellular α-syn contents and abnormal α-syn accumulation after PFF injection.
Interestingly, we found that PFF-injected Pink1 KO mice presented with hyperactivation of microglia and sustained activation of astrocytes. Previous studies including our recent paper showed that PFF-injected WT mice induced significant glial activation [27, 42]. In the current research, Pink1 KO mice showed higher and sustained glial activation after PFF injection compared with WT mice. It is unclear why PINK1 dysfunction aggravates neuroinflammation in PFF-injected animal model but can be surmised from previous studies as follows. Mitochondria play an important role in controlling innate immune pathways [41, 43, 44]. PINK1/Parkin mutations lead to incomplete mitophagy, might provoke mitochondrial fragmentation, promote mitochondrial reactive oxygen species in astrocytes via the pyrin domain containing 3 (NLRP3)-inflammasome and other pathways, which then further enhance toxic inflammatory cytokines and neighboring cell dysfunction [43]. Moreover, the loss of PINK1 increased GFAP expression, altered glial inflammatory secretion profiles by increasing pro-inflammatory cytokines (interleukin[IL]-1β, tumor necrosis factor-α), and nitric oxide levels in astrocytes and nitric oxide levels in the mixed glia [45]. Furthermore, even without PFF injection, Pink1 KO mice showed increased glial activation compared with WT mice. For example, Torress-Odio et al. showed higher Iba1-strained microglia and GFAP-stained astrocytes in the brainstem and striatal tracts of Pink1 KO mice at the age of 18 months compared with the same-age WT mice and confirmed the early activation of astrocytes in the olfactory bulb at 9 months old [41]. The ongoing neuroinflammation in the whole brain until 18 months old, which were observed by a significant increase in ceramide levels in Pink1 KO mice compared with WT mouse [41]. In addition, the PFF-injected WT mice model of Izco et al. revealed that glial activation with a high IL-1β expression was an early event at 15dpi, which preceded α-syn inclusion [42]. This glial activation might contribute to or aggravate α-syn pathology in previous studies [25, 27, 41, 46]. Therefore, PINK1 dysfunction induced more glial activation compared with control, which in turn aggravated α-syn pathology in this current research. In addition, our study showed a remarkable nigral dopaminergic neuron loss in the ipsilateral brain and a modest loss in the contralateral brain even few α-Syn inclusions in dopaminergic neurons (Fig. 5F and Supplementary Figure 2C). This finding was similar to that of Sorrentino et al. [47] and an autopsy report of a PINK1-linked PD patient presenting with loss of nigral neuron without Lewy pathology [20]. That demonstrated other factors rather than α-syn pathology could lead to neuronal death, for example, SN gliosis could be involved in PINK1-linked PD cases [17–20].
PP2A is a phosphatase and highly expressed in neurons, plays an essential role in the pathogenesis of neurodegenerative disorders via the dephosphorylation of tau or α-syn to alleviate the production of abnormal proteins. It was reported that PP2A activation by the treatment of metformin reduced pS129-α-syn level [31]. The Src/calmodulin complex caused PP2A phosphorylation at Tyr307 and suppressed its phosphatase activity [48]. The overexpression of α-syn reduced PP2A activity by enhancing PP2A Tyr307 phosphorylation through the Src tyrosine kinase pathway [49] and PP2A activity was rescued by PINK1 overexpression [33]. PINK1 negatively regulated the PI3K/Akt/mTOR pathway [50], which might block mTOR-induced PP2A phosphorylation [51] whose suppression of PP2A activity [31]. In addition, PINK1 dysfunction decreased PP2A activity in in vitro of dopaminergic cell culture and the mouse striatum, suggesting that the protective activity of PINK1 could suppress the inactivation of PP2A [52]. Our study showed an increase in dysfunctional PP2A (p-PP2A) in Pink1 KO mice after PFF injection. It peaked at 90 dpi, which was the point of the highest pS129-α-syn levels, and they were markedly higher in Pink1 KO mice than in WT mice. That suggested Pink1 KO caused the impairment in PP2A activation that failed to dephosphorylate pS129-α-syn, later on, pS129-α-syn aggregation triggered further PP2A phosphorylation. That was shown in a remarkable increase of p-PP2A/PP2A ratio in PFF-injected Pink1 KO mice from 30 or 60 to 120dpi and significantly different at 90 dpi in the whole brain and 120 dpi in the ipsilateral side compared with WT mice. Consequently, higher pS129-α-syn levels were observed. By contrast, although the p-PP2A level had an increasing trend in PFF-injected WT mice, it was lower than that of Pink1 KO mice, and p-PP2A/PP2A ratio did not change overall. This might explain why the PP2A activity was rescued with the protective function of PINK1 and resulted in lesser pS129-α-syn levels in WT mice compared with Pink1 KO mice. Thus, these observations could explain why PP2A phosphorylation decreased the dephosphorylation of pS129-α-syn, thereby leading to higher levels of pathological pS129-α-syn forms in Pink1 KO mice after PFF injection.
Importantly, Pink1 KO mice presented with the early loss of striatal dopaminergic neuron and significant loss of NeuN-immunopositive neurons after PFF injection in our study. The previous study by Creed and Goldberg did not find the striatal neurodegeneration in their Pink1 KO rat models within the short observation period of 4 weeks post-injection [24]. However, for a 4-month observation period, our study found that the significant loss in striatal TH intensity was observed earlier at 60 dpi in our Pink1 KO mice than WT mice—observed at 90 dpi after PFF injection. It occurred at 60 dpi prior to the loss of nigral soma at 90 dpi, suggesting axonopathy preceded cell body degeneration, similar to early PD [53]. The current study revealed a significant decrease in diffuse neuronal marker in the whole brain of Pink1 KO mice after PFF injection, thereby indicating neurodegeneration occurred not only in the nigrostriatal system but also in other brain regions, for example, MoCx (Supplementary Figure 3D, E). In WT mice, the involvement of PINK1 in the misfolded protein clearance pathway could result in the successful clearance of α-syn aggregates, the number of pS129-α-syn inclusions did not yet affect neuron loss in the whole brain. By contrast, in the absence of PINK1, impaired protein degradation might lead to prolonged increasing α-syn contents and a greater risk of misfolding and aggregation. Furthermore, failed autophagic degradation of full-length pS129-α-syn could produce a mitotoxic form of phosphorylated α-syn, pSyn*, a form of reactive and truncated pS129-α-syn without N and C terminal ends [54, 55]. Higher pS129-α-syn levels might consequently increase the chance to converse from full-length pS129-α-syn to pSyn*, which might explain the significant neurodegeneration that is significantly greater in Pink1 KO mice (Fig. 5G, H). Further studies examining the effect of PFF-triggered neurodegeneration on interneuron function should be performed in the future.
In addition, in Pink1 KO mice after PFF injection, early neuronal loss caused faster progression of motor impairment as evidenced by the hindlimb clasping score above all things. Significant neuronal loss at 120 dpi caused significant motor impairment based on the wire hang test and a higher clasping score in Pink1 KO compared with WT mice. Without PFF injection, Pink1 KO mice did not present with gross motor dysfunctions at the age of 20–27 months [56]. Meanwhile, Grant et al. showed that compared with WT rats, Pink1 KO rats developed early and progressive vocalization and oromotor deficits, but not motor phenotypes [57]. The deficits in our Pink1 KO mouse model provided more evidence about hidden phenotypes. Our study did not observe changes of motor coordination function in the rotarod test, similar to other published Pink1-deficient mouse models [21, 58]. To detect neuromuscular abnormalities in motor strength, our mouse groups underwent sequential wire hang tests. WT mice had a weak performance at 90 dpi, and Pink1 KO mice exhibited poor performance at 90 and 120 dpi. Importantly, the hindlimb clasping assessment, a measure of striatal dysfunction [59], showed a defect in PFF-injected Pink1 KO mice at 60 dpi, which is associated with striatal dopaminergic degeneration. The limb clasping phenotype of Pink1 KO mice was progressive and more severe at 120 dpi compared with that of WT mice (Fig. 5K). These data demonstrated that Pink1 KO mice could develop early-onset and progressive neurological deterioration in a time-dependent manner. The observations were indicative of early-onset PINK1-associated Parkinsonism. Moreover, our PD Pink1 KO mouse model showed prominent pS129-α-syn deposits in the amygdala from 14 days after PFF injection compared with WT mice (Supplementary Figure 1), which were not observed in the PD Pink1 KO rat model of Creed and Goldberg [24]. This finding could explain the presence of anxiety in Pink1 KO mice based on the open field test [46] and psychotic/psychiatric symptoms among patients with PINK1-related PD [13–16].
Hence, we suggest that the intrastriatal PFF injection might be associated with α-syn pathology, which was in accordance with PD pathology and was exacerbated in Pink1 KO mice compared with WT mice. The PFF-injected Pink1 KO animal model might be useful for studying mechanisms and for developing therapeutic approaches due to the following advantages—the robust α-syn pathology was associated with bilaterally progressive neurodegeneration, and the model could provide the most combination of evidence for PD pathogenesis, which includes mitochondrial dysfunction with loss of function PINK1 and inflammation.
In conclusion, loss of Pink1 function accelerated the aggregation and accumulation of α-syn and, consequently, led to early and significant neurodegeneration and behavioral impairment in the PD mouse model. Loss of PINK1 enhanced microglial/astrocytic activation, sustained astrocytic activation, and aggravated PP2A phosphorylation (dysfunctional PP2A) and, subsequently, increased phosphorylated α-syn depositions. Moreover, glial hyperactivation could lead to neuronal death (Supplementary Figure 5). Therefore, our findings support the notion that PINK1 dysfunction increased the risk of synucleinopathy.
Nevertheless, further studies must be conducted to better understand the detailed molecular mechanisms of PINK1 dysfunction contributing α-syn pathology and the long-term change in synucleinopathy and neurodegeneration caused by PINK1 dysfunction.
ACKNOWLEDGMENTS
We are grateful to Yoon Kyoung Lee, MS, Hallym Neurological Institute, Hallym University, 291, Simin-daero, Dongan-gu, Anyang-si, Gyeonggi-do, South Korea for technical assistance.
This research was supported by Hallym University Research Fund and the National Research Foundation of Korea (NRF) grant funded by the Korean government (MSIT) (2017R1C1B5076402 and 2020R1F1A1076697).
CONFLICT OF INTEREST
The authors have no financial conflict of interest related to this study.
SUPPLEMENTARY MATERIAL
[1] The supplementary material is available in the electronic version of this article: https://dx.doi.org/10.3233/JPD-213065.
REFERENCES
[1] | Marino BLB , de Souza LR , Sousa KPA , Ferreira JV , Padilha EC , da Silva C , Taft CA , Hage-Melim LIS ((2020) ) Parkinson’s disease: a review from pathophysiology to treatment. Mini Rev Med Chem 20: , 754–767. |
[2] | Maiti P , Manna J , Dunbar GL ((2017) ) Current understanding of the molecular mechanisms in Parkinson’s disease: Targets for potential treatments. Transl Neurodegener 6: , 28. |
[3] | Kouli A , Torsney KM , Kuan WL ((2018) ) Parkinson’s disease: etiology, neuropathology, and pathogenesis. In Parkinson’s Disease: Pathogenesis and Clinical Aspects, Stoker TB, Greenland JC, eds., Brisbane (AU). |
[4] | Ge P , Dawson VL , Dawson TM ((2020) ) PINK1 and Parkin mitochondrial quality control: a source of regional vulnerability in Parkinson’s disease. Mol Neurodegener 15: , 20. |
[5] | Matheoud D , Cannon T , Voisin A , Penttinen AM , Ramet L , Fahmy AM , Ducrot C , Laplante A , Bourque MJ , Zhu L , Cayrol R , Le Campion A , McBride HM , Gruenheid S , Trudeau LE , Desjardins M ((2019) ) Intestinal infection triggers Parkinson’s disease-like symptoms in Pink1(-/-) mice. Nature 571: , 565–569. |
[6] | Valente EM , Abou-Sleiman PM , Caputo V , Muqit MMK , Harvey K , Gispert S , Ali Z , Del Turco D , Bentivoglio AR , Healy DG , Albanese A , Nussbaum R , Gonzalez-Maldonaldo R , Deller T , Salvi S , Cortelli P , Gilks WP , Latchman DS , Harvey RJ , Dallapiccola B , Auburger G , Wood NW ((2004) ) Hereditary early-onset Parkinson’s disease caused by mutations in PINK1. Science 304: , 1158–1160. |
[7] | Aasly JO ((2020) ) Long-term outcomes of genetic Parkinson’s disease. J Mov Disord 13: , 81–96. |
[8] | Goncalves FB , Morais VA ((2021) ) PINK1: a bridge between mitochondria and Parkinson’s disease. Life-Basel 11: , 371. |
[9] | Tan EK , Yew K , Chua E , Puvan K , Shen H , Lee E , Puong KY , Zhao Y , Pavanni R , Wong MC , Jamora D , de Silva D , Moe KT , Woon FP , Yuen Y , Tan L ((2006) ) PINK1 mutations in sporadic early-onset Parkinson’s disease. Mov Disord 21: , 789–793. |
[10] | Criscuolo C , Volpe G , De Rosa A , Varrone A , Marongiu R , Mancini P , Salvatore E , Dallapiccola B , Filla A , Valente EM , De Michele G ((2006) ) PINK1 homozygous W437X mutation in a patient with apparent dominant transmission of Parkinsonism. Mov Disord 21: , 1265–1267. |
[11] | Ando M , Fiesel FC , Hudec R , Caulfield TR , Ogaki K , Gorka-Skoczylas P , Koziorowski D , Friedman A , Chen L , Dawson VL , Dawson TM , Bu GJ , Ross OA , Wszolek ZK , Springer W ((2017) ) The PINK1 p.I368N mutation affects protein stability and ubiquitin kinase activity. Mol Neurodegener 12: , 32. |
[12] | Siuda J , Jasinska-Myga B , Boczarska-Jedynak M , Opala G , Fiesel FC , Moussaud-Lamodiere EL , Scarffe LA , Dawson VL , Ross OA , Springer W , Dawson TM , Wszolek ZK ((2014) ) Early-onset Parkinson’s disease due to PINK1 p.Q456X mutation - Clinical and functional study. Parkinsonism Relat Disord 20: , 1274–1278. |
[13] | Kasten M , Hartmann C , Hampf J , Schaake S , Westenberger A , Vollstedt EJ , Balck A , Domingo A , Vulinovic F , Dulovic M , Zorn I , Madoev H , Zehnle H , Lembeck CM , Schawe L , Reginold J , Huang J , Konig IR , Bertram L , Marras C , Lohmann K , Lill CM , Klein C ((2018) ) Genotype-phenotype relations for the Parkinson’s disease genes Parkin, PINK1, DJ1: MDSGene systematic review. Mov Disord 33: , 730–741. |
[14] | Ephraty L , Porat O , Israeli D , Cohen OS , Tunkel O , Yael S , Hatano Y , Hattori N , Hassin-Baer S ((2007) ) Neuropsychiatric and cognitive features in autosomal-recessive early Parkinsonism due to PINK1 mutations. Mov Disord 22: , 566–569. |
[15] | Ricciardi L , Petrucci S , Guidubaldi A , Ialongo T , Serra L , Ferraris A , Spano B , Bozzali M , Valente EM , Bentivoglio AR ((2014) ) Phenotypic variability of PINK1 expression: 12 years’ clinical follow-up of two Italian families. Mov Disord 29: , 1561–1566. |
[16] | Piredda R , Desmarais P , Masellis M , Gasca-Salas C ((2020) ) Cognitive and psychiatric symptoms in genetically determined Parkinson’s disease: a systematic review. Eur J Neurol 27: , 229–234. |
[17] | Samaranch L , Lorenzo-Betancor O , Arbelo JM , Ferrer I , Lorenzo E , Irigoyen J , Pastor MA , Marrero C , Isla C , Herrera-Henriquez J , Pastor P ((2010) ) PINK1-linked parkinsonism is associated with Lewy body pathology. Brain 133: , 1128–1142. |
[18] | Steele JC , Guella I , Szu-Tu C , Lin MK , Thompson C , Evans DM , Sherman HE , Vilarino-Guell C , Gwinn K , Morris H , Dickson DW , Farrer MJ ((2015) ) Defining neurodegeneration on Guam by targeted genomic sequencing. Ann Neurol 77: , 458–468. |
[19] | Nybo CJ , Gustavsson EK , Farrer MJ , Aasly JO ((2020) ) Neuropathological findings in PINK1-associated Parkinson’s disease. Parkinsonism Relat Disord 78: , 105–108. |
[20] | Takanashi M , Li YZ , Hattori N ((2016) ) Absence of Lewy pathology associated with PINK1 homozygous mutation. Neurology 86: , 2212–2213. |
[21] | Zhou HX , Falkenburger BH , Schulz JB , Tieu K , Xu ZS , Xia XG ((2007) ) Silencing of the Pink1 gene expression by conditional RNAi does not induce dopaminergic neuron death in mice. Int J Biol 3: , 242–250. |
[22] | Taylor TN , Greene JG , Miller GW ((2010) ) Behavioral phenotyping of mouse models of Parkinson’s disease. Behav Brain Res 211: , 1–10. |
[23] | Dave KD , De Silva S , Sheth NP , Ramboz S , Beck MJ , Quang CY , Switzer RC , Ahmad SO , Sunkin SM , Walker D , Cui XX , Fisher DA , McCoy AM , Gamber K , Ding XD , Goldberg MS , Benkovic SA , Haupt M , Baptista MAS , Fiske BK , Sherer TB , Frasier MA ((2014) ) Phenotypic characterization of recessive gene knockout rat models of Parkinson’s disease. Neurobiol Dis 70: , 190–203. |
[24] | Creed RB , Goldberg MS ((2020) ) Enhanced susceptibility of PINK1 knockout rats to alpha-synuclein fibrils. Neuroscience 437: , 64–75. |
[25] | Oliveras-Salva M , Macchi F , Coessens V , Deleersnijder A , Gerard M , Van der Perren A , Van den Haute C , Baekelandt V ((2014) ) Alpha-synuclein-induced neurodegeneration is exacerbated in PINK1 knockout mice. Neurobiol Aging 35: , 2625–2636. |
[26] | Choi I , Kim J , Jeong HK , Kim B , Jou I , Park SM , Chen LN , Kang UJ , Zhuang XX , Joe EH ((2013) ) Pink1 deficiency attenuates astrocyte proliferation through mitochondrial dysfunction, reduced akt and increased p38 mapk activation, and downregulation of EGFR. Glia 61: , 800–812. |
[27] | Lai TT , Kim YJ , Nguyen PT , Koh YH , Nguyen TT , Ma HI , Kim YE ((2021) ) Temporal evolution of inflammation and neurodegeneration with alpha-synuclein propagation in Parkinson’s disease mouse model. Front Integr Neurosci 15: , 715190. |
[28] | Baviskar SN ((2011) ) A quick & automated method for measuring cell area using ImageJ. Am Biol Teach 73: , 554–556. |
[29] | Paumier KL , Luk KC , Manfredsson FP , Kanaan NM , Lipton JW , Collier TJ , Steece-Collier K , Kemp CJ , Celano S , Schulz E , Sandoval IM , Fleming S , Dirr E , Polinski NK , Trojanowski JQ , Lee VM , Sortvvell CE ((2015) ) Intrastriatal injection of pre-formed mouse alpha-synuclein fibrils into rats triggers alpha-synuclein pathology and bilateral nigrostriatal degeneration. Neurobiol Dis 82: , 185–199. |
[30] | Lee KW , Chen W , Junn E , Im JY , Grosso H , Sonsalla PK , Feng X , Ray N , Fernandez JR , Chao Y , Masliah E , Voronkov M , Braithwaite SP , Stock JB , Mouradian MM ((2011) ) Enhanced phosphatase activity attenuates alpha-synucleinopathy in a mouse model. J Neurosci 31: , 6963–6971. |
[31] | Perez-Revuelta BI , Hettich MM , Ciociaro A , Rotermund C , Kahle PJ , Krauss S , Di Monte DA ((2014) ) Metformin lowers Ser-129 phosphorylated alpha-synuclein levels via mTOR-dependent protein phosphatase 2A activation. Cell Death Dis 5: , e1209. |
[32] | Wu J , Lou H , Alerte TNM , Stachowski EK , Chen J , Singleton AB , Hamilton RL , Perez RG ((2012) ) Lewy-like aggregation of alpha-synuclein reduces protein phosphatase 2A activity in vitro and in vivo. Neuroscience 207: , 288–297. |
[33] | Yang WW , Wang X , Liu J , Duan CL , Gao G , Lu LL , Yu S , Yang H ((2018) ) PINK1 suppresses alpha-synuclein-induced neuronal injury: a novel mechanism in protein phosphatase 2A activation. Oncotarget 9: , 37–53. |
[34] | Gusel’nikova VV , Korzhevskiy DE ((2015) ) NeuN as a neuronal nuclear antigen and neuron differentiation marker. Acta Naturae 7: , 42–47. |
[35] | Creed RB , Goldberg MS ((2019) ) Analysis of alpha-synuclein pathology in PINK1 knockout rat brains. Front Neurosci 12: , 1034. |
[36] | Blesa J , Trigo-Damas I , Quiroga-Varela A , Jackson-Lewis VR ((2015) ) Oxidative stress and Parkinson’s disease. Front in Neuroanat 9: , 91. |
[37] | Puspita L , Chung SY , Shim JW ((2017) ) Oxidative stress and cellular pathologies in Parkinson’s disease. Mol Brain 10: , 53. |
[38] | Chung SY , Kishinevsky S , Mazzulli JR , Graziotto J , Mrejeru A , Mosharov EV , Puspita L , Valiulahi P , Sulzer D , Milner TA , Taldone T , Krainc D , Studer L , Shim JW ((2016) ) Parkin and PINK1 patient iPSC-derived midbrain dopamine neurons exhibit mitochondrial dysfunction and alpha-synuclein accumulation. Stem Cell Rep 7: , 664–677. |
[39] | Liu J , Wang X , Lu YQ , Duan CL , Gao G , Lu LL , Yang H ((2017) ) Pink1 interacts with alpha-synuclein and abrogates alpha-synuclein-induced neurotoxicity by activating autophagy. Cell Death Dis 8: , e3056. |
[40] | Di Maio R , Barrett PJ , Hoffman EK , Barrett CW , Zharikov A , Borah A , Hu XP , Mccoy J , Chu CT , Burton EA , Hastings TG , Greenamyre JT ((2016) ) Alpha-Synuclein binds to TOM20 and inhibits mitochondrial protein import in Parkinson’s disease. Sci Transl Med 8: , 342ra78. |
[41] | Torres-Odio S , Key J , Hoepken HH , Canet-Pons J , Valek L , Roller B , Walter M , Morales-Gordo B , Meierhofer D , Harter PN , Mittelbronn M , Tegeder I , Gispert S , Auburger G ((2017) ) Progression of pathology in PINK1-deficient mouse brain from splicing via ubiquitination, ER stress, and mitophagy changes to neuroinflammation. J Neuroinflammation 14: , 154. |
[42] | Izco M , Blesa J , Verona G , Cooper JM , Alvarez-Erviti L ((2021) ) Glial activation precedes alpha-synuclein pathology in a mouse model of Parkinson’s disease. Neurosci Res 170: , 330–340. |
[43] | Gkikas I , Palikaras K , Tavernarakis N ((2018) ) The role of mitophagy in innate immunity. Front Immunol 9: , 1283. |
[44] | Sliter DA , Martinez J , Hao L , Chen X , Sun N , Fischer TD , Burman JL , Li Y , Zhang Z , Narendra DP , Cai HB , Borsche M , Klein C , Youle RJ ((2018) ) Parkin and PINK1 mitigate STING-induced inflammation. Nature 561: , 258–262. |
[45] | Sun LK , Shen RF , Agnihotri SK , Chen Y , Huang ZW , Bueler H ((2018) ) Lack of PINK1 alters glia innate immune responses and enhances inflammation-induced, nitric oxide-mediated neuron death. Sci Rep 8: , 383. |
[46] | Gispert S , Brehm N , Weil J , Seidel K , Rub U , Kern B , Walter M , Roeper J , Auburger G ((2015) ) Potentiation of neurotoxicity in double-mutant mice with Pink1 ablation and A53T-SNCA overexpression. Hum Mol Genet 24: , 1061–1076. |
[47] | Sorrentino ZA , Vijayaraghavan N , Gorion KM , Riffe CJ , Strang KH , Caldwell J , Giasson BI ((2018) ) Physiological C-terminal truncation of alpha-synuclein potentiates the prion-like formation of pathologicalal inclusions. J Biol Chem 293: , 18914–18932. |
[48] | Fedida-Metula S , Feldman B , Koshelev V , Levin-Gromiko U , Voronov E , Fishman D ((2012) ) Lipid rafts couple store-operated Ca2+entry to constitutive activation of PKB/Akt in a Ca2+/calmodulin-, Src- and PP2A-mediated pathway and promote melanoma tumor growth. Carcinogenesis 33: , 740–750. |
[49] | Yang W , Wang X , Duan C , Lu L , Yang H ((2013) ) Alpha-synuclein overexpression increases phospho-protein phosphatase 2A levels via formation of calmodulin/Src complex. Neurochem Int 63: , 180–194. |
[50] | Drapalo K , Jozwiak J ((2018) ) Parkin, PINK1 and DJ1 as possible modulators of mTOR pathway in ganglioglioma. Int J Neurosci 128: , 167–174. |
[51] | Janssens V , Goris J ((2001) ) Protein phosphatase 2A: a highly regulated family of serine/threonine phosphatases implicated in cell growth and signalling. Biochem J 353: , 417–439. |
[52] | Qi ZF , Yang WW , Liu YJ , Cui T , Gao H , Duan CL , Lu LL , Zhao CL , Zhao HY , Yang H ((2011) ) Loss of PINK1 function decreases PP2A activity and promotes autophagy in dopaminergic cells and a murine model. Neurochem Int 59: , 572–581. |
[53] | Kordower JH , Olanow CW , Dodiya HB , Chu YP , Beach TG , Adler CH , Halliday GM , Bartus RT ((2013) ) Disease duration and the integrity of the nigrostriatal system in Parkinson’s disease. Brain 136: , 2419–2431. |
[54] | Grassi D , Howard S , Zhou MH , Diaz-Perez N , Urban NT , Guerrero-Given D , Kamasawa N , Volpicelli-Daley LA , LoGrasso P , Lasmezas CI ((2018) ) Identification of a highly neurotoxic alpha-synuclein species inducing mitochondrial damage and mitophagy in Parkinson’s disease. Proc Natl Acad Sci U S A 115: , E2634–E2643. |
[55] | Grassi D , Diaz-Perez N , Volpicelli-Daley LA , Lasmezas CI ((2019) ) P alpha-syn* mitotoxicity is linked to MAPK activation and involves tau phosphorylation and aggregation at the mitochondria. Neurobiol Dis 124: , 248–262. |
[56] | Glasl L , Kloos K , Giesert F , Roethig A , Di Benedetto B , Kuhn R , Zhang JZ , Hafen U , Zerle J , Hofmann A , de Angelis MH , Winklhofer KF , Holter SM , Weisenhorn DMV , Wurst W ((2012) ) Pink1-deficiency in mice impairs gait, olfaction and serotonergic innervation of the olfactory bulb. Exp Neurol 235: , 214–227. |
[57] | Grant LM , Kelm-Nelson CA , Hilby BL , Blue KV , Rajamanickam ESP , Pultorak JD , Fleming SM , Ciucci MR ((2015) ) Evidence for early and progressive ultrasonic vocalization and oromotor deficits in a PINK1 gene knockout rat model of Parkinson’s disease. J Neurosci Res 93: , 1713–1727. |
[58] | Gispert S , Ricciardi F , Kurz A , Azizov M , Hoepken HH , Becker D , Voos W , Leuner K , Muller WE , Kudin AP , Kunz WS , Zimmermann A , Roeper J , Wenzel D , Jendrach M , Garcia-Arencibia M , Fernandez-Ruiz J , Huber L , Rohrer H , Barrera M , Reichert AS , Rub U , Chen A , Nussbaum RL , Auburger G ((2009) ) Parkinson phenotype in aged PINK1-deficient mice is accompanied by progressive mitochondrial dysfunction in absence of neurodegeneration. Plos One 4: , e5777. |
[59] | Zhang JP , Saur T , Duke AN , Grant SGN , Platt DM , Rowlett JK , Isacson O , Yao WD ((2014) ) Motor impairments, striatal degeneration, and altered dopamine-glutamate interplay in mice lacking PSD-95. J Neurogenet 28: , 98–111. |


