
Differentiating Parkinson’s Disease from Essential Tremor Using Transcranial Sonography: A Systematic Review and Meta-Analysis
Abstract
Background:
Essential tremor (ET) and the tremor of Parkinson’s disease (PD) are the most common tremors encountered in clinical practice. Especially in early disease stages, discrimination between the tremors of ET and PD can be challenging.
Objective:
The aim of this study was to evaluate the diagnostic accuracy of transcranial sonography (TCS) of the substantia nigra echogenicity for differential diagnosis of PD versus ET.
Methods:
A systematic PubMed search identified 512 studies. Sensitivity and specificity of substantia nigra hyperechogenicity was estimated. Data synthesis was carried applying a random effects bivariate binomial model. To assess study quality and risk of bias, the QUADAS-2 tool was used.
Results:
Eighteen studies were suitable for analysis including 1,264 PD and 824 ET patients. The meta analysis showed a pooled sensitivity and specificity for TCS in the differential diagnosis of PD versus ET of 84.6% (95% CI, 79.4–88.6%) and 83.9% (95% CI, 78.4–88.2%), respectively. Furthermore, we found nearly similar results in sensitivity and specificity comparing TCS and DaTSCAN in a subgroup-analysis of three studies using both diagnostic tools including 107 patients with PD and 62 patients with ET. The QUADAS-2 toolbox revealed a high risk of bias regarding the methodological quality of patient selection.
Conclusion:
Substantia nigra hyperechogenicity yield high diagnostic accuracy for the discrimination of PD from ET. TCS is a low cost, widely available, non-invasive marker without radiation Therefore, a diagnostic algorithm based on presence or absence of substantia nigra hyperechogenicity is highly warranted.
INTRODUCTION
Parkinson’s disease (PD) is a progressive neurodegenerative disease characterized by resting tremor, rigidity, bradykinesia, abnormal gait, and posture. The diagnostic gold standard is postmortem neuropathological examination. The diagnosis is based on clinical signs and symptoms [1]. While in cases presenting with fully developed classic motor features, the clinical diagnosis of PD appears to be straightforward, rates of misdiagnosis can be as high as 24% early in the disease, even in specialized centers [2]. Indeed, the most common misclassifications in clinicopathological series are neurodegenerative atypical parkinsonian disorders, whereas in clinically based studies essential tremor (ET), drug-induced parkinsonism, and vascular parkinsonism are common misdiagnoses [2]. Neuroimaging including presynaptic dopaminergic terminal radiotracer-imaging or MRI [3–5] may help in the diagnostic work-flow of these patients.
ET is one of the most common movement disorders among adults characterized by a kinetic tremor. Furthermore, additional clinical characteristics have been associated with the disorder, including ataxic gait and non-motor symptoms like depression, mild cognitive impairment, and dementia [6].
A recent meta-analysis revealed a high diagnostic performance of substantia nigra hyperechogenicity (SN+) by transcranial sonography (TCS) in differentiating patients with PD from both normal controls and participants with other parkinsonian syndromes. The aim of this review and meta-analysis was to evaluate the diagnostic accuracy of TCS for the differential diagnosis of PD versus ET.
METHODS
Search strategies and study selection
Three raters (BH, JH, KS) systematically searched the electronic MEDLINE database PubMed by two combination of terms as ((((nigra substantia [MeSH Major Topic]) OR ((((echogen* [Title/Abstract]) OR (ultrasound [Title/Abstract])) OR (sonograph* [Title/Abstract])) OR (transcranial [Title/Abstract]))) AND (tremor [Title/Abstract])) OR (((nigra substantia [MeSH Major Topic]) OR ((((echogen* [Title/Abstract]) OR (ultrasound [Title/Abstract])) OR (sonograph* [Title/Abstract])) OR (transcranial [Title/Abstract]))) AND ((benign essential tremors [MeSH Terms])))) NOT (review [Publication Type]). The three raters searched various alterations in spelling due to the pronounced heterogeneity. The final search was conducted on the 1 September 2021 and resulted in a total of 512 articles. Detailed search strategies are given in Supplementary Table 1.
For this meta-analysis, we included TCS in order to distinguish PD from ET patients. For further analysis papers had to satisfy the following, predefined eligibility criteria: 1) Manuscripts were required to be published in English language; 2) PD and ET patients were included in the study; 3) Studies were required to either report true positive (TP), true negative (TN), false positive (FP), and false negative (FN) rates, or overall sample size and sensitivity and specificity values. Our meta-analysis complied with the Preferred Reporting Items for Systematic Reviews and Meta-Analyses (PRISMA) statement [7]. Studies comparing structural parameters between other neurodegenerative diseases or healthy controls (HC) only were not included. We performed also a sensitivity analysis including three studies, which have been excluded from the primary analysis due to methodological concerns.
Table 1
Overview of included studies with demographic data
| Author | PD/ET N all patients screened | Bone window (PD/ET) | m/f | Disease duration ET patients | Disease duration ET patients | Hoehn & Yahr | UPDRS III PD patients | UPDRS III ET patients | Age PD patients | Age ET patients |
| Alonso-Canovas et al. 2014 [19] | 105/57 | 96/50 | n.a. | n.a. | n.a. | n.a. | n.a. | n.a. | 72.5±10.2 | 72.5±10.8 |
| Bartova et al. 2014 [20] | 29/11 | 29/11 | 26/14 | 39.18±9.64 | 18.67±12.2 | 2 (1–3)* | 24.87±9.6 | 5.82±1.25 | 56.9±10.3 | 55.5±6.2 |
| Budisic et al. 2009 [16] | 80/30 | 70/30 | n.a. | n.a. | 5 (1–19)* | 2 (1–5)* | 18.3±6.4 | n.a. | 62.4±10 | 60.2±9 |
| Cardaioli et al. 2019 [12] | 79/59 | 74/36 | 87/51 | 7.1±6.1 | 6.9±5.3 | 2 (1–4)* | 20.4±10.4 | n.a. | 69.4±9.9 | 71.5±10.5 |
| Chen et al. 2012 [29] | 37/26 | 37/26 | 40/23 | 12.0±10.8 | 3.6±3.1 | 1-2: n = 28, 2.5–4: n = 9 | 17.8±12.3 | n.a. | 63.8±8.7 | 59.1±12.3 |
| Chitsaz et al. 2013 [21] | 50/48 | 43/43 | 43/43 | 5.1 (2–8)* | 5.5 (3–7)* | n.a. | n.a. | n.a. | 63.39±11.49 | 59.44±10.03 |
| Doepp et al. 2008 [22] | 46/25 | 46/25 | 49/22 | 3.0±2.3 | 2.5±1.5 | n.a. | 10.9±5.5 | 5.0±2.2 | 64±10 | 64±12 |
| Grippe et al. 2018 [13] | 39/11 | 39/11 | n.a. | n.a. | n.a. | n.a. | n.a. | n.a. | n.a. | n.a. |
| Jesus-Ribeiro et al. 2016 [25] | 32/26 | 32/26 | 35/28 | 5.5 (2)* | 2.0 (1)* | n.a. | n.a. | n.a. | 62 (13)* | 65 (15)* |
| Kim et al. 2012 [27] | 86/100 | 47/64 | 32/79 | 6.8±8.1 | 1.8±1.6 | n.a. | n.a. | n.a. | 66.6±11.7 | 62.8±12.2 |
| Lauckaite et al. 2012 [14] | 71/58 | 71/58 | 64/65 | 5 (2–11)* | 3 (2–6)* | 2 (1–2)* | 12.63±1.73 | n.a. | 63.8±10.1 | 63.5±12.6 |
| Lauckaite et al. 2014 [15] | 141/116 | 141/116 | 114/143 | 5 (1–10)* | 3 (1–6)* | 1.8±0.8 | 14 (9–20) | 4 (1–6) | 64.4±11.2 | 63.9±14.4 |
| Lopez Hernandez et al. 2015 [18] | 30/21 | 30/21 | 37/14 | 6.3±3.2 | 2.1±0.9 | n.a. | n.a. | n.a. | 70±10 | 67±10 |
| Richter et al. 2017 [17] | 31/16 | 31/16 | 29/18 | 8.4±11.0 | 9.5±6.5 | 2.1±0.7 | 32.0±20.2 | 7.6±3.4 | 67.1±8.3 | 62.6±12.9 |
| Stenc Bradvica et al. 2015 [26] | 59/51 | 59/51 | 52/58 | n.a. | n.a. | n.a. | n.a. | n.a. | 67.2±7.6 | 65.2±8.8 |
| Stockner et al. 2007 [23] | 100/44 | 100/44 | 89/55 | 19.4±16.3 | 9.27±6.8 | n.a. | n.a. | n.a. | 65.2±8.6 | 66.2±10.8 |
| Tao et al. 2020 [24] | 119/106 | 119/106 | 148/77 | 5.3±2.4 | 3.2±1.5 | 1.6±0.6 | 20.5±6.3 | 7.2±2.5 | 61.7±8.9 | 63.2±9.6 |
| Wang et al. 2021 [28] | 500 | 200/90 | 179/111 | 3.8±2.3 | 3.5±1.7 | 3.4±0.8 | 28.8±8.8 | n.a. | 62.6±7.3 | 51.4±8.2 |
All values given in mean±standard deviation unless stated different; *median (IQR); + gender distribution is given either of all patients screened or of patients included in the analysis.
Table 2
Results of meta-analysis with cut-offs, sensitivity, and specificity for all included studies with demographic details
| Author | TP | FN | FP | TN | Cut-off (SN+) | Sens | Spec |
| Alonso-Canovas et al. 2014 [19] | 80 | 16 | 5 | 45 | 0.21 cm2 | 83.0 | 90.0 |
| Bartova et al. 2014 [20] | 26 | 3 | 2 | 9 | 0.25 cm2 | 89.6 | 81.8 |
| Budisic et al. 2009 [16] | 64 | 6 | 4 | 26 | 0.20 cm2 | 91.4 | 86.7 |
| Cardaioli et al. 2019 [12] | 56 | 18 | 10 | 26 | 0.14 cm2 | 75.0 | 72.0 |
| Chen et al. 2012 [29] | 18 | 19 | 4 | 22 | 0.20 cm2 | 48.7 | 84.6 |
| Chitsaz et al. 2013 [21] | 39 | 4 | 7 | 36 | 0.20 cm2 | 90.7 | 83.7 |
| Doepp et al. 2008 [22] | 36 | 10 | 2 | 23 | 0.20 cm2 | 78.0 | 92.0 |
| Grippe et al. 2018 [13] | 37 | 2 | 1 | 10 | 0.20 cm2 | 93.9 | 95.2 |
| Jesus-Ribeiro et al. 2016 [25] | 28 | 4 | 1 | 25 | 0.24 cm2 | 87.5 | 96.2 |
| Kim et al. 2012 [27] | 35 | 12 | 8 | 56 | 0.20 cm2 | 74.5 | 87.5 |
| Lauckaite et al. 2012 [14] | 66 | 5 | 26 | 32 | 0.20 cm2 | 91.8 | 55.2 |
| Lauckaite et al. 2014 [15] | 106 | 35 | 49 | 67 | 0.20 cm2 | 75.0 | 58.0 |
| Lopez Hernandez et al. 2015 [18] | 21 | 9 | 2 | 19 | 0.24 cm2 | 83.3 | 90.5 |
| Richter et al. 2017 [17] | 28 | 3 | 2 | 14 | 0.20 cm2 | 90.3 | 87.5 |
| Stenc Bradvica et al. 2015 [26] | 56 | 3 | 6 | 45 | 0.20 cm2 | 94.9 | 88.2 |
| Stockner et al. 2007 [23] | 75 | 25 | 7 | 37 | 0.24 cm2 | 75.0 | 84.0 |
| Tao et al. 2020 [24] | 108 | 11 | 10 | 96 | 0.20 cm2 | 91.2 | 90.5 |
| Wang et al. 2021 [28] | 162 | 38 | 19 | 71 | 0.25 cm2 | 81.0 | 75.4 |
FN, false negative; FP, false positive; Sens, sensitivity; SN+, substantia nigra hyperintensity; Spec, specificity; TN, true negative; TP, true positive.
Quality assessment
The Quality Assessment Tool for Diagnostic Accuracy Studies 2 (QUADAS-2) [8], which was rated and documented using Review Manager 5.3 (Nordic Cochrane Centre, Copenhagen, Denmark), was used to assess each study’s methodological quality regarding risk of bias and concerns regarding applicability. The assessment was performed by two independent raters (BH, MP) and discordant ratings were resolved in a discussion of the two raters. Data extraction was done for each paper by the two independent investigators.
Data analysis
For statistical analysis, the following data were extracted from each of the studies: 1) Number of participants in each group; 2) sensitivity and specificity, or alternatively, TP, TN, FP, and FN rates.
MetaDTA was used to assess diagnostic test accuracy [9, 10]. Chi2 tests were applied to assess heterogeneity of sensitivities and specificities, the null hypothesis being in both cases, that all studies are equal.
The sensitivities and specificities of each study were summarized using the hierarchical summary receiver operating characteristics (HSROC) curve approach [11] and are given with 95% confidence intervals (95% CI) (Supplementary Figure 1).
An additional meta-analysis was conducted to compare diagnostic accuracy between TCS and DaTSCAN including those three studies where a comparison of these two imaging modalities for differentiation between PD and ET was available.
RESULTS
Study characteristics
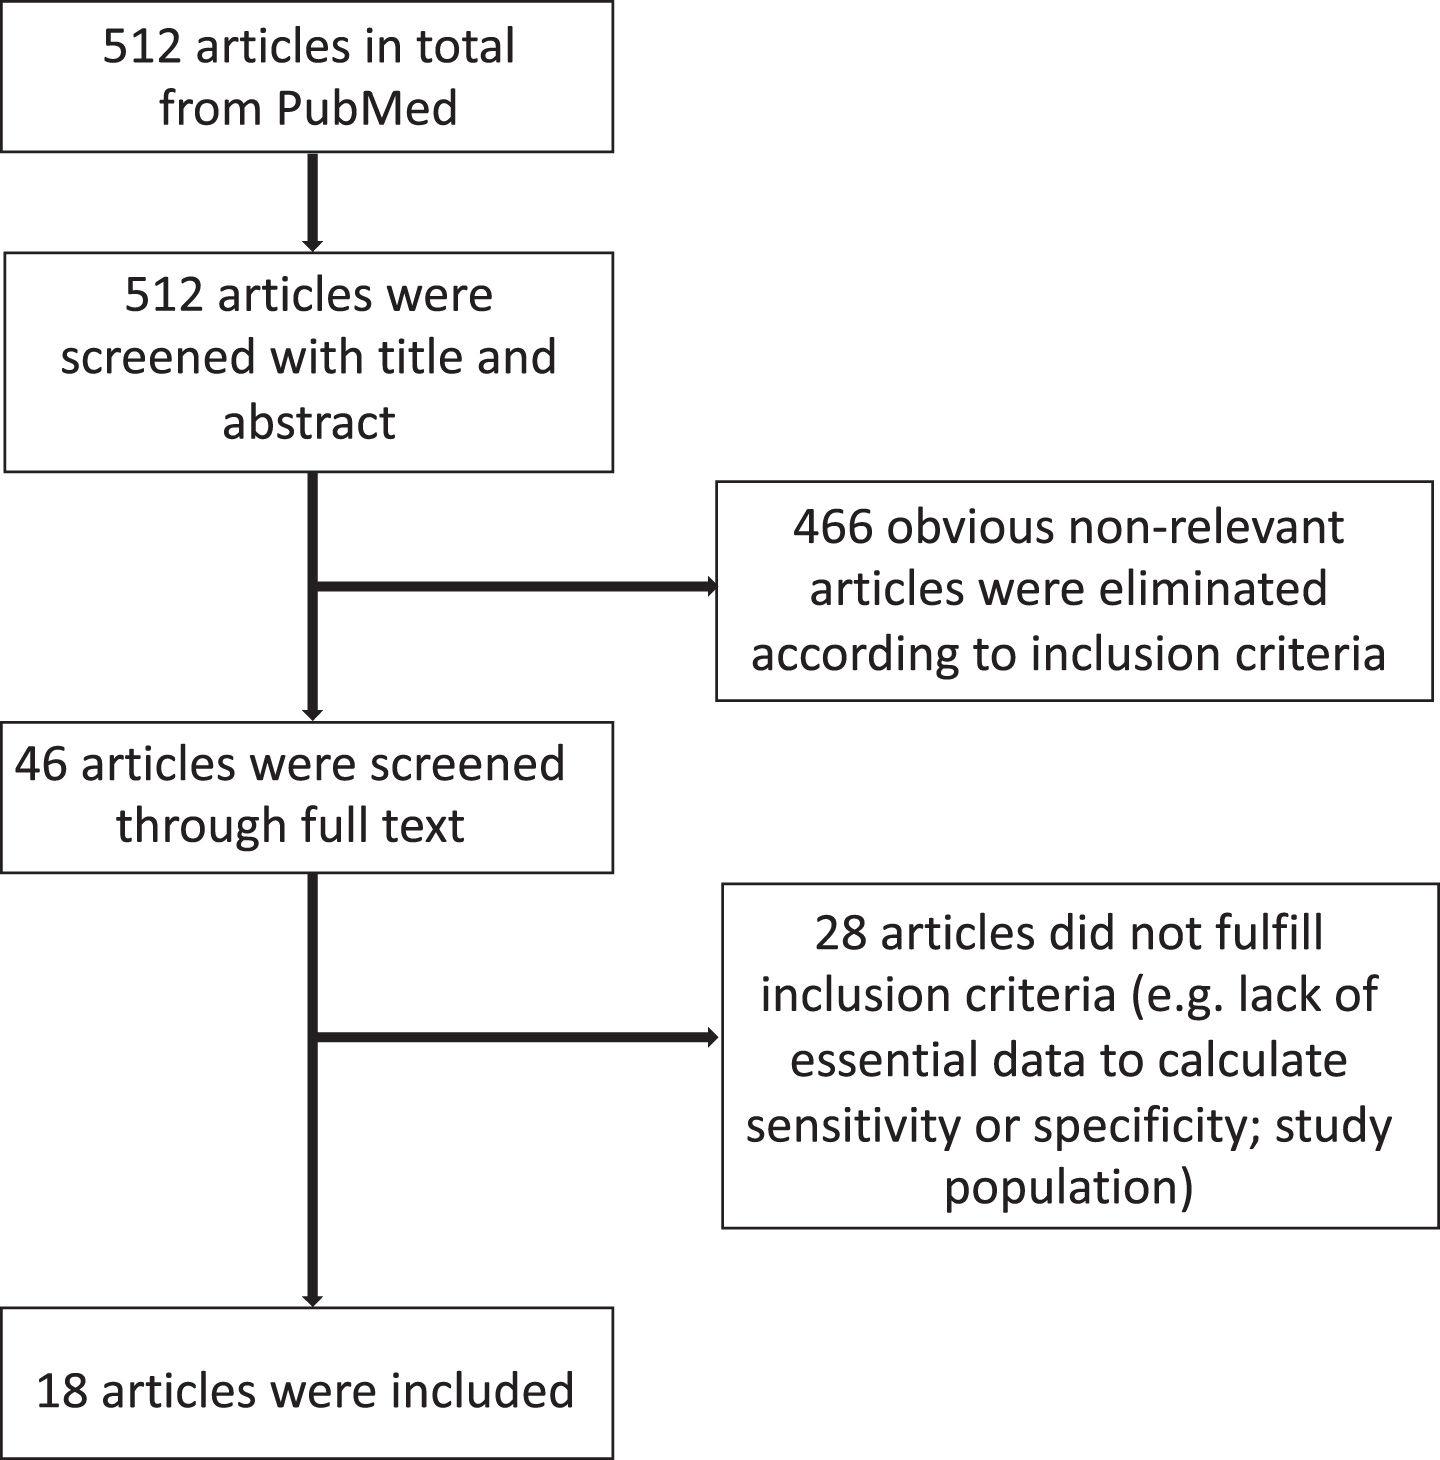
A total of 512 manuscripts were identified by the initial literature research. After review of the abstracts, 46 publications were selected. Eighteen studies satisfied the predefined criteria and were assessed [12–29]. A detailed flow chart of the review process is shown in Fig. 1.
Fig. 1
Flowchart for the identification of eligible studies.
All studies only included patients with sufficient temporal bone window in the final analysis. All studies except of two [14, 26] used established criteria for PD and ET as a reference standard, albeit the criteria used are not consistent between the studies: For PD diagnosis, two studies [12, 24] used the MDS clinical diagnostic criteria [30], thirteen studies [13–20, 23, 25, 27–29] used the UK Brain Bank Criteria [31, 32], two studies [21, 22] used the Gelb et al. criteria [33], and one study did not explicitly state which criteria for PD diagnosis were used [26]. For two studies, abnormal presynaptic dopaminergic terminal radiotracer-imaging as assessed with DaTSCAN was an inclusion criterion for patients with PD [25, 26]. For ET diagnosis, ten studies [12, 15–19, 23–25, 28] used the Consensus statement of the Movement Disorder Society on Tremor [34], four studies [13, 20, 27, 29] used criteria for the diagnosis of essential tremor [35], two studies [21, 22] used the diagnostic criteria for essential tremor [36], and two studies [14, 26] did not explicitly state which criteria were used.
All but two studies [13, 26] were prospectively conducted and reported blinded procedure. Interrater agreement was given in four studies and has shown to be very good in all studies [16, 17, 24, 25]. Six studies [12, 15, 20, 22, 25, 26] conducted DaTSCAN as well, but only three of the included studies [20, 22, 25] compared TCS and DaTSCAN results for differentiation between PD and ET, the other three studies used an abnormal DaTSCAN result as an inclusion criterion for PD patients.
We did not include the following four studies because of methodological concerns: Two of these reports assessed the predictive diagnostic accuracy of TCS in patients with unclear parkinsonism of recent onset [40, 41]. Another study evaluated the combined assessment of motor asymmetry, hyposmia, and SN + for the diagnosis of PD [42]. Due to missing information on the frequency of an insufficient bone window across the diagnostic categories in the study, neither sensitivity and specificity, nor TP, TN, FP, and FN rates of SN + in the ET and PD groups could be calculated.
Finally, another report assessed SN + only by visual inspection without measuring the nigral echogenicity manually [39].
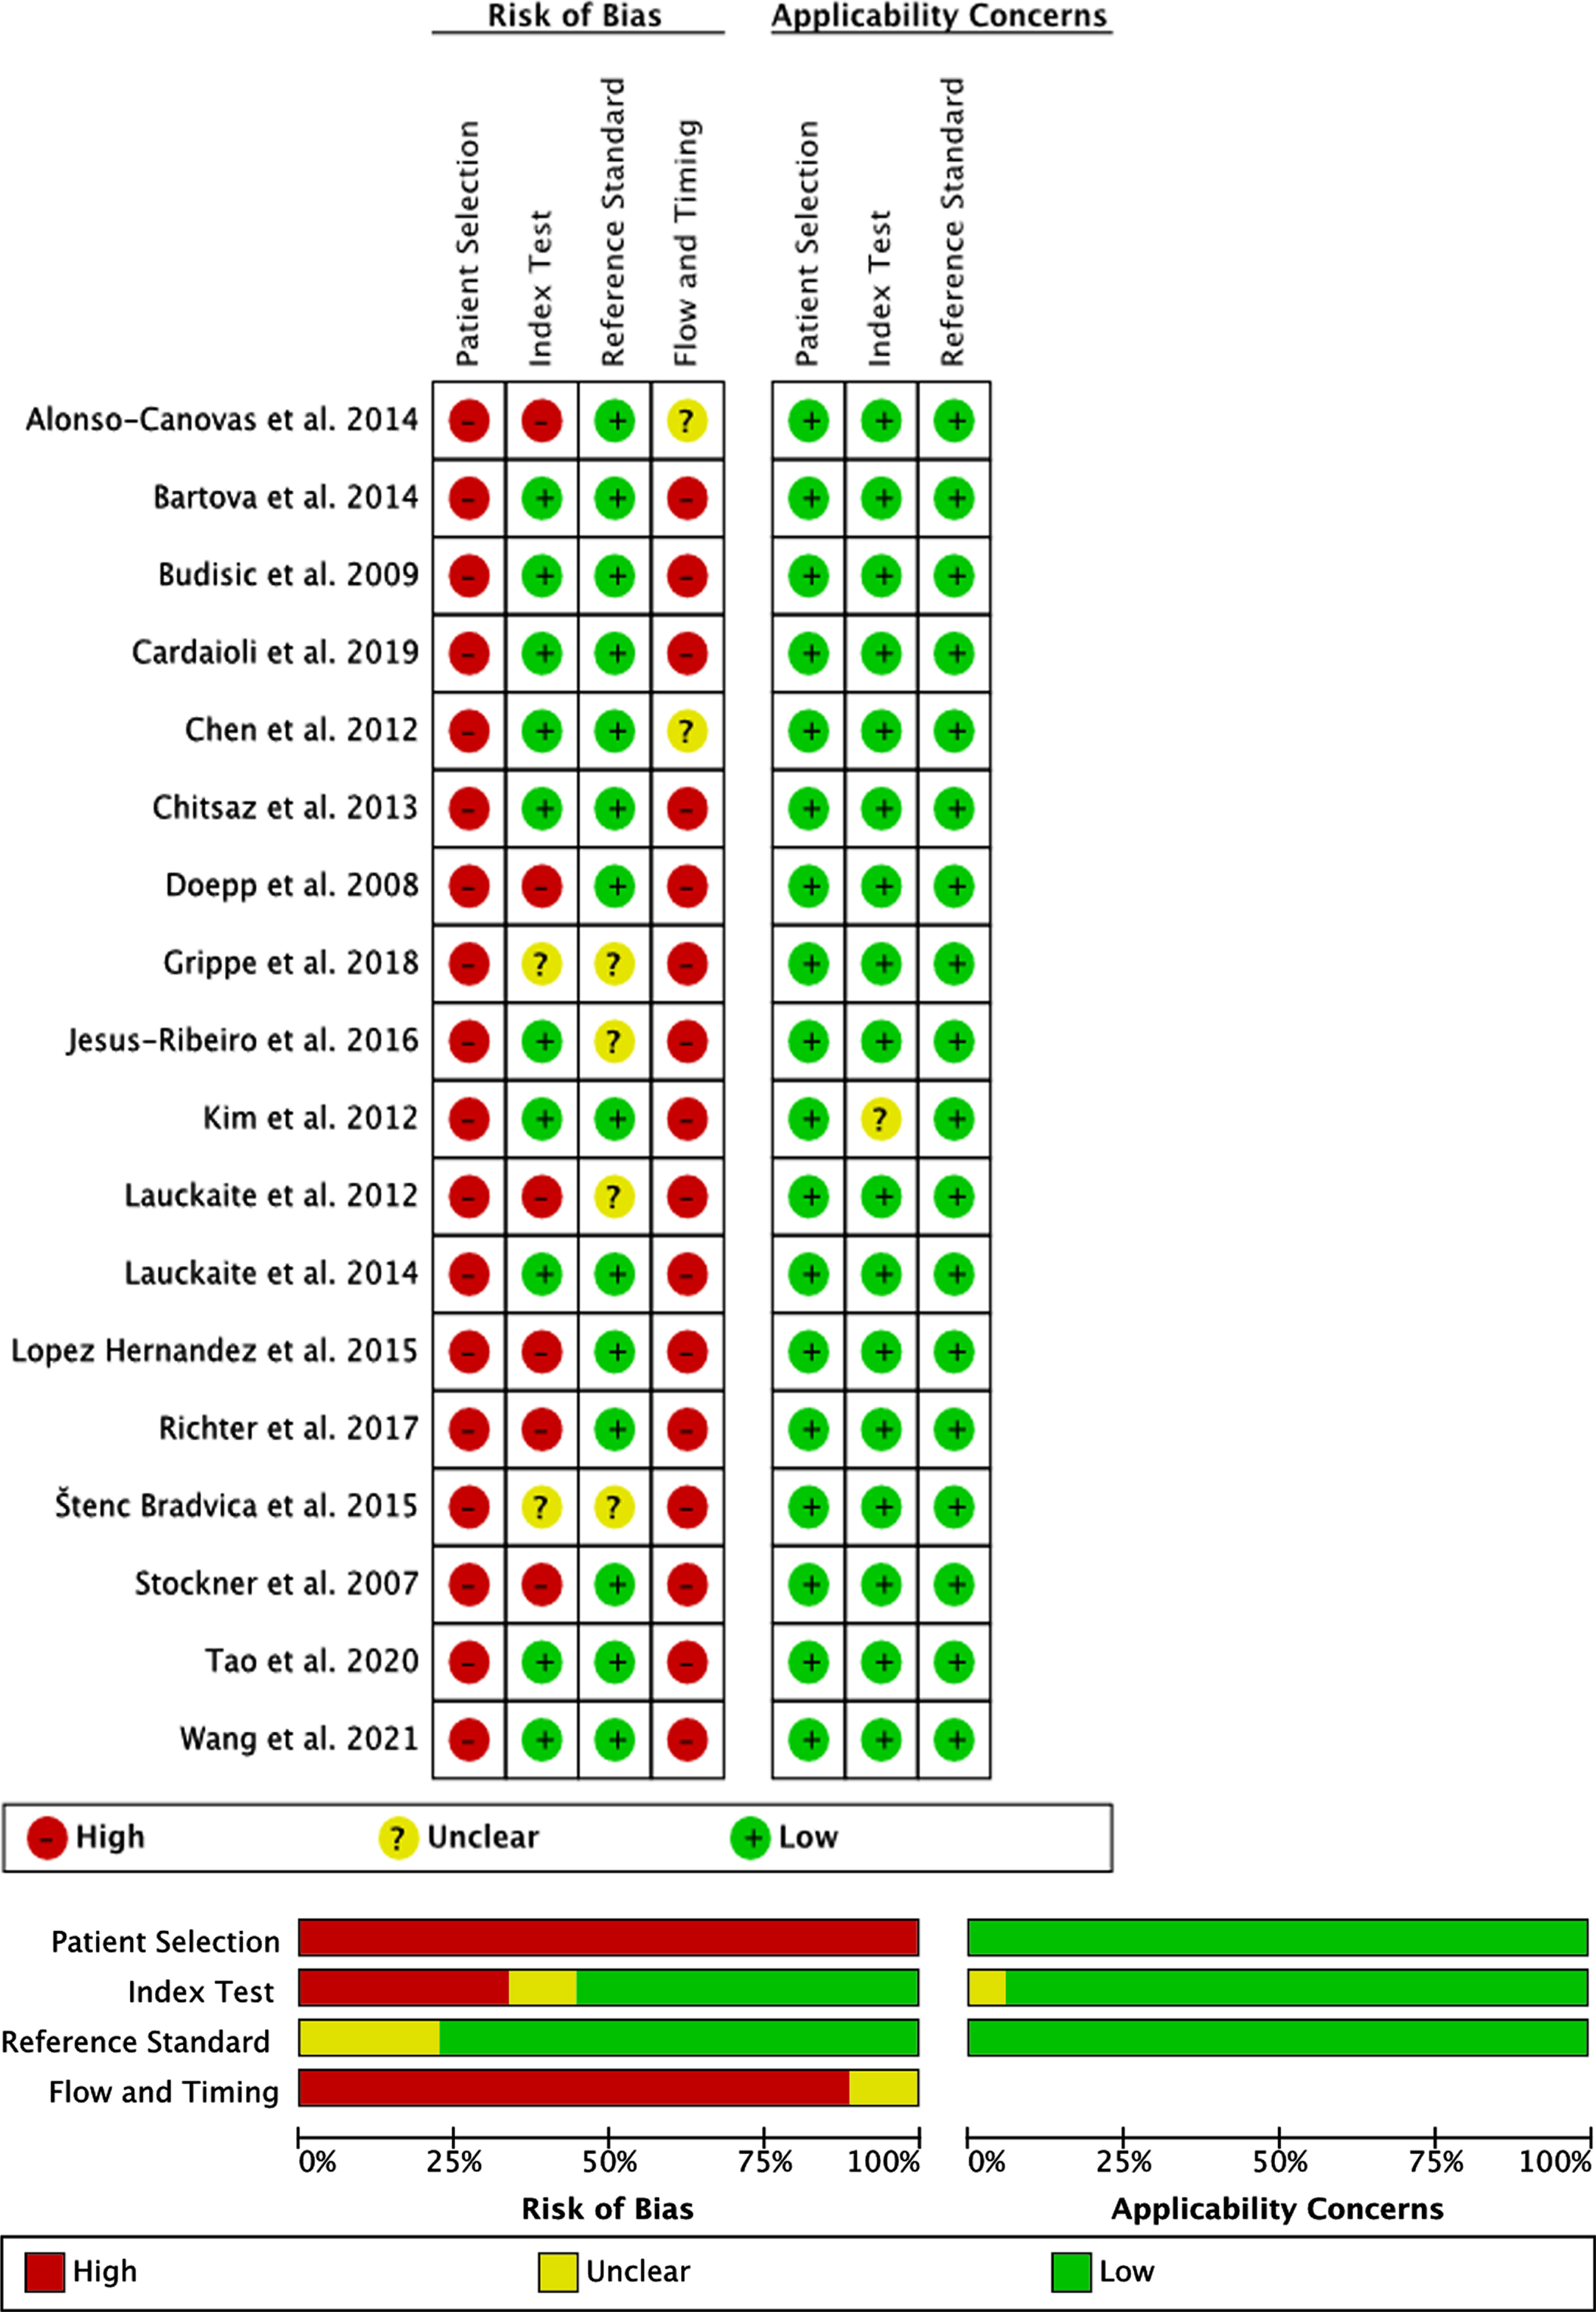
Quality assessment (Fig. 2)
The accuracy of SN + in order to distinguish between PD versus ET was examined in all 18 included publications. All studies showed a high risk of bias regarding the methodological quality of patient selection, as all patients were seen in specialized outpatient departments without avoiding case control design and only included patients with sufficient temporal bone window in the final analysis.
Fig. 2
Quality assessment of the included studies based on QUADAS-2.
Meta-analysis
The analysis of this systemic review showed a pooled sensitivity and specificity of TCS for the differential diagnosis of PD versus ET of 84.6% (95% CI, 79.4–88.6%) and 83.9% (95% CI, 78.4–88.2%), respectively (Fig. 3). Furthermore, we compared a subgroup-analysis comparing diagnostic accuracy of TCS and DaTSCAN in three studies [20, 22, 25] including 107 patients with PD and 62 patients with ET. Albeit the small number of studies included, we found nearly similar results in sensitivity and specificity with overlapping 95% CI intervals comparing TCS and DaTSCAN (Fig. 4).
Fig. 3
Forest plot of sensitivity and specificity of TCS for the diagnosis of PD versus ET.
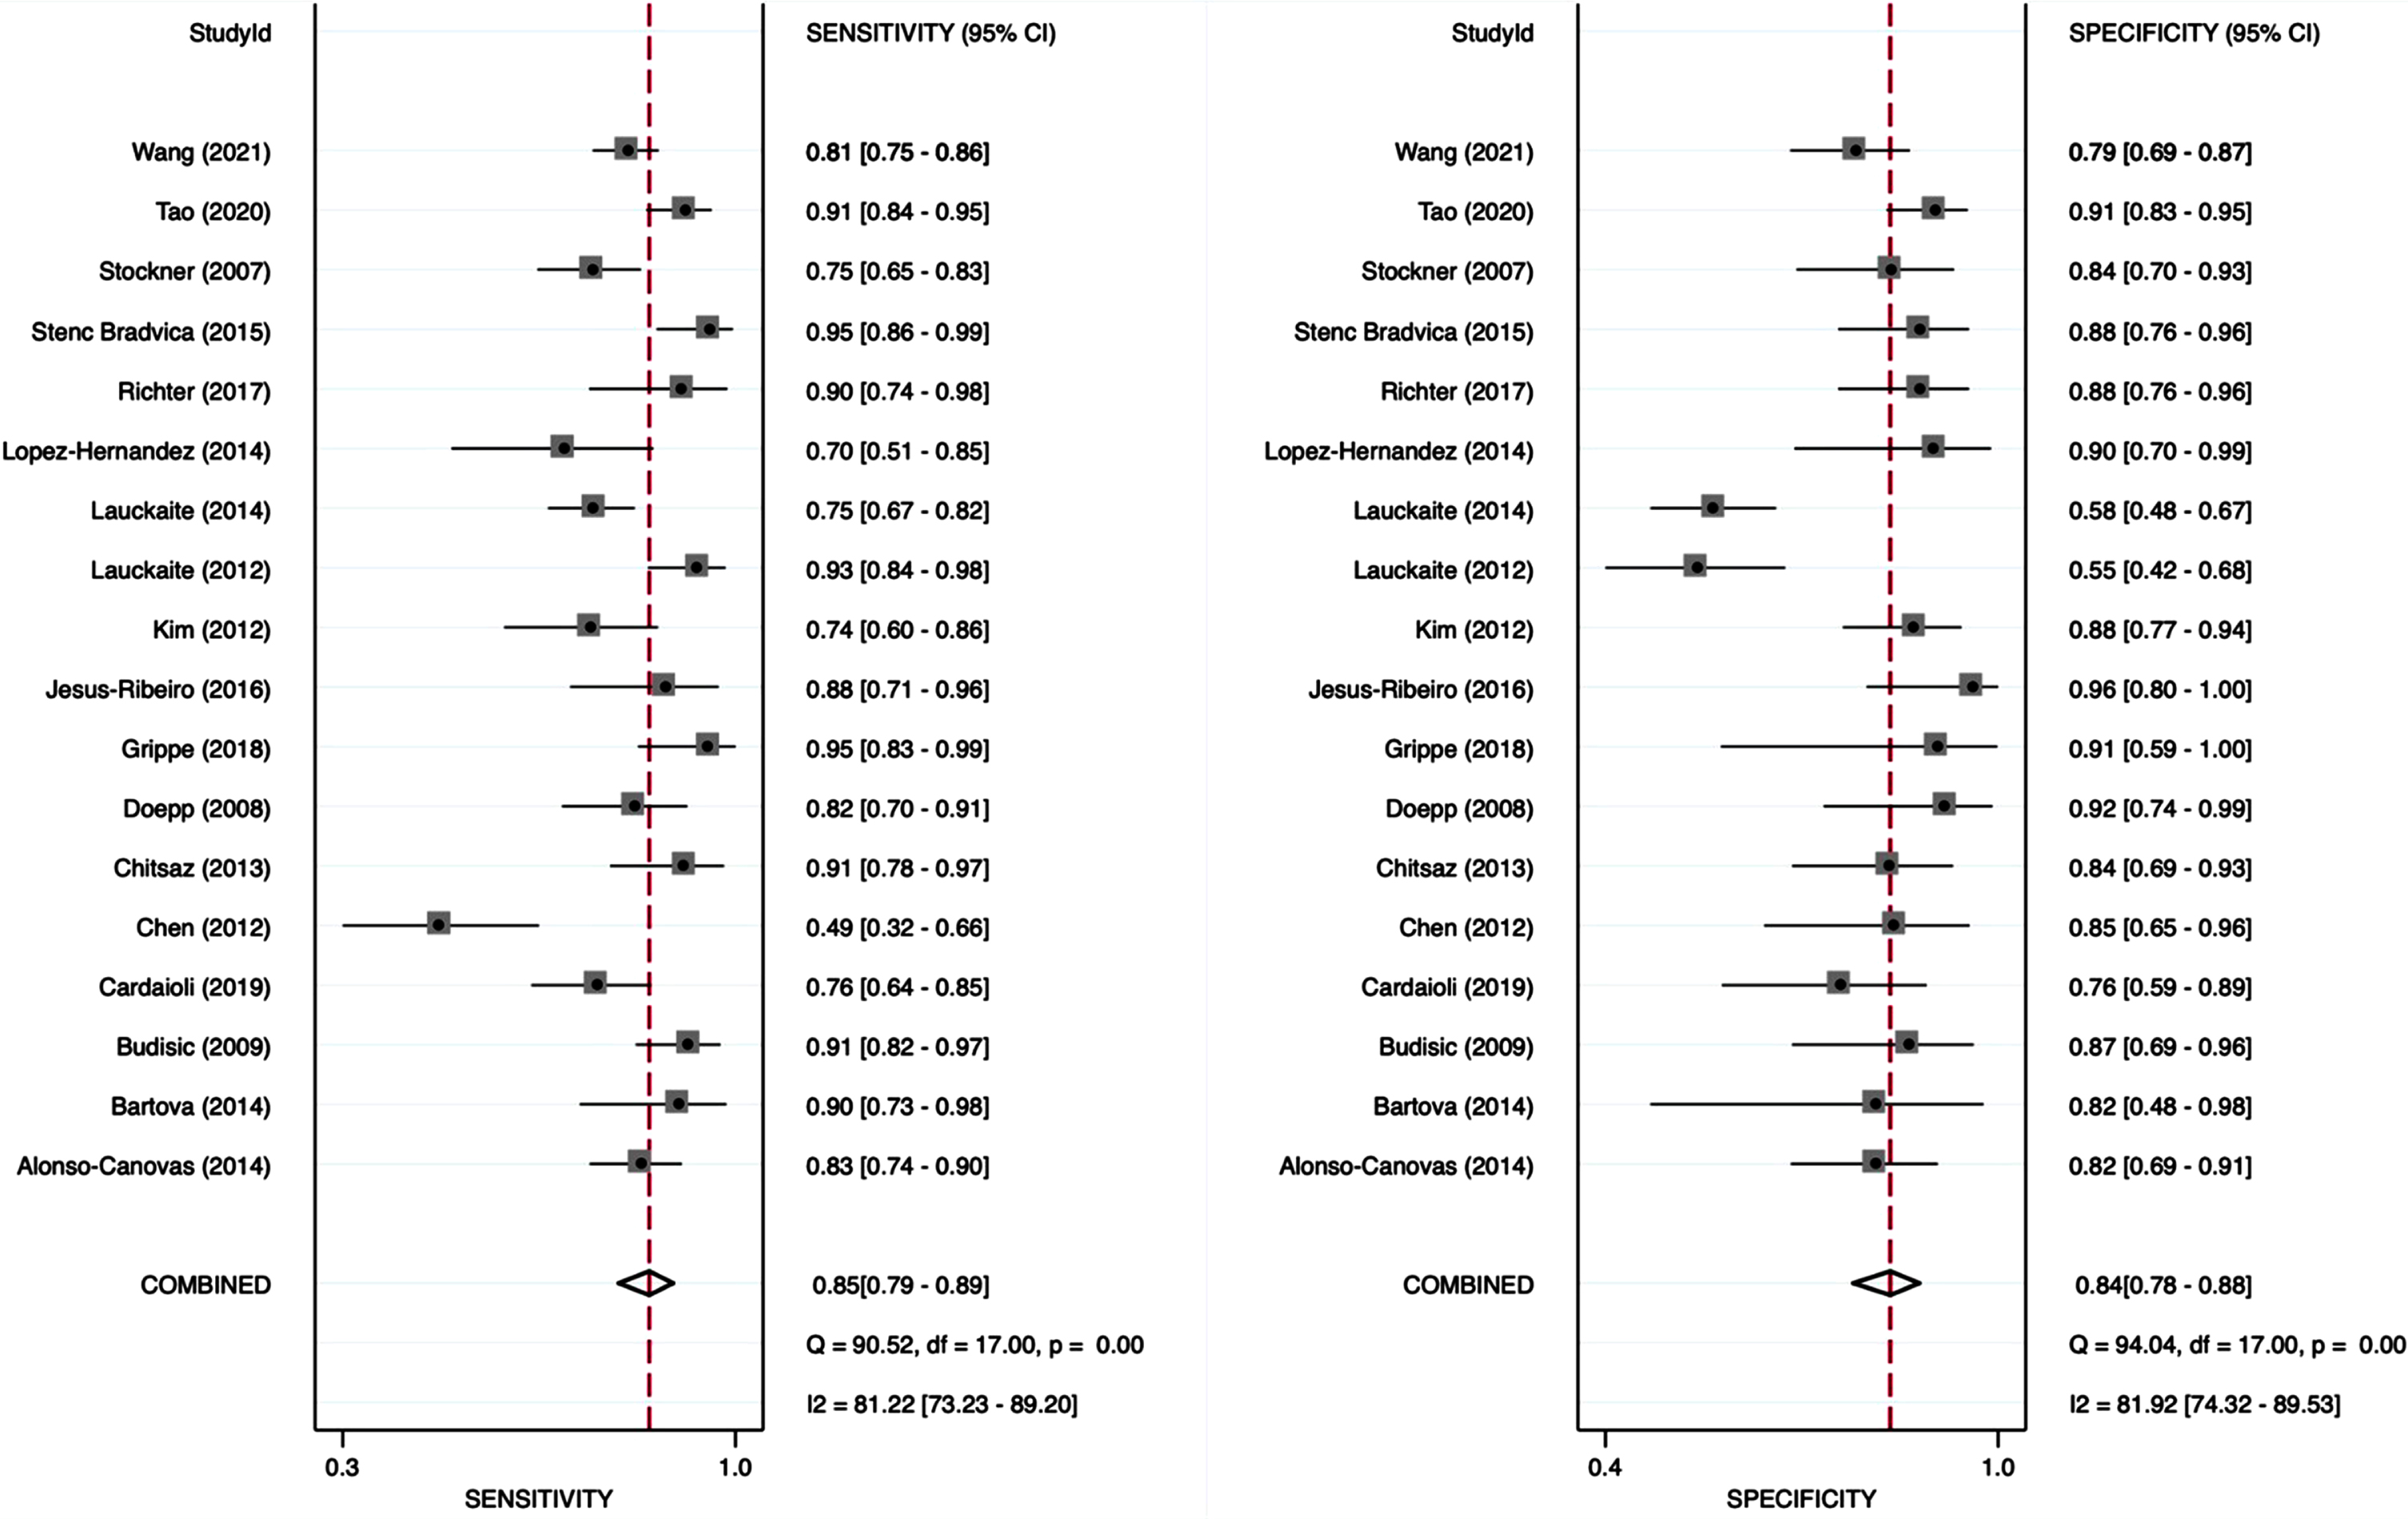
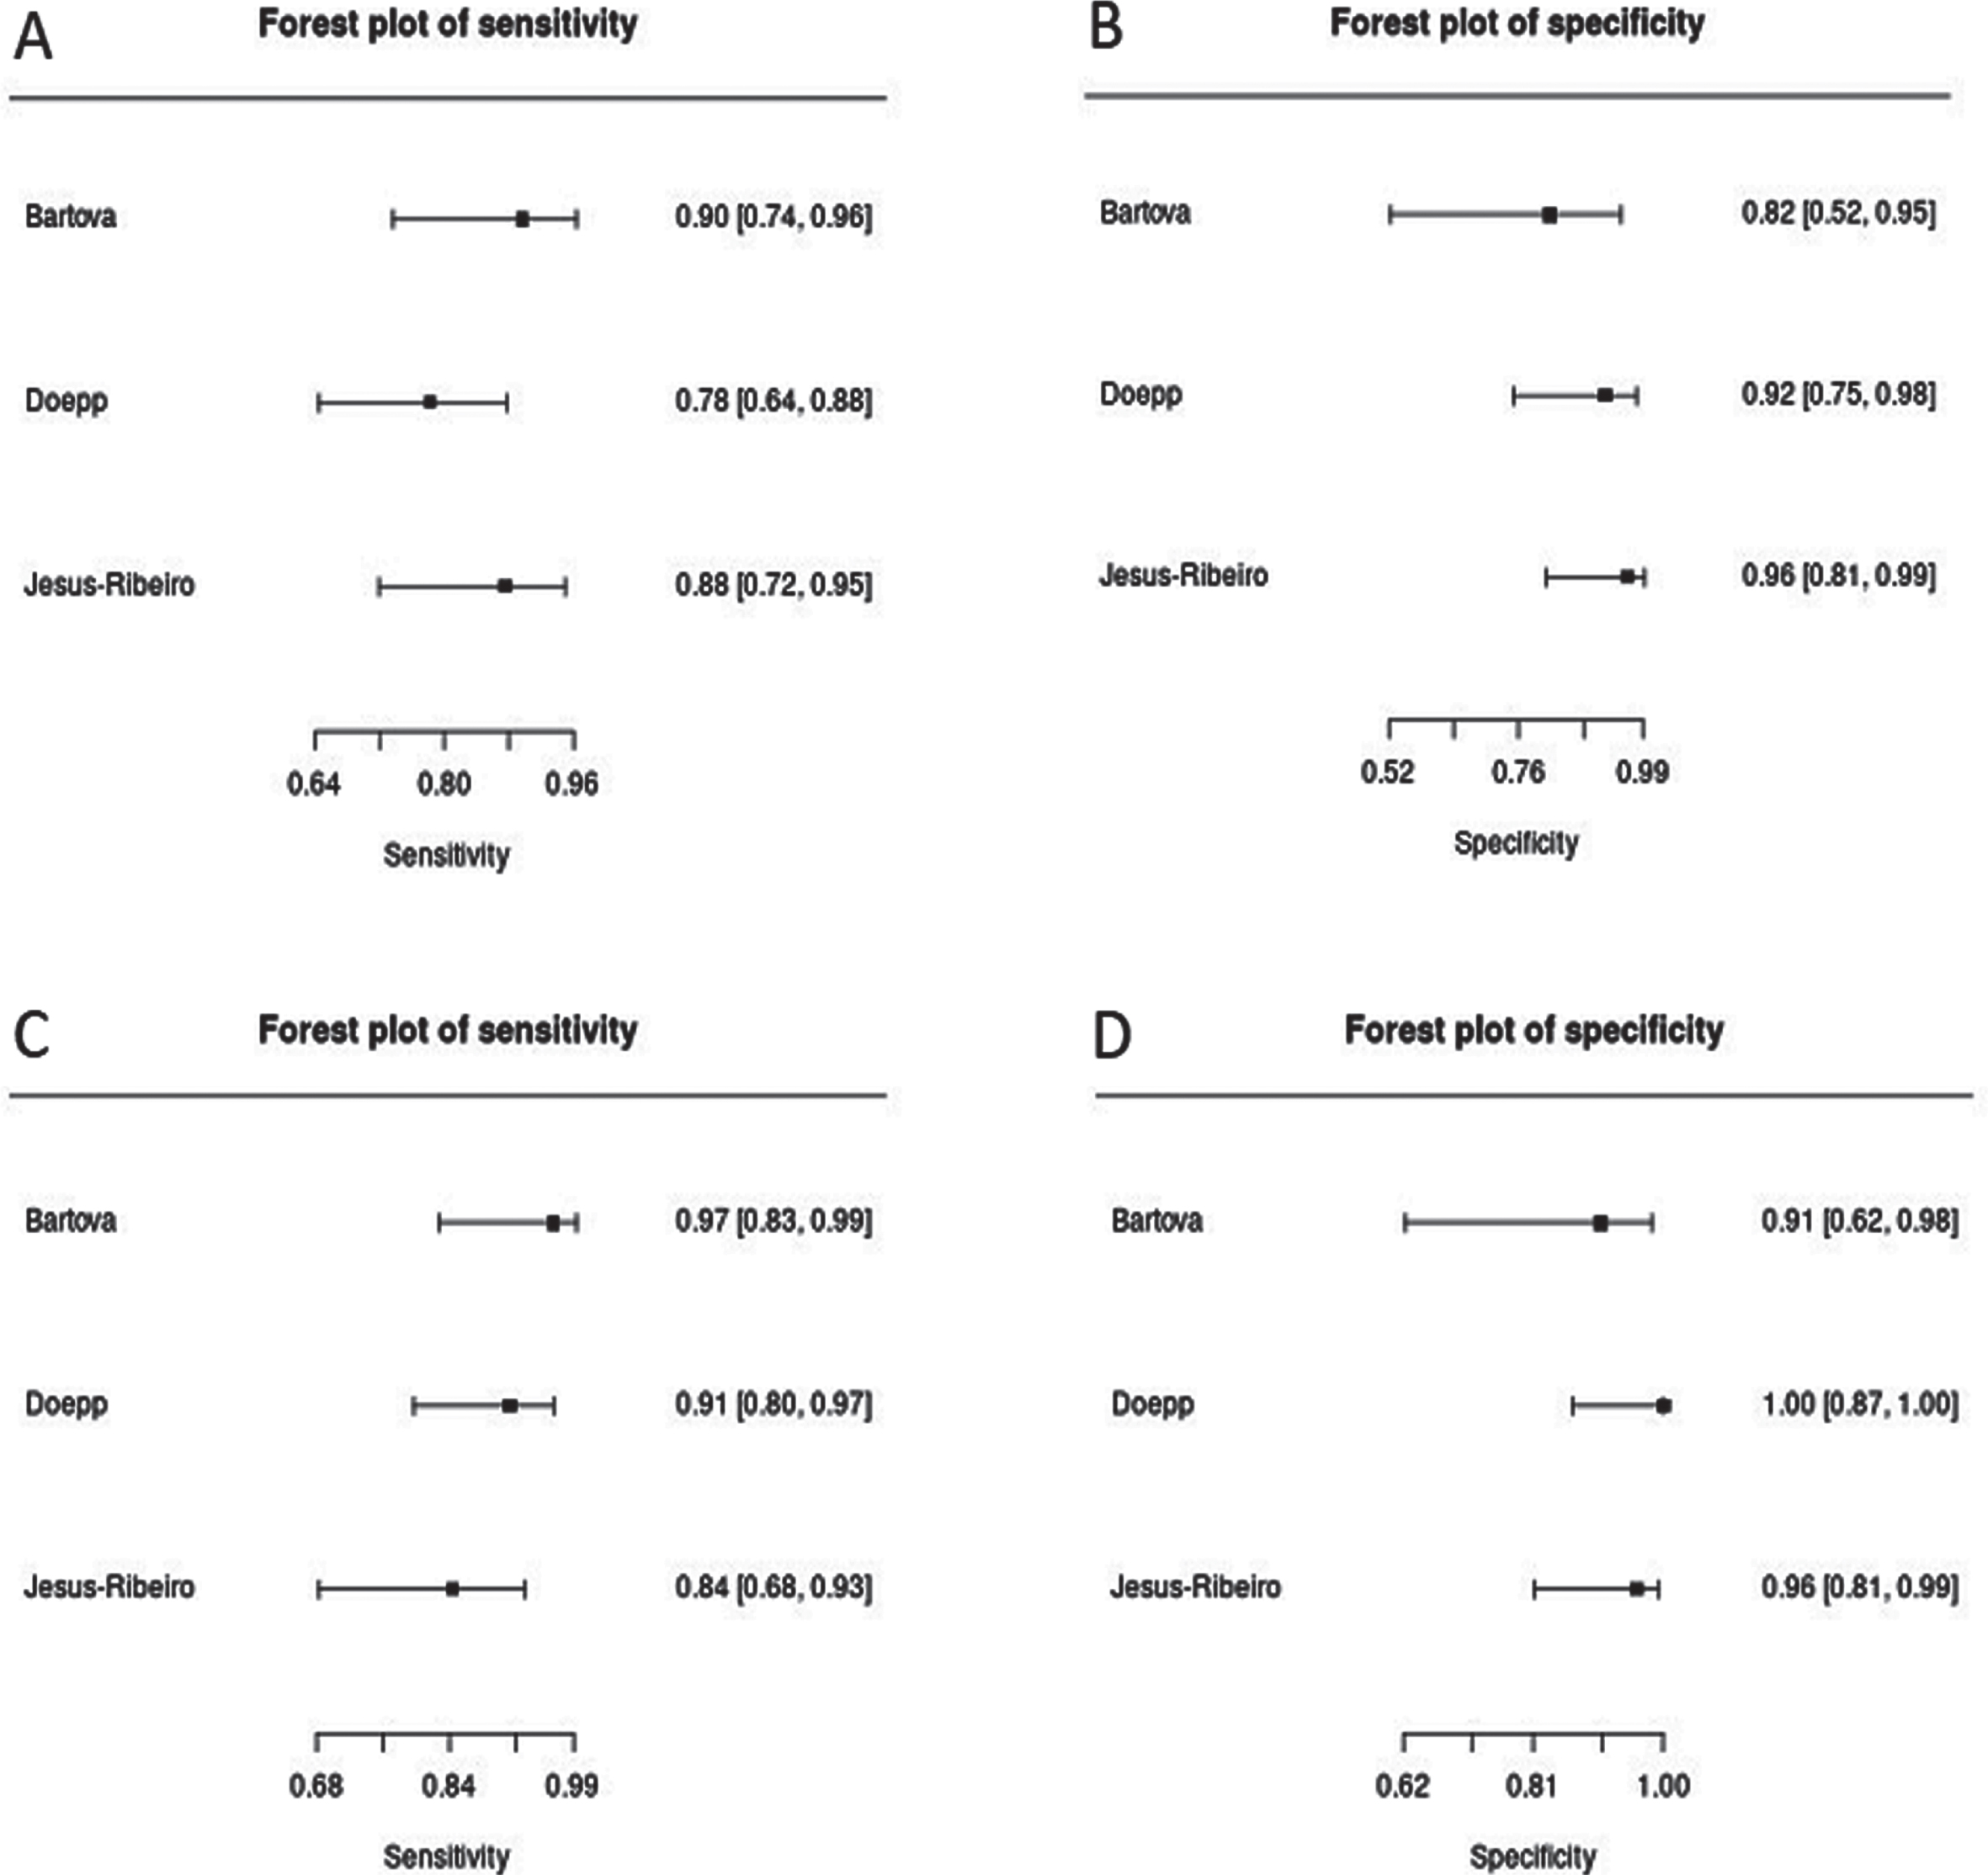
Fig. 4
Forest plots of sensitivity and specificity of TCS (A, pooled sensitivity: 84.1%, 95% CI: 75.9–89.9%; B, pooled specificity: 91.9%, 95% CI: 82.0–96.6%) versus DaTSCAN (C, pooled sensitivity: 90.7%, 95% CI: 83.5–94.9%; D, pooled specificity: 96.8%, 95% CI: 88.0–99.2%) for the diagnosis of PD versus ET.
Sensitivity analysis
Additionally, we added a sensitivity analysis including the three studies [39, 40, 41], which have been excluded from the primary meta-analysis due to methodological reasons mentioned above.
The sensitivity analysis revealed a similar diagnostic accuracy compared to the primary meta-analysis with a sensitivity of 82.1% (95% CI, 75.4–87.2%) and a specificity of 79.1% (95% CI, 68.8–86.6%), respectively.
DISCUSSION
In this meta-analysis, we aimed to evaluate the diagnostic accuracy of SN + as assessed with TCS for the differential diagnosis of PD versus ET.
Overall, our meta-analysis considered articles published until 2021 and revealed that SN + shows a good overall sensitivity of 84.6% (95% CI, 79.4–88.6%) and specificity of 83.9% (95% CI, 78.4–88.2%) to distinguish PD from ET. Our results resemble a previous meta–analysis [37], having revealed a sensitivity of 78% (95% CI: 69–85%) and specificity of 85% (95% CI: 77–91%) to distinguish PD from ET.
By contrast to this previous meta-analysis, we have included five new reports [12, 13, 17, 24, 28, 38], which have been published over the last five years, while we did not include others [38–41] because of methodological concerns: Two of these reports [39, 40] assessed the predictive diagnostic accuracy of TCS in patients with unclear parkinsonism of recent onset. Neither sensitivity and specificity, nor TP, TN, FP, and FN rates of SN + in the ET and PD group could be calculated from another report [41], which evaluated the combined assessment of motor asymmetry, hyposmia and SN + for the diagnosis of PD, as rates of an insufficient bone window across the diagnostic categories were not provided. Finally, another report [38] assessed SN + only by visual inspection without measuring the nigral echogenicity manually. We performed, however, a sensitivity analysis including three of these studies [39, 40, 41], which have been excluded from the primary meta-analysis. The sensitivity analysis, indeed, revealed a similar diagnostic accuracy compared to the primary meta-analysis with an only marginally lower sensitivity and specificity of 82.1% (95% CI, 75.4–87.2%) and 79.1% (95% CI, 68.8–86.6%), respectively. Methodological concerns of those studies, which were not included in the primary meta-analysis but in the sensitivity analysis, might explain the slightly lower sensitivity and specificity of the sensitivity analysis compared to the primary meta-analysis.
In order to assess study quality and risk of bias, the QUADAS-2 tool was used [8]. Two studies did not provide information on the reference standard used (e.g., which diagnostic criteria were used) [14, 26]. Except of two [13, 26], all studies were prospective and reported blinded procedure. Formal assessment of interrater variability was performed in four of the above-mentioned studies [16, 17, 24, 25], with good interrater correlation for TCS.
DaTSCAN is the only imaging technique which is approved in different countries including the United States of America and European Union [42] for the differential diagnosis of early PD versus ET or secondary parkinsonism such as vascular or drug-induced parkinsonism [43]. Indeed, there are situations in which DaTSCAN can be helpful in confirming a diagnosis—when neurologic exam findings are not clear-cut and discrimination between the tremors of ET and PD is difficult. In such circumstances, DaTSCAN is an approved imaging test to help diagnose PD. Three [20, 22, 25] of the included studies compared results of DaTSCAN and TCS on differentiation between PD and ET and found that TCS and DaTSCAN show similar diagnostic accuracy in all studies (Fig. 4).
Although up to 20% of HC may feature SN + [44], these individuals have a 20-fold increased risk of developing PD within 5 years compared to those HC without SN + [45]. Intriguingly, a study assessing TCS in individuals with suspected parkinsonism and DaTSCANs without evidence of dopaminergic deficit (SWEDD) depicted a diagnostic accuracy for separating PD from a SWEDD diagnosis of 86% (39) indicating that TCS is useful to distinguish patients with PD from patients with SWEDD and can provide additional information in patients presenting with inconclusive parkinsonian symptoms. Similarly, patients with ET [12, 46] and REM sleep behavior disorder [47] presenting with SN + have been shown to have an increased risk to develop future PD. On the other hand, SN + is a time-independent marker in prodromal and early PD disease stages and does not change with disease progression [48–50]. Therefore, our meta-analysis suggests that diagnostic work-flow of patients where clinical discrimination between the tremors of ET and PD is difficult may include TCS as a low cost, widely available, non-invasive marker without radiation. Absence of SN + argues against PD, while ET patients with SN + may go on to develop PD in the future. This may be particularly useful in patients where discrimination between the tremors of ET and PD is clinically difficult, and the more expensive DaTSCAN could be omitted. On the other hand, DaTSCAN can follow a TCS result of SN + to enhance diagnostic accuracy of PD diagnosis, because presence of SN + in ET patients might detect ET patients evolving PD in the future [12, 46]. However, such a diagnostic algorithm needs, to be validated.
Nevertheless, there are also limitations of TCS: the most important factor is that TCS is dependent on the investigator’s experience and a temporal bone window is needed for examination, with 4–15% of European populations providing an insufficient temporal window especially in advanced age [51].
To conclude, TCS provides adequate evidence for the differentiation of PD versus ET, and a diagnostic algorithm based on presence or absence of SN + is worth considering.
CONFLICT OF INTEREST
The authors have no conflict of interest to report.
SUPPLEMENTARY MATERIAL
[1] The supplementary material is available in the electronic version of this article: https://dx.doi.org/10.3233/JPD-213012.
REFERENCES
[1] | van Rumund A , Aerts MB , Esselink RAJ , Meijer FJA , Verbeek MM , Bloem BR ((2018) ) Parkinson’s Disease Diagnostic Observations (PADDO): Study rationale and design of a prospective cohort study for early differentiation of parkinsonism. BMC Neurol 18: , 69. |
[2] | Poewe W , Seppi K , Tanner CM , Halliday GM , Brundin P , Volkmann J , Schrag AE , Lang AE ((2017) ) Parkinson disease. Nat Rev Dis Primers 3: , 17013. |
[3] | Heim B , Krismer F , De Marzi R , Seppi K ((2017) ) Magnetic resonance imaging for the diagnosis of Parkinson’s disease. J Neural Transm (Vienna) 124: , 915–964. |
[4] | Heim B , Krismer F , Seppi K ((2018) ) Structural imaging in atypical parkinsonism. Int Rev Neurobiol 142: , 67–148. |
[5] | Stoessl AJ , Martin WW , McKeown MJ , Sossi V ((2011) ) Advances in imaging in Parkinson’s disease. Lancet Neurol 10: , 987–1001. |
[6] | Delgado N , Hernandez DI , Radler K , Huey ED , Cosentino S , Louis E ((2021) ) Mild cognitive impairment, dementia and risk of mortality in essential tremor: A longitudinal prospective study of elders. J Neurol Sci 428: , 117563. |
[7] | Moher D , Liberati A , Tetzlaff J , Altman DG , Group P ((2009) ) Preferred reporting items for systematic reviews and meta-analyses: The PRISMA statement. J Clin Epidemiol 62: , 1006–1012. |
[8] | Whiting PF , Rutjes AW , Westwood ME , Mallett S , Deeks JJ , Reitsma JB , Leeflang MM , Sterne JA , Bossuyt PM , Group Q- ((2011) ) QUADAS-2: A revised tool for the quality assessment of diagnostic accuracy studies. AnnIntern Med 155: , 529–536. |
[9] | Patel A , Cooper N , Freeman S , Sutton A ((2021) ) Graphical enhancements to summary receiver operating characteristic plots to facilitate the analysis and reporting of meta-analysis of diagnostic test accuracy data. Res Synth Methods 12: , 34–44. |
[10] | Freeman SC , Kerby CR , Patel A , Cooper NJ , Quinn T , Sutton AJ ((2019) ) Development of an interactive web-based tool to conduct and interrogate meta-analysis of diagnostic test accuracy studies: MetaDTA. BMC Med Res Methodol 19: , 81. |
[11] | Rutter CM , Gatsonis CA ((2001) ) A hierarchical regression approach to meta-analysis of diagnostic test accuracy evaluations. Stat Med 20: , 2865–2884. |
[12] | Cardaioli G , Ripandelli F , Paolini Paoletti F , Nigro P , Simoni S , Brahimi E , Romoli M , Filidei M , Eusebi P , Calabresi P , Tambasco N ((2019) ) Substantia nigra hyperechogenicity in essential tremor and Parkinson’s disease: A longitudinal study. Eur J Neurol 26: , 1370–1376. |
[13] | Grippe TC , Allam N , Brandão PRP , Pereira DA , Cardoso FEC , Aguilar ACR , Kessler IM ((2018) ) Is transcranial sonography useful for diagnosing Parkinson’s disease in clinical practice? Arq Neuropsiquiatr 76: , 459–466. |
[14] | Laučkaitė K , Rastenytė D , Šurkienė D , Vaitkus A , Sakalauskas A , Lukoševičius A , Gleiznienė R ((2012) ) Specificity of transcranial sonography in parkinson spectrum disorders in comparison to degenerative cognitive syndromes. BMC Neurol 12: , 12. |
[15] | Laučkaitė K , Rastenytė D , Šurkienė D , Vaidelytė B , Dambrauskaitė G , Sakalauskas A , Vaitkus A , Gleiznienė R ((2014) ) Ultrasonographic (TCS) and clinical findings in overlapping phenotype of essential tremor and Parkinson’s disease (ET-PD). BMC Neurol 14: , 54. |
[16] | Budisic M , Trkanjec Z , Bosnjak J , Lovrencic-Huzjan A , Vukovic V , Demarin V ((2009) ) Distinguishing Parkinson’s disease and essential tremor with transcranial sonography. Acta Neurol Scand 119: , 17–21. |
[17] | Richter D , Woitalla D , Muhlack S , Gold R , Tönges L , Krogias C ((2017) ) Coronal transcranial sonography and M-mode tremor frequency determination in Parkinson’s disease and essential tremor. J Neuroimaging 27: , 524–530. |
[18] | López Hernández N , García Escrivá A , Shalabi Benavent M ((2015) ) Diagnostic value of combined assessment of olfaction and sustantia nigra hyperechogenicity for Parkinson’s disease. Neurologia 30: , 496–501. |
[19] | Alonso-Cánovas A , López-Sendón JL , Buisán J , deFelipe-Mimbrera A , Guillán M , García-Barragán N , Corral I , Matute-Lozano MC , Masjuan J , Martínez-Castrillo JC , Walter U ((2014) ) Sonography for diagnosis of Parkinson disease-from theory to practice: A study on 300 participants. J Ultrasound Med 33: , 2069–2074. |
[20] | Bártová P , Kraft O , Bernátek J , Havel M , Ressner P , Langová K , Herzig R , Skoloudík D ((2014) ) Transcranial sonography and (123)I-FP-CIT single photon emission computed tomography in movement disorders. Ultrasound Med Biol 40: , 2365–2371. |
[21] | Chitsaz A , Mehrbod N , Saadatnia M , Fereidan-Esfahani M , Akbari M , Abtahi SH ((2013) ) Transcranial sonography on Parkinson’s disease and essential tremor. J Res Med Sci 18: , S28–31. |
[22] | Doepp F , Plotkin M , Siegel L , Kivi A , Gruber D , Lobsien E , Kupsch A , Schreiber SJ ((2008) ) Brain parenchyma sonography and 123I-FP-CIT SPECT in Parkinson’s disease and essential tremor. Mov Disord 23: , 405–410. |
[23] | Stockner H , Sojer M , K KS , Mueller J , Wenning GK , Schmidauer C , Poewe W ((2007) ) Midbrain sonography in patients with essential tremor. Mov Disord 22: , 414–417. |
[24] | Tao A , Chen G , Mao Z , Gao H , Deng Y , Xu R ((2020) ) Essential tremor vs idiopathic Parkinson disease: Utility of transcranial sonography. Medicine (Baltimore) 99: , e20028. |
[25] | Jesus-Ribeiro J , Freire A , Sargento-Freitas J , Sousa M , Silva F , Moreira F , Cunha MJ , Walter U , Januário C ((2016) ) Transcranial sonography and DaTSCAN in early stage Parkinson’s disease and essential tremor. Eur Neurol 76: , 252–255. |
[26] | Štenc Bradvica I , Mihaljević I , Butković-Soldo S , Kadojić D , Titlić M , Bradvica M , Kralik K ((2015) ) Transcranial sonography and the pocket smell test in the differential diagnosis between parkinson’s disease and essential tremor. Neurol Sci 36: , 1403–1410. |
[27] | Kim JS , Oh YS , Kim YI , Koo JS , Yang DW , Lee KS ((2012) ) Transcranial sonography (TCS) in Parkinson’s disease (PD) and essential tremor (ET) in relation with putative premotor symptoms of PD. Arch Gerontol Geriatr 54: , e436–439. |
[28] | Wang LS , Yu TF , Chai B , He W ((2021) ) Transcranial sonography in differential diagnosis of Parkinson disease and other movement disorders. Chin Med J (Engl) 134: , 1726–1731. |
[29] | Chen W , Tan YY , Hu YY , Zhan WW , Wu L , Lou Y , Wang X , Zhou Y , Huang P , Gao Y , Xiao Q , Chen SD ((2012) ) Combination of olfactory test and substantia nigra transcranial sonopraphy in the differential diagnosis of Parkinson’s disease: A pilot study from China. Transl Neurodegener 1: , 25. |
[30] | Postuma RB , Berg D , Stern M , Poewe W , Olanow CW , Oertel W , Obeso J , Marek K , Litvan I , Lang AE , Halliday G , Goetz CG , Gasser T , Dubois B , Chan P , Bloem BR , Adler CH , Deuschl G ((2015) ) MDS clinical diagnostic criteria for Parkinson’s disease. Mov Disord 30: , 1591–1601. |
[31] | Hughes AJ , Daniel SE , Kilford L , Lees AJ ((1992) ) Accuracy of clinical diagnosis of idiopathic Parkinson’s disease: A clinico-pathological study of 100 cases. J Neurol Neurosurg Psychiatry 55: , 181–184. |
[32] | Gibb WR , Lees AJ ((1988) ) The relevance of the Lewy body to the pathogenesis of idiopathic Parkinson’s disease. J Neurol Neurosurg Psychiatry 51: , 745–752. |
[33] | Gelb DJ , Oliver E , Gilman S ((1999) ) Diagnostic criteria for Parkinson disease. Arch Neurol 56: , 33–39. |
[34] | Deuschl G , Bain P , Brin M ((1998) ) Consensus statement of the Movement Disorder Society on Tremor. Ad Hoc Scientific Committee. Mov Disord 13: (Suppl 3), 2–23. |
[35] | Bain P , Brin M , Deuschl G , Elble R , Jankovic J , Findley L , Koller WC , Pahwa R ((2000) ) Criteria for the diagnosis of essential tremor. Neurology S54: , 7. |
[36] | Louis ED , Ford B , Lee H , Andrews H , Cameron G ((1998) ) Diagnostic criteria for essential tremor: A population perspective. Arch Neurol 55: , 823–828. |
[37] | Shafieesabet A , Fereshtehnejad SM , Delbari A , Baradaran HR , Postuma RB , Lökk J ((2017) ) Hyperechogenicity of substantia nigra for differential diagnosis of Parkinson’s disease: A meta-analysis. Parkinsonism Relat Disord 42: , 1–11. |
[38] | Okawa M , Miwa H , Kajimoto Y , Hama K , Morita S , Nakanishi I , Kondo T ((2007) ) Transcranial sonography of the substantia nigra in Japanese patients with Parkinson’s disease or atypical parkinsonism: Clinical potential and limitations. Intern Med 46: , 1527–1531. |
[39] | Vlaar AM , de Nijs T , van Kroonenburgh MJ , Mess WH , Winogrodzka A , Tromp SC , Weber WE ((2008) ) The predictive value of transcranial duplex sonography for the clinical diagnosis in undiagnosed parkinsonian syndromes: Comparison with SPECT scans. BMC Neurol 8: , 42. |
[40] | Bouwmans AE , Vlaar AM , Mess WH , Kessels A , Weber WE ((2013) ) Specificity and sensitivity of transcranial sonography of the substantia nigra in the diagnosis of Parkinson’s disease: Prospective cohort study in 196 patients. BMJ Open 3: , e002613. |
[41] | Busse K , Heilmann R , Kleinschmidt S , Abu-Mugheisib M , Höppner J , Wunderlich C , Gemende I , Kaulitz L , Wolters A , Benecke R , Walter U ((2012) ) Value of combined midbrain sonography, olfactory and motor function assessment in the differential diagnosis of early Parkinson’s disease. J Neurol Neurosurg Psychiatry 83: , 441–447. |
[42] | Jauković L , Ilić TV , Dopudja M , Ajdinović B ((2012) ) 123I-FP-CIT brain SPECT (DaTSCAN) imaging in the diagnosis of patients with movement disorders–first results. Vojnosanit Pregl 69: , 157–162. |
[43] | Brigo F , Matinella A , Erro R , Tinazzi M ((2014) ) [123I]FP-CIT SPECT (DaTSCAN) may be a useful tool to differentiate between Parkinson’s disease and vascular or drug-induced parkinsonisms: A meta-analysis. Eur J Neurol 21: , 1369–e1390. |
[44] | Walter U ((2011) ) Substantia nigra hyperechogenicity is a risk marker of Parkinson’s disease: No. J Neural Transm (Vienna) 118: , 607–612. |
[45] | Berg D , Behnke S , Seppi K , Godau J , Lerche S , Mahlknecht P , Liepelt-Scarfone I , Pausch C , Schneider N , Gaenslen A , Brockmann K , Srulijes K , Huber H , Wurster I , Stockner H , Kiechl S , Willeit J , Gasperi A , Fassbender K , Gasser T , Poewe W ((2013) ) Enlarged hyperechogenic substantia nigra as a risk marker for Parkinson’s disease. Mov Disord 28: , 216–219. |
[46] | Sprenger FS , Wurster I , Seppi K , Stockner H , Scherfler C , Sojer M , Schmidauer C , Berg D , Poewe W ((2016) ) Substantia nigra hyperechogenicity and Parkinson’s disease risk in patients with essential tremor. Mov Disord 31: , 579–583. |
[47] | Miyamoto M , Miyamoto T ((2020) ) Relationship of substantia nigra hyperechogenicity to risk of Lewy body disease in idiopathic REM sleep behavior disorder patients: A longitudinal study. Sleep Med 68: , 31–34. |
[48] | Iranzo A , Stockner H , Serradell M , Seppi K , Valldeoriola F , Frauscher B , Molinuevo JL , Vilaseca I , Mitterling T , Gaig C , Vilas D , Santamaria J , Högl B , Tolosa E , Poewe W ((2014) ) Five-year follow-up of substantia nigra echogenicity in idiopathic REM sleep behavior disorder. Mov Disord 29: , 1774–1780. |
[49] | Berg D , Merz B , Reiners K , Naumann M , Becker G ((2005) ) Five-year follow-up study of hyperechogenicity of the substantia nigra in Parkinson’s disease. Mov Disord 20: , 383–385. |
[50] | Mahlknecht P , Stockner H , Nocker M , Kiechl S , Willeit J , Scherfler C , Sojer M , Gasperi A , Rungger G , Poewe W , Seppi K ((2012) ) A follow-up study of substantia nigra echogenicity in healthy adults. Mov Disord 27: , 1196–1197. |
[51] | Li DH , He YC , Liu J , Chen SD ((2016) ) Diagnostic accuracy of transcranial sonography of the substantia nigra in Parkinson’s disease: A systematic review and meta-analysis. Sci Rep 6: , 20863. |


