
Peripheral Immune Cell Numbers and C-Reactive Protein in Parkinson’s Disease: Results from a Population-Based Study
Abstract
Background:
The immune system is known to be involved in Parkinson’s disease (PD) pathogenesis, but the temporal relationship between peripheral immune responses and PD remains unknown.
Objective:
We determined the association between peripheral immune cell numbers, C-reactive protein (CRP), and prevalent as well as incident PD.
Methods:
This study was embedded in the population-based setting of the Rotterdam Study. We repeatedly measured peripheral immune cell numbers (differential leukocyte count and platelet count, granulocyte-to-lymphocyte ratio [GLR], platelet-to-lymphocyte ratio [PLR], and adapted systemic immune-inflammation index [adapted SII]) and CRP between 1990 and 2016. Participants were continuously followed-up for PD until 2018. We estimated the association of the markers with prevalent and incident PD using logistic regression models and joint models, respectively. Models were adjusted for age, sex, smoking, body mass index, and medication use. Odds ratios (OR) and hazard ratios (HR) are shown per doubling of the marker.
Results:
A total of 12,642 participants were included in this study. The mean age (standard deviation) was 65.1 (9.8) years and 57.5%were women. Participants with a higher lymphocyte count were less likely to have prevalent PD (adjusted OR: 0.34, 95%CI 0.17–0.68). Participants with a higher GLR, PLR, and adapted SII were more likely to have prevalent PD, but these effects were explained by the lymphocyte count. The peripheral immune cell numbers and CRP were not significantly associated with the risk of incident PD.
Conclusion:
We found participants with a higher lymphocyte count to be less likely to have prevalent PD, but we did not find an association between peripheral immune cell numbers nor CRP and the risk of incident PD.
INTRODUCTION
Parkinson’s disease (PD) is a complex neurodegenerative disease that is characterized by a combination of motor and non-motor symptoms [1]. These symptoms are predominantly caused by a lack of dopamine due to neuronal death in the substantia nigra [1–3]. However, the pathology of PD is known to be more widespread and may even initiate outside of the brain [4–6]. Recent studies have suggested an essential role of the immune system in the pathophysiology of PD [1–3, 7–9].
Evidence for both central and peripheral immune responses in the pathogenesis of PD is extensive [8, 9]. In clinical PD, alterations in the gut microbiome have been shown to induce systemic inflammatory responses [8, 10, 11] and impaired humoral as well as cellular immune responses have been found [2, 8, 12]. At an earlier stage of pathogenesis, infectious agents have been suggested to act as a trigger of auto-immune responses against dopaminergic neurons [13]. Indeed, alterations in differential leukocyte counts and cytokine levels have already been described before the onset of clinical PD [14–17].
Despite the emerging evidence of the involvement of the peripheral immune system in PD pathophysiology, it remains largely unclear how peripheral immune or inflammation markers change during the prediagnostic phase of the disease as well as after the diagnosis [8]. The objective of this study was to investigate the temporal relation of peripheral immune cell numbers and C-reactive protein (CRP) with PD. Hereto, we studied the association of these markers with prevalent and incident PD.
METHODS
Study population
This study was embedded in the Rotterdam Study, a large population-based cohort study in the district Ommoord of the Dutch city Rotterdam. Details about the design of the Rotterdam Study have been described previously [18]. In short, the Rotterdam Study was initiated in 1990 with the inclusion of 7,983 residents of 55 years and over (RS-I). In 2000 the cohort was extended with 3,011 residents of 55 years and over (RS-II), and in 2006 the cohort was further extended with 3,932 residents of 45 years and over (RS-III). The response rate over the three cohorts was 72%. At baseline and on average every four years, participants underwent a home interview and examinations at the research center.
The Rotterdam Study has been approved by the Medical Ethics Committee of the Erasmus Medical Center (registration number MEC 02.1015) and by the review board of the Ministry of Health, Welfare, and Sports of the Netherlands (Population Screening Act WBO, license number 1071272-159521-PG). All participants provided written informed consent to participate in the study and to have their information obtained from treating physicians.
Assessment of peripheral immune cell numbers and CRP
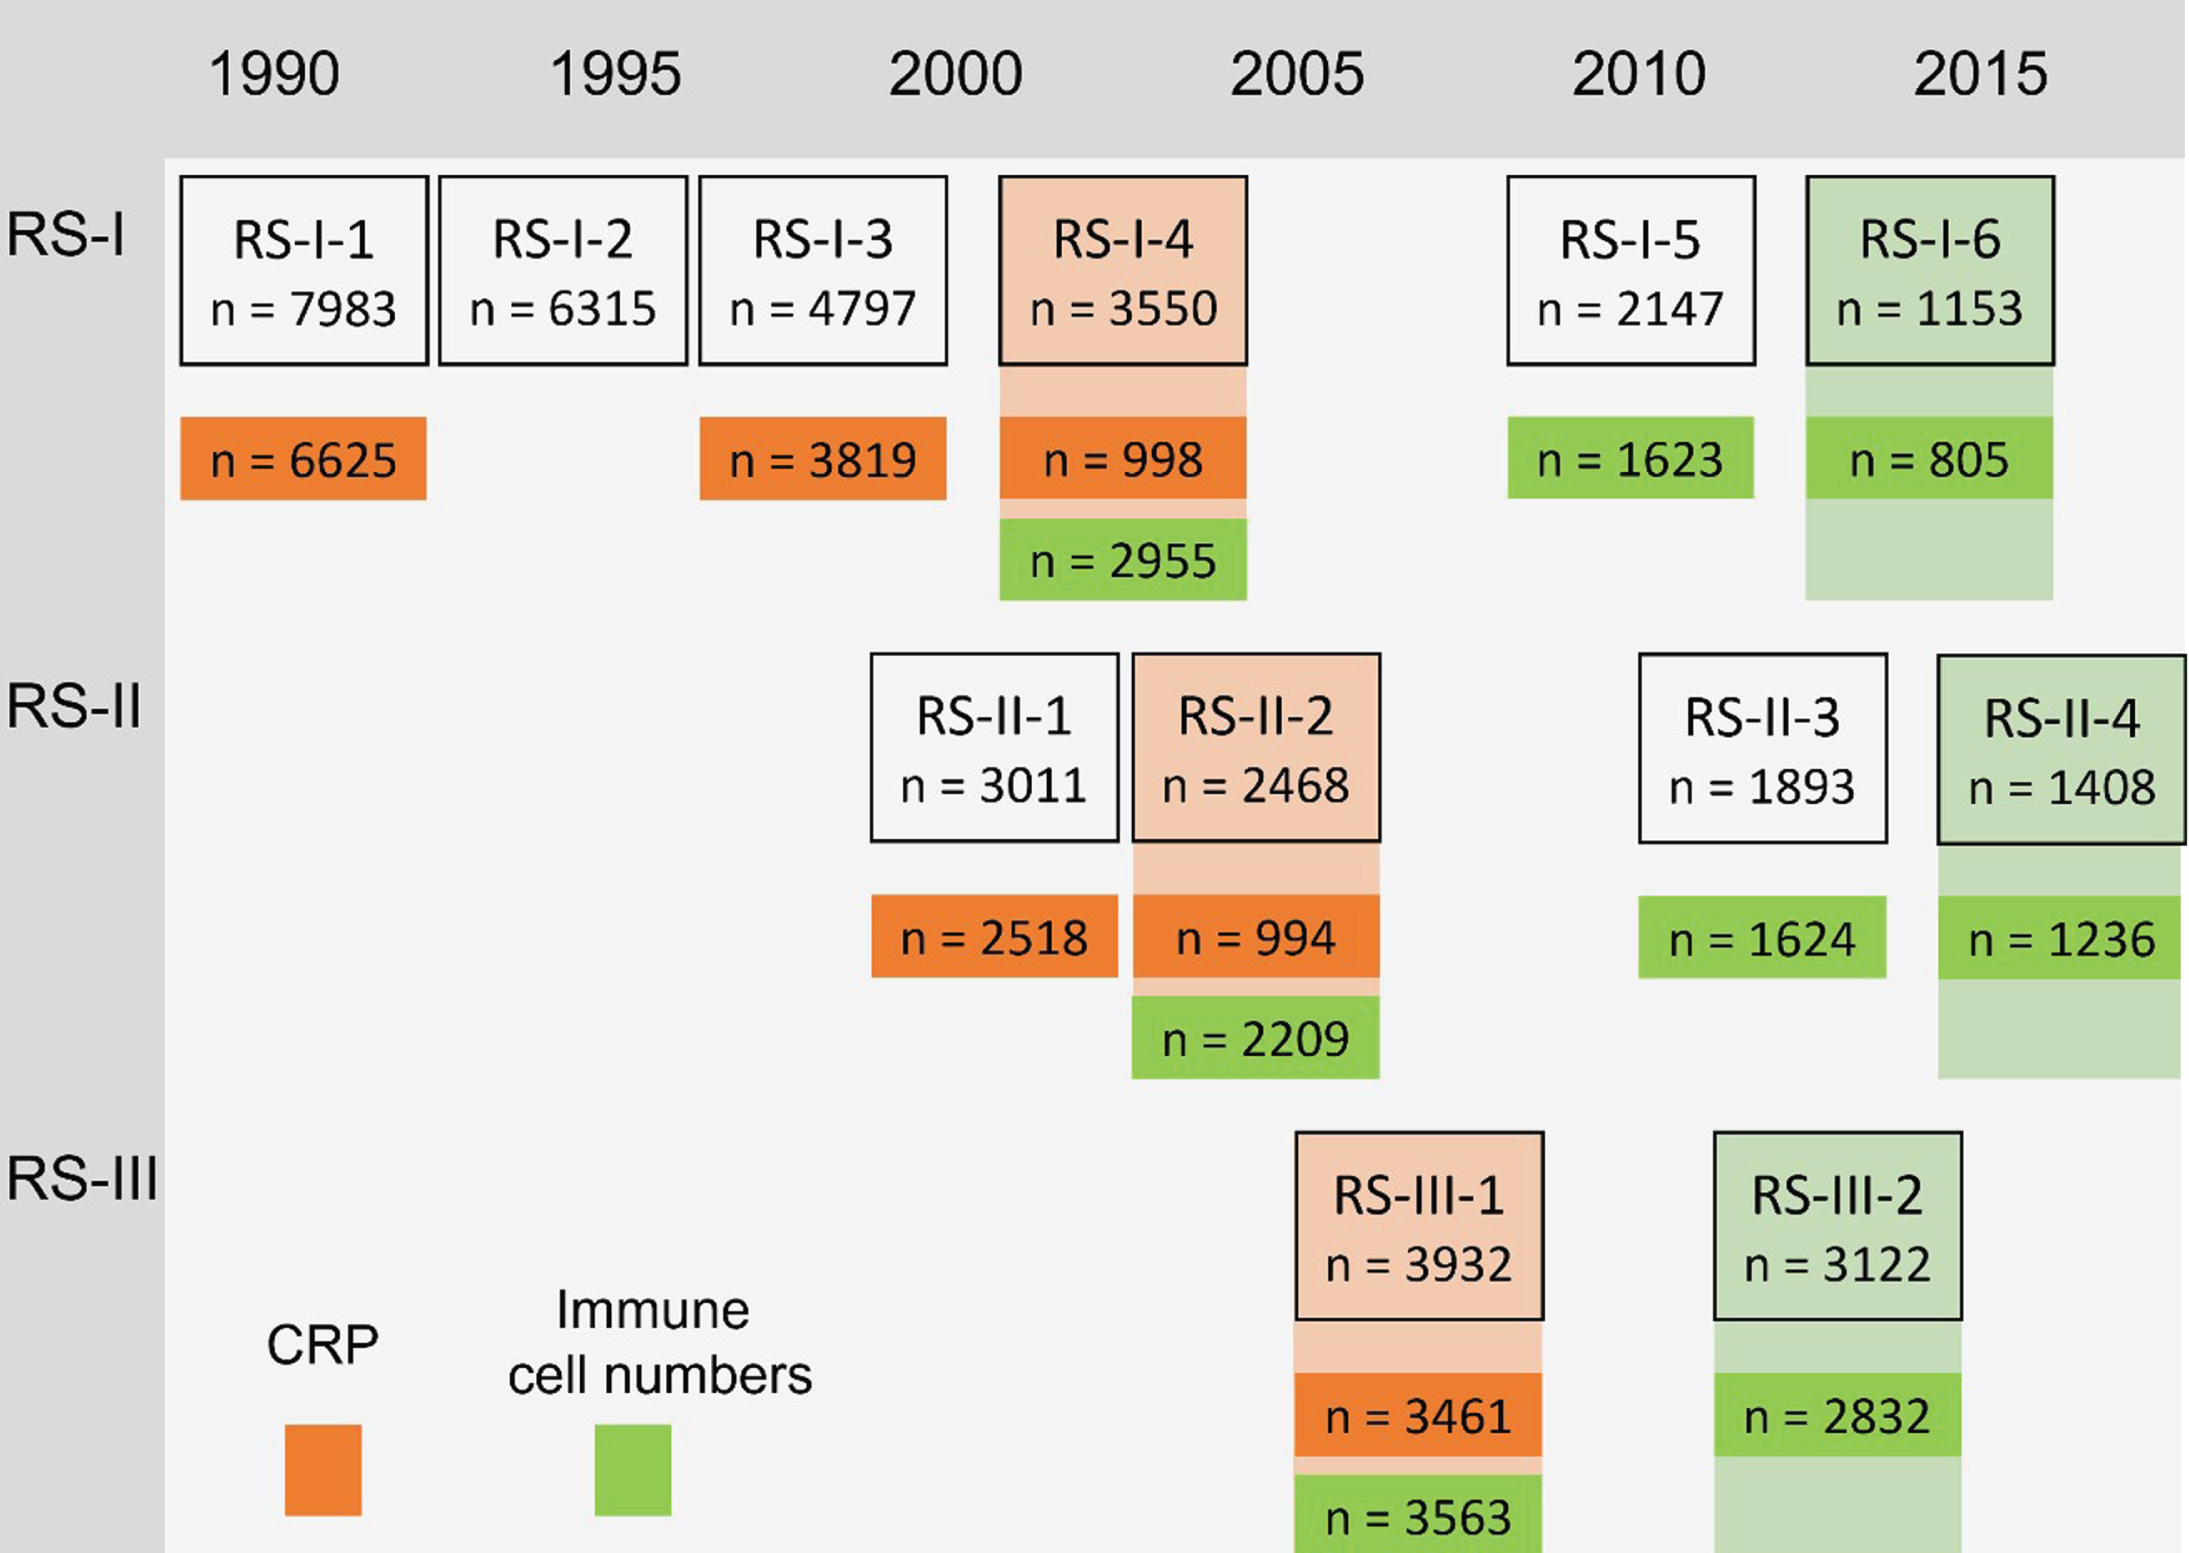
Participants underwent a maximum number of three venous blood samples at the research center after overnight fasting. Differential blood counts included leukocytes, monocytes, lymphocytes, granulocytes, and platelets in 109 per liter, which were assessed directly following the blood draw using the COULTER AcT diff2 Hematology Analyzer (Beckman Coulter, San Diego, CA, USA) or the Sysmex XS-800 Hematology analyzer (Sysmex, Norderstedt, Germany) for the latest measurement. These peripheral immune cell numbers were measured between 2002 and 2016: At three subsequent visits from the fourth visit of RS-I, at three subsequent visits from the second visit of RS-II and at two subsequent visits from the first visit of RS-III. High-sensitivity CRP was determined in serum which was stored at –20°C until performance of the measurements using Rate Near Infrared Particle Immunoassay (Immage Immunochemistry System, Beckman Coulter, Fullerton, CA). CRP was determined in several study rounds between 1990 and 2008: At the first, third and fourth visit of RS-I, at the first and second visit of RS-II and at the first visit of RS-III. The measurements and number of participants in each study round are shown in Fig. 1.
Fig. 1
Study measurements and number of participants. CRP, C-reactive protein. Numbers in the boxes represent the number of individuals who participated in the shown study round. Numbers in orange are participants who undertook CRP measurements and numbers in green participants who undertook measurements of peripheral immune cell numbers. In RS-I-4 and RS-II-2, CRP was only measured in a random subset, by taking into account sex and age representation. The last measurement of each of the markers (shown in shaded orange or green) was used for the analyses of prevalent PD, if the last measurement was missing, the previous measurement was used (n prevalent PD for analyses CRP = 105, n prevalent PD for analyses peripheral immune cell numbers = 34). For the peripheral immune cell numbers the total number of individuals with any of the markers available is shown, the numbers in the analyses might differ because the specific measurement is missing.
Because neutrophil counts were not available, we used granulocyte counts to calculate the granulocyte-to-lymphocyte ratio (GLR) as a proxy for the neutrophil-to-lymphocyte ratio (NLR). The GLR was calculated as the granulocyte count divided by the lymphocyte count. The platelet-to-lymphocyte ratio (PLR) was calculated as the platelet count divided by the lymphocyte count [19]. The systemic immune-inflammation index (SII) is usually calculated as the NLR times the platelet count [20]. Because of the absence of neutrophil counts in our study, we calculated an adapted SII as the GLR times the platelet count [19].
Assessment of Parkinson’s disease
Parkinsonism was defined either as the presence of hypo- or bradykinesia with resting tremor, rigidity, and/or postural imbalance as observed by any physician, or a clinical diagnosis of parkinsonism by a neurologist or geriatrician. PD entailed the criteria of parkinsonism, a clinical history suggestive of PD, and at least one of the following: (a) a clinical PD diagnosis by a neurologist or geriatrician; (b) a positive response to dopaminergic treatment; (c) or dopamine transporter scan findings consistent with PD.
We identified participants with parkinsonism at baseline using a two-phase design, which has been previously described in more detail [21]. First, participants were screened for self-reported parkinsonism, anti-parkinsonian drugs use and signs of parkinsonism at neurologic screening. Second, screen-positive participants were invited for a structured clinical examination to establish parkinsonism by a research physician with expertise in neurological disorders. This examination included neurological evaluation, medical history taking and assessment of additional information from medical records of general practitioners and specialists.
During follow-up, four overlapping modalities were used to detect parkinsonism: continuous monitoring of clinical records, continuous monitoring of anti-parkinsonian medication use, self-reporting of PD, and in-person screening at the research center. Medical records of screen-positives were studied, and case reports were evaluated by a panel led by an experienced neurologist. Medical records of all incident events continued to be evaluated for new information until the end of the study period. The time at risk for PD in this study ended at the first of the following: diagnosis of incident parkinsonism, loss to follow-up, death, or January 1, 2018.
Assessment of covariables
Cigarette smoking was assessed during home interviews and categorized into current and non-smokers. Body mass index (BMI) was calculated by dividing weight over height squared, both obtained during research center visits. Medication use was assessed during home interviews. The following drugs were considered immune system influencing drugs: corticosteroids for systemic use (Anatomical Therapeutical Chemical [ATC] code H02), immune-suppressants (L04), immune-stimulants (L03), anti-inflammatory and anti-rheumatic products (M01), HMG CoA reductase inhibitors (C10AA) and chemotherapeutics (L01). ATC code N04 was used to determine anti-parkinsonian drugs use.
Statistical analyses
Participants with at least one blood measurement were taken into account in the analyses. To normalize the skewed distribution of the blood markers, we used a natural log transformation. Multiple imputation was performed to impute missing covariables based on peripheral immune cell numbers and CRP, the outcomes and covariables. R version 4.0.3. was used for all analyses [22] and results were visualized using the ggplot2 package, version 3.3.2 [23].
To quantify the association between the peripheral immune cell numbers, CRP, and prevalent PD, we constructed logistic regression models with the markers as the determinant and prevalent PD as the outcome. We repeatedly measured peripheral immune cell numbers and CRP and included each participant’s last measurement of these markers as the determinant (see Fig. 1) because of the low prevalence of PD at earlier measurements. Model 1 was adjusted for baseline age and sex, model 2 was additionally adjusted for BMI, smoking status, and immune system influencing drugs, and model 3, specifically for the GLR, PLR, and adapted SII, was additionally adjusted for the lymphocyte count to determine whether these associations were driven by lymphocytes. For each marker, we also determined the interaction effect with sex. Because of the natural log transformation of the peripheral immune cell numbers and CRP, betas of the logistic regression models were multiplied with ln(2) to obtain odds ratios (ORs) for doubling of the markers.
To determine the association between repeatedly measured peripheral immune cell numbers and CRP and the risk of incident PD, we used joint models for longitudinal and survival data [24], package JM version 1.4.8 [25]. These models account for the correlations in the repeated measurements of individuals and their endogenous nature [26]. The timescale in the joint models was follow-up time, which started at the first blood draw. Model 1 was adjusted for baseline age and sex, model 2 was additionally adjusted for BMI, smoking status, and immune system influencing drugs, and model 3, specifically for the GLR, PLR, and adapted SII, was additionally adjusted for the lymphocyte count. For each marker, we also tested the interaction effect with sex. We used the Akaike information criterion (AIC) to determine the number of degrees of freedom for the splines of follow-up time and age. In addition, the AIC was used to assess whether to include random slopes or intercepts only. This resulted in a linear mixed model including splines with three degrees of freedom for follow-up time and age, and random slopes; and a Cox model with the estimated underlying value of the marker, sex, and the linear effect of age. Betas of the models were multiplied with ln(2) to provide hazard ratios (HRs) for a doubling of the peripheral immune cell numbers and CRP.
Nested case-control analyses
For the lymphocyte count, a marker previously shown to be associated with the risk of incident PD [14, 15], we analyzed the temporal average evolution in people with versus without PD using a nested case-control design. The aim of this analysis was to determine at which point in time the lymphocyte count in people with PD starts deviating from controls. Participants who were diagnosed with PD during follow-up (case) and had at least one measurement of lymphocytes before or after diagnosis were matched with three randomly selected participants who were free of PD (control) at the date of PD diagnosis of the case. Controls were matched on sex, birth year, and cohort, ensuring that time zero was the exact same date for cases and controls. For controls who developed parkinsonism after the event date of the case, all measurements from the parkinsonism diagnosis were censored.
Linear mixed models were constructed to analyze the evolution of the natural log transformed lymphocyte count in participants with and without PD ten years before and after the diagnosis. In this analysis, the R package JointAI (version 1.0.2.9000) [27] was used to perform a combined imputation and analysis using a full Bayesian approach [26]. Hence, the imputations took into account the entire trajectory of the longitudinal outcome in the imputation of missing covariables [26]. The model was adjusted for BMI and immune system influencing drugs. The AIC (of a preliminary analysis including only complete cases) was lowest for a model including splines with two degrees of freedom for follow-up time and linear random slopes. The exponent of the predicted values was calculated to transform the lymphocyte count back to the original scale.
Sensitivity analysis
As a first sensitivity analysis, we additionally adjusted the logistic regression models for anti-par-kinsonian drugs. Second, we excluded measurements of participants with cancer, heart failure, chronic obstructive pulmonary disease (COPD), and asthma, and we repeated the analyses for prevalent and incident PD in this subset. Third, because of our relatively small number of prevalent and incident cases of PD, we repeated the logistic regression and joint model analyses for the broader event definition of all-cause parkinsonism (PD, parkinsonism associated with pre-existent dementia, parkinsonism associated with use of anti-dopaminergic drugs, parkinsonism associated with cerebrovascular disease, multiple system atrophy, progressive supranuclear palsy, and other rare causes). Fourth, to assess whether analyzing the last instead of the first measurement of peripheral immune cell numbers and CRP influenced our results for prevalent PD, we repeated the logistic regression analyses with the first measurement of the markers (see Fig. 1). Finally, to allow better comparison of our results to previous studies, we repeated the longitudinal analyses by including only the first measurement of peripheral immune cell numbers and CRP (standardized on their original scale) and analyzing the association with incident PD using Cox proportional-hazards models.
RESULTS
Table 1 shows the baseline characteristics of the study population, including participants with at least one measurement of the peripheral immune cell numbers or CRP. The mean (standard deviation, SD) age of our sample was 65.1 (9.8) years and 57.5%were women. Current smokers included 21.0%of the total population and the average BMI was 26.9 (4.1) kg/m2. Immune system influencing drugs were used by 11.4%of the population. The median [interquartile range, IQR] number of CRP measurements was 1 [1–2] and the median [IQR] number of measurements for the other markers was 2 [1–2].
Table 1
Baseline characteristics
| Characteristic | Total (n = 12,642) | Prevalent PD (n = 85) | Incident PD (n = 162) |
| Age, y | 65.1 (9.8) | 77.1 (9.2) | 68.6 (8.8) |
| Women, n (%) | 7,274 (57.5) | 55 (64.7) | 76 (46.9) |
| Educationa, n (%) | |||
| Primary | 2,123 (17.0) | 17 (22.1) | 33 (20.6) |
| Lower | 5,008 (40.2) | 32 (41.6) | 61 (38.1) |
| Intermediate | 3,413 (27.4) | 23 (29.9) | 48 (30.0) |
| Higher | 1,916 (15.4) | 5 (6.5) | 18 (11.2) |
| Smokinga, n (%) | 2,613 (21.0) | 7 (9.1) | 16 (10.1) |
| Body mass indexa, kg/m2 | 26.9 (4.1) | 25.0 (3.7) | 26.6 (3.5) |
| Immune system influencing drugsa,b, n (%) | 1,432 (11.4) | 7 (8.3) | 16 (9.9) |
| Peripheral immune cell counts, 109/L | |||
| Leukocytes | 6.5 [5.5–7.7] | 6.4 [5.8–7.2]c | 6.4 [5.6–7.3]e |
| Monocytes | 0.4 [0.3–0.5] | 0.4 [0.3–0.5]c | 0.4 [0.4–0.6]e |
| Lymphocytes | 2.2 [1.8–2.6] | 1.8 [1.5–2.2]c | 2.0 [1.8–2.4]e |
| Granulocytes | 3.8 [3.1–4.8] | 4.1 [3.5–4.6]c | 3.7 [3.1–4.7]e |
| Platelets | 264.0 [223.0–308.0] | 237.5 [209.2–265.8]c | 239.0 [209.0–278.0]e |
| Peripheral immune cell-based ratios | |||
| GLR | 1.7 [1.4–2.3] | 2.2 [1.8–2.6]c | 1.9 [1.5–2.3]e |
| PLR | 120.0 [96.3–105.8] | 130.7 [109.0–145.5]c | 116.8 [92.2–143.6]e |
| Adapted SII | 456.7 [339.5–620.0] | 567.9 [364.5–715.9]c | 447.9 [315.0–611.6]e |
| CRP | 1.6 [0.7–3.3] | 1.7 [0.7–5.2]d | 1.6 [0.8–3.6]f |
GRL, granulocyte-to-lymphocyte ratio; PLR, platelet-to-lymphocyte ratio; Adapted SII, adapted systemic immune-inflammation index; CRP, C-reactive protein. Numbers are mean (standard deviation) or median [interquartile range] for continuous variables and number (percentage) for categorical variables. The first measurement is shown for each peripheral inflammation marker: for prevalent PD the characteristics of participants with prevalent PD at the first measurement of the markers are shown and for incident PD the characteristics of participants who developed PD during follow-up at the first measurement of the markers are shown. In the total sample: n = 8,553 for leukocytes, n = 8,550 for monocytes, n = 8,550 for lymphocytes, n = 8,551 for granulocytes, n = 8,552 for platelets, n = 8,550 for GLR, n = 8,548 for PLR, n = 8,548 for adapted SII, n = 12,426 for CRP. aEducation was missing in 1.4%, smoking in 1.5%, BMI in 1.6%and immune system influencing drugs in 0.4%. bAnatomical Therapeutical Chemical codes H02, L04, L03, M01, C10AA, and L01. c22 participants had prevalent PD. d84 participants had prevalent PD. e73 participants had incident PD. f160 participants had incident PD.
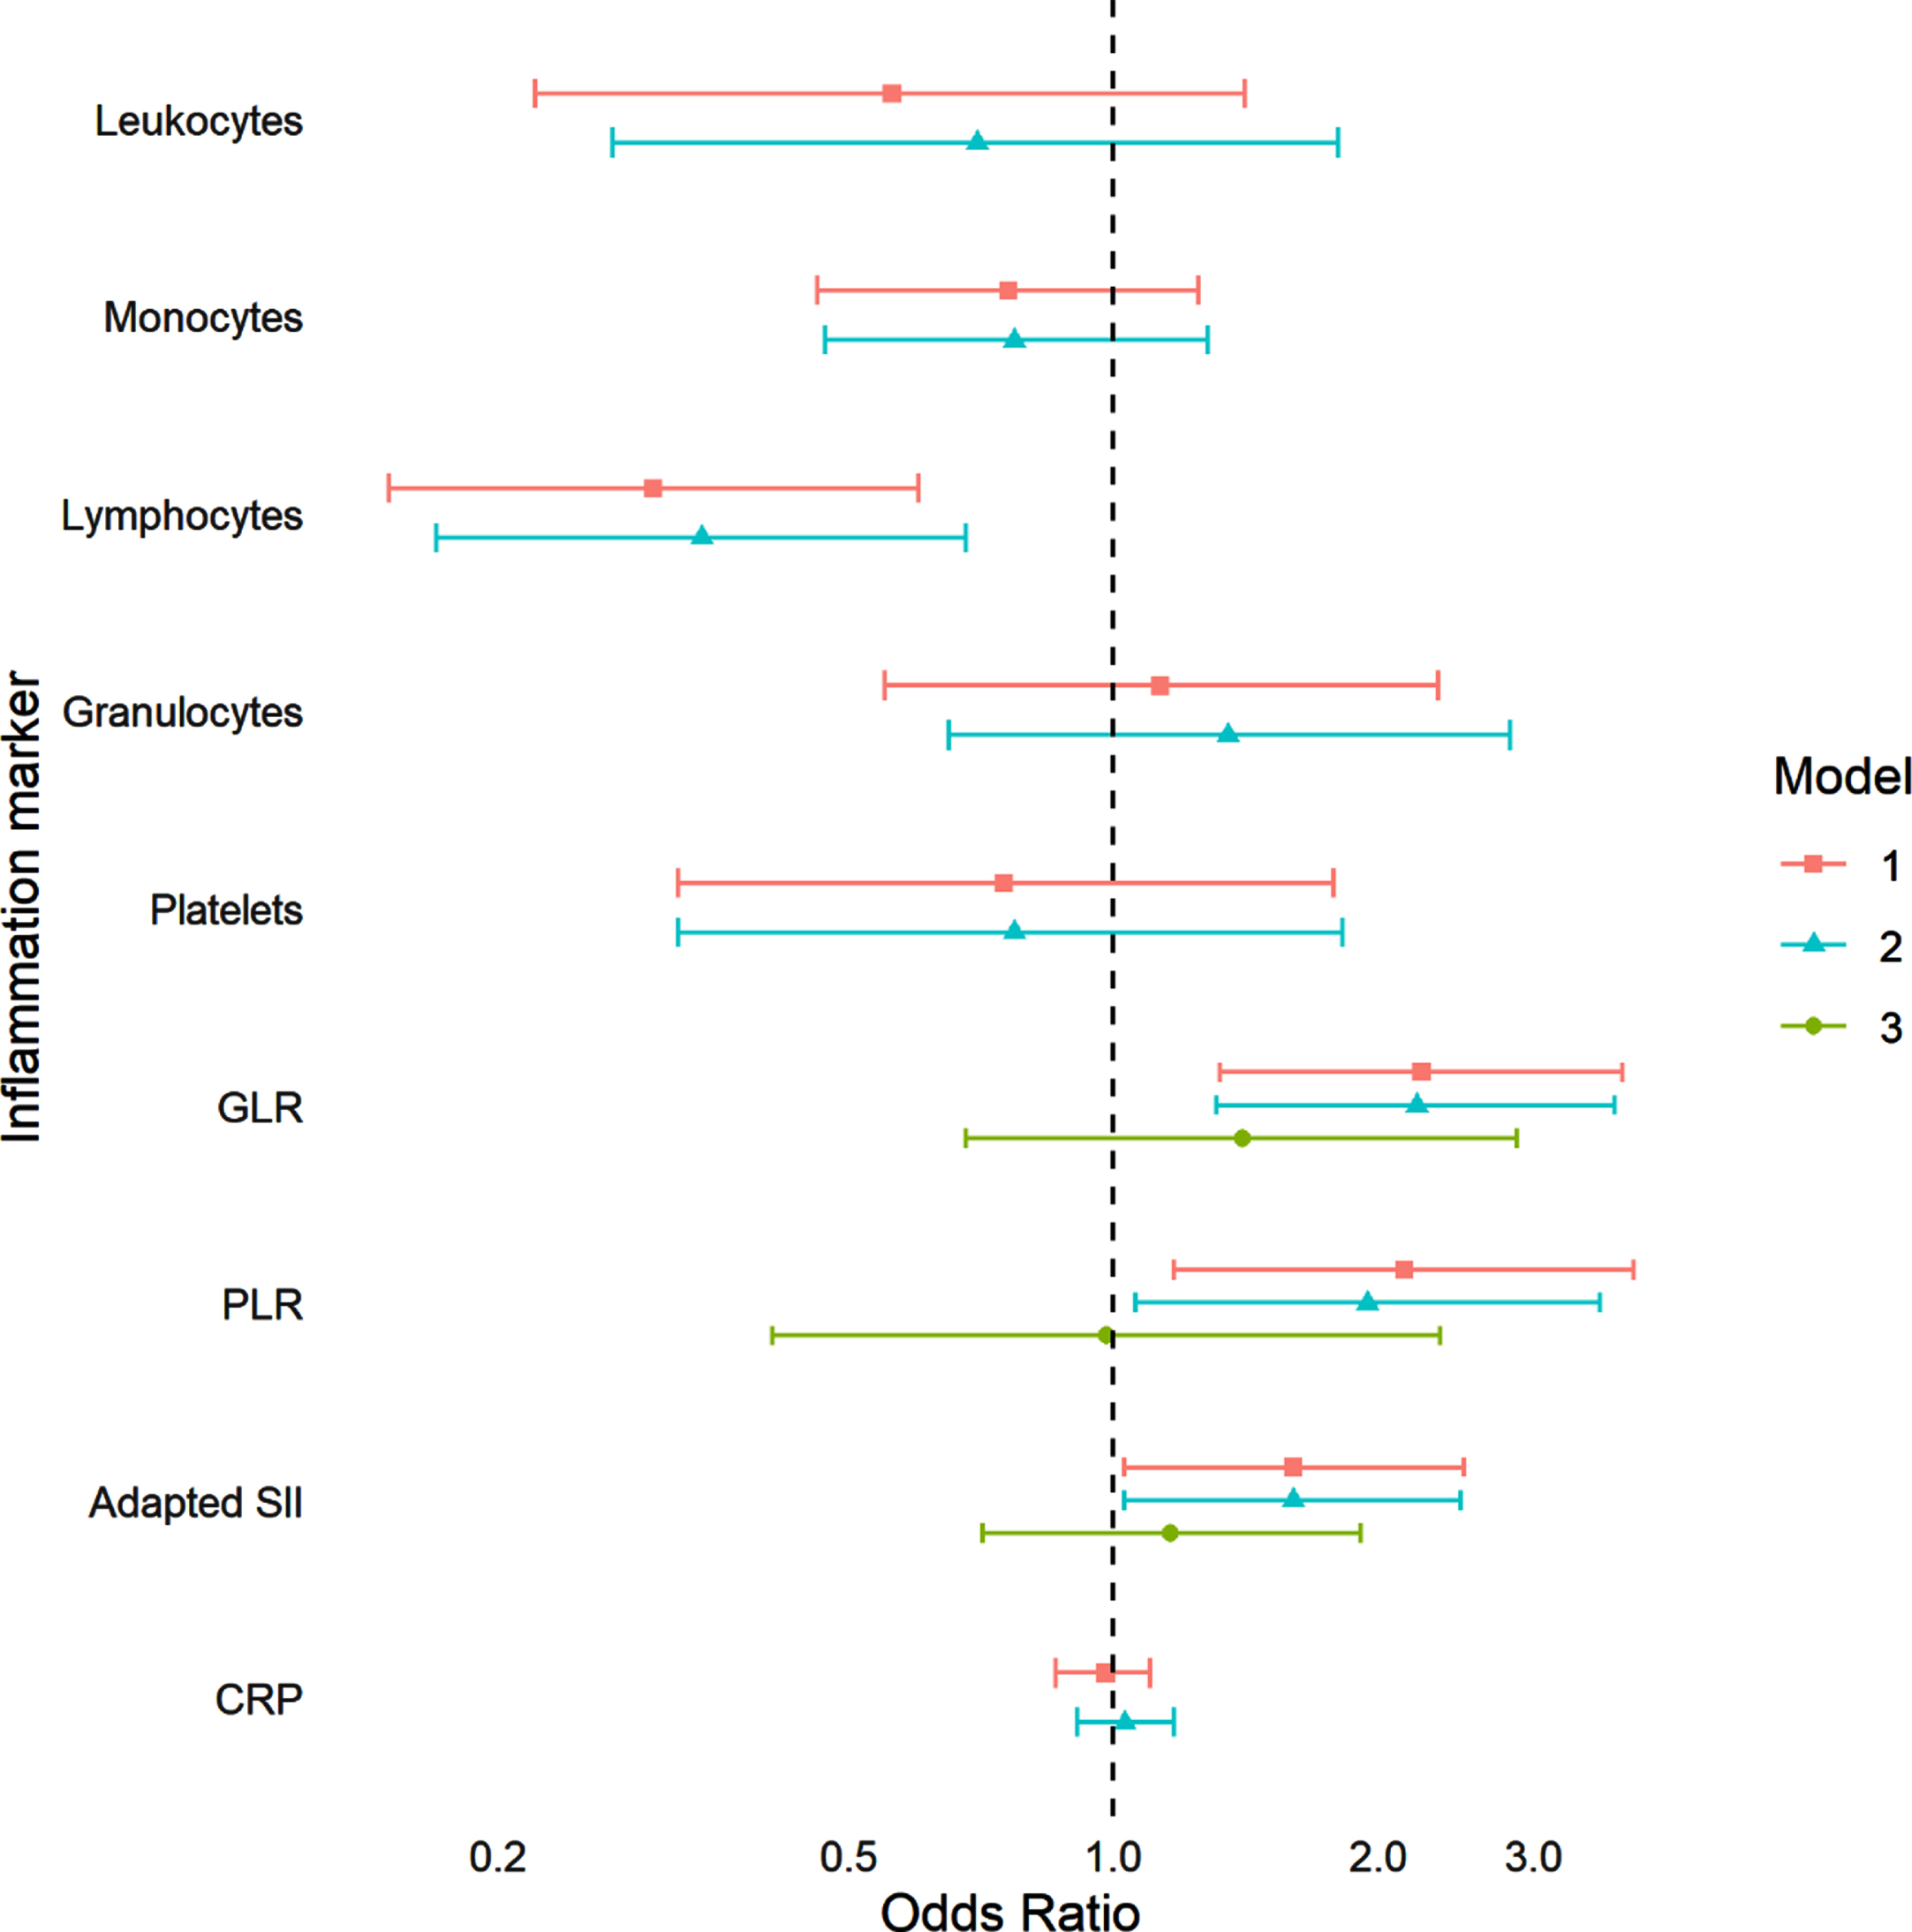
We included 34 participants with prevalent PD (mean (SD) age 76.6 (7.8) years, 52.9%women) in the logistic regression models of the association between peripheral immune cell numbers and prevalent PD. Figure 2 shows the results of the analyses for prevalent PD per doubling of the markers, model 1 and model 2 showed comparable results. Participants with a higher lymphocyte count were less likely to have prevalent PD (odds ratio (OR) model 2 : 0.34, 95%CI 0.17–0.68). Participants with a higher GLR, PLR, and adapted SII were more likely to have prevalent PD; however, these effects disappeared after subsequent adjustment for the lymphocyte count (OR GLR model 3 : 1.40, 95%CI 0.68–2.87, OR PLR model 3 : 0.98, 95%CI 0.41–2.35, OR adapted SII model 3 : 1.16, 95%CI 0.71–1.91). At the last measurement of CRP, 105 participants (mean (SD) age 78.4 (8.5) years, 61%women) had prevalent PD. CRP was not associated with prevalent PD. We subsequently tested the interaction effects of sex with the peripheral immune cell numbers and CRP, which were non-significant in all analyses of prevalent PD.
Fig. 2
Association between peripheral immune cell numbers, CRP, and prevalent Parkinson’s disease. GRL, granulocyte-to-lymphocyte ratio; PLR, platelet-to-lymphocyte ratio; Adapted SII, adapted systemic immune-inflammation index; CRP, C-reactive protein. Odds ratios are shown per doubling of the marker. Model 1 was adjusted for age and sex. Model 2 was adjusted for age, sex, BMI, smoking, and immune system influencing drugs. Model 3 was adjusted for age, sex, BMI, smoking, immune system influencing drugs, and lymphocytes. A total of 8,553 participants were included in the analyses with leukocytes, 8,550 in analyses with monocytes and lymphocytes, 8,551 in analyses with granulocytes, 8,552 in analyses with platelets, 8,550 in analyses with GLR, 8,548 in analyses with PLR and adapted SII, and 12,426 in analyses with CRP. Prevalent Parkinson’s disease was found in 34 participants for all analyses except for analyses with CRP, which included 105 participants with prevalent Parkinson’s disease. p-values model 1: Leukocytes: 0.22, Monocytes: 0.28, Lymphocytes: 0.001, Granulocytes: 0.74, Platelets: 0.51, GLR: 0.003, PLR: 0.01, Adapted SII: 0.04, CRP: 0.70. p-values model 2: Leukocytes: 0.46, Monocytes: 0.32, Lymphocytes: 0.002, Granulocytes: 0.42, Platelets: 0.55, GLR: 0.003, PLR: 0.03, Adapted SII: 0.04, CRP: 0.62. p-values model 3: GLR: 0.36, PLR: 0.97, Adapted SII: 0.04.
In the analyses of the peripheral immune cell numbers, during a median [IQR] follow-up of 14.4 years [10.0–19.0], 73 participants developed incident PD and 2,354 participants died. The mean (SD) age at diagnosis of these incident PD events was 76.6 (8.9) years and 47.1%were women. The hazard ratios of the joint models for higher leukocytes, lymphocytes, platelets, PLR, and adapted SII were suggestive of a decreased risk of incident PD and higher monocytes of an increased risk of incident PD (Table 2). However, confidence intervals were wide and none of these results were statistically significant. In the analyses of CRP, during a median [IQR] follow-up of 11.8 years [9.1–17.7], 160 participants developed incident PD and 5,735 participants died. The mean (SD) age at diagnosis was 77.4 (7.9) years and 47.5%were women. There was no evidence for an association of CRP with the risk of PD. Subsequent analyses of the interaction between sex and the peripheral immune cell numbers and CRP in the joint models revealed no significant results.
Table 2
Association between peripheral immune cell numbers, CRP and the risk of incident Parkinson’s disease
| Incident Parkinson’s disease Hazard ratio (95%CI) | |||||||
| Laboratory assessment | n/N | Model 1 | p | Model 2 | p | Model 3 | P |
| Blood cell types | |||||||
| Leukocytes | 73/8.435 | 0.66 (0.27–1.65) | 0.38 | 0.84 (0.33–2.12) | 0.72 | – | – |
| Monocytes | 73/8.432 | 1.87 (0.60–5.86)a | 0.28 | 2.06 (0.66–6.50)b | 0.22 | – | – |
| Lymphocytes | 73/8.432 | 0.89 (0.46–1.71) | 0.72 | 0.90 (0.47–1.75) | 0.76 | – | – |
| Granulocytes | 73/8.433 | 0.82 (0.38–1.79) | 0.62 | 0.99 (0.45–2.22) | 0.99 | – | – |
| Platelets | 73/8.435 | 0.75 (0.37–1.54) | 0.44 | 0.74 (0.32–1.71)b | 0.48 | – | – |
| Blood cell-based ratios | |||||||
| GLR | 73/8.432 | 1.02 (0.58–1.81) | 0.94 | 1.07 (0.61–1.90) | 0.81 | 0.90 (0.40–2.01) | 0.79 |
| PLR | 73/8.431 | 0.83 (0.51–1.36) | 0.47 | 0.81 (0.49–1.32) | 0.40 | 0.73 (0.35–1.49) | 0.38 |
| Adapted SII | 73/8.431 | 0.78 (0.51–1.19) | 0.25 | 0.81 (0.49–1.32) | 0.33 | 0.72 (0.43–1.22) | 0.22 |
| CRP | 160/12.132 | 1.03 (0.88–1.22) | 0.71 | 1.06 (0.88–1.26)b | 0.54 | – | – |
n, number of PD; N, total number; GRL, granulocyte-to-lymphocyte ratio; PLR, platelet-to-lymphocyte ratio; Adapted SII, adapted systemic immune-inflammation index; CRP, C-reactive protein. Hazard ratios are shown per doubling of the inflammation marker, confidence intervals are shown in the parentheses. Model 1 was adjusted for age and sex. Model 2 was adjusted for age, sex, BMI, smoking, and immune system influencing drugs. Model 3 was adjusted for age, sex, BMI, smoking, immune system influencing drugs, and lymphocytes. aModel with diagonal covariance matrix and only random intercepts was fitted because of convergence issues. bModel with diagonal covariance matrix was fitted because of convergence issues.
Nested case-control analyses
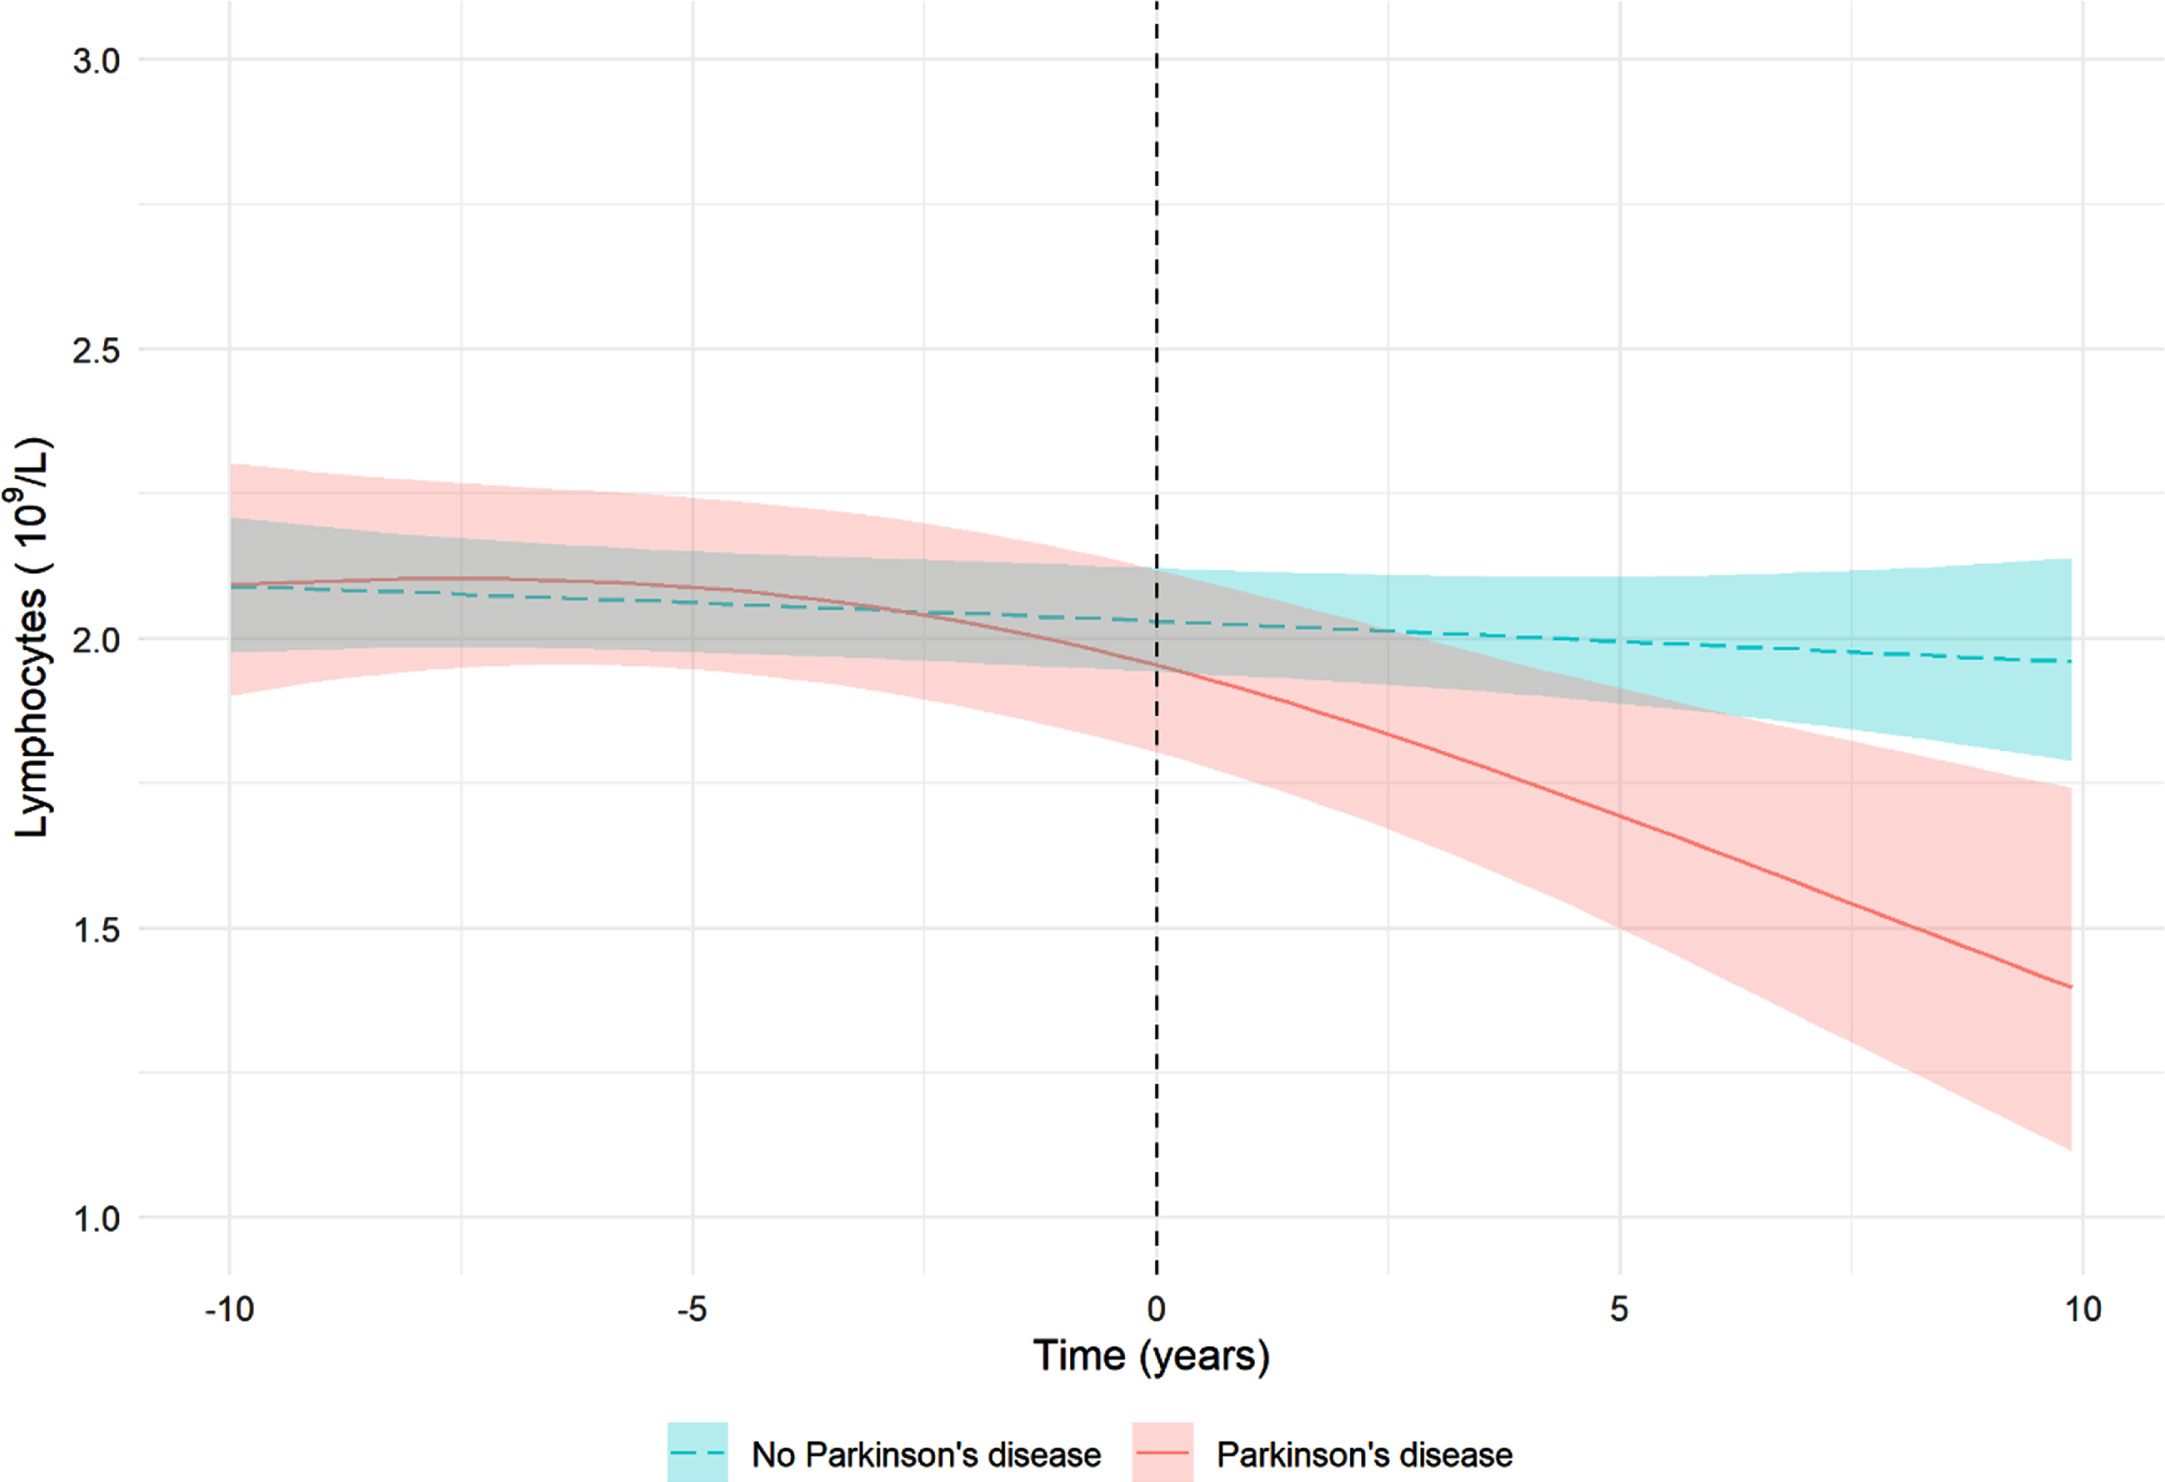
For the nested case-control analyses, two cases could not be matched to the minimum number of three controls and were excluded. Figure 3 visualizes the estimated temporal evolution of the lymphocyte count for participants with incident PD (n = 85) and matched controls (n = 255) using linear mixed models. This figure suggests that the lymphocyte count starts deviating in PD cases compared to controls at the time of disease diagnosis.
Fig. 3
Visualization of the association between lymphocyte count and Parkinson’s disease. The lines show the predicted lymphocyte count for participants with an average BMI (26.4) who do not use immune system influencing drugs. The shaded areas represent the corresponding 95%credible intervals. Of the 87 incident Parkinson’s disease events, 85 events could be matched with three controls and were included in the analysis. Matching was performed on birth year, sex, cohort, and the model was adjusted for BMI and immune system influencing drugs. Adjustment for smoking status was not possible because of the small number of smoking participants.
Sensitivity analyses
As a first sensitivity analysis, we additionally adjusted the models of prevalent PD for anti-parkinsonian drugs. These analyses modestly attenuated the results of the lymphocyte count, GLR, PLR and adapted SII (Supplementary Figure 1). Second, we excluded measurements of participants with comorbidities, results are shown in Supplementary Figure 2 and Supplementary Table 1. Results were comparable to those in the entire sample, although confidence intervals were wider because of smaller numbers. Third, we repeated the analyses for prevalent and incident parkinsonism as an outcome instead of PD. These analyses gave largely similar results (Supplementary Figure 3 and Supplementary Table 2). However, in contrast to the results for prevalent PD, the analyses for prevalent parkinsonism suggested participants with a higher monocyte count to be less likely to have parkinsonism and participants with a higher granulocyte count to be more likely to have parkinsonism, although these results were not statistically significant. Fourth, Supplementary Figure 4 shows the association between the first measurement of the peripheral immune cell numbers, CRP, and prevalent PD. At the first measurement of the peripheral immune cell numbers, 22 participants (mean (SD) age 74.5 (9.0) years, 50.0%women) had prevalent PD and at the first measurement of CRP, 84 participants (mean (SD) age 77.0 (9.2) years, 64.3%women) had prevalent PD. Effect sizes were similar compared to using the last measurement, although confidence intervals were wider because of a smaller sample of people with prevalent PD. Finally, we repeated the longitudinal analyses by only including the first measurement of the peripheral immune cell numbers and CRP (Supplementary Table 3) and the direction of the effects was comparable to the analyses with repeated measurements.
DISCUSSION
In this population-based study, we found a lower lymphocyte count in people with clinical PD. Although the GLR, PLR, and adapted SII were also associated with prevalent PD, these effects were driven by the lymphocyte count. Contrary to previous studies, we found no association between peripheral immune cell numbers, CRP, and incident PD.
Both the innate and adaptive immune system have been shown to be involved in the pathogenesis of PD [2, 3, 9]. However, whether immune system alterations trigger α-synuclein aggregation or act merely as a response thereof continues to be a source of debate [3, 8]. Studies have shown that α-synuclein can activate immune responses [3, 9, 28], but also that peripheral lymphocytes may infiltrate in the central nervous system, initiate α-synuclein aggregation and stimulate uptake of α-synuclein in the brain [3, 7, 28, 29]. Our results support the hypothesis that peripheral immune system alterations act as a response to already ongoing pathogenesis and neurodegeneration.
Our finding that participants with a higher lymphocyte count were less likely to have prevalent PD corroborates previous findings of lower levels of circulating lymphocytes in patients with prevalent PD [30–36]. This decrease has been shown to occur predominantly because of reduced numbers of CD4 + and CD3 + lymphocytes [37, 38]. Interestingly, our observed association between lymphocytes and prevalent PD was attenuated after adjustment for anti-parkinsonian drugs. Emerging evidence indicates that dopamine importantly connects the nervous system with the immune system [39–41]. Although lymphocytes express dopaminergic receptors and dopaminergic agents might thus act directly on peripheral immune cells [40], recent studies found no or only small effects of anti-parkinsonian drugs on peripheral immune cells [30, 41]. The influence of anti-parkinsonian drugs on the association between lymphocytes and PD is thus of interest for future research.
In addition to the effect of lymphocytes, we found that participants with a higher GLR, PLR, and adapted SII [19, 42] were more likely to have prevalent PD. However, this effect was driven by the lymphocyte count. A few cross-sectional studies have previously studied the relation between NLR and prevalent PD. Two studies found statistically significant higher mean NLR in patients with PD compared to controls (adjusted OR Liu et al.: 1.7, 95%CI 1.0–2.9) [43, 44], whereas three other studies reported largely similar NLR between cases and controls [36, 45, 46]. None of these previous studies adjusted their analysis for the lymphocyte count.
We also studied the relation between CRP and prevalent PD and, in contrast to a 2019 meta-analysis which found a standardized mean difference of 1.1 of patients with PD compared to controls [12], we did not find an association between this acute-phase protein and prevalent PD. The difference with the recent meta-analysis [12] might be partially explained by publication bias, as the meta-analysis included multiple small studies with large effect sizes.
Only a few previous studies have determined the association between leukocyte count and the risk of incident PD [14, 15]. Ton et al. studied the association between leukocyte count and the risk of PD in 5,828 participants of the Cardiovascular Health Study [47]. They reported a higher risk of incident PD with an increased leukocyte count, although this effect was not statistically significant [47]. In addition, Yazdani et al. repeatedly measured blood immune and inflammation markers in a longitudinal cohort study of 812,073 participants and followed the participants for the occurrence of PD [15]. In contrast to Ton et al., they found that an increased baseline leukocyte count (HR per SD increase: 0.86, 95%CI 0.80–0.93), driven by lymphocytes (HR per SD increase: 0.74, 95%CI 0.59–0.94), was associated with a decreased risk of PD. Finally, Jensen et al. studied differential leukocyte counts and the risk of incident PD in 312,590 participants of the UK biobank [14]. They showed that a lower lymphocyte count was associated with an increased risk of incident PD (OR per SD reduction: 1.18, 95%CI 1.07–1.32), which was also confirmed by their subsequent Mendelian randomization analyses. Jensen et al. also described a higher risk of PD with decreased eosinophil count, monocyte count and CRP, although these findings were not robust to sensitivity analyses.
Although our effect estimates of the association between repeatedly measured lymphocyte counts and PD risk might suggest a protective effect of a higher lymphocyte count, these findings were not statistically significant, were not reproduced in the subset without comorbidities and are in contrast with our nested case-control analyses suggesting that the lymphocyte count starts to deviate from the expected average after PD diagnosis. For the monocyte count, a previous study in people with REM-sleep behavior (RBD), which is considered a prodromal state of PD, found no difference between the percentage of total monocytes, but an increase in percentage of classical monocytes compared to controls [48]. In addition, Jensen et al. found some evidence of an increased risk of PD with reduced monocyte count and the study of Yazdani et al. found no association between monocytes and the risk of PD [14, 15]. Because of these conflicting previous findings and the wide confidence intervals around our estimates, the association between monocyte count and PD warrants further investigation.
Differences between our study and the studies by Yazdani et al. and Jensen et al. [14, 15] which reported a lower lymphocyte count to be associated with an increased risk of incident PD could be explained by several factors. First, these two previous studies [14, 15] used hospital discharge international classification of diseases (ICD) codes or self-reported PD to define incident events. Both studies reported a significant delay of multiple years between the first symptom onset and the date of incident PD recorded in the study [14, 15, 49]. We defined the date of diagnosis as the first moment the criteria for PD were met based on continuous follow-up of clinical records of general practitioners, nursing homes and hospitals, which has probably led to an earlier and more accurate event date of PD. However, exclusion of follow-up time several years before diagnosis did not substantially alter the results of the previous studies, suggesting that this discrepancy does not fully explain the different results. Second, selection bias may have played a role in the previous studies as the study of Yazdani et al. included blood samples from general health check-ups or referrals from outpatient visits and the study of Jensen et al. analyzed a subset of the already selected UK biobank cohort. Finally, and perhaps most importantly, our study only included 73 events of incident PD, thus giving rise to uncertainty about the estimated effects.
Strengths of this study include the representative population-based design with continuous follow-up for the occurrence of PD, which ensures timely and standardized diagnosis of PD events. Furthermore, we performed structural and repeated measurements of peripheral immune cell numbers and CRP, not relying on measurements performed as part of the clinical assessment of a patient.
The main limitation of the current study includes the small number of PD events. Although the incidence of PD in our study was similar to other population-based studies [50], the number of events remained small for the analyses of interest. The small number of events led to wide confidence intervals around the estimated effects and prohibited us from performing further stratifications to take into account the heterogeneity of PD. In addition, given the previously described association between peripheral immune cell numbers, CRP, and mortality [42, 51, 52], death could be considered a competing event in our analyses which could have biased the results. Furthermore, the joint and linear mixed models we used depend on the correct specification of fixed and random effects to estimate the underlying value of the marker, misspecification of these models could have impacted our findings. Finally, we did not measure lymphocyte subtypes and did not assess whether cytokines, which could have pro- or anti-inflammatory properties, were associated with prevalent or incident PD. A 2016 meta-analysis and several subsequent studies showed altered concentrations of peripheral pro- and anti-inflammatory cytokine levels in people with PD [53–56] and in people with REM-sleep behavior disorder [57] compared to controls, but the association with incident PD remains largely unknown [16, 17].
In conclusion, we found that participants with a higher lymphocyte count were less likely to have prevalent PD. In contrast to previous studies, however, we did not find an association between peripheral immune cell numbers nor CRP and the risk of incident PD. The longitudinal relation between the number of circulating immune cells, biomarkers of inflammation and the risk of PD warrants further investigation by large population-based studies.
ACKNOWLEDGMENTS
The authors are grateful to the study participants, the staff from the Rotterdam Study and the participating general practitioners and pharmacists. The Rotterdam Study is supported by the Erasmus MC University Medical Center and Erasmus University Rotterdam; The Netherlands Organization for Scientific Research (NWO); The Netherlands Organization for Health Research and Development (ZonMw); The Research Institute for Diseases in the Elderly (RIDE); The Netherlands Genomics Initiative (NGI); the Ministry of Education, Culture and Science; The Ministry of Health, Welfare and Sports; the European Commission (DG XII); and The Municipality of Rotterdam. This study received further support from Stichting ParkinsonFonds.
CONFLICT OF INTEREST
The authors have no conflict of interest to report.
SUPPLEMENTARY MATERIAL
[1] The supplementary material is available in the electronic version of this article: https://dx.doi.org/10.3233/JPD-212914.
REFERENCES
[1] | Bloem BR , Okun MS , Klein C ((2021) ) Parkinson’s disease. Lancet 397: , 2284–2303. |
[2] | Hirsch EC , Jenner P , Przedborski S ((2013) ) Pathogenesis of Parkinson’s disease. Mov Disord 28: , 24–30. |
[3] | Poewe W , Seppi K , Tanner CM , Halliday GM , Brundin P , Volkmann J , Schrag A-E , Lang AE ((2017) ) Parkinson disease. Nat Rev Dis Primers 3: , 17013. |
[4] | Berg D , Borghammer P , Fereshtehnejad S-M , Heinzel S , Horsager J , Schaeffer E , Postuma RB ((2021) ) Prodromal Parkinson disease subtypes —key to understanding heterogeneity. Nat Rev Neurol 17: , 349–361. |
[5] | Borghammer P , Van Den Berge N ((2019) ) Brain-first versus gut-first Parkinson’s disease: a hypothesis. J Parkinsons Dis 9: , S281–S295. |
[6] | Horsager J , Andersen KB , Knudsen K , Skjærbæk C , Fedorova TD , Okkels N , Schaeffer E , Bonkat SK , Geday J , Otto M , Sommerauer M , Danielsen EH , Bech E , Kraft J , Munk OL , Hansen SD , Pavese N , Göder R , Brooks DJ , Berg D , Borghammer P ((2020) ) Brain-first versus body-first Parkinson’s disease: a multimodal imaging case-control study. Brain 143: , 3077–3088. |
[7] | Galiano-Landeira J , Torra A , Vila M , Bové J ((2020) ) CD8 T cell nigral infiltration precedes synucleinopathy in early stages of Parkinson’s disease. Brain 143: , 3717–3733. |
[8] | Tan E-K , Chao Y-X , West A , Chan L-L , Poewe W , Jankovic J ((2020) ) Parkinson disease and the immune system —associations, mechanisms and therapeutics. Nat Rev Neurol 16: , 303–318. |
[9] | Kannarkat GT , Boss JM , Tansey MG ((2013) ) The role of innate and adaptive immunity in Parkinson’s disease. J Parkinsons Dis 3: , 493–514. |
[10] | Romano S , Savva GM , Bedarf JR , Charles IG , Hildebrand F , Narbad A ((2021) ) Meta-analysis of the Parkinson’s disease gut microbiome suggests alterations linked to intestinal inflammation. NPJ Parkinsons Dis 7: , 27. |
[11] | Heinzel S , Aho VTE , Suenkel U , von Thaler A-K , Schulte C , Deuschle C , Paulin L , Hantunen S , Brockmann K , Eschweiler GW , Maetzler W , Berg D , Auvinen P , Scheperjans F ((2020) ) Gut microbiome signatures of risk and prodromal markers of Parkinson disease. Ann Neurol 88: , 320–331. |
[12] | Qiu X , Xiao Y , Wu J , Gan L , Huang Y , Wang J ((2019) ) C-reactive protein and risk of Parkinson’s disease: a systematic review and meta-analysis. Front Neurol 10: , 384. |
[13] | Caggiu E , Arru G , Hosseini S , Niegowska M , Sechi G , Zarbo IR , Sechi LA ((2019) ) Inflammation, infectious triggers, and Parkinson’s disease. Front Neurol 10: , 122. |
[14] | Jensen MP , Jacobs BM , Dobson R , Bandres-Ciga S , Blauwendraat C , Schrag A , Noyce AJ , International Parkinson’s Disease Genomics Consortium (IPDGC) ((2021) ) Lower lymphocyte count is associated with increased risk of Parkinson’s disease. Ann Neurol 89: , 803–812. |
[15] | Yazdani S , Mariosa D , Hammar N , Andersson J , Ingre C , Walldius G , Fang F ((2019) ) Peripheral immune biomarkers and neurodegenerativediseases: A prospective cohort study with 20 years of follow-up. Ann Neurol 86: , 913–926. |
[16] | Wahner AD , Sinsheimer JS , Bronstein JM , Ritz B ((2007) ) Inflammatory cytokine gene polymorphisms and increased risk of Parkinson disease. Arch Neurol 64: , 836–840. |
[17] | Chen H , O’Reilly EJ , Schwarzschild MA , Ascherio A ((2007) ) Peripheral inflammatory biomarkers and risk of Parkinson’s disease. Am J Epidemiol 167: , 90–95. |
[18] | Ikram MA , Brusselle G , Ghanbari M , Goedegebure A , Ikram MK , Kavousi M , Kieboom BCT , Klaver CCW , de Knegt RJ , Luik AI , Nijsten TEC , Peeters RP , van Rooij FJA , Stricker BH , Uitterlinden AG , Vernooij MW , Voortman T ((2020) ) Objectives, design and main findings until 2020 from the Rotterdam Study. Eur J Epidemiol 35: , 483–517. |
[19] | Fest J , Ruiter R , Ikram A , Voortman T , van Eijck C , Stricker B ((2018) ) Reference values for white blood-cell-based inflammatory markers in the Rotterdam Study. Sci Rep 8: , 10566. |
[20] | Hu B , Yang X-R , Xu Y , Sun Y-F , Sun C , Guo W , Zhang X , Wang W-M , Qiu S-J , Zhou J , Fan J ((2014) ) Systemic immune-inflammation index predicts prognosis of patients after curative resection for hepatocellular carcinoma. Clin Cancer Res 20: , 6212–6222. |
[21] | Darweesh SK , Koudstaal PJ , Stricker BH , Hofman A , Ikram MA ((2016) ) Trends in the incidence of Parkinson disease in the general population: The Rotterdam Study. Am J Epidemiol 183: , 1018–1026. |
[22] | R Development Core Team ((2020) ) R Foundation for Statistical Computing, Vienna, Austria. |
[23] | Wickham H ((2016) ) gplot2: Elegant graphics for data analysis. Springer-Verlag, New York. |
[24] | Rizopoulos D (2012) Joint Models for Longitudinal and Time-to-Event Data: With Applications in R, Chapman and Hall/CRC. |
[25] | Rizopoulos D ((2010) ) JM: An R package for the joint modelling of longitudinal and time-to-event data. J Stat Softw 35: , 1–33. |
[26] | Erler NS , Rizopoulos D , Rosmalen Jv , Jaddoe VWV , Franco OH , Lesaffre EMEH ((2016) ) Dealing with missing covariates in epidemiologic studies: a comparison between multiple imputation and a full Bayesian approach. Stat Med 35: , 2955–2974. |
[27] | Erler NS , Rizopoulos D , Lesaffre EMEH (2019) JointAI: Joint analysis and imputation of incomplete data in R. arXiv e-prints, arXiv:1907.10867. |
[28] | Chana-Cuevas P , Salles-Gándara P , Rojas-Fernandez A , Salinas-Rebolledo C , Milan-Sole A ((2020) ) The potential role of SARS-COV-2 in the pathogenesis of Parkinson’s disease. Front Neurol 11: , 1044. |
[29] | Brochard V , Combadière B , Prigent A , Laouar Y , Perrin A , Beray-Berthat V , Bonduelle O , Alvarez-Fischer D , Callebert J , Launay J-M , Duyckaerts C , Flavell RA , Hirsch EC , Hunot S ((2009) ) Infiltration of CD4+lymphocytes into the brain contributes to neurodegeneration in a mouse model of Parkinson disease. J Clin Invest 119: , 182–192. |
[30] | Kustrimovic N , Comi C , Magistrelli L , Rasini E , Legnaro M , Bombelli R , Aleksic I , Blandini F , Minafra B , Riboldazzi G , Sturchio A , Mauri M , Bono G , Marino F , Cosentino M ((2018) ) Parkinson’s disease patientshave a complex phenotypic and functional Th1 bias: cross-sectionalstudies of CD4+Th1/Th2/T17 and Treg in drug-naïve anddrug-treated patients. J Neuroinflammation 15: , 205–205. |
[31] | Stevens CH , Rowe D , Morel-Kopp M-C , Orr C , Russell T , Ranola M , Ward C , Halliday GM ((2012) ) Reduced T helper and B lymphocytes in Parkinson’s disease. J Neuroimmunol 252: , 95–99. |
[32] | Niwa F , Kuriyama N , Nakagawa M , Imanishi J ((2012) ) Effects of peripheral lymphocyte subpopulations and the clinical correlation with Parkinson’s disease. Geriatr Gerontol Int 12: , 102–107. |
[33] | Baba Y , Kuroiwa A , Uitti RJ , Wszolek ZK , Yamada T ((2005) ) Alterations of T-lymphocyte populations in Parkinson disease. Parkinsonism Relat Disord 11: , 493–498. |
[34] | Bas J , Calopa M , Mestre M , Molleví DG , Cutillas B , Ambrosio S , Buendia E ((2001) ) Lymphocyte populations in Parkinson’s disease and in rat models of parkinsonism. J Neuroimmunol 113: , 146–152. |
[35] | Gruden MA , Sewell RD , Yanamandra K , Davidova TV , Kucheryanu VG , Bocharov EV , Bocharova OA , Polyschuk VV , Sherstnev VV , Morozova-Roche LA ((2011) ) Immunoprotection against toxic biomarkers is retained during Parkinson’s disease progression. J Neuroimmunol 233: , 221–227. |
[36] | Jin H , Gu H-y , Mao C-j , Chen J , Liu C-f ((2020) ) Association of inflammatory factors and aging in Parkinson’s disease. Neurosci Lett 736: , 135259. |
[37] | Jiang S , Gao H , Luo Q , Wang P , Yang X ((2017) ) The correlation of lymphocyte subsets, natural killer cell, and Parkinson’s disease: a meta-analysis. Neurol Sci 38: , 1373–1380. |
[38] | Sun C , Zhao Z , Yu W , Mo M , Song C , Si Y , Liu Y ((2019) ) Abnormal subpopulations of peripheral blood lymphocytes are involved in Parkinson’s disease. Ann Transl Med 7: , 637. |
[39] | Elgueta D , Contreras F , Prado C , Montoya A , Ugalde V , Chovar O , Villagra R , Henríquez C , Abellanas MA , Aymerich MS , Franco R , Pacheco R ((2019) ) Dopamine receptor D3 expression is altered in CD4+T-cells from Parkinson’s disease patients and its pharmacologic inhibition attenuates the motor impairment in a mouse model. Front Immunol 10: , 981. |
[40] | Kustrimovic N , Rasini E , Legnaro M , Marino F , Cosentino M ((2014) ) Expression of dopaminergic receptors on human CD4+T lymphocytes: flow cytometric analysis of naive and memory subsets and relevance for the neuroimmunology of neurodegenerative disease. J Neuroimmune Pharmacol 9: , 302–312. |
[41] | Kustrimovic N , Rasini E , Legnaro M , Bombelli R , Aleksic I , Blandini F , Comi C , Mauri M , Minafra B , Riboldazzi G , Sanchez-Guajardo V , Marino F , Cosentino M ((2016) ) Dopaminergic receptors on CD4+T naive and memory lymphocytes correlate with motor impairment in patients with Parkinson’s disease. Sci Rep 6: , 33738. |
[42] | Fest J , Ruiter TR , Groot Koerkamp B , Rizopoulos D , Ikram MA , van Eijck CHJ , Stricker BH ((2019) ) The neutrophil-to-lymphocyte ratio is associated with mortality in the general population: The Rotterdam Study. Eur J Epidemiol 34: , 463–470. |
[43] | Akıl E , Bulut A , Kaplan İ , Özdemir HH , Arslan D , Aluçlu MU ((2015) ) The increase of carcinoembryonic antigen (CEA),high-sensitivity C-reactive protein, and neutrophil/lymphocyte ratioin Parkinson’s disease. Neurol Sci 36: , 423–428. |
[44] | Liu Z , Fan Q , Wu S , Wan Y , Lei Y ((2021) ) Compared with the monocyte to high-density lipoprotein ratio (MHR) and the neutrophil to lymphocyte ratio (NLR), the neutrophil to high-density lipoprotein ratio (NHR) is more valuable for assessing the inflammatory process in Parkinson’s disease. Lipids Health Dis 20: , 35. |
[45] | Ataç Uçar C , Gökçe Çokal B , Ünal Artık HA , İnan LE , Yoldaş TK ((2017) ) Comparison ofneutrophil–lymphocyte ratio (NLR) in Parkinson’s diseasesubtypes. Neurol Sci 38: , 287–293. |
[46] | Inci I , Kusbeci OY , Eskut N ((2020) ) The neutrophil-to-lymphocyte ratio as a marker of peripheral inflammation in progressive supranuclear palsy: a retrospective study. Neurol Sci 41: , 1233–1237. |
[47] | Ton TGN , Jain S , Biggs ML , Thacker EL , Strotmeyer ES , Boudreau R , Newman AB , Longstreth WT Jr., Checkoway H ((2012) ) Markers of inflammation in prevalent and incident Parkinson’s disease in the Cardiovascular Health Study. Parkinsonism Relat Disord 18: , 274–278. |
[48] | Farmen K , Nissen SK , Stokholm MG , Iranzo A , Østergaard K , Serradell M , Otto M , Svendsen KB , Garrido A , Vilas D , Borghammer P , Santamaria J , Møller A , Gaig C , Brooks DJ , Tolosa E , Pavese N , Romero-Ramos M ((2021) ) Monocyte markers correlate with immune and neuronal brain changes in REM sleep behavior disorder. Proc Natl Acad Sci U S A 118: , e2020858118. |
[49] | Feldman AL , Johansson ALV , Gatz M , Flensburg M , Petzinger GM , Widner H , Lew MF , Pedersen NL , Wirdefeldt K ((2012) ) Accuracy and sensitivity of Parkinsonian disorder diagnoses in two Swedish national health registers. Neuroepidemiology 38: , 186–193. |
[50] | de Lau LML , Breteler MMB ((2006) ) Epidemiology of Parkinson’s disease. Lancet Neurol 5: , 525–535. |
[51] | Ruggiero C , Metter EJ , Cherubini A , Maggio M , Sen R , Najjar SS , Windham GB , Ble A , Senin U , Ferrucci L ((2007) ) White blood cell count and mortality in the Baltimore Longitudinal Study of Aging. J Am Coll Cardiol 49: , 1841–1850. |
[52] | Li Y , Zhong X , Cheng G , Zhao C , Zhang L , Hong Y , Wan Q , He R , Wang Z ((2017) ) Hs-CRP and all-cause, cardiovascular, and cancer mortality risk: A meta-analysis. Atherosclerosis 259: , 75–82. |
[53] | Qin X-Y , Zhang S-P , Cao C , Loh YP , Cheng Y ((2016) ) Aberrations in peripheral inflammatory cytokine levels in Parkinson disease: a systematic review and meta-analysis. JAMA Neurol 73: , 1316–1324. |
[54] | Nilsonne G , Lekander M ((2017) ) Circulating interleukin 6 in Parkinson disease. JAMA Neurol 74: , 607–608. |
[55] | Roy A , Mondal B , Banerjee R , Choudhury S , Chatterjee K , Dey S , Kumar H ((2021) ) Do peripheral immune and neurotrophic markers correlate with motor severity of Parkinson’s disease? J Neuroimmunol 354: , 577545. |
[56] | Kıçık A , Tüzün E , Erdoğdu E , Bılgıç B , Tüfekçıoğlu Z , Öztürk-Işik E , Hanağasi H , Gürvıt H ((2020) ) Neuroinflammation mediatorsare reduced in sera of Parkinson’s disease patients with mildcognitive impairment. Noro Psikiyatr Ars 57: , 15–17. |
[57] | Zhang H , Wang T , Li Y , Mao W , Hao S , Huang Z , Chan P , Cai Y ((2020) ) Plasma immune markers in an idiopathic REM sleep behavior disorder cohort. Parkinsonism Relat Disord 78: , 145–150. |


