
Sex-Related Longitudinal Change of Motor, Non-Motor, and Biological Features in Early Parkinson’s Disease
Abstract
Background:
Investigation of sex-related motor and non-motor differences and biological markers in Parkinson’s disease (PD) may improve precision medicine approach.
Objective:
To examine sex-related longitudinal changes in motor and non-motor features and biologic biomarkers in early PD.
Methods:
We compared 5-year longitudinal changes in de novo, untreated PD men and women (at baseline N = 423; 65.5%male) of the Parkinson’s Progression Markers Initiative (PPMI), assessing motor and non-motor manifestations of disease; and biologic measures in cerebrospinal fluid (CSF) and dopamine transporter deficit on DaTscanTM uptake.
Results:
Men experienced greater longitudinal decline in self-reported motor (p < 0.001) and non-motor (p = 0.009) aspects of experiences of daily living, such that men had a yearly increase in MDS-UPDRS part II by a multiplicative factor of 1.27 compared to women at 0.7, while men had a yearly increase in MDS-UPDRS part I by a multiplicative factor of 0.98, compared to women at 0.67. Compared to women, men had more longitudinal progression in clinician-assessed motor features in the ON medication state (p = 0.010) and required higher dopaminergic medication dosages over time (p = 0.014). Time to reach specific disease milestones and longitudinal changes in CSF biomarkers and DaTscanTM uptake were not different by sex.
Conclusion:
Men showed higher self-assessed motor and non-motor burden of disease, with possible contributions from suboptimal dopaminergic therapeutic response in men. However, motor features of disease evaluated with clinician-based scales in the OFF medication state, as well as biological biomarkers do not show specific sex-related progression patterns.
INTRODUCTION
Sex as a pivotal variable in biomedical research and sex differences are acknowledged as important determinants of the clinical and therapeutic management of neurodegenerative diseases [1, 2]. In Parkinson’s disease (PD), a thorough investigation of sex-related motor and non-motor differences and biological markers beginning at the earliest stages may support the stratification of patients for diagnosis, treatment, and prevention in the context of a multifactorial precision medicine approach [3].
Available evidence on motor symptoms suggests later disease onset and higher prevalence of tremor-dominant phenotype in women, supporting a more benign female phenotype in the early stages, possibly due to the effect of estrogens [4–8]. However, as PD progresses, women display greater risk of developing disabling levodopa-related complications, such as motor fluctuations and dyskinesia [9–12]. Notwithstanding, women are less likely to receive effective treatments for motor fluctuations such as deep brain stimulation (DBS), possibly in part due to different healthcare seeking and provider behaviors and weaker social support demonstrated for women with PD [13–15]. Taken together, these findings challenge the classic definition of a more benign phenotype in women and suggest that additional study is needed [16].
Investigations of sex-related differences in non-motor symptoms in PD suggest that women are more likely to experience mood symptoms such as anxiety, apathy, and sadness, as well as fatigue, pain, and non-motor fluctuations [11, 17–19]. In contrast, men may be more likely to experience excessive daytime sleepiness, cognitive dysfunction and decline, sexual and urinary complaints, impulse control disorders, and olfactory impairment [12, 19–22]. Longitudinally, men report more non-motor symptoms over time [23]. Specific to cognition, many studies find that woman perform better in measures of global cognition, memory, executive function, and language, while men exhibit better performance in visuospatial function [19, 24]. Overall, men appear to be at higher risk of developing dementia, with male sex emerging as a longitudinal risk factor for dementia in PD [12, 25, 26].
While several studies have addressed sex-related differences in motor and non-motor symptoms of PD, scant data are available investigating the impact of sex on longitudinal changes of cerebrospinal fluid (CSF) markers or dopamine transporter deficit on 123I ioflupane imaging (DaTscanTM) uptake [4, 27, 28]. Biological markers of disease provide additional insight into potential sex differences in the pathophysiology of PD.
Unfortunately, due to the epidemiological higher prevalence of PD in men, available data on motor and non-motor features as well as biological markers in the early stage of disease is largely driven by men [29]. Furthermore, the majority of studies are cross-sectional, single-center involving small sample sizes [3, 16]. As a result, available evidence on the topic is inconclusive. To date, only limited longitudinal data are available exploring sex-related progression of motor and non-motor impairment and CSF markers and DaTscanTM uptake in large samples of de novo, untreated PD patients.
Taking advantage of the longitudinal data of the Parkinson’s Progression Markers Initiative (PPMI), the present analysis aims to describe sex-related 5-year longitudinal changes in 1) motor features and motor aspects of experiences of daily living, 2) non-motor symptoms, and 3) biologic measures as CSF biomarkers and dopamine transporter deficit on DaTscanTM uptake in de novo, untreated PD patients.
METHODS
Study population
Data used in the preparation of this article were obtained from the PPMI database (ppmi-info.org/data). PPMI is an observational, international, multicenter investigation of clinical, biological, and neuroimaging markers of PD progression [30]. For up-to-date information on the study, visit ppmi-info.org. Briefly, newly diagnosed, untreated PD patients (n = 423) and age- and sex-matched healthy controls (n = 196) were included in the study. For PD, enrollment required at least two of three cardinal signs of disease (bradykinesia, rigidity, and/or rest tremor), diagnosis within two years of enrollment, no dopaminergic treatment for PD for at least 60 days prior to enrollment, absence of dementia per site investigator’s clinical assessment, and dopamine transporter deficit on DaTscanTM. PD participants were excluded for medical conditions precluding study participation, atypical or secondary parkinsonism, dopaminergic therapy for more than 60 days, or clinically significant MRI abnormality. The current analyses included baseline and longitudinal data up to 5-year follow up collected as of May 31, 2019 and available from the PPMI database (ppmi-info.org).
Standard protocol approvals, registrations, and patient consents
Approval was received from the ethical standards committee on human experimentation for all experiments with human participants. Written informed consent was obtained from all study participants (consent for research). The study is registered in clinicaltrials.gov as NCT01141023.
Clinical assessment measures
The assessment measures administered to enrolled participants are described in detail on the PPMI website. In brief, assessments included the Movement Disorder Society–Unified Parkinson’s Disease Rating Scale (MDS-UPDRS) parts I to IV. Once PD participants started dopaminergic treatment, defined as levodopa and/or dopamine agonists, the MDS-UPDRS part III was assessed in both OFF medications state (i.e., more than 6 h post–last dose) and ON state (i.e., approximately an hour after treatment). Participants treated with other PD medications (non-dopaminergic therapies such as monoamine oxidase inhibitors and/or anticholinergics and amantadine) were examined only in the ON state. Stage of disease was evaluated with the Hoehn and Yahr scale (H&Y) and activities of daily living with the modified Schwab and England (S&E). Based on previously described algorithms, patients were classified as belonging to either tremor dominant (TD) or non-TD (including Postural Instability and Gait Disorders and Indeterminate) phenotypes [31]. Additional assessments included the University of Pennsylvania Smell Identification Test (UPSIT) (administered at baseline only), Scales for Outcomes in Parkinson’s Disease-Autonomic (SCOPA-AUT), Geriatric Depression Scale (GDS), State-Trait Anxiety Inventory (STAI), Questionnaire for Impulsive-Compulsive Disorder in Parkinson’s disease (QUIP), REM sleep behavior disorder screening questionnaire (RBDSQ), and the Epworth Sleepiness Scale (ESS). Cognitive assessment included the Montreal Cognitive Assessment (MoCA), Hopkins Verbal Learning Task (HVLT), Benton Judgement of Line Orientation, Symbol Digit Modalities test, Letter Number Sequencing, and semantic fluency. Additional variables considered for these analyses included weight (kg), body mass index (BMI) and the vascular risk factor score (VRFS). VRFS was generated based on the modified Framingham Risk Score accounting for age, sex, self-reported hypertension and diabetes, BMI, measured blood pressure, and smoking history as previously described [32].
At baseline, all PD patients were untreated. Once participants started dopaminergic treatment, daily therapy was reported as cumulative levodopa equivalent dose (LED) as well as LED by dopamine-agonists agents (LED-DA) [33]. Medication reconciliation was performed at each visit for all participants and categorized by class as appropriate, including anti-depressants, medications for cognition, anxiolytics, and antipsychotics.
For a more comprehensive evaluation of motor-related disease progression, time to reach the following clinical milestones was considered: 1) start of any anti-parkinsonian therapy (including levodopa, dopamine-agonist and monoamine oxidase inhibitors); 2) onset of motor complications (defined as MDS-UPDRS part IV > 0); 3) onset of dyskinesias (defined as MDS-UPDRS item 4.1 or 4.2 > 0); 4) onset of motor fluctuations (defined as MDS-UPDRS item 4.3, 4.4 or 4.5 > 0); 5) initiation of any device-aided treatment for PD (i.e., DBS or levodopa/carbidopa intestinal gel).
Dopamine SPECT imaging
Participants were also evaluated with DaTscanTM at screening and years 1, 2, and 4 to assess the degree of presynaptic dopaminergic dysfunction, analyzed as per the imaging technical operations manual (http://www.ppmi-info.org).
Biological samples
Biological samples included CSF biomarkers (β-amyloid1–42 (Aβ1–42), total tau (T-tau), phosphorylated tau (P-tau181) and unphosphorylated total α-synuclein (α-syn). The details of sample collection, processing and biomarker analyses have been reported elsewhere. These measures are available only for baseline and years 1, 2, and 3.
Statistical analysis
Data were examined for motor function, non-motor symptoms, cognition, CSF biomarkers, and DatScan response variables from baseline to year 5 using summary statistics. Two sample t-tests and Chi-square tests were used for continuous and categorical variables respectively to compare baseline characteristics between men and women. Generalized linear models were applied to evaluate whether the longitudinal trajectory of mean response variables differs between genders under the assumption that a link function of each mean response changes linearly over time. Specifically, gender, time, and these interactions were included in generalized linear models while adjusting for significant baseline characteristics (side most affected, VRFS, and BMI obtained from the two-sample t-test at a nominal level of 0.05). As appropriate, models were also adjusted for LED. An identity link and logit link were chosen for continuous response variable and binary response variable, respectively. Generalized estimating equations under the auto regression working correlation structure were applied to fit generalized linear models to data and Wald tests were used to assess if the interaction term between gender and time in generalized linear models was statistically significant. Significant gender effects from the same generalized linear models for non-motor symptoms were also provided when the interaction term was not significant. Due to skewness of CSF biomarker variables, each biomarker was ranked prior to employing the generalized linear models. Multiple hypotheses are being tested at once which increases the probability of committing false statistical inferences, namely Type I error. To account for inflation of Type I error rate, a Bonferroni corrected p-value (0.05 divided by the total number of comparisons provided for each table) was used for each group of outcomes, i.e., 0.05/8 = 0.006 for motor symptoms, 0.05/9 = 0.006 for non-motor symptoms, 0.05/9 = 0.006 for cognitive testing, 0.05/7 = 0.007 for CSF Biomarkers, 0.05/5 = 0.01 for DatScan outcomes, and 0.05/5 = 0.01 for time to event outcomes. Although the Bonferroni method is very conservative, it was selected for simplicity. Since this analysis is purely observational, interpretation of significant p-values prior to the Bonferroni adjustments are provided and may provide some clinically meaningful insight. Counts, percent, gender effect p-values, Cox Proportional Hazard Ratios as well as Kaplan Meier curves were provided for time to event analyses.
Data availability statement
Any data not published within the article is available at ppmi-info.org/data.
RESULTS
Demographic features at baseline of the 423 participants stratified by sex (65.4%men) are shown in Table 1. There were no significant differences between men and women in terms of age, education, ethnicity, race, family history of PD, duration of PD, age at time of PD diagnosis, or ApoE4 genotype. Compared to men, women had significantly lower weight, BMI, and VRFS (all p < 0.001), while men were more likely to have the right side as the most affected (p = 0.017). Thus, all the subsequent analyses are adjusted for baseline VRFS, side most affected, and BMI.
Table 1
Demographic and clinical features at baseline
| Parkinson’s Disease | Healthy Control | |||||
| Variable | Men (N = 277) | Women (N = 146) | p | Men (N = 126) | Women (N = 70) | p |
| Age (y) | ||||||
| Mean (SD) | 62.2 (9.7) | 60.7 (9.6) | 61.6 (10.9) | 59.4 (11.7) | ||
| Min–Max | 34.8–84.9 | 33.5–81.8 | 30.6–82.7 | 31.0–83.7 | ||
| Missing | 0 | 0 | 0.142 | 0 | 0 | 0.180 |
| Education* | ||||||
| < 13 y | 46 (17%) | 29 (20%) | 15 (12%) | 14 (20%) | ||
| 13–23 y | 229 (83%) | 116 (79%) | 110 (87%) | 56 (80%) | ||
| > 23 y | 2 (1%) | 1 (1%) | 1 (1%) | 0 (0%) | ||
| Missing | 0 | 0 | 0.404 | 0 | 0 | 0.126 |
| Ethnicity | ||||||
| Hispanic/Latino | 6 (2%) | 3 (2%) | 1 (1%) | 2 (3%) | ||
| Not Hispanic/Latino | 271 (98%) | 143 (98%) | 125 (99%) | 68 (97%) | ||
| Missing | 0 | 0 | 1.0 | 0 | 0 | 0.291 |
| Race* | ||||||
| White | 259 (94%) | 132 (90%) | 118 (94%) | 64 (91%) | ||
| Black/African-American | 3 (1%) | 3 (2%) | 6 (5%) | 3 (4%) | ||
| Asian | 5 (2%) | 3 (2%) | 0 (0%) | 1 (1%) | ||
| Other | 10 (4%) | 8 (5%) | 2 (2%) | 2 (3%0 | ||
| Missing | 0 | 0 | 0.253 | 0 | 0 | 0.563 |
| Family history of PD | ||||||
| Yes | 72 (26%) | 31 (21) | 8 (6%) | 2 (3%) | ||
| No | 205 (74%) | 114 (79) | 118 (84%) | 68 (97%) | ||
| Missing | 0 | 1 | 0.295 | 0 | 0 | 0.500 |
| Duration of disease (months) | ||||||
| Mean (SD) | 6.4 (5.9) | 7.1 (7.4) | N/A | N/A | ||
| Min–Max | 0.4–34.8 | 0.9–35.8 | ||||
| Missing | 0 | 0 | 0.302 | N/A | ||
| Age at PD diagnosis | ||||||
| Mean (SD) | 61.6 (9.7) | 60.1 (9.6) | N/A | N/A | ||
| Min–Max | 34.2–84.8 | 31.8–81.6 | ||||
| Missing | 0 | 0 | 0.125 | N/A | ||
| Side Most Affected | ||||||
| Left | 105 (38%) | 74 (51%) | N/A | N/A | ||
| Right | 163 (59%) | 71 (49%) | ||||
| Symmetric | 9 (3%) | 1 81%) | ||||
| Missing | 0 | 0 | 0.017 | N/A | ||
| Vascular Risk Factor Score | ||||||
| Mean (SD) | 13.1 (4.2) | 11.3 (5) | 13.2 (4.3) | 11.5 (5.7) | ||
| Min–Max | –1.0–24.0 | –3.0–24.0 | –2.0–21.0 | –3.0–25.0 | ||
| Missing | 0 | 0 | < 0.001 | 0 | 0 | 0.031 |
| Weight (kg) | ||||||
| Mean (SD) | 88.1 (14.7) | 69.3 (14.6) | 86.6 (12.0) | 67.5 (14.4) | ||
| Min–Max | 58.9–135.0 | 39.5–117.7 | 64.4–124.0 | 43.2–105.0 | ||
| Missing | 1 | 0 | < 0.001 | 0 | 1 | < 0.001 |
| Body Mass Index | ||||||
| Mean (SD) | 27.9 (4.1) | 25.7 (5.3) | 27.6 (3.6) | 25.7 (5.4) | ||
| Min–Max | 19.8–41.6 | 16.7–43.8 | 20.7–39.6 | 17.5–42.3 | ||
| Missing | 1 | 1 | < 0.001 | 0 | 1 | 0.014 |
| MDS-UPDRS part III | ||||||
| Mean (SD) | 21.2 (9.1) | 20.3 (8.5) | 1.2 (2.1) | 1.2 (2.4) | ||
| Min–Max | 6.0–51.0 | 4.0–46.0 | 0.0–13.0 | 0.0–10.0 | ||
| Missing | 0 | 0 | 0.342 | 2 | 0 | 0.969 |
*Analysis based on reduced categories. MDS-UPDRS, Movement Disorder Society Unified Parkinson’s Disease Rating Scale; PD, Parkinson’s disease.
Motor symptoms
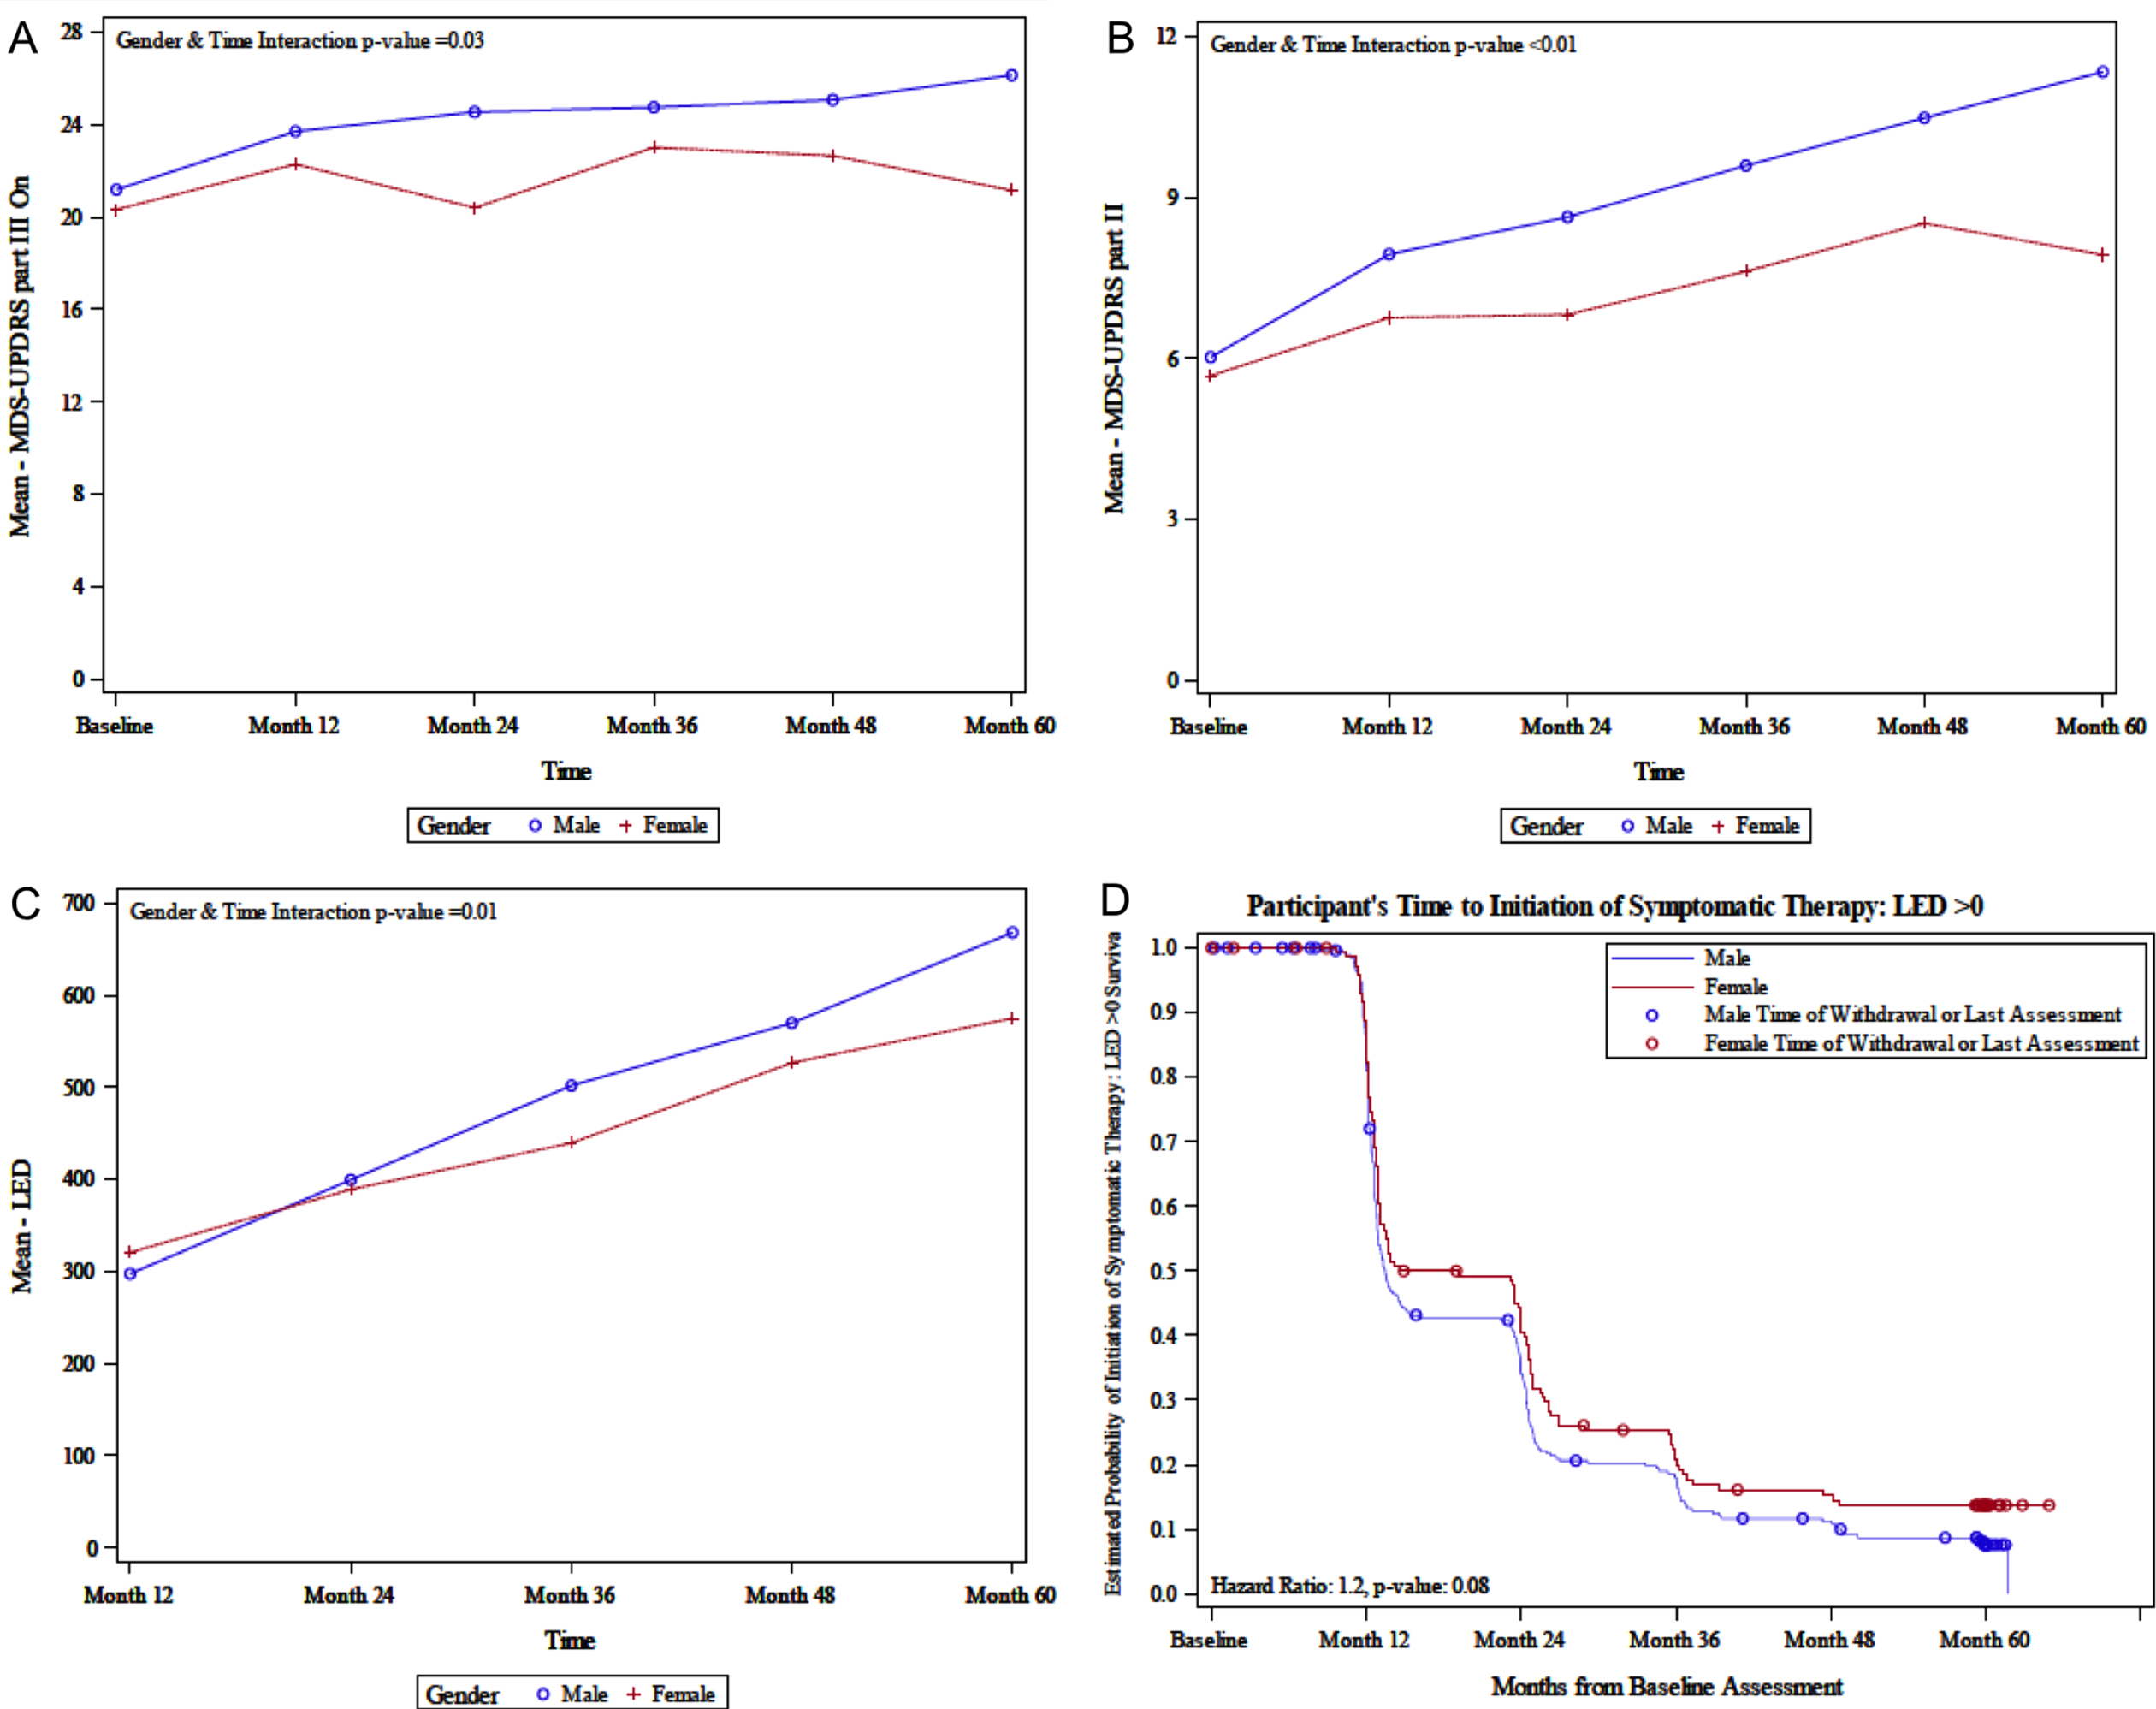
The 5-year longitudinal data on clinical measures according to sex are shown in Table 2. MDS-UPDRS part III ON assessment increased over time in men (i.e., for every year increase, the mean MDS-UPDRS part III ON score increased by a multiplicative factor of 1.81 in men, compared to 1.03 in women, p = 0.010) (Fig. 1A). However, after adjusting for multiple comparisons, the time and sex interaction p-value is no longer significant. MDS-UPDRS part III (Motor Examination) OFF assessment significantly increased over time in both sexes (p < 0.001). Similarly, MDS-UPDRS part II (Motor Aspects of Experiences of Daily Living) increased over time in both men and women, with men experiencing a larger increase (i.e., for every year increase, the mean MDS-UPDRS part II increases by a multiplicative factor of 1.27 in men, compared to 0.70 in women, p < 0.001) (Fig. 1B). The odds of experiencing H&Y stages 3–5 (p < 0.001), TD classification (p = 0.038), and the mean S&E (p < 0.001) increase over time, with no significant sex interaction. After adjusting for multiple comparisons, TD/non-TD classification was no longer significant. Both LED and LED-DA (each adjusted for age and BMI) increased over time, with men experiencing a higher increase in LED (i.e., for every year increase, the mean LED increases by a multiplicative factor of 104.6 in men, compared to 78.1 in women, p = 0.014) (Fig. 1C). After adjusting for multiplicity, sex interaction for LED is no longer significant.
Table 2
Motor symptoms over time in Parkinson’s disease
| Men (N = 277) | Women (N = 146) | ||||||||||||||
| Variable | Baseline (N = 277) | Month 12 (N = 261) | Month 24 (N = 248) | Month 36 (N = 239) | Month 48 (N = 230) | Month 60 (N = 210) | Baseline (N = 146) | Month 12 (N = 136) | Month 24 (N = 130) | Month 36 (N = 127) | Month 48 (N = 117) | Month 60 (N = 107) | p Interaction (Sex vs Time)** | p Time | Time effect |
| MDS-UPDRS part III OFF | |||||||||||||||
| Mean (SD) | 21.2 (9.1) | 25.6 (11.3) | 28.3 (11.6) | 29.9 (11.8) | 31.9 (11.7) | 32.3 (12.1) | 20.3 (8.5) | 24.0 (10.6) | 24.7 (10.1) | 27.8 (12.8) | 30.3 (13.5) | 28.9 (13.5) | 0.100 | < 0.001 | 2.72 |
| Min–Max | 6.0–51.0 | 2.0–67.0 | 4.0–57.0 | 5.0–57.0 | 6.0–69.0 | 7.0–70.0 | 4.0–46.0 | 5.0–51.0 | 3.0–56.0 | 4.0–80.0 | 8.0–80.0 | 6.0–90.0 | |||
| Missing | 0 | 41 | 58 | 66 | 62 | 56 | 0 | 24 | 36 | 43 | 36 | 33 | |||
| MDS-UPDRS part III ON | |||||||||||||||
| Mean (SD) | 21.2 (9.1) | 23.7 (11.2) | 24.6 (11.7) | 24.8 (11.8) | 25.1 (12.7) | 26.2 (13.3) | 20.3 (8.5) | 22.3 (10.2) | 20.4 (10.0) | 23.0 (13.0) | 22.7 (13.8) | 21.2 (12.8) | 0.010 | M: < 0.001 | M: 1.81 |
| Min–Max | 6.0–51.0 | 2.0–67.0 | 0.0–68.0 | 1.0–59.0 | 1.0–69.0 | 3.0–85.0 | 4.0–46.0 | 1.0–48.0 | 0.0–49.0 | 0.0–65.0 | 1.0–7.0 | 0.0–68.0 | W: < 0.001 | W: 1.03 | |
| Missing | 0 | 15 | 14 | 16 | 13 | 12 | 0 | 7 | 7 | 8 | 9 | 9 | |||
| Hoehn and Yahr | |||||||||||||||
| Stages 0–2 | 276 (100%) | 213 (97%) | 182 (96%) | 160 (92%) | 155 (92%) | 145 (94%) | 145 (99%) | 108 (95%) | 90 (95%) | 75 (89%) | 67 (83%) | 69 (92%) | 0.699 | < 0.001 | 0.71 |
| Stages 3–5 | 1 (0%) | 7 (3%) | 8 (4%) | 13 (8%) | 14 (8%) | 10 (6%) | 1 (1%) | 6 (5%) | 5 (5%) | 9 (11%) | 14 (17%) | 6 (8%) | |||
| Missing | 0 | 41 | 58 | 66 | 61 | 55 | 0 | 22 | 35 | 43 | 36 | 32 | |||
| TD/non-TD classification | |||||||||||||||
| TD | 199 (72%) | 150 (68%) | 126 (66%) | 106 (61%) | 106 (63%) | 94 (61%) | 100 (69%) | 73 (65%) | 62 (66%) | 55 (65%) | 45 (56%) | 38 (51%) | 0.646 | 0.038 | 0.93 |
| Non-TD | 78 (28%) | 70 (32%) | 64 (34%) | 67 (39%) | 63 (37%) | 60 (39%) | 45 (31%) | 40 (35%) | 32 (34%) | 29 (35%) | 36 (44% | 36 (49%) | |||
| Missing | 0 | 41 | 58 | 66 | 61 | 56 | 1 | 23 | 36 | 43 | 36 | 33 | |||
| MDS-UPDRS part II | |||||||||||||||
| Mean (SD) | 6.0 (4.3) | 7.9 (5.2) | 8.6 (5.3) | 9.6 (5.5) | 10.5 (6.5) | 11.3 (7.0) | 5.7 (4.0) | 6.8 (4.8) | 6.8 (5.0) | 7.6 (5.9) | 8.5 (6.9) | 7.9 (6.2) | < 0.001 | M: < 0.001 | M: 1.27 |
| Min–Max | 0.0–20.0 | 0.0–36.0 | 0.0–36.0 | 1.0–29.0 | 0.0–37.0 | 0.0–40.0 | 0.0–22.0 | 0.0–25.0 | 0.0–27.0 | 0.0–29.0 | 0.0–36.0 | 0.0–39.0 | W: < 0.001 | W: 0.70 | |
| Missing | 0 | 2 | 2 | 0 | 3 | 1 | 1 | 0 | 0 | 0 | 0 | 1 | |||
| Modified Schwab &England Activities of Daily Living | |||||||||||||||
| Mean (SD) | 93.0 (5.5) | 90.2 (6.7) | 88.3 (7.8) | 87.4 (7.6) | 85.4 (9.3) | 83.4 (13.1) | 93.5 (6.5) | 91.0 (6.8) | 89.7 (8.3) | 88.1 (9.0) | 86.3 (12.3) | 86.1 (13.0) | 0.428 | < 0.001 | –1.54 |
| Min–Max | 80.0–100.0 | 70.0–100.0 | 60.0–100.0 | 60.0–100.0 | 50.0–100.0 | 10.0–100.0 | 70.0–100.0 | 70.0–100.0 | 60.0–100.0 | 50.0–100.0 | 20.0–100.0 | 20.0–100.0 | |||
| Missing | 0 | 4 | 1 | 1 | 1 | 1 | 0 | 0 | 0 | 0 | 2 | 1 | |||
| LED | |||||||||||||||
| Mean (SD) | NA | 297.6 (231.9) | 399.5 (307.4) | 501.8 (342.4) | 569.8 (332.9) | 668.0 (345.9) | NA | 320.6 (243.6) | 389.1 (321.4) | 439.4 (325.4) | 526.5 (362.8) | 574.9 (321.4) | 0.014 | M: < 0.001 | M: 104.62 |
| Min–Max | 30.3–1,600.0 | 50.0–2,268.0 | 50–2,474.0 | 100–3,020 | 121.1–3,184.0 | 37.5–1,400 | 70–2,040 | 60.6–1,938 | 50–2,050 | 120–1,496 | W: < 0.001 | W: 78.08 | |||
| Missing | 108 | 45 | 26 | 21 | 18 | 64 | 33 | 23 | 19 | 19 | |||||
| LED-DA | |||||||||||||||
| Mean (SD) | NA | 158.5 (84.5) | 178.9 (129.2) | 190.9 (110.6) | 201.6 (121.8) | 200.8 | NA | 161.9 (111.0) | 191.5 (129.0) | 174.0 (122.2) | 178.6 (11.71) | 173.9 (115.1) | 0.882 | 0.005 | 9.17 |
| Min–Max | 30.3–450 | 5.0–825.0 | 5.0–480.0 | 5.0–600.0 | 20.0–600.0 | 12.5–450.0 | 40.0–675.0 | 5.0–675.0 | 25.0–675.0 | 37.5–675.0 | |||||
| Missing | 201 | 201 | 164 | 148 | 136 | 106 | 90 | 65 | 65 | 63 | |||||
All models are also adjusted for baseline BMI, LED, Vascular Risk Factor Score (VRF), and Side Most Affected. LED and LED-DA models only include baseline BMI, VRF Score, and Side Most Affected. Significance level for comparisons is p < 0.006 (after Bonferroni correction). **If interaction is significant, we find time effect p-values for men and women separately. Otherwise, we provide time effect p-value without stratifying by sex. LED, Levodopa equivalent dose; LED-DA, dopamine agonist levodopa equivalent dose; MDS-UPDRS, Movement Disorders Society-Unified Parkinson’s Disease Rating Scale: TD, tremor dominant.
Fig. 1
A) Sex-related change in MDS-UPDRS part III ON; B) Sex-related change in MDS-UPDRS part II; C) Sex-related change in LED; D) Sex-related estimated probability of initiation of symptomatic therapy. LED, levodopa equivalent dose; MDS-UPDRS, the Movement Disorder Society–Unified Parkinson’s Disease Rating Scale.
Non-motor symptoms
Five-year longitudinal changes in non-motor symptoms adjusted for side most affected, VRFS, and BMI in men and women are shown in Table 3. MDS-UPDRS part I (Non-Motor Aspects of Experiences of Daily Living) worsened over time in both men and women, with a significant sex interaction (p = 0.009), with men having a larger increase over time. For every year, mean MDS-UPDRS part I increased by a multiplicative factor of 0.98 in men compared to 0.67 in women (p < 0.001 for both). However, this interaction was no longer significant after correcting for multiple comparisons. For individual questions for MDS-UPDR part I, scores significantly worsened over time for cognitive impairment, hallucinations and psychosis, depressed mood, anxious mood, apathy, dopamine dysregulation syndrome, sleep problems, daytime sleepiness, pain, and constipation (all p < 0.001) with no sex interaction (Supplementary Table 1). A significant sex interaction was present for urinary symptoms (p = 0.023), light-headedness (p = 0.041), and fatigue (p = 0.011), with men more likely to have at least mild symptoms over time. However, these interactions were no longer significant after correcting for multiple comparisons (Supplementary Table 1). For other non-motor symptoms scales, there were no sex interactions for depression (GDS); autonomic dysfunction (SCOPA-Aut total score); anxiety (STAI total, trait, or state subscores); impulsivity (QuIP); RBD; or daytime sleepiness (ESS), although depression, autonomic dysfunction, RBD, and daytime sleepiness worsened significantly over time (all p < 0.001) (Table 3). Hyposmia was measured with the UPSIT at baseline and hyposmia or anosmia was present in 92%of men (N = 256) and 88%of women (N = 128) (p = 0.109).
Table 3
Non-motor symptoms over time in Parkinson’s disease
| Men (N = 277) | Women (N = 146) | ||||||||||||||
| Variable | Baseline (N = 277) | Month 12 (N = 261) | Month 24 (N = 248) | Month 36 (N = 239) | Month 48 (N = 230) | Month 60 (N = 210) | Baseline (N = 146) | Month 12 (N = 136) | Month 24 (N = 130) | Month 36 (N = 127) | Month 48 (N = 117) | Month 60 (N = 107) | p Interaction (Sex vs Time)** | p Time** | Time effect** |
| MDS-UPDRS part I | |||||||||||||||
| Mean (SD) | 5.3 (3.8) | 6.5 (4.4) | 7.6 (5.1) | 8.2 (5.3) | 9.3 (6.0) | 9.6 (6.3) | 6.1 (4.5) | 7.3 (5.0) | 7.8 (4.9) | 8.5 (5.7) | 8.7 (5.9) | 9.1 (6.3) | 0.009 | M: < 0.001 | M:0.98 |
| Min–Max | 0.0–18.0 | 0.0–29.0 | 0.0–26.0 | 0.0–32.0 | 0.0–30.0 | 0.0–34.0 | 0.0–24.0 | 0.0–27.0 | 0.0–23.0 | 0.0–36.0 | 0.0–36.0 | 0.0–36.0 | W: < 0.001 | W: 0.67 | |
| Missing | 0 | 2 | 0 | 0 | 3 | 1 | 1 | 0 | 0 | 0 | 2 | 1 | |||
| Geriatric Depression Scale Total Score | |||||||||||||||
| Mean (SD) | 2.3 (2.3) | 2.5 (2.7) | 2.6 (2.9) | 2.6 (2.6) | 2.7 (2.8) | 2.8 (2.7) | 2.4 (2.7) | 2.8 (3.3) | 2.6 (2.9) | 2.7 (3.2) | 2.4 (2.8) | 2.8 (3.1) | 0.535 | < 0.001 | 0.11 |
| Min–Max | 0.0–13.0 | 0.0–15.0 | 0.0–15.0 | 0.0–13.0 | 0.0–15.0 | 0.0–13.0 | 0.0–14.0 | 0.0–14.0 | 0.0–13.0 | 0.0–14.0 | 0.0–15.0 | 0.0–15.0 | |||
| Missing | 0 | 2 | 0 | 0 | 2 | 2 | 0 | 0 | 1 | 0 | 2 | 2 | |||
| SCOPA-AUT Total Score | |||||||||||||||
| Mean (SD) | 9.5 (6.4) | 10.9 (6.8) | 11.8 (7.2) | 12.4 (7.3) | 13.2 (7.8) | 14.1 (8.3) | 9.5 (5.7) | 10.9 (5.6) | 11.1 (5.2) | 12.3 (6.5) | 12.2 (6.8) | 12.7 (7.7) | 0.293 | < 0.001 | 0.85 |
| Min–Max | 0.0–39.0 | 0.0–45.0 | 0.0–42.0 | 0.0–34.0 | 0.0–42.0 | 0.0–45.0 | 0.0–28.0 | 0.0–29.0 | 0.0–26.0 | 0.0–29.0 | 0.0–39.0 | 0.0–42.0 | |||
| Missing | 3 | 5 | 2 | 2 | 2 | 2 | 5 | 2 | 1 | 1 | 2 | 2 | |||
| STAI Total Score | |||||||||||||||
| Mean (SD) | 64.0 (17.4) | 64.0 (17.3) | 64.7 (17.6) | 63.9 (17.2) | 65.0 (18.1) | 64.9 (18.2) | 67.8 (19.9) | 67.4 (21.0) | 65.8 (20.2) | 66.5 (21.2) | 64.3 (20.1) | 64.8 (21.5) | 0.069 | 0.617 | -0.09 |
| Min–Max | 40.0–120.0 | 40.0–117.0 | 40.0–129.0 | 40.0–129.0 | 40.0–112.0 | 40.0–150.0 | 40.0–137.0 | 40.0–142.0 | 40.0–132.0 | 40.0–135.0 | 40.0–142.0 | 40.0–138.0 | |||
| Missing | 0 | 2 | 0 | 2 | 2 | 3 | 1 | 0 | 0 | 1 | 3 | 2 | |||
| STAI Trait Subscore | |||||||||||||||
| Mean (SD) | 31.5 (8.8) | 32.2 (8.9) | 32.3 (8.9) | 32.4 (9.1) | 32.7 (9.5) | 32.6 (9.5) | 34.0 (10.5) | 33.7 (11.0) | 33.2 (10.6) | 33.5 (11.0) | 32.5 (10.7) | 33.1 (11.7) | 0.073 | 0.356 | 0.09 |
| Min–Max | 20.0–60.0 | 20.0–58.0 | 20.0–59.0 | 20.0–63.0 | 20.0–58.0 | 20.0–75.0 | 20.0–63.0 | 20.0–73.0 | 20.0–66.0 | 20.0–64.0 | 20.0–69.0 | 20.0–68.0 | |||
| Missing | 0 | 2 | 0 | 2 | 2 | 2 | 1 | 0 | 0 | 1 | 3 | 2 | |||
| STAI State Subscore | |||||||||||||||
| Mean (SD) | 32.5 (9.8) | 31.8 (9.2) | 32.4 (9.6) | 31.6 (9.0) | 32.3 (9.7) | 32.3 (9.6) | 33.8 (11.0) | 33.7 (11.3) | 32.6 (11.0) | 33.1 (11.6) | 31.6 (10.4) | 31.7 (10.9) | 0.084 | 0.059 | –0.21 |
| Min–Max | 20.0–64.0 | 20.0–63.0 | 20.0–70.0 | 20.0–66.0 | 20.0–63.0 | 20.0–75.0 | 20.0–76.0 | 20.0–77.0 | 20.0–76.0 | 20.0–71.0 | 17.0–73.0 | 20.0–70.0 | |||
| Missing | 0 | 2 | 0 | 2 | 2 | 3 | 1 | 0 | 0 | 0 | 2 | 2 | |||
| Questionnaire for Impulsive-Compulsive Disorder in Parkinson’s disease (QuIP) | |||||||||||||||
| No Disorder | 221 (80%) | 223 (86%) | 194 (78%) | 181 (76%) | 170 (75%) | 144 (69%) | 114 (79%) | 119 (88%) | 108 (83%) | 100 (79%) | 87 (76%) | 86 (83%) | 0.092 | 0.017 | 1.08 |
| Any Disorder | 56 (20%) | 36 (14%) | 54 (22%) | 58 (24%) | 58 (25%) | 64 (31%) | 31 (21%) | 17 (13%) | 22 (17%) | 27 (21%) | 28 (24%) | 18 (17%) | |||
| Missing | 0 | 2 | 0 | 0 | 2 | 2 | 1 | 0 | 0 | 0 | 2 | 3 | |||
| REM Sleep Behavior Disorder Screening Questionnaire (RBDSQ) | |||||||||||||||
| Mean (SD) | 4.3 (2.8) | 4.2 (2.8) | 4.7 (3.1) | 4.8 (3.1) | 5.1 (3.3) | 5.1 (3.3) | 3.8 (2.4) | 4.0 (2.7) | 4.3 (2.7) | 4.2 (2.8) | 4.3 (2.8) | 4.4 (2.9) | 0.334 | < 0.001 | 0.16 |
| Min–Max | 0.0–12.0 | 0.0–13.0 | 0.0–13.0 | 0.0–12.0 | 0.0–13.0 | 0.0–13.0 | 0.0–12.0 | 0.0–12.0 | 0.0–11.0 | 0.0–11.0 | 0.0–12.0 | 0.0–12.0 | |||
| Missing | 2 | 3 | 0 | 0 | 2 | 2 | 1 | 1 | 0 | 1 | 3 | 3 | |||
| Epworth Sleepiness Scale | |||||||||||||||
| Mean (SD) | 5.9 (3.4) | 6.4 (4.0) | 7.2 (4.2) | 7.5 (4.3) | 7.9 (4.6) | 8.2 (4.6) | 5.5 (3.6) | 5.5 (3.9) | 5.8 (3.9) | 7.0 (4.9) | 6.6 (4.7) | 6.9 (4.9) | 0.192 | < 0.001 | 0.41 |
| Min–Max | 0.0–20.0 | 0.0–21.0 | 0.0–23.0 | 0.0–24.0 | 0.0–24.0 | 0.0–24.0 | 0.0–15.0 | 0.0–18.0 | 0.0–17.0 | 0.0–24.0 | 0.0–20.0 | 0.0–23.0 | |||
| Missing | 0 | 2 | 1 | 1 | 2 | 2 | 0 | 0 | 0 | 1 | 2 | 3 | |||
**If interaction is significant, we find time effect p-value for men and women separately. Otherwise, we provide time effect p-value without stratifying by sex. All models are also adjusted for Baseline BMI, Vascular Risk Factor Score (VRF) and Side Most Affected; Significance level for comparisons is p < 0.006 (after Bonferroni correction). MDS-UPDRS, Movement Disorders Society-Unified Parkinson’s Disease Rating Scale; SCOPA-Aut, Scales for Outcomes in Parkinson’s Disease-Autonomic Dysfunction: STAI, State Trait Anxiety Inventory
Cognition
Five-year longitudinal changes in cognitive performance adjusted for side most affected, vascular risk score, and BMI in men and women with PD are shown in Table 4. There was a significant longitudinal increase in investigator diagnosis of MCI or dementia (p < 0.001), and significant longitudinal worsening of performance on the MoCA (p < 0.001), Benton Judgement of Line Orientation (p = 0.035), and Symbol Digit Modalities Test (p < 0.001), but without a sex interaction. Despite the absence of differences in longitudinal rates of progression between men and women on these cognitive assessments, PD women scored on average 0.45 points higher on the MoCA (p = 0.049), 1.97 points higher on HVLT immediate recall (p < 0.001), 0.99 points higher on HVLT delayed recall (p < 0.001), 2.22 points higher on the Symbol Digit Modalities Test (p = 0.015), and 1.29 points lower on The Benton Judgement of Line Orientation (p < 0.001) compared to men. Significant sex interactions were present for letter number sequencing (p = 0.027), with a significant decline only in men (for every year increase, performance changed by a multiplicative factor of –0.19 in men and –0.06 in women), and for semantic fluency (p = 0.037), with longitudinal worsening only among men (for every year increase, performance changed by a multiplicative factor of –0.39 in men and 0.11 in women). These interactions were no longer significant after correcting for multiple comparisons.
Table 4
Cognitive performance over time in Parkinson’s disease
| Men (N = 277) | Women (N = 146) | ||||||||||||||
| Variable | Baseline (N = 277) | Month 12 (N = 261) | Month 24 (N = 248) | Month 36 (N = 239) | Month 48 (N = 230) | Month 60 (N = 210) | Baseline (N = 146) | Month 12 (N = 136) | Month 24 (N = 130) | Month 36 (N = 127) | Month 48 (N = 117) | Month 60 (N = 107) | p Interaction (Sex vs Time)** | p Time | Time effect |
| Cognition by testing | |||||||||||||||
| MCI or Dementia (ref group) | 9 (14%) | 32 (19%) | 40 (17%) | 53 (23%) | 49 (23%) | 45 (23%) | 6 (15%) | 17 (17%) | 19 (15%) | 16 (13%) | 10 (9%) | 12 (12%) | 0.082 | 0.780 | 0.99 |
| Normal Cognition | 56 (86%) | 133 (81%) | 198 (83%) | 178 (77%) | 168 (77%) | 151 (77%) | 34 (85%) | 84 (83%) | 108 (85%) | 107 (87%) | 103 (91%) | 88 (88%) | |||
| Missing | 212 | 96 | 10 | 8 | 13 | 14 | 106 | 35 | 3 | 4 | 4 | 7 | |||
| Investigator Diagnosis of Cognitive State | |||||||||||||||
| MCI or Dementia (ref group) | 9 (14%) | 27 (16%) | 45 (18%) | 60 (25%) | 59 (26%) | 48 (24%) | 0 (0%) | 13 (13%) | 16 (13%) | 20 (16%) | 16 (14%) | 13 (12%) | 0.938 | < 0.001 | 0.86 |
| Normal Cognition | 56 (86%) | 143 (84%) | 200 (82%) | 179 (75%) | 166 (74%) | 156 (76%) | 41 (100%) | 88 (87%) | 111 (87%) | 105 (84%) | 99 (86%) | 92 (88%) | |||
| Missing | 212 | 91 | 3 | 0 | 5 | 6 | 105 | 35 | 3 | 2 | 2 | 2 | |||
| MocA | |||||||||||||||
| Mean (SD) | 26.9 (2.4) | 25.9 (2.9) | 26.0 (3.2) | 26.0 (2.9) | 26.2 (3.4) | 26.2 (3.7) | 27.5 (2.2) | 27.1 (2.6) | 26.8 (3.1) | 27.1 (3.1) | 26.9 (3.9) | 27.3 (3.0) | 0.518 | < 0.001 | –0.15 |
| Min–Max | 17.0–30.0 | 15.0–30.0 | 9.0–30.0 | 13.0–30.0 | 13.0–30.0 | 2.0–30.0 | 17.0–30.0 | 18.0–30.0 | 16.0–30.0 | 14.0–30.0 | 11.0–30.0 | 15.0–30.0 | |||
| Missing | 3 | 4 | 3 | 0 | 4 | 4 | 0 | 1 | 0 | 3 | 2 | 2 | |||
| HVLT Immediate recall | |||||||||||||||
| Mean (SD) | 23.6 (4.9) | 23.2 (5.3) | 23.0 (5.3) | 23.8 (5.9) | 22.8 (5.7) | 23.6 (6.6) | 26.1 (4.7) | 25.0 (5.4) | 25.2 (5.4) | 26.4 (6.1) | 26.1 (5.6) | 26.1 (5.8) | 0.879 | 0.230 | –0.07 |
| Min–Max | 9.0–35.0 | 4.0–36.0 | 9.0–35.0 | 6.0–36.0 | 6.0–36.0 | 5.0–36.0 | 13.0–36.0 | 8.0–36.0 | 10.0–36.0 | 7.0–36.0 | 8.0–36.0 | 4.0–36.0 | |||
| Missing | 0 | 3 | 0 | 0 | 5 | 4 | 1 | 0 | 0 | 2 | 2 | 2 | |||
| HVLT delayed recall | |||||||||||||||
| Mean (SD) | 8.0 (2.6) | 7.7 (2.8) | 7.9 (2.9) | 7.9 (3.1) | 7.5 (3.2) | 8.1 (3.3) | 9.1 (2.2) | 8.9 (2.9) | 8.8 (2.9) | 9.1 (2.8) | 9.3 (2.7) | 9.3 (2.9) | 0.921 | 0.743 | –0.01 |
| Min–Max | 0.0–12.0 | 0.0–12.0 | 0.0–12.0 | 0.0–12.0 | 0.0–12.0 | 0.0–12.0 | 3.0–12.0 | 0.0–12.0 | 0.0–12.0 | 0.0–12.0 | 0.0–12.0 | 0.0–12.0 | |||
| Missing | 0 | 3 | 0 | 0 | 5 | 4 | 1 | 0 | 0 | 3 | 2 | 2 | |||
| Benton Judgement of Line Orientation | |||||||||||||||
| Mean (SD) | 13.1 (2.0) | 12.8 (2.1) | 13.1 (2.1) | 13.0 (2.1) | 13.1 (2.0) | 12.6 (2.3) | 12.1 (2.2) | 11.5 (2.7) | 12.2 (2.5) | 11.8 (2.5) | 12.5 (2.6) | 11.9 (2.3) | 0.132 | 0.035 | –0.05 |
| Min–Max | 6.0–15.0 | 5.0–15.0 | 0.0–15.0 | 5.0–15.0 | 5.0–15.0 | 4.0–15.0 | 5.0–15.0 | 2.0–15.0 | 4.0–15.0 | 3.0–15.0 | 2.0–15.0 | 5.0–15.0 | |||
| Missing | 0 | 3 | 3 | 0 | 5 | 5 | 1 | 0 | 1 | 3 | 4 | 3 | |||
| Symbol Digit Modalities Test | |||||||||||||||
| Mean (SD) | 40.0 (9.6) | 39.8 (10.2) | 38.4 (10.7) | 38.2 (11.4) | 37.8 (12.7) | 37.8 (12.5) | 43.4 (9.5) | 42.7 (10.0) | 43.0 (11.2) | 43.2 (11.5) | 42.0 (11.4) | 43.6 (12.3) | 0.237 | < 0.001 | –0.49 |
| Min–Max | 7.0–76.0 | 5.0–70.0 | 5.0–75.0 | 3.0–63.0 | 2.0–102.0 | 0.0–69.0 | 15.0–82.0 | 14.0–62.0 | 2.0–68.0 | 0.0–65.0 | 0.0–63.0 | 1.0–74.0 | |||
| Missing | 0 | 3 | 0 | 0 | 5 | 4 | 1 | 0 | 0 | 4 | 2 | 2 | |||
| Letter Number Sequencing | |||||||||||||||
| Mean (SD) | 10.5 (2.7) | 10.3 (2.8) | 10.2 (2.7) | 10.1 (3.0) | 9.8 (3.2) | 9.7 (3.0) | 10.7 (2.6) | 10.5 (2.5) | 10.6 (2.9) | 10.4 (3.1) | 10.8 (3.1) | 10.7 (2.7) | 0.027 | M: < 0.001 | M: –0.19 |
| Min–Max | 3.0–20.0 | 2.0–18.0 | 2.0–17.0 | 2.0–19.0 | 0.0–20.0 | 2.0–20.0 | 2.0–20.0 | 3.0–16.0 | 2.0–19.0 | 1.0–17.0 | 0.0–18.0 | 2.0–18.0 | W: 0.160 | W: –0.06 | |
| Missing | 0 | 4 | 0 | 0 | 5 | 4 | 1 | 0 | 0 | 2 | 2 | 2 | |||
| Semantic Fluency | |||||||||||||||
| Mean (SD) | 46.3 (11.0) | 46.5 (11.2) | 46.7 (12.7) | 46.0 (10.9) | 45.1 (11.5) | 45.1 (12.6) | 53.1 (11.6) | 53.1 (10.7) | 53.3 (12.4) | 52.5 (12.3) | 53.8 (12.8) | 54.9 (12.1) | 0.037 | M: 0.001 | M: –0.39 |
| Min–Max | 20.0–91.0 | 18.0–97.0 | 18.0–95.0 | 18.0–86.0 | 11.0–83.0 | 7.0–90.0 | 26.0–103.0 | 22.0–81.0 | 15.0–87.0 | 9.0–91.0 | 15.0–84.0 | 11.0–88.0 | W: 0.590 | W: 0.11 | |
| Missing | 0 | 4 | 0 | 0 | 5 | 4 | 1 | 0 | 0 | 2 | 2 | 2 | |||
Note: All models are also adjusted for Baseline BMI, Vascular Risk Factor Score (VRF) and Side Most Affected. Significance level for comparisons is p < 0.006 (after Bonferroni correction). **If interaction is significant, we find time effect p-value for each men and women separately. Otherwise, we provide time effect p-value without stratifying by gender. 1) After adjusting for VRF Scores and side most affected, a significant quantitative interaction is present where men are decreasing in mean Letter Number Sequencing z-score over time, with men experiencing a stronger decrease and women with no significant decrease. For every year increase, the mean Letter Number Sequencing z-score decreases by a multiplicative factor of –0.19 in men, compared to –0.06 in women. 2) After adjusting for VRF Scores and side most affected, a significant qualitative interaction is present where men are decreasing in mean Semantic Fluency z-score over time and women with no significant increase. For every year increase, the mean Semantic Fluency z-score decreases by a multiplicative factor of –0.39 in men, compared to an increase of 0.11 in women.
To investigate whether sex related differences in PD men and women were specific to PD, we also evaluated the five-year longitudinal cognitive changes adjusted for vascular risk factor score and BMI in men and women HC participants (Supplementary Table 2). There was a significant longitudinal change in MoCA over time (p < 0.001), but without a sex interaction. A significant sex interaction was present for HVLT immediate recall (p = 0.039), with scores improving over time in women by a multiplicative factor of 0.33 (p = 0.002), but not changing in men. There was also a significant sex interaction for letter number sequencing (p = 0.045), but without significant change over time in men or women (p > 0.05). These interactions were not significant after correcting for multiplicity. On average, HC women scored 0.77 points higher on HVLT delayed recall (p = 0.012), 6.45 points higher on semantic fluency (p < 0.001), and 1.33 points lower on Benton Judgement of Line Orientation (p < 0.001) compared to HC men.
Time to milestones and medication utilization
Separate analyses of time to reaching certain milestones, including time to surgical therapy, initiation of dopaminergic medications, and time to development of motor complications, dyskinesias, and motor fluctuations were also stratified by sex. Survival analysis demonstrated that time to initiation of dopaminergic medications differed by sex (p = 0.037) where men may initiate dopaminergic medications at 1.3 times the rate per year as women (Table 3, Fig. 1D). After adjusting for multiplicity, sex difference for initiation of dopaminergic medications was no longer significant. The time to reach other considered milestones did not differ by sex (Supplementary Table 3). Use of other classes of medications, including anti-depressants, medications for cognition, and anti-psychotics increased significantly over time for PD participants (all p < 0.001), but there was no significant sex interaction (Supplementary Table 4). Use of anxiolytics did not change significantly over the duration of the study. Although there were no differences in longitudinal change in medication utilization, on average women had 2.33 higher odds of being on an anti-depressant than men (p < 0.001).
CSF biomarkers and dopamine transporter binding
The longitudinal change in DAT binding by sex is shown in Supplementary Table 5. There was a significant change over time in all regions with no sex effect. All measured CSF biomarkers changed over time (p < 0.001), with no sex interaction (Supplementary Table 6).
DISCUSSION
This study systematically and comprehensively explores sex-related longitudinal changes of 1) motor features and motor aspects of experiences of daily living, considering the influence of introducing symptomatic treatment, 2) non-motor symptoms, and 3) biological biomarkers including CSF markers and DAT binding in PD participants of the PPMI cohort. This large cohort of de novo, at baseline untreated PD participants provides unique insights into the sex-related differences in disease progression in early PD.
Regarding motor features and accounting for baseline differences and multiple comparisons, men had more longitudinal disease progression as measured by the MDS-UPDRS part II evaluating Motor aspects of Experiences of Daily Living (M-EDL). Men demonstrated more longitudinal motor progression in the ON medication state, as measured by MDS-UPDRS part III ON scores, as well as more increase in LED over time compared to women, but these differences were no longer significant after correcting for multiple comparisons. There were no significant sex interactions for longitudinal changes in OFF medication motor scores (MDS-UPDRS III Off scores), TD/PIGD classification, H&Y staging, or activities of daily living as evaluated with S&E.
Taken together, these findings suggest that men experience more rapid self-assessed motor progression and may require greater increases in dopaminergic medications over the early years of the disease course. Although men tended to start dopaminergic therapy earlier than women (Fig. 1D), this difference was no longer significant after correcting for multiple comparisons. Despite the trend toward higher LED in men over time, there were no significant sex-related differences in progression of MDS-UPDRS part III OFF scores or H&Y staging. The MDS-UPDRS part III ON scores showed a trend toward more rapid progression in men compared to women despite a greater increase in dopaminergic treatment, suggesting a higher motor burden in men due to suboptimal levels of symptomatic treatment (or, conversely, for the same degree of motor and biologic deficit a more robust sensitivity and response to medication in women). While these findings did not meet statistical significance due to our use of conservative statistical analysis (Bonferroni correction for multiple comparisons), nonetheless these findings may prove to be biologically meaningful, have clinical implications and may be useful to inform outcomes for clinical research [34]. Alternatively, it is possible that because men perceive more motor disease burden (MDS-UPDRS part II) than women, they are more likely to request increases in medication despite the lack of apparent difference in clinician-assessed motor OFF rating scale (MDS-UPDRS part III OFF) scores.
Interestingly, in contrast to previous studies [4, 16], age at diagnosis and prevalence of TD phenotype are comparable between sexes in this cohort of early, untreated at baseline participants. Thus, despite heterogeneity of disease phenotypes and biological characteristics across individuals, motor heterogeneity does not appear predominantly driven by differences between sexes as evaluated with clinician-based motor assessments (i.e., MDS-UPDRS part III, H&Y). Consistent with these findings and in contrast with previous evidence [9, 10], no sex differences were detected in initiation of any symptomatic oral dopaminergic therapy or surgical treatment such as DBS or in onset of clinical milestones such wearing off or dyskinesias. However, we recognize the small number of participants who underwent surgical therapy and the early disease stage may have precluded detection of sex differences for this outcome.
Given the World Health Organization (WHO) definition of disability (“the negative result of the dynamic interaction between a person’s health condition, environmental factors and personal factors”), external factors other than the disease itself may play a major role in determining the outcome from self-assessed disability measures [35]. Thus, it is not surprising that the major sex difference in our motor analysis is displayed by the MDS-UPDRS part II, which is also considered one of the most reliable sections for the evaluation of individualized disease progression [36, 37]. Our data report a two-fold increase in MDS-UPDRS part II in men versus women over the 5-year follow up. Alternative explanations may account for these opposite findings compared to previous evidence [35]. For example, the PPMI cohort is a younger population of predominantly North American PD patients with short disease duration who thus may have greater work or other obligations than an older cohort. In such context, men with PD may perceive a greater level of motor burden related to higher perceived obligations or expectations. In line with the hypothesis of a specific self-perceived higher motor burden in PPMI PD men, S&E, which represents a broader evaluation of disease-related disability, does not show significant sex differences.
Similar to the self-reported motor symptom burden, PD men also reported more rapid longitudinal progression of non-motor symptoms, as measured by the MDS-UPDRS part I, particularly in the reporting of urinary symptoms, light-headedness, and fatigue, compared to women. Although these relationships were no longer significant after correcting for multiplicity, the findings are in contrast to prior work showing that women report more non-motor symptom burden, particularly in categories of sleep complaints, fatigue, and mood symptoms [17, 18, 38]. Several potential explanations for the absence of difference between PD men and women in depressive symptoms may be related to the longitudinal nature of the current study of de novo PD participants, since prior reports demonstrating these differences have been in patients with more advanced disease evaluated cross-sectionally [17, 18, 38]. Alternatively, the lack of difference could be related to higher use of anti-depressant medications among PD women compared to men in this cohort. Similar to our findings, a recent large meta-analysis of multiple longitudinal de novo and more advanced cohorts showed no difference in depression or sleep complaints between men and women with PD [12].
Cognitive performance showed similar rates of longitudinal progression over 5 years in PD men and women in this study after correcting for multiple comparisons. This is in contrast to prior work showing that men are at higher risk of longitudinal cognitive decline and male sex is a risk factor for dementia [12, 25, 26, 39]. These findings may be related to the early stage of disease in this cohort. Interestingly, although rates of cognitive decline were not significantly different between men and women, there were suggestions of better cognitive performance among women at each time point. For example, a lower percentage of women had PD-MCI or PD-dementia based on cognitive testing or investigator diagnosis at each time point (Table 3). Additionally, women had higher scores on average for the MoCA, tests of memory (HVLT), and on the Symbol Digit Modalities Test, while men had higher scores on average for tests of visuospatial function (Benton Judgement of Line Orientation). Similar findings were found among HC men and women in PPMI, suggesting that sex-related differences in cognitive performance are not specific to PD. Interestingly, the lack of sex-related differences in cognitive decline is supported by the absence of sex-related longitudinal changes in CSF biomarkers, including p-tau, which have been shown to be predictive of cognitive decline in PD [40, 41].
Regarding DAT binding, in contrast with previous data [4, 27, 28], we detected similar dopaminergic denervation in PD men and women in both caudate and putamen and failed to find a significant sex-related decline in tracer binding over the 5-year follow up, further supporting the notion that motor involvement related to the disease itself is not different by sex. Specific features of the PPMI population (i.e., early, untreated patients) may account for discrepancy with previous findings [4, 27, 28].
As a limitation, we acknowledge our results may not be applicable to all PD patients in the community clinical setting. Despite being one of the largest existing longitudinally observed cohorts of early PD patients so far, PD participants enrolled in the PPMI study represent a highly selected population with less baseline disability than the general PD population and, as such, the PPMI cohort may not be representative of the natural history of PD progression. Further, because PD progression may not be linear, differences in progression by sex may be more or less evident at later disease stages. Finally, despite the large amount of data available in this cohort, information about pre-, peri-, or post-menopausal state, and about occupational exposures, rurality, and other potential sociological influences on PD pathophysiology are not available, and thus conclusions about sex differences related to these factors cannot be drawn for this sample.
In conclusion, we provide data on sex-related changes in motor, non-motor, and cognitive outcomes as well as CSF markers and DAT binding in the PPMI study. In this cohort, men showed higher motor and non-motor burden of disease as evaluated with self-assessed disability measures, likely due to the sex-related differential impact on the perceived disability with possible contributions from suboptimal dopaminergic therapeutic response in men. Despite this, motor features of disease as evaluated with clinician-based rating scales in the OFF medication state, as well as CSF biomarkers and DAT binding do not show specific sex-related patterns of progression. These findings suggest the need to reconsider the idea of a more benign motor phenotype in women in the earliest stages of PD, which may not take into account all the complexities of this heterogeneous disease [16]. Our data do not discount the possibility that prior observations of sex differences may be in part related to non-biological determinants of health. Further longitudinal follow up of the PPMI cohort will help verifying these findings in subsequent stages of disease.
§The Parkinson’s progression markers initiative
Steering Committee: Kenneth Marek, MD1 (Principal Investigator); Andrew Siderowf, MD MSCE12 (co-PI); Danna Jennings, MD53 (Industry Scientific Advisory Board); Caroline Tanner, MD, PhD9 (Site Investigator); Tanya Simuni, MD3 (Site Investigator); Christopher Coffey, PhD4 (Statistics Core, PI); Karl Kieburtz, MD, MPH5 (Clinical Core, PI); Werner Poewe, MD7 (Site Investigator); Brit Mollenhauer, MD8 (Bioanalytics Core, co-PI; Site Investigator); Douglas Galasko, MD27 (Bioanalytics Core, co-PI; Site Investigator); Tatiana Foroud, PhD15 (Genetics Coordination Core and Biorepository Core, PI); Todd Sherer, PhD6; Sohini Chowdhury6; Mark Frasier, PhD6; Vanessa Arnedo6; Jamie Eberling, PhD6; Samantha J. Hutten, PhD6; Alyssa N. Reimer6; Luba Smolensky, MS6; Dave Alonso6; Chris Baglieri, MS66 (Advanced Analytics Core, PI); Amanda Christini, MD66; Susan Bressman, MD14 (Site Investigator); Ray Dorsey, MD MBA5 (Clinical Core); Cynthia Casaceli, MBA5 (Clinical Core); Paola Casalin11 (Biorepository Core); Giulia Malferrari11 (Biorepository Core); Lana Chahine, MD67; Nichole Daegele, MA1 (Leadership Core); Margaret Bockus, MA5 (Clinical Core); Raymond James, RN22 (Site Coordinator); Sugi Mahes5 (Clinical Core); Kalpana Merchant, PhD68; Kathleen Poston, MD65 (Imaging Core); Ekemini Riley, PhD69; John Seibyl, MD1 (Imaging Core, PI); Leslie Shaw, PhD12; Andrew Singleton, PhD13 (Genetics Core, PI); Arthur Toga, PhD10 (Bioinformatics Core, PI); Duygu Tosun-Turgut, PhD9 (DTI Analysis Core, PI); John Trojanowski, MD PhD12; Dan Weintraub, MD12, Emily Flagg1 (Leadership Core), Roseanne Dobkin, PhD70, Ethan Brown, MD9
Study cores
Statistics Core: Chelsea Caspell4; Liz Uribe4; Janel Fedler, PhD4; Michael Brumm, MS4; David Erick LaFontant, MS4
Bioinformatics Core: Karen Crawford10
Biorepository Core: Mali Gana Weisz, PhD61; Avi Orr-Urtreger, MD PhD61
Site Management Core: Lisa de Blieck, MPA1, Whitney Richardson, MS1
Site investigators
David Russell, MD, PhD1; Stewart Factor, DO16; Penelope Hogarth, MD17; David Standaert, MD, PhD18; Robert Hauser, MD, MBA19; Joseph Jankovic, MD20; Nabila Dahodwala, MD12; Marie H Saint-Hilaire, MD22; Irene Richard, MD23; Klaus Seppi, MD7; David Shprecher, MD24; Hubert Fernandez, MD25; Kathrin Brockmann, MD26; Isabel Wurster MD26; David Brooks, MD29; Yen Tai, 29; Paolo Barone, MD, PhD30; Stuart Isaacson, MD31; Alberto Espay, MD, MSc32; Dominic Rowe, MD, PhD33; Christopher Way, DO2; Eduardo Tolosa MD34; Shu-Ching Hu, MD, PhD21; Douglas Galasko MD27; Emile Moukheiber28; Jean-Christophe Corvol, MD39; Nir Giladi, MD61; Javier Ruiz Martinez, MD60; Jan O. Aasly, MD62; Leonidas Stefanis, MD PhD63; Karen Marder, MD MPH64
Coordinators
Julie Festa1; Cheryl Riordan1; Katrina Wakeman; Alison Freed17; Karen Williams3; Courtney Blair18; Leigh Harrell19; Christine Hunter, RN20; Krista Specketer21; Cathi-Ann Thomas, RN, MS22; Nicole Guerrero23; Beatrice Heim, MD7; Diana Willeke8; Victoria Brown24; Jennifer Mule25; Ella Hilt26; Shawnees Peacock, MS27; Arita McCoy28; Kori Ribb28; Susan Ainscough30; Lisbeth Pennente31; Christina Gruenwald32; Madelaine Ranola33; Barbara Sommerfeld MSN RN16; Farah Kausar9; Alicia Garrido, MD34; Deborah Raymond14; Benjamin Le Toullec39; Anat Mirelman, PhD61; Ioana Croitoru60; Anne Grete Kristiansen62; Maria Stamelou, MD, PhD63; Helen Mejia Santana64
ISAB (Industry Scientific Advisory Board)
Robert Joe Mather35; Minhua Yang, MS36; Christine Brand, MPA37; Cindy Zadikoff38; Kirsten Taylor, PhD40; Thomas McAvoy, PhD41; Baris Bingol, PhD42; Alastair D. Reith, PhD43; Peggy Taylor, ScD44; Gabrielle Ahlberg Hillert, MD PhD45; Mark Minton, MD46; Pierandrea Muglia, PhD47; Robert Umek, PhD48; Barbara Saba50; Lawrence Severt, MD PhD51; Karl Schmidt, PhD52; Matt Troyer, MD53; Kevin Biglan, MD MPH54; Tanya Fischer, MD PhD55; Jeffrey Sevigny, MD56; Adam Schwarz, PhD57; William Marks, MD58; Omar Khwaja, MD PhD59
1Institute for Neurodegenerative Disorders, New Haven, CT, USA; 2The Parkinson’s Institute, Sunnyvale, CA, USA; 3Northwestern University, Chicago, IL, USA; 4University of Iowa, Iowa City, IA, USA; 5Clinical Trials Coordination Center, University of Rochester, Rochester, NY, USA; 6The Michael J. Fox Foundation for Parkinson’s Research, New York, NY, USA; 7Innsbruck Medical University, Innsbruck, Austria; 8Paracelsus-Elena Klinik, Kassel, Germany; 9University of California, San Francisco, CA, USA; 10Laboratory of Neuroimaging (LONI), University of Southern California, Los Angeles, CA, USA; 11BioRep, Milan, Italy; 12University of Pennsylvania, Philadelphia, PA, USA; 13National Institute on Aging, NIH, Bethesda, MD, USA; 14Mount Sinai Beth Israel, New York, NY, USA; 15Indiana University, Indianapolis, IN, USA; 16Emory University of Medicine, Atlanta, GA, USA; 17Oregon Health and Science University, Portland, OR, USA; 18University of Alabama at Birmingham, Birmingham, AL, USA; 19University of South Florida, Tampa, FL, USA; 20Baylor College of Medicine, Houston, TX, USA; 21University of Washington, Seattle, WA, USA; 22Boston University, Boston, MA, USA; 23University of Rochester, Rochester, NY, USA; 24Banner Research Institute, Sun City, AZ, USA; 25Cleveland Clinic, Cleveland, OH, USA; 26University of Tuebingen, Tuebingen, Germany; 27University of California, San Diego, CA, USA; 28Johns Hopkins University, Baltimore, MD, USA; 29Imperial College of London, London, UK; 30University of Salerno, Salerno, Italy; 31Parkinson’s Disease and Movement Disorders Center, Boca Raton, FL, USA; 32University of Cincinnati, Cincinnati, OH, USA; 33Macquarie University, Sydney, Australia; 34Hospital Clinic of Barcelona, Barcelona, Spain; 35Pfizer, Inc., Groton, CT, USA; 36Biogen, Cambridge, MA, USA; 37GE Healthcare, Princeton, NJ, USA; 38AbbVie, Abbot Park, IL, USA; 39University Hospitals PitiäSalpêtrière, Paris, France; 40F.Hoffmann La-Roche, Basel, Switzerland; 41Merck & Co., North Wales, PA, USA; 42Genentech, Inc., South San Francisco, CA, USA; 43GlaxoSmithKline, Stevenage, United Kingdom; 44BioLegend, San Diego, CA, USA; 45Lundbeck, Copenhagen, Denmark; 46Avid Radiopharmaceuticals, Philadelphia, PA, USA; 47UCB Pharma S.A., Brussels, Belgium; 48Meso Scale Discovery; 49Piramal Life Sciences, Berlin, Germany; 50Servier; 51Allergan, Dublin, Ireland; 52Celgene, Summit, NJ, USA; 53Denali Therapeutics, South San Francisco, CA, USA; 54Eli Lilly and Company, Indianapolis, IN, USA; 55Sanofi, Paris, France; 56Prevail Therapeutics, New York, NY, USA; 57Takeda Pharmaceutical Company, Tokyo, Japan; 58Verily, South San Francisco, CA, USA; 59Voyager Therapeutics, Cambridge, MA, USA; 60Hospital Universitario Donostia, San Sebastian, Spain; 61Tel Aviv Sourasky Medical Center, Tel Aviv, Israel; 62St. Olav’s University Hospital, Trondheim, Norway; 63National and Kapodistrian University of Athens, Athens, Greece; 64Columbia University Irving Medical Center, New York, NY, USA; 65Stanford University, Stanford, CA, USA; 66Blackfynn, Philadelphia, PA, USA; 67University of Pittsburgh, Pittsburgh, PA, USA; 68Vincere Biosciences, Inc., Cambridge, MA, USA; 69Center for Strategy Philanthropy at Milken Institute, Washington, DC, USA; 70University of Medicine and Dentistry of New Jersey, Piscataway, NJ, USA
ACKNOWLEDGMENTS
PPMI is sponsored and partially funded by The Michael J. Fox Foundation for Parkinson’s Research (MJFF). Other funding partners include a consortium of industry players, non-profit organizations and private individuals. Funding partners include Abbvie, AcureX Therapeutics, Allergan, Amathus Therapeutics, Avid Radiopharmaceuticals, Bial Biotech, Biogen, BioLegend, Bristol-Myers Squibb, Calico, Celgene, Denali, 4D pharma pic, GE Healthcare, Genetech, GlaxoSmithKline, Golub Capital, Handl Therapeutics, Insitro, Janssen, Lilly, Lundbeck, Merck, Meso Scale Discovery, Neurocrine Biosciences, Pfizer, Piramal, Prevail Therapeutics, Roche, Sanofi Genzyme, Servier, Takeda, Teva, UCB, Verily, Voyager therapeutics.
CONFLICT OF INTEREST
Marina Picillo is supported by the Michael J Fox Foundation for Parkinson’s research. Nabila Dahodwala has received support from AbbVie (research grant), Roche, Eli Lilly and Cala Health (clinical trial site investigator) and Acadia (scientific advisory board). The other authors report no financial disclosures.
SUPPLEMENTARY MATERIAL
[1] The supplementary material is available in the electronic version of this article: https://dx.doi.org/10.3233/JPD212892.
REFERENCES
[1] | Mazure CM , Jones DP ((2015) ) Twenty years and still counting: including women as participants and studying sex and gender in biomedical research. BMC Womens Health 15: , 94. |
[2] | Mazure CM , Swendsen J ((2016) ) Sex differences in Alzheimer’s disease and other dementias. Lancet Neurol 15: , 451–452. |
[3] | Meoni S , Macerollo A , Moro E ((2020) ) Sex differences in movement disorders. Nat Rev Neurol 16: , 84–96. |
[4] | Haaxma CA , Bloem BR , Borm GF , Oyen WJ , Leenders KL , Eshuis S , Booij J , Dluzen DE , Horstink MW ((2007) ) Gender differences in Parkinson’s disease. J Neurol Neurosurg Psychiatry 78: , 819–824. |
[5] | Cereda E , Barichella M , Cassani E , Caccialanza R , Pezzoli G ((2013) ) Reproductive factors and clinical features of Parkinson’s disease. Parkinsonism Relat Disord 19: , 1094–1099. |
[6] | Smith KM , Dahodwala N ((2014) ) Sex differences in Parkinson’s disease and other movement disorders. Exp Neurol 259: , 44–56. |
[7] | Gillies GE , Pienaar IS , Vohra S , Qamhawi Z ((2014) ) Sex differences in Parkinson’s disease. Front Neuroendocrinol 35: , 370–384. |
[8] | Litim N , Morissette M , Di Paolo T ((2016) ) Neuroactive gonadal drugs for neuroprotection in male and female models of Parkinson’s disease. Neurosci Biobehav Rev 67: , 79–88. |
[9] | Zappia M , Annesi G , Nicoletti G , Arabia G , Annesi F , Messina D , Pugliese P , Spadafora P , Tarantino P , Carrideo S , Civitelli D , De Marco EV , Ciro-Candiano IC , Gambardella A , Quattrone A ((2005) ) Sex differences in clinical and genetic determinants of levodopa peak-dose dyskinesias in Parkinson disease: an exploratory study. Arch Neurol 62: , 601–605. |
[10] | Sharma JC , Bachmann CG , Linazasoro G ((2010) ) Classifying risk factors for dyskinesia in Parkinson’s disease. Parkinsonism Relat Disord 16: , 490–497. |
[11] | Picillo M , Palladino R , Moccia M , Erro R , Amboni M , Vitale C , Barone P , Pellecchia MT ((2016) ) Gender and non motor fluctuations in Parkinson’s disease: A prospective study. Parkinsonism Relat Disord 27: , 89–92. |
[12] | Iwaki H , Blauwendraat C , Leonard HL , Makarious MB , Kim JJ , Liu G , Maple-Grodem J , Corvol JC , Pihlstrom L , van Nimwegen M , Smolensky L , Amondikar N , Hutten SJ , Frasier M , Nguyen KH , Rick J , Eberly S , Faghri F , Auinger P , Scott KM , Wijeyekoon R , Van Deerlin VM , Hernandez DG , Gibbs RJ , Day-Williams AG , Brice A , Alves G , Noyce AJ , Tysnes OB , Evans JR , Breen DP , Estrada K , Wegel CE , Danjou F , Simon DK , Andreassen OA , Ravina B , Toft M , Heutink P , Bloem BR , Weintraub D , Barker RA , Williams-Gray CH , van de Warrenburg BP , Van Hilten JJ , Scherzer CR , Singleton AB , Nalls MA ((2021) ) Differences in the presentation and progression of Parkinson’s disease by sex. Mov Disord 36: , 106–117. |
[13] | Saunders-Pullman R , Wang C , Stanley K , Bressman SB ((2011) ) Diagnosis and referral delay in women with Parkinson’s disease. Gend Med 8: , 209–217. |
[14] | Chan AK , McGovern RA , Brown LT , Sheehy JP , Zacharia BE , Mikell CB , Bruce SS , Ford B , McKhann GM , 2nd ((2014) ) Disparities in access to deep brain stimulation surgery for Parkinson disease: interaction between African American race and Medicaid use. JAMA Neurol 71: , 291–299. |
[15] | Willis AW , Schootman M , Kung N , Wang XY , Perlmutter JS , Racette BA ((2014) ) Disparities in deep brain stimulation surgery among insured elders with Parkinson disease. Neurology 82: , 163–171. |
[16] | Picillo M , Nicoletti A , Fetoni V , Garavaglia B , Barone P , Pellecchia MT ((2017) ) The relevance of gender in Parkinson’s disease: a review. J Neurol 264: , 1583–1607. |
[17] | Martinez-Martin P , Falup Pecurariu C , Odin P , van Hilten JJ , Antonini A , Rojo-Abuin JM , Borges V , Trenkwalder C , Aarsland D , Brooks DJ , Ray Chaudhuri K ((2012) ) Gender-related differences in the burden of non-motor symptoms in Parkinson’s disease. J Neurol 259: , 1639–1647. |
[18] | Solla P , Cannas A , Ibba FC , Loi F , Corona M , Orofino G , Marrosu MG , Marrosu F ((2012) ) Gender differences in motor and non-motor symptoms among Sardinian patients with Parkinson’s disease. J Neurol Sci 323: , 33–39. |
[19] | Cerri S , Mus L , Blandini F ((2019) ) Parkinson’s disease in women and men: what’s the difference? J Parkinsons Dis 9: , 501–515. |
[20] | Solla P , Masala C , Liscia A , Piras R , Ercoli T , Fadda L , Hummel T , Haenher A , Defazio G ((2020) ) Sex-related differences in olfactory function and evaluation of possible confounding factors among patients with Parkinson’s disease. J Neurol 267: , 57–63. |
[21] | Picillo M , Amboni M , Erro R , Longo K , Vitale C , Moccia M , Pierro A , Santangelo G , De Rosa A , De Michele G , Santoro L , Orefice G , Barone P , Pellecchia MT ((2013) ) Gender differences in non-motor symptoms in early, drug naive Parkinson’s disease. J Neurol 260: , 2849–2855. |
[22] | Cholerton B , Johnson CO , Fish B , Quinn JF , Chung KA , Peterson-Hiller AL , Rosenthal LS , Dawson TM , Albert MS , Hu SC , Mata IF , Leverenz JB , Poston KL , Montine TJ , Zabetian CP , Edwards KL ((2018) ) Sex differences in progression to mild cognitive impairment and dementia in Parkinson’s disease. Parkinsonism Relat Disord 50: , 29–36. |
[23] | Picillo M , Erro R , Amboni M , Longo K , Vitale C , Moccia M , Pierro A , Scannapieco S , Santangelo G , Spina E , Orefice G , Barone P , Pellecchia MT ((2014) ) Gender differences in non-motor symptoms in early Parkinson’s disease: a 2-years follow-up study on previously untreated patients. Parkinsonism Relat Disord 20: , 850–854. |
[24] | Bakeberg MC , Gorecki AM , Kenna JE , Jefferson A , Byrnes M , Ghosh S , Horne MK , McGregor S , Stell R , Walters S , Chivers P , Winter SJ , Mastaglia FL , Anderton RS ((2021) ) Differential effects of sex on longitudinal patterns of cognitive decline in Parkinson’s disease. J Neurol 268: , 1903–1912. |
[25] | Cereda E , Cilia R , Klersy C , Siri C , Pozzi B , Reali E , Colombo A , Zecchinelli AL , Mariani CB , Tesei S , Canesi M , Sacilotto G , Meucci N , Zini M , Isaias IU , Barichella M , Cassani E , Goldwurm S , Pezzoli G ((2016) ) Dementia in Parkinson’s disease: Is male gender a risk factor? Parkinsonism Relat Disord 26: , 67–72. |
[26] | Pigott K , Rick J , Xie SX , Hurtig H , Chen-Plotkin A , Duda JE , Morley JF , Chahine LM , Dahodwala N , Akhtar RS , Siderowf A , Trojanowski JQ , Weintraub D ((2015) ) Longitudinal study of normal cognition in Parkinson disease. Neurology 85: , 1276–1282. |
[27] | Kotagal V , Albin RL , Muller ML , Koeppe RA , Frey KA , Bohnen NI ((2013) ) Gender differences in cholinergic and dopaminergic deficits in Parkinson disease. J Neural Transm (Vienna) 120: , 1421–1424. |
[28] | Kaasinen V , Joutsa J , Noponen T , Johansson J , Seppanen M ((2015) ) Effects of aging and gender on striatal and extrastriatal [123I]FP-CIT binding in Parkinson’s disease. Neurobiol Aging 36: , 1757–1763. |
[29] | Taylor KS , Cook JA , Counsell CE ((2007) ) Heterogeneity in male to female risk for Parkinson’s disease. J Neurol Neurosurg Psychiatry 78: , 905–906. |
[30] | Parkinson Progression Marker Initiative ((2011) ) The Parkinson Progression Marker Initiative (PPMI). Prog Neurobiol 95: , 629–635. |
[31] | Stebbins GT , Goetz CG , Burn DJ , Jankovic J , Khoo TK , Tilley BC ((2013) ) How to identify tremor dominant and postural instability/gait difficulty groups with the movement disorder society unified Parkinson’s disease rating scale: comparison with the unified Parkinson’s disease rating scale. Mov Disord 28: , 668–670. |
[32] | Chahine LM , Dos Santos C , Fullard M , Scordia C , Weintraub D , Erus G , Rosenthal L , Davatzikos C , McMillan CT ((2019) ) Modifiable vascular risk factors, white matter disease and cognition in early Parkinson’s disease. Eur J Neurol 26: , 246–e218. |
[33] | Tomlinson CL , Stowe R , Patel S , Rick C , Gray R , Clarke CE ((2010) ) Systematic review of levodopa dose equivalency reporting in Parkinson’s disease. Mov Disord 25: , 2649–2653. |
[34] | Rothman KJ ((1990) ) No adjustments are needed for multiple comparisons. Epidemiology 1: , 43–46. |
[35] | Rodriguez-Blazquez C , Alvarez M , Arakaki T , Campos Arillo V , Chana P , Fernandez W , Garretto N , Martinez-Castrillo JC , Rodriguez-Violante M , Serrano-Duenas M , Ballesteros D , Rojo-Abuin JM , Ray Chaudhuri K , Merello M , Martinez-Martin P ((2017) ) Self-assessment of disability in Parkinson’s disease: The MDS-UPDRS Part II versus clinician-based ratings. Mov Disord Clin Pract 4: , 529–535. |
[36] | Evers LJW , Krijthe JH , Meinders MJ , Bloem BR , Heskes TM ((2019) ) Measuring Parkinson’s disease over time: The real-world within-subject reliability of the MDS-UPDRS. Mov Disord 34: , 1480–1487. |
[37] | Lang AE , Eberly S , Goetz CG , Stebbins G , Oakes D , Marek K , Ravina B , Tanner CM , Shoulson I , investigators L-P ((2013) ) Movement disorder society unified Parkinson disease rating scale experiences in daily living: longitudinal changes and correlation with other assessments. Mov Disord 28: , 1980–1986. |
[38] | Fernandez HH , Lapane KL , Ott BR , Friedman JH ((2000) ) Gender differences in the frequency and treatment of behavior problems in Parkinson’s disease. SAGE Study Group. Systematic Assessment and Geriatric drug use via Epidemiology. Mov Disord 15: , 490–496. |
[39] | Anang JB , Gagnon JF , Bertrand JA , Romenets SR , Latreille V , Panisset M , Montplaisir J , Postuma RB ((2014) ) Predictors of dementia in Parkinson disease: a prospective cohort study. Neurology 83: , 1253–1260. |
[40] | Irwin DJ , Fedler J , Coffey CS , Caspell-Garcia C , Kang JH , Simuni T , Foroud T , Toga AW , Tanner CM , Kieburtz K , Chahine LM , Reimer A , Hutten S , Weintraub D , Mollenhauer B , Galasko DR , Siderowf A , Marek K , Trojanowski JQ , Shaw LM , Parkinson’s Progression Marker Initiative ((2020) ) Evolution of Alzheimer’s Disease Cerebrospinal Fluid Biomarkers in Early Parkinson’s Disease. Ann Neurol 88: , 574–587. |
[41] | Mollenhauer B , Caspell-Garcia CJ , Coffey CS , Taylor P , Shaw LM , Trojanowski JQ , Singleton A , Frasier M , Marek K , Galasko D , Parkinson’s Progression Marker Initiative ((2017) ) Longitudinal CSFbiomarkers in patients with early Parkinson disease and healthycontrols. Neurology 89: , 1959–1969. |


