
Serum Neurofilament Light Chain as a Marker of Progression in Parkinson’s Disease: Long-Term Observation and Implications of Clinical Subtypes
Abstract
Background:
Biochemical and clinical biomarkers correlate with progression rate and disease severity in Parkinson’s disease (PD) but are not sufficiently studied in late PD.
Objective:
To examine how serum neurofilament light chain (S-NfL) alone or combined with clinical classifications predicts PD outcome in later disease stages.
Methods:
Eighty-five patients with 7.9±5.1 years of PD duration were included in an observational cohort. Clinical scores were obtained at two separate examinations 8.2±2.0 years apart. S-NfL levels were determined with single molecule array (SiMoA). Five predefined disease progression milestones were assessed. After affirming combination potential of S-NfL and either of two clinical classifications, three combined models were constructed based on these factors and age at onset in different combinations.
Results:
S-NfL levels showed significant hazard ratios for four out of five disease progression milestones: walking-aid usage (HR 3.5; 95% CI 1.4–8.5), nursing home living (5.1; 2.1–12.5), motor end-stage (6.2; 2.1–17.8), and death (4.1; 1.7–9.7). Higher S-NfL levels were associated with lower ability in activities of daily living and poorer cognition at baseline and/or at follow-up. Combined models showed significantly improved area under receiver operating characteristic curves (0.77–0.91) compared to S-NfL levels alone (0.68–0.71) for predicting the five disease milestones.
Conclusion:
S-NfL levels stratified patients according to their likelihood to reach clinically relevant progression milestones during this long-term observational study. S-NfL alone reflected motor and social outcomes in later stages of PD. Combining S-NfL with clinical factors was possible and exploratory combined models improved prognostic accuracy.
INTRODUCTION
Parkinson’s disease (PD) is a heterogenous disorder, both in terms of symptom presentation and rate of disease progression [1–3]. There is a need for methods to prognosticate how an individual’s disease will progress, which will facilitate research on PD pathobiology and potential disease-modifying treatments, and provide a better basis for patient’s decisions and individual planning of care in later stages of the disease. Biochemical markers are promising tools in PD prognostication [4] and different ways to classify PD into clinical subtypes are emerging [5–8]. Combinations of such biomarkers may be necessary to achieve accurate prognostication [9].
Neurofilament light chain (NfL) is a protein that is released from injured large myelinated axons in different neurological diseases [10]. NfL levels can discriminate between PD and atypical parkinsonian syndromes [11–14]. Longitudinal increment of NfL in cerebrospinal fluid (CSF) or blood in the years before or around disease onset has been associated with the risk to develop PD and with various aspects of PD progression, such as decreasing performance on unified PD rating scale (UPDRS), cognitive tests and timed up and go test, and with diminishing SPECT striatal dopamine uptake [15–18]. Serum is much easier to obtain than CSF in clinical practice and, although NfL levels in CSF and blood are highly correlated [12, 14, 16], there is a need to further establish the relationship between serum NfL (S-NfL) and outcome in PD for longer periods of time.
Classification systems based on clinical phenotypic observations have also been designed and used to stratify PD patients into groups with different risks for severe outcomes. Postural instability and gait disorder (PIGD)-dominant PD is one of the classification groups in the commonly used motor-phenotype system; it is based on the severity of PIGD symptoms relative to tremor [19]. PIDG-dominant PD at onset is generally associated with a more severe clinical course than tremor-dominant PD [20]. However, the applicability of these motor phenotypes in mid- and late-stage PD is less well studied and there is the problem that a proportion of patients reclassify from tremor-dominant to PIGD motor-phenotype as the disease progresses [21–24]. More recently, a clinical subtype system that combines non-motor and motor assessments has been constructed [8]. Between the three subtype groups in that system, there were gradients of several CSF biomarkers that are associated with development of PD dementia, as well as differences in radiological markers of disease severity and progression [8, 25–27]. To facilitate clinical use of that system, we recently proposed and evaluated a simplified version (Simplified Clinical Subtype System; SCS) [24].
In this study, we examined the prognostic value of S-NfL for relevant and long-term outcomes in PD. We also hypothesized that combining S-NfL with PIGD-score or SCS-group increases prognostic accuracy. In a cohort of PD patients with varying disease duration who were followed longitudinally, we investigated associations between S-NfL and well-defined motor, cognitive and social outcomes. After observing contributions of S-NfL and the clinical classification systems to evaluate risks for these outcomes, we then compared the prognostic capabilities of S-NfL levels alone with a combination of S-NfL levels and clinical parameters.
METHODS
Patient inclusion and baseline examination
This study is based on the same patient cohort as a previous study [24]. One hundred and forty-two patients in the Parkinson Lund (PARLU) cohort from southern Sweden were available for inclusion in this study. PARLU consists to equal parts of a subgroup included from a specified geographic area (three municipalities in southern Sweden) and a subgroup with positive family history (at least one first degree or several second-degree family members with PD) without known genetic cause on testing. Between 2007–2013, patients were examined clinically, including interview, UPDRS [28] and Schwab and England ADL scale (S&E) [29]. Venipuncture was performed using standard procedures. After centrifugation, sera were aliquoted and stored at –80°C. Full demographic and methodological details have been published previously [24]. Patients with UPDRS not performed at baseline research visit, 30% or more missing values in the sum of UPDRS-2 and -3 and patients with another cause of parkinsonism than idiopathic PD were excluded (Fig. 1). Patients with less than two years of follow-up were excluded because their observation period was too short to reach many milestones of disease progression after classification. The available data on these individuals showed an age at baseline examination of 77.4±6.2 years (n = 21), which was markedly higher than that of the included patients, 68.0±9.1.
Fig. 1
Flow chart. Flow chart of patient inclusion and exclusion into the study at baseline and re-examination. Number of blood samples readily analyzed for serum neurofilament light chain levels in parenthesis. Adapted from [24].
![Flow chart. Flow chart of patient inclusion and exclusion into the study at baseline and re-examination. Number of blood samples readily analyzed for serum neurofilament light chain levels in parenthesis. Adapted from [24].](https://content.iospress.com:443/media/jpd/2022/12-2/jpd-12-2-jpd212866/jpd-12-jpd212866-g001.jpg)
Ethical approval and patient consent
Written informed consent was obtained from the patients or, if they were unable, from next of kin based on the patients’ presumed will. All parts of the study were approved by the regional ethics board in Lund.
Outcome and re-examination
We used the patients’ medical records (accessed in 2018–2019) to determine time-points (years) for the following prespecified milestones of disease progression [24]: 1) start of use of walking-aids (walker or more advanced), 2) living in nursing home (at least ¼ of the time), 3) developing the motor end-stage of Hoehn and Yahr stage 5 (unable to walk without personal assistance; HY5), 4) developing dementia (having any dementia diagnosis, being prescribed acetylcholinesterase inhibitor or being clearly described as having dementia), and 5) death (using information from the Swedish tax agency). Fulfilment of a milestone was ignored if only occurring 2 months prior to death. A subgroup of patients were available for re-examination (Fig. 1), which included the same examination protocol again, new blood sampling, and cognitive testing with the Addenbrookes cognitive assessment revised (ACER). Re-examinations were performed close in time to the medical records search. All baseline examinations and re-examinations were made by the same investigators (AP and EYR, respectively).
Biomarker analysis
Serum samples were thawed and analyzed in duplicates on a Single Molecule array (SiMoA) platform using NF-light Advantage (SR-X) kit (Quanterix Inc, Lexington, MA, USA). Average intra-assay and inter-assay coefficients of variability were 6.3% and 15.8%, respectively. Intra-assay coefficients of variability exceeded 20% for 6 samples and there was an instrument error for one of the duplicates for another two samples. These 10 samples were re-analyzed using new aliquots from the same venipuncture. Two re-analyzed samples whose intra-assay coefficients of variability remained high even after re-run were excluded from subsequent computations. Baseline blood samples were missing for five re-examined individuals (Fig. 1). The S-NfL analyses were performed in September–October 2020 by a technician (SJ) who was blinded to all data.
Subtype allocation
We applied the SCS [24], a simplified version of a clinical subtyping system [8], to the clinical data from the baseline and then from the re-examination visits. SCS combines motor assessment and three different non-motor aspects (rating of overall non-motor symptom burden, presence of hallucinations and REM-sleep behavior disorder; RBD) into an easily applied algorithm (Supplementary Figure 1). Patients were, at both examinations, classified into mild motor predominant, intermediate, or diffuse malignant subtype.
We also classified patients according to only their motor symptoms, disregarding non-motor symptomatology. Motor-phenotype was determined in parallel to SCS using data from the baseline and then the re-examination visits, comparing the means of tremor scores and PIGD scores from the UPDRS-2 and UPDRS-3 as previously described. Patients were categorized as either tremor dominant, undetermined or PIGD-dominant [19]. This conventional motor-phenotypes classification, based on PIGD and tremor scores relative to each other, was used to assess potential differences in S-NfL levels between these groups. In later stages of PD, ceiling effects of the motor-phenotype system, reclassifications of patients from one group to another, and non-contribution of the tremor part to the classification have been identified as problematic issues, and the PIGD-score alone was suggested instead [21, 24, 25, 30]. Therefore, PIGD-score without relating to tremor scores was used in all other parts of this study.
Combined models
After we had observed contributions by both S-NfL and by each of the two clinical classification systems in the Cox regression models, we constructed three exploratory combined models. This was done primarily to compare the clinical classification systems further, and secondarily to explore if it was possible to construct a clinical score systems that could easily be applied in clinical day-to-day practice. The combined models included S-NfL and the factor with the highest spread of risks for all the different outcomes at baseline in the present cohort: age at onset (AaO). A second and third combined model were constructed by adding one of the two clinical classifications: SCS-group or PIGD-score to the S-NfL + AaO model. Since the SCS has three categories, we also divided each of AaO, S-NfL, and PIGD-scores into three groups, using cohort tertiles in the baseline data from our cohort, to facilitate comparison and clinical application. AaO, S-NfL, and PIGD-score of the upper, middle, or lower cohort tertiles as well as SCS-group were thus attributed a score of 0–2 : 0 for the lowest tertile/risk-group, 1 for the moderate tertile/risk-group and 2 for the highest tertile/risk-group. Receiver operator characteristics (ROC)-curves were then constructed with the individual scores (0–6 for two models and 0–4 for the S-NfL + AaO model) to compare the combined models with S-NfL as diagnostic tests for developing the disease milestones during the observation period. The cutoffs between middle–lower and middle–upper tertiles were 57.1 and 64.1 years for AaO, 2.0 and 4.0 for PIGD-score and 14.7 and 23.1 pg/ml for S-NfL.
Statistics
We used linear regression models, with S-NfL as independent variable and clinical rating data as dependent variables. Distribution of S-NfL values was skewed, which was improved by logarithmic transformation using the natural logarithm; each one unit increase thus corresponds to a ∼2.72-fold increase of S-NfL on the original scale. Model residuals were examined for normal distribution and equality of variances with histograms and scatterplots. Time intervals from baseline examination to when the patients reached the five different milestones of disease progression or were censored (date of death or last contact in medical records), were used in survival statistics. Survival curves of Kaplan-Meier estimates and log rank tests were studied for each milestone in individuals with S-NfL levels above and below cohort median. Cox regression models for continuous S-NfL values were created and SCS-group or PIGD-score were then entered separately. Proportionality of the hazards assumption was tested for each model and models with non-proportional hazards were further examined using time-dependent analyses and stratification on sex. Unless noted, all regression models were adjusted for AaO, sex and disease duration as these factors are known to affect progression and NfL levels in PD [11, 16, 17]. ROC curves for S-NfL were adjusted for age by entering residuals from linear regression of age and S-NfL at baseline. Two-tailed p-values≤0.05 were considered statistically significant and variables were considered continuous unless otherwise noted. R v4.0.2 (survival and pROC packages) was used for testing proportionality of the hazards and constructing and comparing ROC-curves with Delong method [31]. For all other statistical calculations SPSS v25.0 was used. Sensitivity analysis was performed for all regressions by removing individuals with outlier S-NfL values (outside 1.5 interquartile range from quartile values). Missing values in UPDRS were imputed by the mean of the patient’s valid scores in that subpart. This was performed for 31 individuals with median 3.6% missing values in total UPDRS (range 1.8–36.4%). UPDRS-1–4 and PIGD-score subtotals were considered missing if 60% or more of the subitems were undetermined (four individuals).
RESULTS
Baseline examination
Eighty-five patients with PD (59.9% of individuals originally examined) were available for this study after 57 individuals (40.1%) were excluded because they had: died within two years after the baseline examination (n = 22, 15.5%), no blood sample (n = 7, 4.9%), incomplete examinations (n = 4, 2.8%, three without UPDRS and one with more than 30% missing in UPDRS-2 + UPDRS-3), were lost to follow-up (n = 3, 2.1%) or did not have sporadic PD (n = 21, 14.8%; Fig. 1, Table 1). At baseline examinations, higher S-NfL levels were significantly associated with higher age (unadjusted linear regression p < 0.001) and with more advanced HY-stage and poorer performance on the ADL-reflecting assessments, UPDRS part 2 and S&E (adjusted linear regressions, Table 2).
Table 1
Demographics and biomarker levels
| Total cohort | Missing dataa | Not re-examined | Re-examined | |
| N | 85 (100%) | 0 | 51 (60.0%) | 34 (40.0%) |
| Men (n) | 51 (60.0%) | 0 | 33 (64.7%) | 18 (52.9%) |
| Age at Onset (y) | 60.1±9.2 | 0 | 63.3±8.4 | 55.3±8.2 |
| Disease duration at baseline (y) | 7.9±5.1 | 0 | 8.5±5.0 | 6.9±5.2 |
| Baseline S-NfL (pg/ml) | 23.1±16.8 | 5 | 26.5±18.9 | 17.1±9.9 |
| Time observed (y) | 7.9±2.7 | 0 | 7.2±2.8 | 9.1±2.0 |
| Disease duration at end of study or at death (y) | 15.8±5.3 | 0 | 15.7±5.4 | 16.0±5.3 |
| Age at end of study or at death (y) | 75.9±8.0 | 0 | 79.0±6.3 | 71.3±8.0 |
| Died (n) | 37 (43.5%) | 0 | 36 (70.6%) | 1 (2.9%)b |
| Disease duration at death (y) | 14.9±5.2 | 0 | 14.8±5.2 | 19.5b |
| Re-examination: | ||||
| Disease duration at re-examination (y) | n/a | 0 | n/a | 15.2±5.3 |
| Duration since baseline examination | n/a | 0 | n/a | 8.2±2.0 |
| Re-examination S-NfL (pg/ml) | n/a | 2 | n/a | 30.3±21.2 |
| Change S-NfL (pg/ml) | n/a | 7 | n/a | 10.5±13.6 |
| S-NfL change/year (pg/ml/year) | n/a | 7 | n/a | 1.3±1.8 |
| ACER (score) | n/a | 0 | n/a | 85.2±19.1 |
Values represent mean±SD or number of individuals (percentage on group level). Separate values from re-examination shown at the lower part of the table. S-NfL, serum neurofilament light chain levels; ACER, Addenbrooke’s Cognitive Examination Revised. anumber of individuals with missing data; bone re-examined individual died shortly after the re-examination.
Table 2
Regression models of baseline and re-examination parameters
| Baseline S-NfLa | p | Re-examination S-NfLb | p | ΔS-NfLc | p | ||
| UPDRS-2 | 4.44 (2.20–6.67) | 0.000 | 5.88 (1.00–10.75) | 0.020 | Δ-UPDRS-2 | 0.11 (−0.67–0.28) | 0.213 |
| UPDRS-3 | 3.25 (−1.26–7.76) | 0.156 | 7.35 (−1.52–16.22) | 0.101 | Δ-UPDRS-3 | 0.18 (−0.23–0.58) | 0.376 |
| UPDRS total | 5.44 (−1.01–11.89) | 0.097 | 16.82 (2.26–31.38) | 0.025 | Δ-UPDRS total | 0.29 (−0.34–0.92) | 0.351 |
| PIGD-score | 1.29 (0.00–2.59) | 0.050e | 3.73 (0.99–6.47) | 0.009 | Δ-PIGD-score | 0.13 (0.03–0.24) | 0.017 |
| HY-stage | 0.54 (0.19–0.89) | 0.003 | 0.79 (0.21–1.37) | 0.009 | Δ-HY-stage | 0.02 (−0.00–0.05) | 0.097 |
| S&Ef | −18.93 (−29.88––7.98) | 0.001 | −20.24 (−37.66––2.82) | 0.024 | Δ-S&Eg | −0.12 (−1.34–1.11) | 0.834 |
| ACER-score | n/a | n/a | −12.26 (−26.23–1.71) | 0.083 | ACER-score | −0.82 (−1.38––0.26) | 0.006 |
General linear regression models of baseline and re-examination parameters. All results presented as effect size (B) for S-NfL levels and 95% CI in parenthesis. The age model was unadjusted but all other models were adjusted for age at onset, disease duration and sex. See Supplementary Table 4 for values of adjustment covariates and constants. p-values≤0.05 highlighted in bold. an = 80; bn = 32; cn = 27; dunadjusted analysis; ep-value of 0.050002; fn = 45 at baseline and 31 at re-examination; gn = 15; ACER, Addenbrooke’s Cognitive Examination Revised; PIGD, Postural instability and gait disorder; S&E, Schwab and England activity of daily living score; S-NfL, serum neurofilament light chain levels (Ln-transformed); UPDRS-2, Unified Parkinson disease rating scale part 2; UPDRS-3, Unified Parkinson disease rating scale part 3.
Longitudinal outcomes
We have previously reported the longitudinal outcomes in this cohort in general and in relation to clinical classification systems [24]. Higher levels of S-NfL at baseline were associated with increased risks for reaching any of the five milestones of PD progression during the following 7.9±2.7 (mean±SD) years (significant unadjusted HRs in Cox regressions for all milestones and supported by log rank p < 0.05 for all milestones when comparing individuals above vs below the cohort median of 18.4 pg/ml; Fig. 2 and Supplementary Table 2). After adjustment of the Cox regression models for age at onset, sex, and disease duration, higher S-NfL values remained associated with higher risks for all milestones of disease progression except the risk to develop dementia for which the model showed un-proportional hazards (Table 3). Further Cox regression modeling with time-dependent covariates and stratification on sex for the dementia milestone showed non-significant S-NfL HRs (p-values of 0.97, 0.69, and 0.54 when analyzing time-dependent model, males-only and females-only, respectively, other data not shown). The adjusted HRs (95% CI) for S-NfL were between 3.5 (1.4–8.5; for time to walking-aid usage) and 6.2 (2.1–17.8; for time to HY5). Age-adjusted S-NfL levels at baseline had areas under the ROC curves (AUCs) of 0.68–0.71 for predicting the different progression milestones during the study period (Fig. 3).
Fig. 2
Survival curves for studied milestones of disease progression. Survival curves of Kaplan-Meier estimates for individuals below or above cohort median of serum neurofilament light chain levels. Graphs show time from the baseline examination to: A) walking-aid usage, B) nursing-home residency, C) Hoehn and Yahr stage 5, D) dementia development, E) death. Log rank test results in the lower left part of the corresponding graph. Number of individuals remaining to be observed at each 2-year step showed below each graph. S-NfL, serum neurofilament light chain.
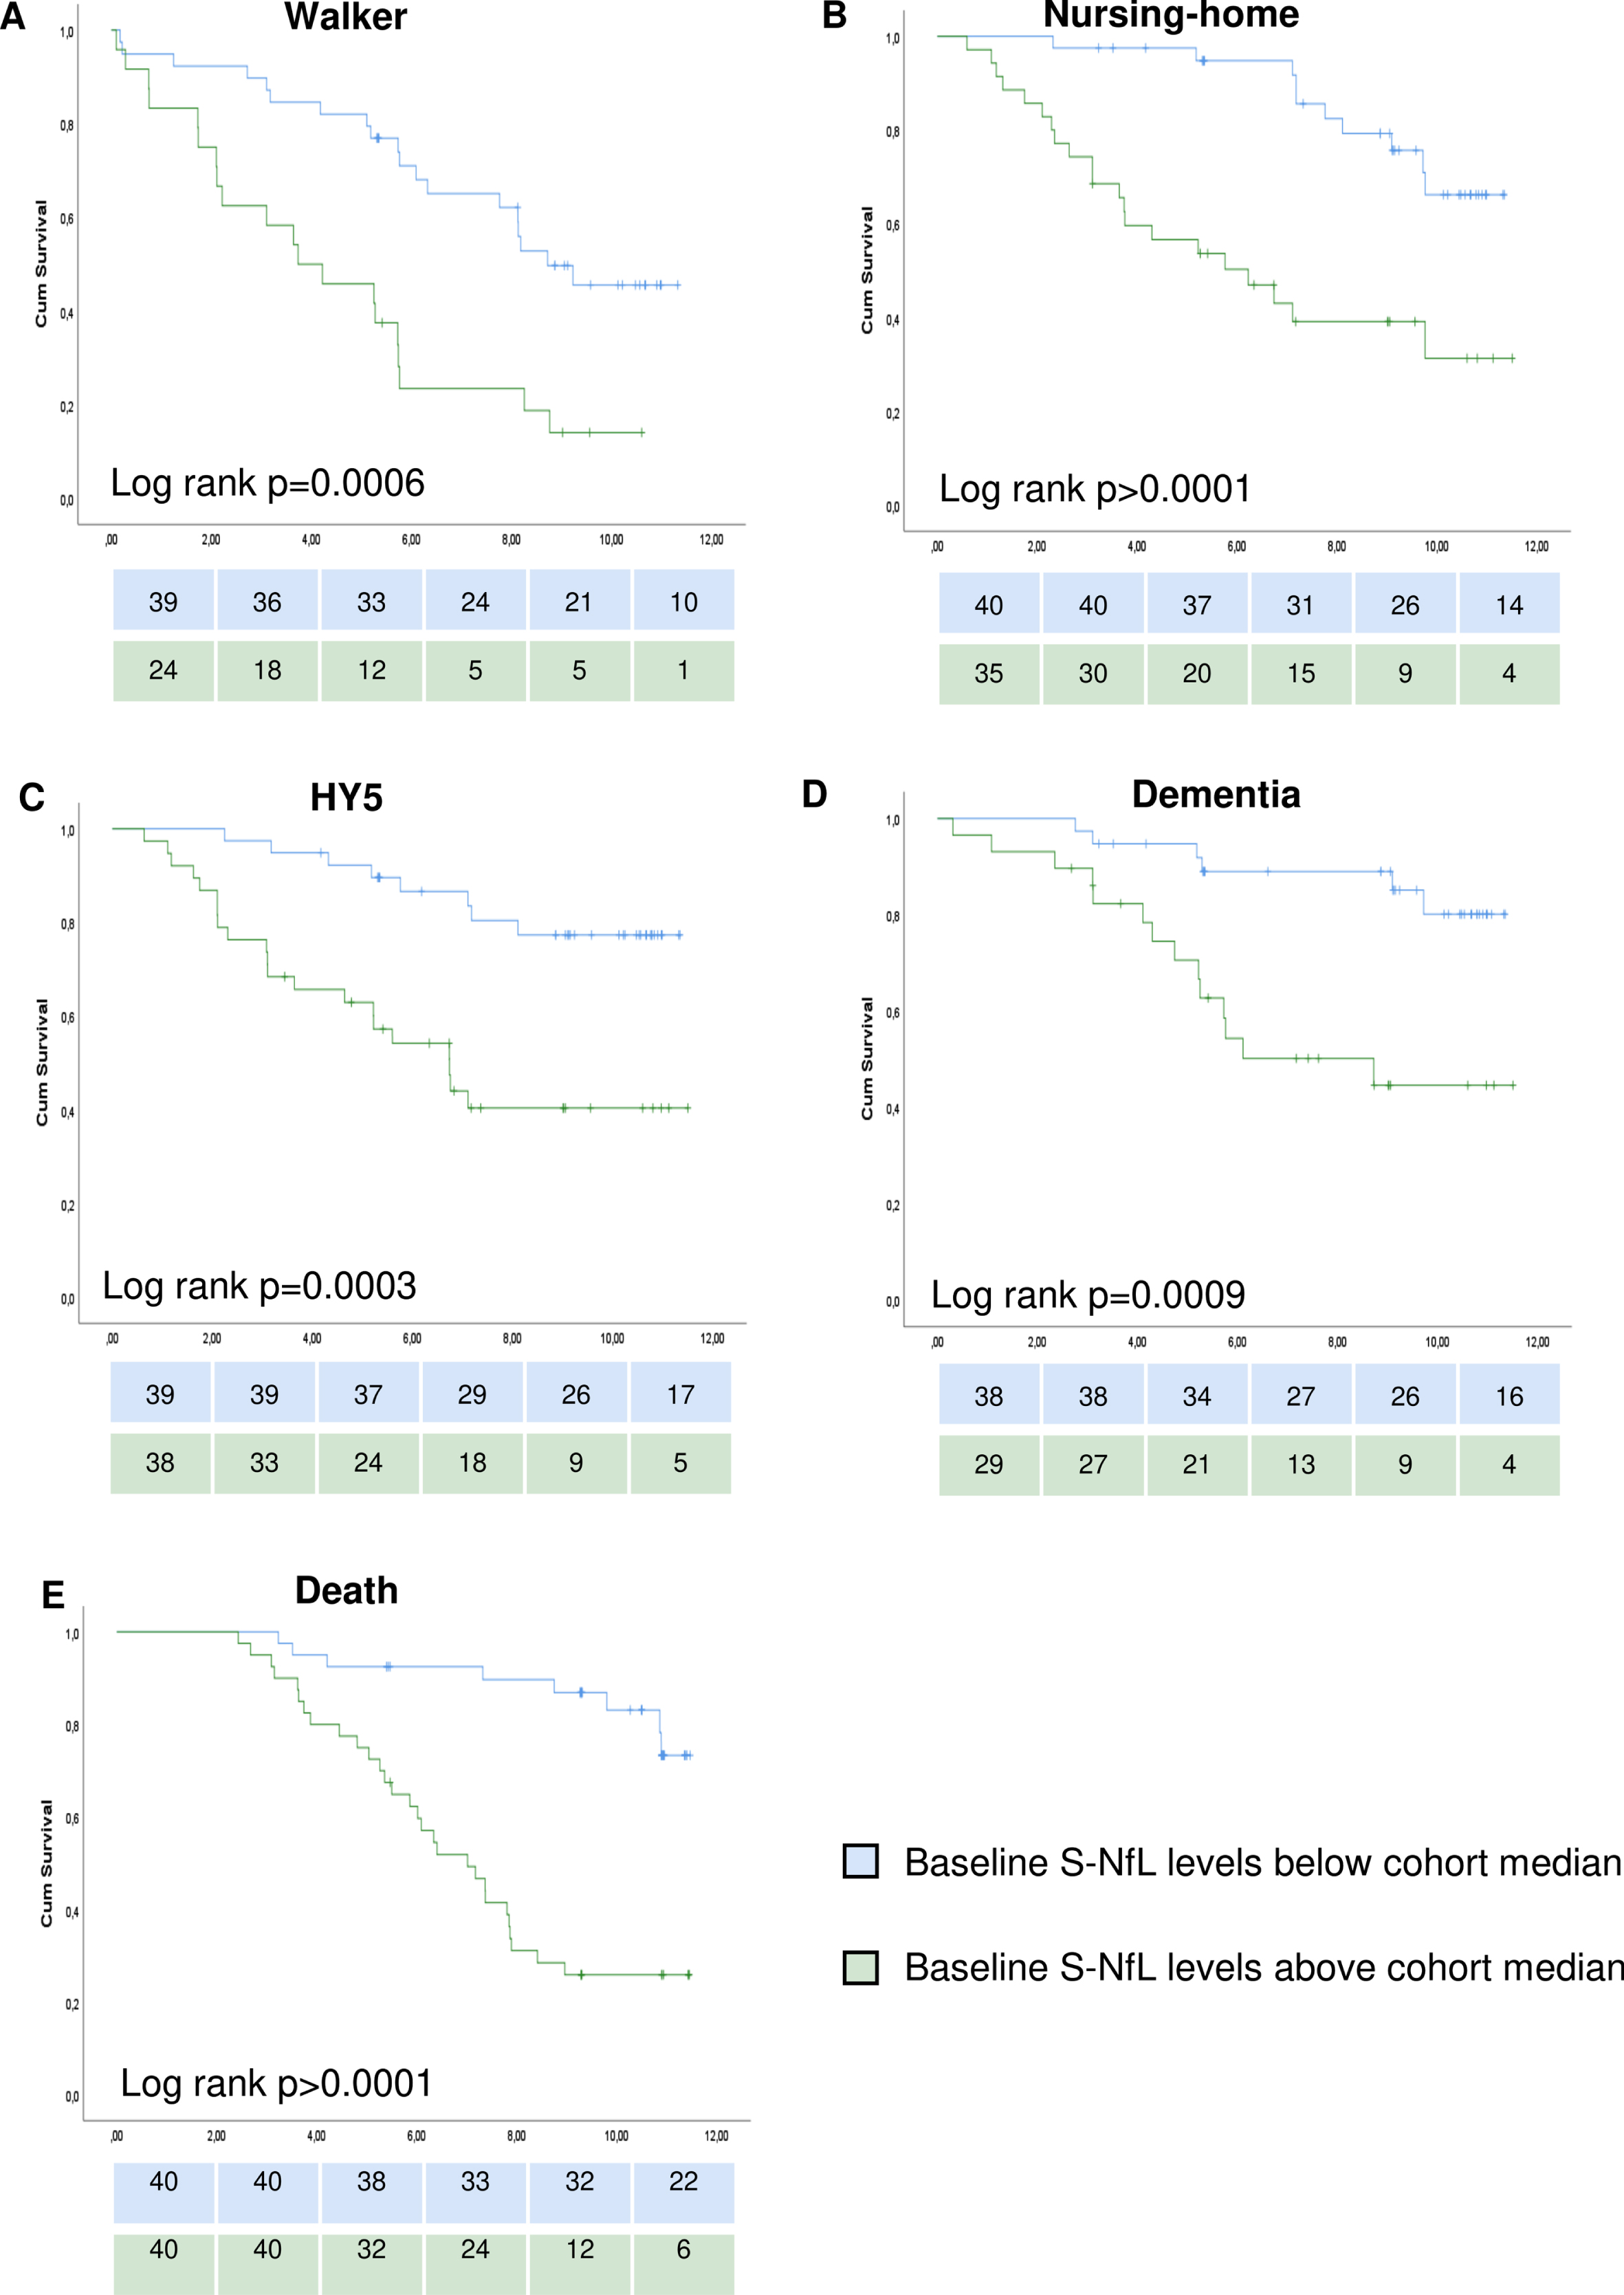
Fig. 3
ROC-curves for S-NfL. Receiver operator characteristics (ROC) curves for having reached the five different milestones of disease progression at any point during the study period. A) walking-aid usage, B) nursing-home residency, C) Hoehn and Yahr stage 5, D) dementia development, E) death. S-NfL, serum neurofilament light chain levels (pg/ml); S-NfL + AaO, combined model based on tertiles of age at onset and S-NfL levels; S-NfL + SCS + AaO combined model based on simplified clinical subtype combined with tertiles of age at onset and S-NfL levels; S-NfL + PIGD score + AaO, combined model based on tertiles of postural instability and gait disorder score, age at onset and S-NfL levels.
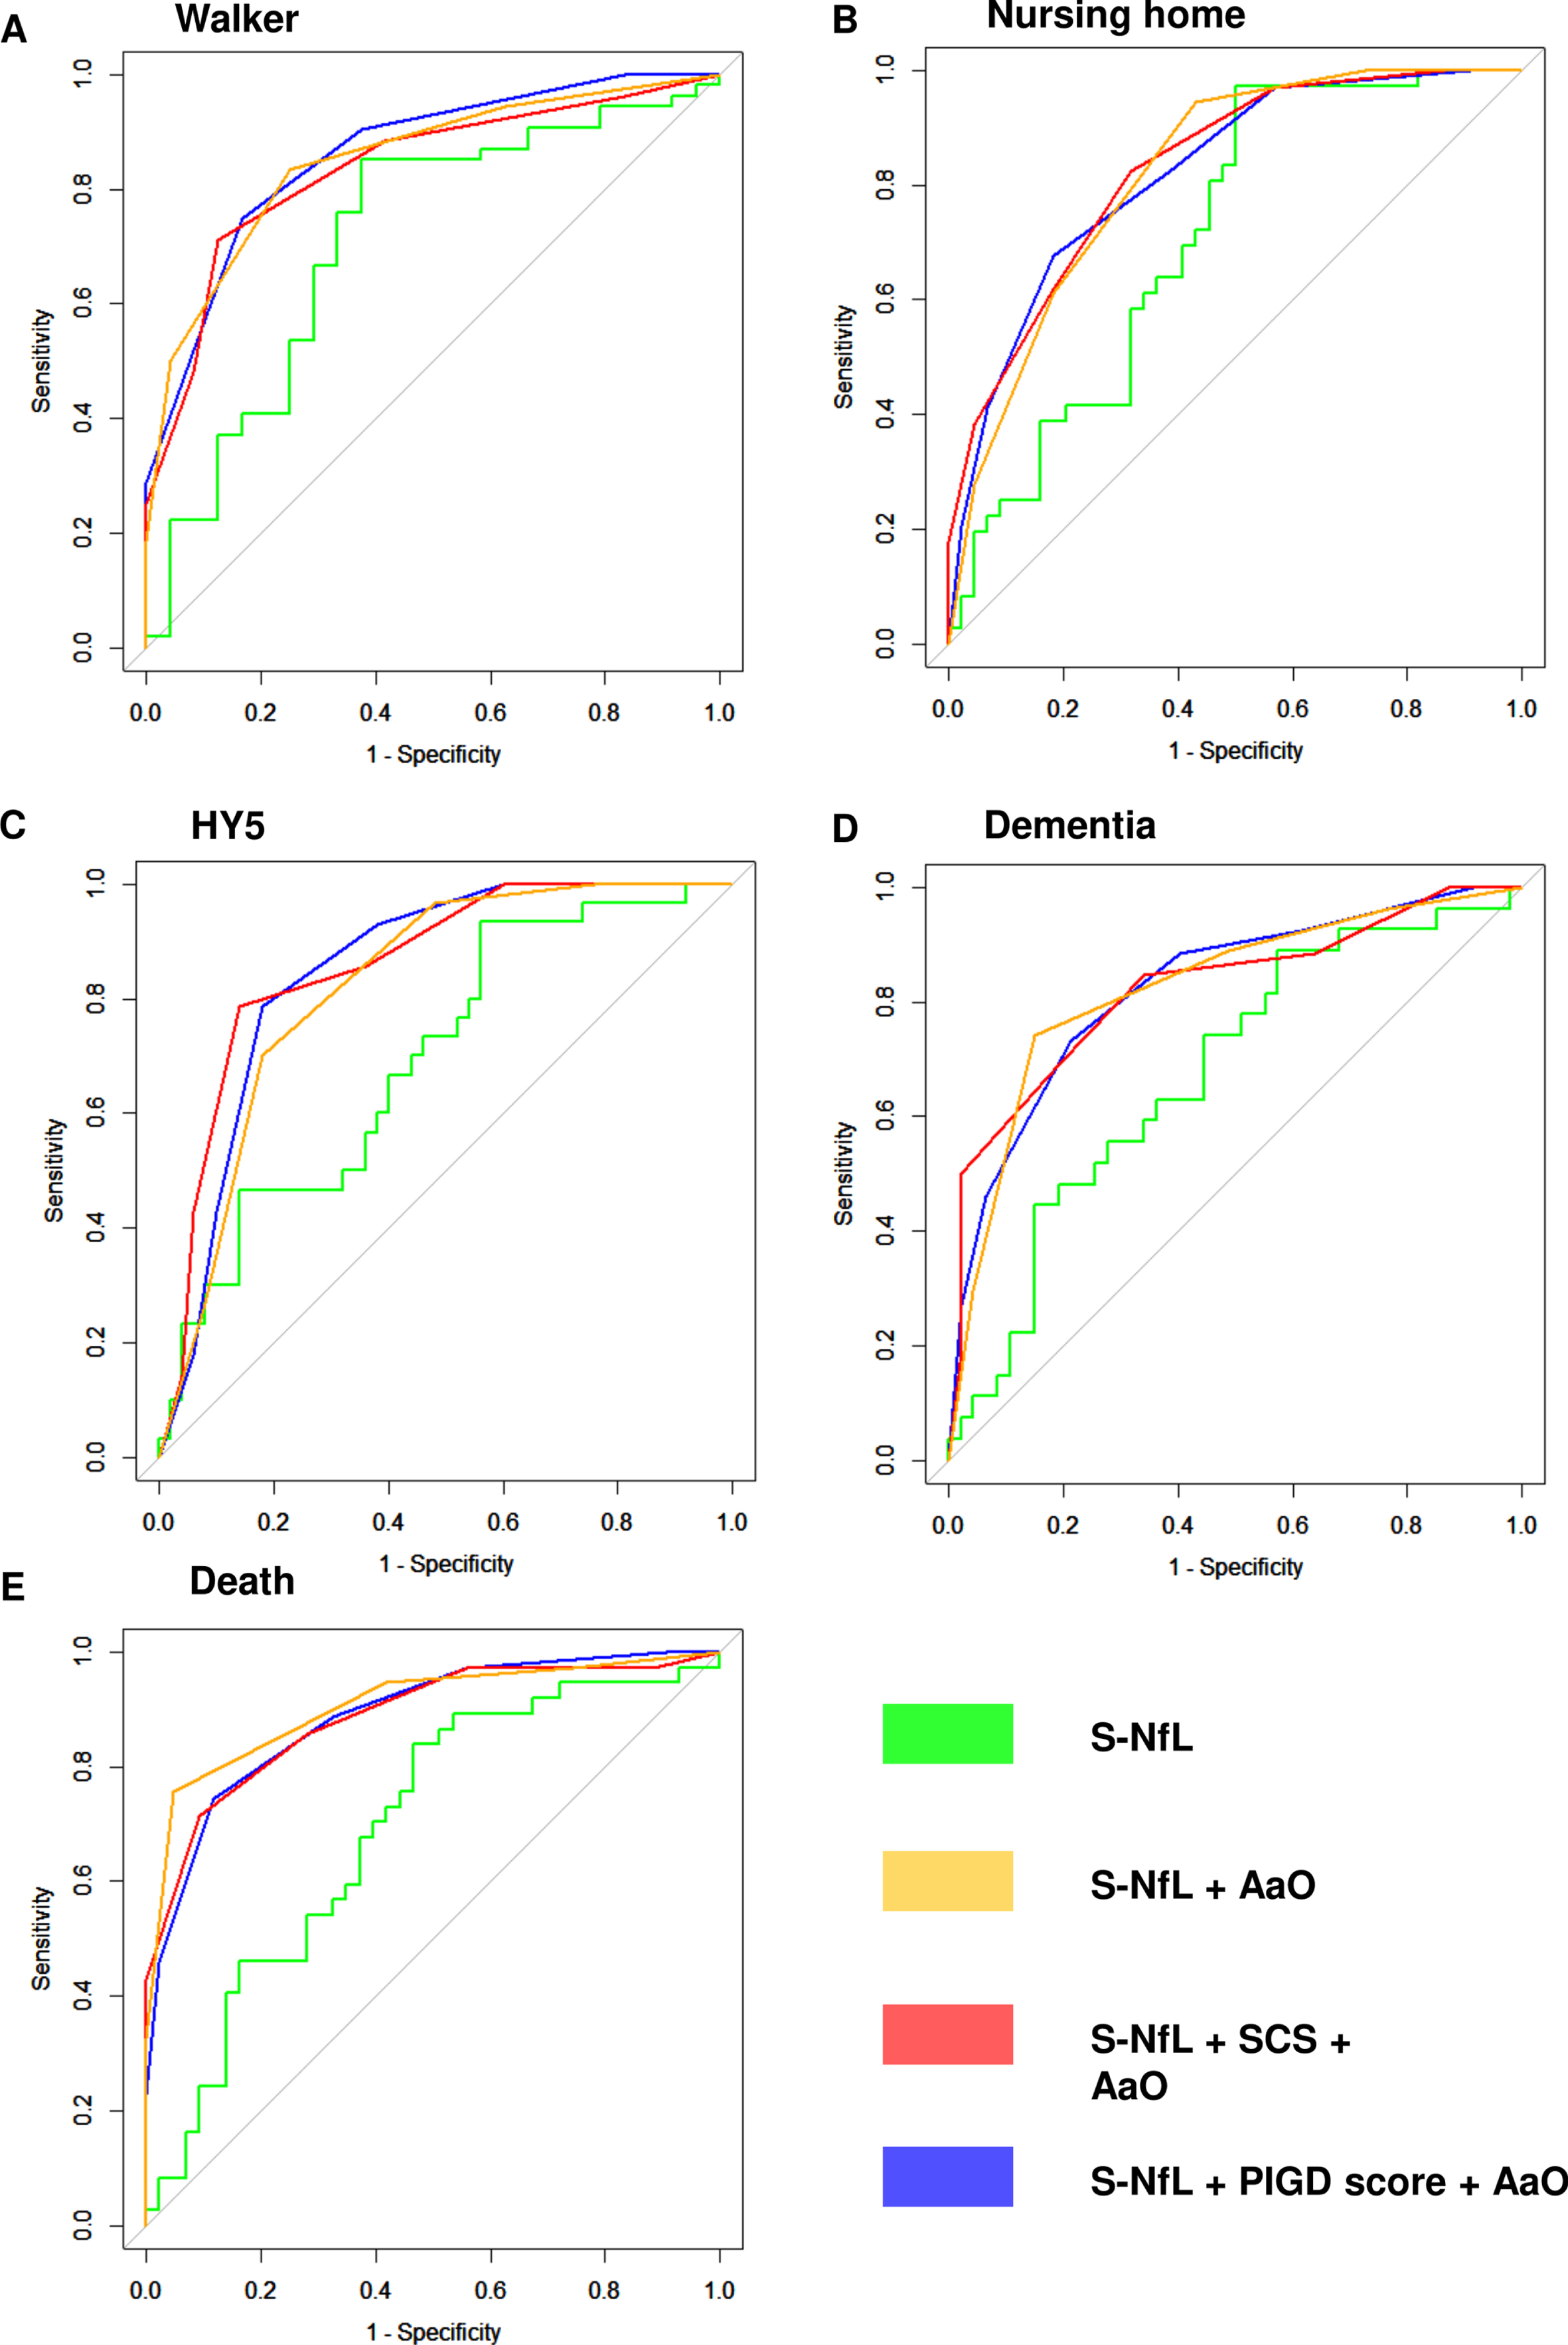
Table 3
Cox regression models for reaching milestones of disease progression
| Walking-aid | p | Nursing home | p | HY5 | p | Dementia | p | Death | p | |
| S-NfL only | ||||||||||
| S-NfL HR | 3.48 | 0.006 | 5.08 | 0.000 | 6.16 | 0.001 | 2.77 | 0.105 | 4.07 | 0.001 |
| (1.43–8.50) | (2.07–12.46) | (2.13–17.79) | (0.81–9.46) | (1.72–9.66) | ||||||
| S-NfL + SCS | ||||||||||
| S-NfL HR | 4.09 | 0.004 | 4.98 | 0.001 | 5.92 | 0.004 | 2.01 | 0.322a | 3.11 | 0.024 |
| (1.58–10.59) | (1.87–13.28) | (1.79–19.66) | (0.50–8.01)a | (1.16–8.31) | ||||||
| SCS HR | 1.63 | 0.051 | 1.86 | 0.014 | 2.52 | 0.001 | 2.12 | 0.020a | 1.48 | 0.109 |
| (1.0–2.66) | (1.13–3.07) | (1.44–4.41) | (1.12–3.98)a | (0.92–2.38) | ||||||
| S-NfL + PIGD score | ||||||||||
| S-NfL HR | 3.38 | 0.008 | 4.68 | 0.002 | 4.72 | 0.009 | 1.71 | 0.474 | 3.03 | 0.021 |
| (1.36–8.35) | (1.79–12.22) | (1.48–15.02) | (0.39–7.41) | (1.20–9.18) | ||||||
| PIGD-score HR | 1.10 | 0.343 | 1.12 | 0.124 | 1.24 | 0.006 | 1.07 | 0.330 | 1.03 | 0.588 |
| (0.90–1.34) | (0.97–1.28) | (1.06–1.44) | (0.93–1.23) | (0.92–1.16) |
Cox regression models for predefined milestones of disease progression during the observation period. All models adjusted for age at onset, sex, and disease duration. SCS group or PIGD score were separately added as a covariate to the models (lower rows). For results of unadjusted models and all covariates in the adjusted model, see Supplementary Table 2. For individuals at risk over time, see Fig. 2. For other assessments of SCS and PIGD-score HRs from the cohort, see reference [24]. aNon-proportional hazard was indicated for SCS-group in the dementia model, non-significant contributions were confirmed in time-dependent analyses and stratifications on sex. HR, Hazard ratio; PIGD, postural instability and gait disorder; SCS, simplified clinical subtype; S-NfL, serum neurofilament light chain levels (Ln-transformed).
Classification systems
Levels of S-NfL differed between SCS-groups (one-way analysis of variance; baseline p < 0.001, re-examination p = 0.011), but not between motor-phenotype groups (one-way analysis of variance; baseline p = 0.322, re-examination p = 0.132). PIGD-score alone, however, consistently showed significant associations with S-NfL throughout this study (Table 2).
The significance levels of S-NfL HRs were not changed after addition of either PIGD-score or SCS to the S-NfL-Cox regression models; all S-NfL p-values remained below 0.05 before and after additions, and the size of S-NfL’s HRs were only slightly changed for reaching the milestones of disease progression. S-NfL HRs changed between +0.61 in the SCS walker model and –1.44 in the PIGD-score HY5 model compared to before additions (Table 3 and Supplementary Table 2). S-NfL HRs were, however, higher when combined with SCS than when combined with PIGD-score. Furthermore, both classification systems showed significant effects on risks that were additional to that of S-NfL levels for reaching nursing-home and HY5 milestones (only in unadjusted analysis for PIGD-score; Supplementary Table 2 for unadjusted results and Table 3 for adjusted results). Also, SCS showed significant effects on risks that were additional to that of S-NfL levels alone for dying (unadjusted analysis only).
Re-examination subgroup
Re-examinations were performed for 34 patients (40.0% of included patients), at 15.2±5.3 years of total disease duration 8.2±2.0 years after the baseline visits. Thirty-two individuals with PD had died before re-examination visits started (37.6%) and 19 individuals (22.4%) denied re-examination (of whom three died within a year). In all but three patients, S-NfL levels at re-examination had increased since baseline (n = 27). Mean change between examinations was 10.5±13.6 pg/ml, individual changes are visualized in Supplementary Figure 2. Higher S-NfL levels at re-examination were associated with worse performance as measured with UPDRS-2, UPDRS-total, HY-stage, S&E, and PIGD-scores at re-examination (Table 2). Larger longitudinal increase in S-NfL between the examinations were associated with larger longitudinal increase in PIGD-score and a lower ACER-score at re-examination.
Sensitivity analyses
After removing four outliers in baseline S-NfL levels (Supplementary Table 3) the association between S-NfL levels and both HY-stage and S&E lost significance (p = 0.347 and p = 0.056, respectively) and S-NfL HRs were increased for walking-aid usage and nursing home living and changed for mortality (lost significance level or showed un-proportional hazards). Furthermore, HY5 development HR for S-NfL was decreased without combining it with the classification systems and lost significance in combination with the classification systems, although the classification systems maintained significant HRs of similar levels.
After removing two outliers in re-examination S-NfL levels, the associations between high S-NfL levels and high UPDRS-2 and UPDRS-total scores lost significance (p = 0.099 and p = 0.053, respectively). On the other hand, the association between longitudinal increase in S-NfL levels and increase in HY-stage, UPDRS-2 and UPDRS-total scores showed decreased p-values of 0.036, 0.051 and 0.01, respectively. All other parameters were generally unchanged after sensitivity analysis.
Combined models
For all milestones of disease progression, the combined models, using tertiles of AaO and S-NfL (S-NfL + AaO), or the combinations of these tertiles together with either PIGD-score tertiles (S-NfL +PIGD score + AaO) or SCS-group (S-NfL + SCS +AaO), showed larger AUCs (0.77–0.91, Fig. 3, Table 4) than age adjusted S-NfL alone. The differences were significant for all but walking aid usage in the S-NfL + SCS + AaO combined model and for nursing-home living in the S-NfL + AaO model. The combined models with clinical classifications had slightly larger AUCs than S-NfL + AaO for prognosticating HY5-development, but slightly lower AUC for mortality, and the three different combined models showed generally similar AUCs.
Table 4
Area under receiver operator characteristics curves
| AUC for milestone | S-NfLa | S-NfL + AaO | S-NfL + SCS + AaO | S-NfL + PIGD score + AaO |
| Walking-aid | 0.705 | 0.851 | 0.788 | 0.822 |
| (p = 0.035) | (p = 0.128) | (p = 0.033) | ||
| Nursing home | 0.699 | 0.821 | 0.814 | 0.805 |
| (p = 0.050) | (p = 0.0329) | (p = 0.049) | ||
| HY5 | 0.680 | 0.824 | 0.877 | 0.865 |
| (p = 0.027) | (p = 0.001) | (p = 0.003) | ||
| Dementia | 0.669 | 0.825 | 0.765 | 0.775 |
| (p = 0.014) | (p = 0.021) | (p = 0.005) | ||
| Death | 0.680 | 0.907 | 0.885 | 0.887 |
| (p = 0.000) | (p = 0.001) | (p = 0.001) |
Area under receiver operator characteristics (ROC) curves for having reached five different milestones of disease progression at any point during the study period. p values represent comparison to S-NfL AUC using Delong method. aAge adjusted S-NfL levels; AUC, area under ROC-curve; S-NfL, serum neurofilament light chain; S-NfL + AaO, combined model based on tertiles of age at onset and S-NfL levels; S-NfL + SCS + AaO, combined model based on simplified clinical subtype combined with tertiles of age at onset and S-NfL levels; S-NfL + PIGD score + AaO, combined model based on tertiles of postural instability and gait disorder score, age at onset, and S-NfL level.
DISCUSSION
This study showed that S-NfL levels of patients with PD reflect relative risks of reaching important milestones of disease progression. When measured at mid-stage disease, higher S-NfL levels inferred an increased risk for walking-aid usage, nursing home residency, HY5 development and death, during the following 7.9±2.7 years. Furthermore, higher S-NfL levels were associated with worse performance on HY and the ADL measurements S&E and UPDRS-2 at both baseline and re-examination, and longitudinal increase in S-NfL levels showed an association with poorer cognitive performance at re-examination. Taken together, these results indicate that S-NfL levels, if validated in larger materials, can be useful for prognostication of a wide range of both motor and social outcomes in mid- and late-stage PD.
Some previous studies on CSF and blood NfL levels found no associations to PD outcome [4, 32, 33]. More recent studies reported, however, that NfL levels in blood were associated with diverse PD motor aspects, including HY stage [34] and total UPDRS scores [16]. In the present study, we found that higher S-NfL levels were associated with increased severity of several relevant aspects of PD, including ADL measurements, HY-stage, PIGD-score, and the risk of reaching important disease progression milestones. These results support that S-NfL might be used as a broad prognostication marker in PD.
Cognitive outcome
Although previous studies have found NfL in blood and CSF to be associated with cognitive outcomes in PD [16, 33–35], the present survival analyses showed no prognostic value for S-NfL to predict risks of dementia development. However, in the subset of patients for whom we had 2 serum samples, greater longitudinal S-NfL change was associated with poorer cognitive test scores at re-examination, in agreement with previous findings from a larger cohort with similar length of follow-up [17].
Motor outcome
Regarding motor outcome, we found no associations between S-NfL levels and UPDRS-3 score, contrary to what has been observed in other studies [16, 34]. Also, S-NfL levels did not differ between motor-phenotypes in the present study, as was reported in a recent study with observations from PD onset [15]. On the other hand, we found consistent associations between S-NfL and PIGD-scores (Tables 2 and 3) which could be more closely correlated than conventional tremor/PIGD motor-phenotypes in late PD [24, 30]. We also found associations between S-NfL levels and HY-stage, which might be relatively less dependent on medication than UPDRS-3 (Table 2).
Combination of S-NfL and clinical classifications
A combination of different biomarkers has been proposed to improve prognostication in PD [9]. Our statistical analyses first established that S-NfL levels were associated with PIGD-score and SCS group (in one-way analysis of variance and linear regressions, respectively). However, the contribution of these clinical classification parameters in the Cox regression models were interpreted as additional to that of S-NfL, because S-NfL HRs were altered to a low extent when adding SCS or PIGD-score to the models, and because SCS and PIGD showed significant HRs in some models (Table 2). We then constructed and tested the combinations as simple combined models. Except for walking aid usage for the S-NfL + SCS + AaO combined model and for nursing-home living for S-NfL + AaO model, all combined models showed significantly greater AUCs to predict development of disease progression milestones than that of S-NfL alone (Fig. 3, Table 4). Combining S-NfL tertiles with AaO tertiles showed similar or better prognostic value compared to the models with clinical classification systems for all milestones of disease progression but HY-5 development. The relative non-contribution of clinical classifications in the combined models could indicate either that data on risk-stratification of the clinical classifications was lost due to statistical reasons, as in lack of adjustments in ROC-curves and/or potential confounding, or that S-NfL levels and AaO are the more powerful prognostic estimates. Irrespectively, the systems have potential to be further improved since cutoffs of included parameters were determined in a relatively small material. After verification and/or adjustment of cutoffs, combined models could in the future be convenient prognostication tools for clinical outpatient appointments. Our findings indicate that clinical score models including AaO and S-NfL levels have good potential as prognostic measures, but clinical classification systems should be included if independence of locomotion is of interest. All data required can easily be determined in a routine office visit through interview, standardized clinical examinations and a blood sample for S-NfL analysis.
The fact that combining S-NfL and clinical parameters added additional prognostic accuracy in the present study (Tables 3 and 4, Fig. 3) might indicate that these biochemical and clinical biomarkers reflect different aspects of PD progression. An interesting approach for future studies could be to examine specific pathological effects corresponding to NfL increase, as NfL might be more likely to reflect non-dopaminergic aspects of PD progression than the clinical classification systems tested in the present study.
Biomarkers in mid- and late-stage PD
The present cohort had relatively long disease duration already at baseline (mean 7.9±5.1 years) and data was available until a mean disease duration of 15.8±5.3 years. In mid- and late stages of PD, the disease has a greater impact on patients’ lives when compared to early disease stages. Contributory factors are the increasing severity of non-treatment-responsive symptomatology, medication side effects, cognitive difficulties, and other non-motor symptomatology. Furthermore, practical burden associated with more difficult drug regimens, surgical therapy or pump devices, the increasing age and possible comorbidity of patients and their caregivers, and other manifestations of disease or treatment side effects, can affect the life of PD patients. Our study explores ways to provide information to patients in these stages of disease about their individual future risk to develop severe disease outcomes, which may have important aspects on life decisions. The majority of biomarker research in neurodegenerative disorders has attempted to identify groups of patients who may be expected to benefit most from future treatments that promise to slow down disease progression or to characterize surrogate markers for disease progression to be used as end points in therapeutic trials. Such studies require patients in early disease processes, including pre-symptomatic individuals with high-risk genetic variants. By contrast, for clinical prognostic applications, biomarkers need to be studied in later disease stages, as in the present study. It is interesting to note that S-NfL as a very general marker for neurodegeneration shows promising characteristics for various applications. Our results show a persistent prognostic capability of S-NfL also when measured in mid- to late-stage PD. Since other studies have found associations between higher CSF-NfL levels and both more severe motor symptoms and radiological findings soon after PD diagnosis, prognostic value throughout the major parts of PD’s natural course may be an advantage of this biomarker [15].
Strengths and limitations
The timespan of this study was relatively long and allows us to draw conclusions on S-NfL’s effects in mid-to-late-stage PD. Many outcomes with large effects on the daily life of the patients can be more accurate to study at this part of PD, since many severe complications arise late in the disease [36, 37]. Other strengths with the present study design include examination by the same physician at each follow-up point, which removed rater-dependent variability, and that half of the present cohort was recruited from a geographical area rather than from a tertiary center, improving external validity of our results. The latter may represent a crucial element to gain new knowledge on PD subtypes, as highlighted by a recent review on 38 original reports suggesting different PD subtypes but none of which had included patients in a population-based manner [38]. A limitation of this study is that the longitudinal assessments of S-NfL included measurements at only two points in time. The true trajectories of S-NfL levels over time likely are non-linear and these have not been accounted for. The number of patients available for re-examination was limited because a proportion had died and others declined re-examination visits, likely related to increasing frailty. Although this is inevitable in longitudinal studies of mid- to late-stage disease, our conclusions based on data from the re-examination visits need to be interpreted carefully. The re-examined patients also had lower AaO’s and disease durations than those not re-examined (Table 1). Furthermore, all examinations were performed in motor ON-state, which presumably affected all motor and cognitive assessments to some degree. However, we intended to study the real-life progression of patients with PD using their regular medication. Thus, our study does not specifically consider the effects or complications of therapy but the overall state of the patients on medication. We acknowledge that our study is of an exploratory nature and that replication in a larger independent cohort is required before application in clinical practice.
CONCLUSIONS
Higher S-NfL levels were associated with decreased ADL and motor performance of patients with mid- to late-stage PD and reflected increased relative risks for reaching several important motor and social milestones of progression throughout a large part of the disease course. Longitudinal increase of S-NfL were also found to be associated with worse cognitive performance and with longitudinal increase in PIGD-score. Each of two different clinical classifications, SCS group and PIGD-score, added to S-NfL’s prognostic information in Cox regression models but a combined score model with AaO and S-NfL could predict outcome in PD with similar accuracy compared to when adding these clinical classifications. Combined scoring systems based on S-NfL should include age at onset and could be valuable and easily determinable clinical prognostication tools of PD if validated.
ACKNOWLEDGMENTS
We like to thank the patients for their participation in this study. We especially like to acknowledge the assistance of research nurse Christine Karremo at Skåne University Hospital, for coordinating patient visits and digitalizing paper protocols from examinations, and the work of medical scientist Maria Jönsson at the Skåne Regional Laboratories, for coordination and handling of blood samples. We also like to thank the staff at the Medicine clinic in Karlshamn, Sweden, for their help with accessing medical records.
This study was supported by Governmental funding for clinical research within the Swedish National Health Services (ALF), MultiPark (Multidisciplinary Research in Parkinson’s disease)–a strategic research environment at Lund University, Hans-Gabriel and Alice Trolle-Wachtmeister foundation for Medical Research, the Swedish Parkinson Foundation (Parkinsonfonden), the Swedish Parkinson Academy and Bundy Academy, all in Sweden. Work at the Clinical Memory Research unit performing the S-NfL measurements was supported by the Swedish Research Council (2016-00906), the Knut and Alice Wallenberg foundation (2017-0383), the Marianne and Marcus Wallenberg foundation (2015.0125), MultiPark, the Swedish Alzheimer Foundation (AF-939932), the Swedish Brain Foundation (FO2019-0326), Parkinsonfonden (1280/20), the Skåne University Hospital Foundation (2020-O000028), Regionalt Forskningsstöd (2020-0314) and the Swedish federal government under the ALF agreement (2018-Projekt0279).
CONFLICT OF INTEREST
OH has acquired research support (for the institution) from AVID Radiopharmaceuticals, Biogen, Eli Lilly, Eisai, GE Healthcare, Pfizer, and Roche. In the past 2 years, he has received consultancy/speaker fees from AC Immune, Alzpath, Biogen, Cerveau and Roche. AP has received reimbursement from Elsevier Ltd. for work as Associate Editor for the journal Parkinsonism & Related Disorders. All other authors report no conflict of interest.
SUPPLEMENTARY MATERIAL
[1] The supplementary material is available in the electronic version of this article: https://dx.doi.org/10.3233/JPD-212866.
REFERENCES
[1] | Greenland JC , Williams-Gray CH , Barker RA ((2019) ) The clinical heterogeneity of Parkinson’s disease and its therapeutic implications. Eur J Neurosci 49: , 328–338. |
[2] | Puschmann A , Brighina L , Markopoulou K , Aasly J , Chung SJ , Frigerio R , Hadjigeorgiou G , Koks S , Kruger R , Siuda J , Wider C , Zesiewicz TA , Maraganore DM ((2015) ) Clinically meaningful parameters of progression and long-term outcome of Parkinson disease: An international consensus statement. Parkinsonism Relat Disord 21: , 675–682. |
[3] | Thenganatt MA , Jankovic J ((2014) ) Parkinson disease subtypes. JAMA Neurol 71: , 499–504. |
[4] | Parnetti L , Gaetani L , Eusebi P , Paciotti S , Hansson O , El-Agnaf O , Mollenhauer B , Blennow K , Calabresi P ((2019) ) CSF and blood biomarkers for Parkinson’s disease. Lancet Neurol 18: , 573–586. |
[5] | Lawton M , Ben-Shlomo Y , May MT , Baig F , Barber TR , Klein JC , Swallow DMA , Malek N , Grosset KA , Bajaj N , Barker RA , Williams N , Burn DJ , Foltynie T , Morris HR , Wood NW , Grosset DG , Hu MTM ((2018) ) Developing and validating Parkinson’s disease subtypes and their motor and cognitive progression. J Neurol Neurosurg Psychiatry 89: , 1279–1287. |
[6] | de Lau LM , Verbaan D , van Rooden SM , Marinus J , van Hilten JJ ((2014) ) Relation of clinical subtypes in Parkinson’s disease with survival. Mov Disord 29: , 150–151. |
[7] | Mu J , Chaudhuri KR , Bielza C , de Pedro-Cuesta J , Larranaga P , Martinez-Martin P ((2017) ) Parkinson’s disease subtypes identified from cluster analysis of motor and non-motor symptoms. Front Aging Neurosci 9: , 301. |
[8] | Fereshtehnejad SM , Zeighami Y , Dagher A , Postuma RB ((2017) ) Clinical criteria for subtyping Parkinson’s disease: biomarkers and longitudinal progression. Brain 140: , 1959–1976. |
[9] | Delenclos M , Jones DR , McLean PJ , Uitti RJ ((2016) ) Biomarkers in Parkinson’s disease: Advances and strategies. Parkinsonism Relat Disord 22 Suppl 1: , S106–110. |
[10] | Gaetani L , Blennow K , Calabresi P , Di Filippo M , Parnetti L , Zetterberg H ((2019) ) Neurofilament light chain as a biomarker in neurological disorders. J Neurol Neurosurg Psychiatry 90: , 870–881. |
[11] | Bridel C , van Wieringen WN , Zetterberg H , Tijms BM , Teunissen CE , and the NFLG , Alvarez-Cermeno JC , Andreasson U , Axelsson M , Backstrom DC , Bartos A , Bjerke M , Blennow K , Boxer A , Brundin L , Burman J , Christensen T , Fialova L , Forsgren L , Frederiksen JL , Gisslen M , Gray E , Gunnarsson M , Hall S , Hansson O , Herbert MK , Jakobsson J , Jessen-Krut J , Janelidze S , Johannsson G , Jonsson M , Kappos L , Khademi M , Khalil M , Kuhle J , Landen M , Leinonen V , Logroscino G , Lu CH , Lycke J , Magdalinou NK , Malaspina A , Mattsson N , Meeter LH , Mehta SR , Modvig S , Olsson T , Paterson RW , Perez-Santiago J , Piehl F , Pijnenburg YAL , Pyykko OT , Ragnarsson O , Rojas JC , Romme Christensen J , Sandberg L , Scherling CS , Schott JM , Sellebjerg FT , Simone IL , Skillback T , Stilund M , Sundstrom P , Svenningsson A , Tortelli R , Tortorella C , Trentini A , Troiano M , Turner MR , van Swieten JC , Vagberg M , Verbeek MM , Villar LM , Visser PJ , Wallin A , Weiss A , Wikkelso C , Wild EJ ((2019) ) Diagnostic value of cerebrospinal fluid neurofilament light protein in neurology: a systematic review and meta-analysis. JAMA Neurol 76: , 1035–1048. |
[12] | Hansson O , Janelidze S , Hall S , Magdalinou N , Lees AJ , Andreasson U , Norgren N , Linder J , Forsgren L , Constantinescu R , Zetterberg H , Blennow K ((2017) ) Blood-based NfL: A biomarker for differential diagnosis of parkinsonian disorder. Neurology 88: , 930–937. |
[13] | Hall S , Ohrfelt A , Constantinescu R , Andreasson U , Surova Y , Bostrom F , Nilsson C , Hakan W , Decraemer H , Nagga K , Minthon L , Londos E , Vanmechelen E , Holmberg B , Zetterberg H , Blennow K , Hansson O ((2012) ) Accuracy of a panel of 5 cerebrospinal fluid biomarkers in the differential diagnosis of patients with dementia and/or parkinsonian disorders. Arch Neurol 69: , 1445–1452. |
[14] | Marques TM , van Rumund A , Oeckl P , Kuiperij HB , Esselink RAJ , Bloem BR , Otto M , Verbeek MM ((2019) ) Serum NFL discriminates Parkinson disease from atypical parkinsonisms. Neurology 92: , e1479–e1486. |
[15] | Bäckström D , Linder J , Jakobson Mo S , Riklund K , Zetterberg H , Blennow K , Forsgren L , Lenfeldt N ((2020) ) NfL as a biomarker for neurodegeneration and survival in Parkinson disease. Neurology 95: , e827–e838. |
[16] | Mollenhauer B , Dakna M , Kruse N , Galasko D , Foroud T , Zetterberg H , Schade S , Gera RG , Wang W , Gao F , Frasier M , Chahine LM , Coffey CS , Singleton AB , Simuni T , Weintraub D , Seibyl J , Toga AW , Tanner CM , Kieburtz K , Marek K , Siderowf A , Cedarbaum JM , Hutten SJ , Trenkwalder C , Graham D ((2020) ) Validation of serum neurofilament light chain as a biomarker of Parkinson’s disease progression. Mov Disord 35: , 1999–2008. |
[17] | Lerche S , Wurster I , Roben B , Zimmermann M , Machetanz G , Wiethoff S , Dehnert M , Rietschel L , Riebenbauer B , Deuschle C , Stransky E , Lieplt-Scarfone I , Gasser T , Brockmann K ((2020) ) CSF NFL in a longitudinally assessed PD cohort: age effects and cognitive trajectories. Mov Disord 35: , 1138–1144. |
[18] | Wilke C , Dos Santos MCT , Schulte C , Deuschle C , Scheller D , Verbelen M , Brockmann K , von Thaler AK , Sunkel U , Roeben B , Bujac S , Metzger FG , Maetzler W , da Costa AN , Synofzik M , Berg D ((2020) ) Intraindividual neurofilament dynamics in serum mark the conversion to sporadic Parkinson’s disease. Mov Disord 35: , 1233–1238. |
[19] | Jankovic J , McDermott M , Carter J , Gauthier S , Goetz C , Golbe L , Huber S , Koller W , Olanow C , Shoulson I , et al. ((1990) ) Variable expression of Parkinson’s disease: a base-line analysis of the DATATOP cohort. The Parkinson Study Group. Neurology 40: , 1529–1534. |
[20] | Qian E , Huang Y ((2019) ) Subtyping of Parkinson’s disease - where are we up to? Aging Dis 10: , 1130–1139. |
[21] | Alves G , Larsen JP , Emre M , Wentzel-Larsen T , Aarsland D ((2006) ) Changes in motor subtype and risk for incident dementia in Parkinson’s disease. Mov Disord 21: , 1123–1130. |
[22] | Nutt JG ((2016) ) Motor subtype in Parkinson’s disease: Different disorders or different stages of disease? Mov Disord 31: , 957–961. |
[23] | Simuni T , Caspell-Garcia C , Coffey C , Lasch S , Tanner C , Marek K , PPMI Investigators ((2016) ) How stable are Parkinson’s disease subtypes in de novo patients: Analysis of the PPMI cohort? Parkinsonism Relat Disord 28: , 62–67. |
[24] | Ygland Rödström E , Puschmann A ((2021) ) Clinical classification systems and long-term outcome in mid- and late-stage Parkinson’s disease. NPJ Parkinsons Dis 7: , 66. |
[25] | Zeighami Y , Fereshtehnejad SM , Dadar M , Collins DL , Postuma RB , Dagher A ((2019) ) Assessment of a prognostic MRI biomarker in early de novo Parkinson’s disease. Neuroimage Clin 24: , 101986. |
[26] | Abbasi N , Fereshtehnejad SM , Zeighami Y , Larcher KM , Postuma RB , Dagher A ((2020) ) Predicting severity and prognosis in Parkinson’s disease from brain microstructure and connectivity. Neuroimage Clin 25: , 102111. |
[27] | Lin CH , Wu RM ((2015) ) Biomarkers of cognitive decline in Parkinson’s disease. Parkinsonism Relat Disord 21: , 431–443. |
[28] | Fahn S , Elton R ((1987) ) Unified Parkinson’s disease rating scale. In Recent developments in Parkinson’s disease, volume II, FahnS, GoldsteinM, MarsdenD, CalneD, eds. Macmillan, New Jersey. |
[29] | Schwab R , England A , Schwab Z ((1969) ) Projection technique for evaluating surgery in Parkinson’s disease. |
[30] | van der Heeden JF , Marinus J , Martinez-Martin P , Rodriguez-Blazquez C , Geraedts VJ , van Hilten JJ ((2016) ) Postural instability and gait are associated with severity and prognosis of Parkinson disease. Neurology 86: , 2243–2250. |
[31] | DeLong ER , DeLong DM , Clarke-Pearson DL ((1988) ) Comparing the areas under two or more correlated receiver operating characteristic curves: a nonparametric approach. Biometrics 44: , 837–845. |
[32] | Hall S , Surova Y , Ohrfelt A , Swedish Bio FS , Blennow K , Zetterberg H , Hansson O ((2016) ) Longitudinal measurements of cerebrospinal fluid biomarkers in Parkinson’s disease. Mov Disord 31: , 898–905. |
[33] | Lin YS , Lee WJ , Wang SJ , Fuh JL ((2018) ) Levels of plasma neurofilament light chain and cognitive function in patients with Alzheimer or Parkinson disease. Sci Rep 8: , 17368. |
[34] | Lin CH , Li CH , Yang KC , Lin FJ , Wu CC , Chieh JJ , Chiu MJ ((2019) ) Blood NfL: A biomarker for disease severity and progression in Parkinson disease. Neurology 93: , e1104–e1111. |
[35] | Olsson B , Portelius E , Cullen NC , Sandelius A , Zetterberg H , Andreasson U , Hoglund K , Irwin DJ , Grossman M , Weintraub D , Chen-Plotkin A , Wolk D , McCluskey L , Elman L , Shaw LM , Toledo JB , McBride J , Hernandez-Con P , Lee VM , Trojanowski JQ , Blennow K ((2019) ) Association of cerebrospinal fluid neurofilament light protein levels with cognition in patients with dementia, motor neuron disease, and movement disorders. JAMA Neurol 76: , 318–325. |
[36] | Williams-Gray CH , Mason SL , Evans JR , Foltynie T , Brayne C , Robbins TW , Barker RA ((2013) ) The CamPaIGN study of Parkinson’s disease: 10-year outlook in an incident population-based cohort. J Neurol Neurosurg Psychiatry 84: , 1258–1264. |
[37] | Cilia R , Cereda E , Klersy C , Canesi M , Zecchinelli AL , Mariani CB , Tesei S , Sacilotto G , Meucci N , Zini M , Ruffmann C , Isaias IU , Goldwurm S , Pezzoli G ((2015) ) Parkinson’s disease beyond 20 years. J Neurol Neurosurg Psychiatry 86: , 849–855. |
[38] | Mestre TA , Fereshtehnejad SM , Berg D , Bohnen NI , Dujardin K , Erro R , Espay AJ , Halliday G , van Hilten JJ , Hu MT , Jeon B , Klein C , Leentjens AFG , Marinus J , Mollenhauer B , Postuma R , Rajalingam R , Rodriguez-Violante M , Simuni T , Surmeier DJ , Weintraub D , McDermott MP , Lawton M , Marras C ((2021) ) Parkinson’s disease subtypes: critical appraisal and recommendations. J Parkinsons Dis 11: , 395–404. |


