
Insights on Genetic and Environmental Factors in Parkinson’s Disease from a Regional Swedish Case-Control Cohort
Abstract
Background:
Risk factors for Parkinson’s disease (PD) can be more or less relevant to a population due to population-specific genetic architecture, local lifestyle habits, and environmental exposures. Therefore, it is essential to study PD at a local, regional, and continental scale in order to increase the knowledge on disease etiology.
Objective:
We aimed to investigate the contribution of genetic and environmental factors to PD in a new Swedish case-control cohort.
Methods:
PD patients (n = 929) and matched population-based controls (n = 935) from the southernmost county in Sweden were included in the cohort. Information on environmental exposures was obtained using questionnaires at inclusion. Genetic analyses included a genome-wide association study (GWAS), haplotype assessment, and a risk profile analysis using cumulative genetic risk scores.
Results:
The cohort is a representative PD case-control cohort (64% men, mean age at diagnosis = 67 years, median Hoehn and Yahr score 2.0), in which previously reported associations between PD and environmental factors, such as tobacco, could be confirmed. We describe the first GWAS of PD solely composed of PD patients from Sweden, and confirm associations to well-established risk alleles in SNCA. In addition, we nominate an unconfirmed and potentially population-specific genome-wide significant association in the PLPP4 locus (rs12771445).
Conclusion:
This work provides an in-depth description of a new PD case-control cohort from southern Sweden, giving insights into environmental and genetic risk factors for PD in the Swedish population.
INTRODUCTION
Parkinson’s disease (PD) has been reported to be the fastest growing neurological disorder worldwide in terms of prevalence, disability, and deaths [1, 2]. Currently available treatments only address symptoms, and the burden of PD will increase substantially if no disease-modifying therapeutic is developed.
PD can be categorized into monogenic and idiopathic (multifactorial) PD based on the contribution of genetics to disease risk. In monogenic PD, rare DNA variants with large effect sizes but varying penetrance cause the disease [3]. Although such variants in SNCA, LRRK2, VPS35, PRKN, PINK1, GBA, and DJ-1 [4–9] contribute to a small proportion of cases, these genes have provided valuable insight into the molecular mechanisms underlying PD etiology and pathogenesis, as well as the overlapping etiology between monogenic and idiopathic PD. Whereas missense mutations and copy number variants (CNVs) of SNCA, encoding α-synuclein, have been identified to cause monogenic PD, common SNCA variants have been associated with an increased risk of idiopathic PD [5]. In idiopathic PD, which accounts for more than 95% of all PD cases, variants with relatively small effect sizes in combination with environmental exposures influence an individual’s disease risk [10, 11]. The latest large-scale genome-wide association study (GWAS) meta-analysis identified 90 risk loci associated with PD in individuals of European ancestry [12]. These variants were estimated to explain 16–36% of the heritable PD risk, indicating that many genetic risk factors for PD remain to be discovered [12]. Additionally, two new risk loci have been reported to be associated with PD risk in the Asian population [13].
Larger sample sizes in GWAS could pave the way for the discovery of additional risk variants and increase the proportion of explained heritability [14, 15]. However, it has also been suggested that the “missing heritability” could be explained by the presence of gene-gene and gene-environment interactions [14]. Commonly reported environmental risk factors for PD include smoking and exposure to pesticides, two exposures that can vary between populations. Further understanding environmental risk factors for PD in different populations is of great importance to elucidate the pathogenesis of the disease [10, 16, 17].
There is a strong population bias towards individuals of European ancestry in genetic research of human diseases [18, 19], but initiatives are taken to study PD genetic risk in other populations [20, 21]. In addition to the need of a widened scope of PD genetic research on a global level, narrowed studies are also of interest, since heterogeneity across cohorts from different countries or regions may mask genetic associations specific to sub-population [22].
The Swedish population specifically has not yet been represented in PD GWAS meta-analyses or population-specific GWAS aside from a PD GWAS performed on a mixed Scandinavian population from Norway and Sweden [23]. One one hand, the Swedish population has been reported to be genetically similar to the nearby population of Norway [24, 25]. However, it has also been reported that Swedish genomes contain a substantial amount of genetic variation and genetic variants that are not represented in other European populations [26], and that there is a large genetic difference even within the Swedish population, particularly between the south and north of Sweden [24, 26]. This highlights the importance of analyzing different European populations, and emphasizes the importance of regional matching of cases and controls in GWAS [24, 27].
Here, we provide a comprehensive description of a novel, well-defined, matched PD case-control cohort from southern Sweden in which we describe, to our knowledge, the first GWAS of PD composed solely of individuals from Sweden. This study provides insights into environmental and genetic risk factors of PD in the Swedish population and contributes to the understanding of population-specific environmental and genetic risk in PD.
MATERIALS AND METHODS
Ethical consent
Ethical permission for the MultiPark’s biobank sample collection (MPBC) was approved by the regional ethics review board of Lund (2013/509). All participants gave informed written consent at study enrollment.
Patient and population-based control inclusion
Individuals primarily diagnosed with PD (International Classification of Disease, tenth revision [ICD-10-SE] code G20.9) in the southernmost province of Sweden, Scania, were assessed for eligibility (Supplementary Figure 1). Inclusion criteria were a PD diagnosis and the ability to visit one of the clinics for sampling. In total, 2,119 PD patients were invited to participate between November 2014 and July 2017, whereof 1,011 were included (inclusion rate 48.3%). For each patient, population-based controls matched by date of birth, sex, and residential area were randomly selected from the Swedish Population Register and invited between March 2015 and April 2018. A total of 1,001 individuals consented and completed data collection (inclusion rate 18.5%). Exclusion criteria were a PD diagnosis and the inability to visit a center for sampling. Out of the completed controls, 953 were unique matchings, resulting in a matched control for 953 PD patients (94.3%). All analyses were performed in a set of 929 patients and 935 controls passing all quality control (QC) steps unless stated otherwise. A flowchart detailing the study participant inclusion process can be found in Supplementary Figure 2.
Sample and data collection, storage, and management
Blood samples were handled by the Clinical Chemistry Unit at the University Hospital in Scania (SUS) and stored at –80°C within a central biobanking facility (Biobank Syd: BD47). Whole blood was collected in EDTA-tubes (Becton Dickinson (BD) Vacutainer®, New Jersey, US) for DNA extraction. Additional samples were collected in PAXgene blood RNA tubes (QIAGEN®, Hilden, Germany), EDTA-tubes (BD Vacutainer®), sodium-heparin tubes (BD Vacutainer®, New Jersey, US) and a serum-separating tube (BD Vacutainer® SST™, New Jersey, US) to enable future studies of RNA and biomarkers in PD. When difficulties emerged during blood sample collection, EDTA-tubes for DNA extraction were prioritized. Serum and plasma samples are stored at -80°C in a 96-well format of 200μl aliquots.
All participants filled in questionnaires covering basic demographic data, lifestyle habits, family history of PD, comorbid diseases, environmental exposures, medications, health status, and perceived motor- and non-motor symptoms. Data from questionnaires was manually entered into the web-based application REDCap [28]. Additional data for the PD rating tools Hoehn and Yahr (H&Y), Clinical Impression of Severity Index - Parkinson’s Disease (CISI-PD), and Parkinson’s Disease Questionnaire - 8 (PDQ-8), as well as information on age at diagnosis (AAD), was retrieved from the Swedish Parkinson’s registry (https://www.neuroreg.se/parkinsons-sjukdom/).
Statistical analyses of epidemiological data
Epidemiologic data was analyzed using R version 4.0.0 [29]. Demographic characteristics were summarized as frequency and percentage for categorical variables. For continuous variables, mean and standard deviation (SD) were used for variables displaying normal distribution whereas median and interquartile range were reported for non-normally distributed variables. The range for continuous variables was used to demonstrate the heterogeneity in the cohort. Body mass index (BMI) was calculated as weight (kg)/height (m)2. For quality-of-life assessment, EuroQol five-dimension-3-level (EQ-5D-3L) was used, covering mobility, self-care, usual activities, pain/discomfort, and anxiety/depression. Time trade-off (TTO) and the visual analogue scale (VAS) index were calculated using scale value sets for Sweden [30]. In TTO valuation, individuals were asked to indicate how many years in full health that would be of equal value to 10 years in their current health state (divided by 10). Full health hence corresponds to 10 years/10 = 1. In VAS valuation, respondents rated their overall health between 0 (worst imaginable health) and 100 (best imaginable health) [31]. Additionally, the occurrence of PD symptoms at study inclusion were compared between the patients and controls using Pearson’s chi square test with a Bonferroni corrected threshold for statistical significance of p = 0.001.
To test for associations between potential risk factors and PD status, both unadjusted and multivariate logistic regression analyses were used. Risk factors were selected based on meta-analysis literature reviews [16, 17]. Due to the cross-sectional case-control study design, we selected variables from the questionnaire related to past exposures, excluding variables related to exposures at time or near time of inclusion. Directed acyclic graphs (DAGs) were made for all exposures of interest using the R package ‘dagitty’ to help identify confounding variables to adjust for in the multivariate analyses (Supplementary Figure 3) [32]. Confounding pathways with the least amount of missing data were prioritized and complete-case analyses were run. Odds ratios (OR), and 95% confidence intervals (CI) were estimated and plotted in a forest plot.
We further evaluated variables for BMI and comorbidities at inclusion, along with alcohol and red wine consumption and physical exercise the year prior to inclusion, as well as ibuprofen use the past two weeks prior to inclusion, using logistic regression analyses, adjusting for age and sex. We acknowledge the risk of confounding factors and present the data as observational analyses. Complete-case analyses were run, and ORs and 95% CI were estimated and plotted in a forest plot. A total of 35 comorbidities were not evaluated for association due to either too few study participants reporting a certain diagnosis or a lack of difference between the occurrence of the diagnosis between the patient and control group.
DNA extraction and genotyping
DNA extraction was done from whole blood at BD47 and at LGC Biosearch Technologies (UK, GEN-9300-120). LGC Biosearch Technologies (Germany) also performed genotyping and subsequent “Basic BioIT” with technical QC and genotype clustering. The no-call GenCall threshold was set to the standard score cutoff for Infinium data of 0.15. Matched case-control samples were genotyped using the Infinium Global Screening Array-24 v.2.0 with the Multi-Disease drop in panel v.2.0 (GSAMD-24v2.0) containing 712,189 variants annotated to the Genome Reference Consortium Human Build 37 (GRCh37).
Genotype quality control and imputation
QC analysis was performed in PLINK 1.9 [33, 34]. Samples were excluded if the call rate was < 95%, if excess heterozygosity was detected (estimated by a F statistic > 0.15 or < –0.15), or if the genetic sex (determined from X-chromosome heterogeneity) differed from the reported sex. Principal component analysis (PCA) was used to identify and exclude ancestry outliers. For this, the genotype data was merged with the HapMap phase 3 data set [35], and samples were determined as having European ancestry if they clustered 6 SD (+/-) around the combined population mean of the populations: Utah residents with Northern and Western European ancestry (CEU) and Toscani in Italia (TSI) (Supplementary Figure 4). Samples from closely related individuals, defined as sharing more than 12.5% of alleles, were also excluded. Following sample exclusion, 929 patients and 935 controls remained. Variant level QC was subsequently done, excluding SNPs with a missingness rate > 5%, Hardy-Weinberg equilibrium p-value < 1E-4, or minor allele frequency (MAF) < 1%. SNPs with differences in genotyping rate for patients and controls, and genotypes missing by haplotype, were also excluded for p-value < 1E-4. SNPs passing QC were 505,005 with a total genotyping rate of 99.9%. Genomic imputation was performed on the Michigan Imputation Server [36] using the Minimac4 imputation software, Eagle v2.4 for phasing [37], and the Haplotype Reference Consortium (HRC) r1.1 2016 European population as the reference population (http://www.haplotype-reference-consortium.org/) [38]. Post-imputation QC was performed, and variants with MAF < 5% and/or poor imputation quality, set as Rsq < 0.3, were excluded. The number of imputed variants after filtering was 5,445,841.
Power calculation for GWAS analyses
GWAS power calculation was performed using the online Genetic Association Study (GAS) Power Calculator (http://csg.sph.umich.edu/abecasis/gas_power_calculator/). In order to reach 80% power at a GWAS-significance level (alpha = 5E-08) with a disease prevalence in the general Swedish population of 0.2%, an allele frequency of > 20% and an OR > 1.7 would be needed.
Genome wide association study (GWAS) vs. PD risk and age at diagnosis (AAD)
A GWAS for PD risk was performed in a logistic regression model adjusted for sex, age (at study inclusion), and the first 5 principal components (PCs). The number of PCs used in the analyses was determined by a scree plot (Supplementary Figure 5). A linear regression model was used to investigate the impact of genetic variation on the AAD, adjusted for sex and PC1-5. Data on AAD was available for 792 of the 929 PD patients (85.3%). Summary statistics were generated using RVTESTS (version 2.1.0) [39]. Quantile-quantile (QQ)-plots and Manhattan plots were generated in R, version 4.0.0 [29]. Subsequently, regions of interest were visualized using summary statistics data in the LocalZoom tool (https://my.locuszoom.org) with a flanking size of 100 kb from the gene of interest.
Haplotype analysis of PLPP4
Genotyped variants in the PLPP4 region with a window of ±100 kb (PLPP4 coordinates on GRCh37; chr10 : 122216466-122349376, UCSC) were extracted and annotated using ANNOVAR [40]. Haplotype blocks in the region were estimated in PLINK v1.9 using the default parameters, wherein pairwise LD was calculated for variants within 500 kb [33, 34]. PLINK v1.9 estimates haplotype blocks following the default procedure in Haploview [41, 42]. Association between haplotype blocks in PLPP4 and PD status was analyzed with haplo.stats in R. The regression analyses were adjusted for age, sex, and PC1-5, and additionally for tobacco use. The adjustment for tobacco use was done because of a report of PLPP4 being associated with smoking cessation [43], and multiple reports of smoking being associated with PD. To assimilate the effect of other nicotine products, such as snus (moist tobacco, commonly consumed in Sweden), the variable “Tobacco” was used. Only haplotypes with a carrier frequency of > 1% were included in the analysis. A Bonferroni corrected threshold for statistical significance of p = 0.05/16 = 0.003 was set. The results were visualized using Haploview v4.1 [42].
Analysis of the joint effect of variants in PLPP4 on PD risk
The contribution of rare variants on PD risk was examined by the joint effect of multiple variants in the PLPP4 region. We separately analyzed genotyped and imputed variants with an imputation quality score of Rsq > 0.8 for imputed variants. The sequence kernel association test (SKAT) was used since only 2.6% of the variants in PLPP4 are coding variants and the SKAT is powerful when a large fraction of variants in a region are noncoding. The test aggregates associations between variants and phenotype and allows for variant interactions [44]. The analyses were performed in RVTESTS (version 2.1.0) [39] using default parameters and adjusting for age, sex and PC1-5. The test was performed both for all available variants as well as in only coding variants with two different maximum MAF thresholds of < 1% and < 5%. To adjust for multiple comparisons, Bonferroni corrected p-value thresholds were applied for all analyses.
Risk profile analysis
A risk profile analysis for PD and AAD was performed using the imputed data passing QC. A cumulative genetic risk score (GRS) was calculated in PLINK v1.9 using publicly available effect estimates (beta coefficients) of 90 SNPs associated with PD in the largest published meta-analysis of PD GWAS to date [12]. For each SNPs, the allele dosage was multiplied by the beta coefficient, giving a greater weight to alleles with higher risk estimates. Risk allele dosage was then summed across all variants to generate a GRS for each study participant. Subsequently, the GRSs were standardized to Z-scores using the control group as the reference group for PD status and the patient group for the AAD analysis. Following standardization, a Z score of 1 can be interpreted to be equivalent to one SD increase in the GRS from the reference group GRS mean. The study participants were divided into quartiles based on their GRS, and logistic regression analysis was performed to investigate associations and estimate the OR between PD status and quartile group. Covariates were selected from a previously published PD classification [45] and included PD family history (yes/no), age at inclusion, sex, and additionally PC1-5. For the risk profile analysis for AAD, a linear regression model was used, adjusted for sex, PD family history, and PC1-5. Plots were generated in R, version 4.0.0 [29].
Code for all analyses is available at https://github.com/KajBro/MPBC, GWAS summary statistics is available online (https://drive.google.com/file/d/1Rq7AGPFnERlsy1qPZylQEVmYc6OvMwQj/view?usp=sharing).
RESULTS
Characteristics of the MPBC cohort
Demographics and characteristics of the MPBC cohort are summarized in Table 1. An expected male predominance was observed with a sex ratio of 2 : 1. Case-control matching was successful for year of birth and sex, with average birth year 1944 and 36% women in both groups. A one-year difference for the average age at inclusion was observed between patients (71 years) and controls (72 years) due to control matching occurring after patient inclusion. Swedish ancestry (defined as self-reporting that both parents were born in Sweden) was similar in patients and controls (87.9% vs. 86.1%). Similar distributions for highest completed education and marital status were also seen. According to self-reported information on health status using the EQ-5D-3L instrument [30], patients had an index of 0.8 on the TTO scale compared to 0.9 for the controls. The patients also rated their own overall health lower than the controls on the VAS index scale (index 68.9±16.8 vs. 82.0±9.7, Table 1). As a reference, the general Swedish population has an estimated mean TTO index of 0.9 and a VAS index of 79.5 [30]. As expected, all self-reported symptoms were more common in the patient group than the control group (Supplementary Table 1). The most common self-reported motor-symptoms were muscle stiffness (72.7%) followed by slowness of movements (72.4%). The most commonly reported non-motor symptom for both patients and controls was nocturia (71.6% vs. 58.4%).
Table 1
Characteristics of participants (individuals with Parkinson’s disease (PD) and individuals without the disease [controls]) in the MPBC cohort
| Patients (N = 929) | Controls (N = 935) | |
| Sex | ||
| n | 929 | 935 |
| Men | 599 (64.5%) | 598 (64.0%) |
| Women | 330 (35.5%) | 337 (36.0%) |
| Birth year | ||
| n | 929 | 935 |
| Mean (SD) | 1944.4 (8.4) | 1944.4 (8.3) |
| Range | 1920.0–1979.0 | 1920.0–1980.0 |
| Age at inclusion | ||
| n | 929 | 935 |
| Mean (SD) | 71.0 (8.3) | 72.3 (8.3) |
| Range | 37.0–96.0 | 38.0–97.0 |
| Swedish ancestry | ||
| n | 922 | 921 |
| No | 112 (12.1%) | 128 (13.9%) |
| Yes | 810 (87.9%) | 793 (86.1%) |
| Highest completed education | ||
| n | 923 | 929 |
| < Primary and lower secondary education | 8 (0.9%) | 4 (0.4%) |
| Primary and lower secondary education | 241 (26.1%) | 232 (25.0%) |
| Upper secondary education | 403 (43.7%) | 384 (41.3%) |
| University | 271 (29.4%) | 309 (33.3%) |
| BMI at inclusion (kg/m2) | ||
| n | 914 | 921 |
| Mean (SD) | 25.8 (4.4) | 26.0 (3.9) |
| Range | 15.2–48.8 | 15.9–42.3 |
| Marital status | ||
| n | 925 | 931 |
| Single | 57 (6.2%) | 62 (6.7%) |
| Married/Civil partnership | 719 (77.7%) | 713 (76.6%) |
| Divorced/Separated | 71 (7.7%) | 60 (6.4%) |
| Widow/Widower | 78 (8.4%) | 96 (10.3%) |
| TTO Index | ||
| n | 898 | 903 |
| Mean (SD) | 0.8 (0.1) | 0.9 (0.1) |
| Range | 0.4–1.0 | 0.5–1.0 |
| VAS Index | ||
| n | 898 | 903 |
| Mean (SD) | 68.9 (16.8) | 82.0 (9.7) |
| Range | 17.2–88.9 | 20.9–88.9 |
Swedish ancestry, Both parents were born in Sweden; BMI, Body Mass Index; TTO, Time Trade Of, EQ-5D-3L; VAS, Visual Analogue Scale, EQ-5D-3L.
We further evaluated the health status and AAD among male and female PD patients (Table 2). Median AAD was identical for both sexes (67.0 years), although with a wide range (men 29.0–84.0 years, women 35.0–89.0 years). The median time since diagnosis at inclusion was 4.0 years for both sexes and varied from diagnosis the same year to 36.0 years for men and 33.0 years for women. Health status at the time of inclusion was evaluated using the H&Y scale, CISI-PD, and PDQ-8. Both sexes had a median of 2.0 on the H&Y, corresponding to bilateral involvement without impairment of balance. Similar total score values were reported by men and women on the CISI-PD scale (median 5.0, range 0–24). Women had a slightly higher median PDQ-8 total score compared to men (7.0 vs. 6.0 out of 32).
Table 2
Characteristics of individuals with Parkinson’s disease in the MPBC cohort
| Men (N = 599) | Women (N = 330) | |
| Age at diagnosis | ||
| n | 503 | 289 |
| Median (Q1, Q3) | 67.0 (60.0, 72.0) | 67.0 (59.0, 73.0) |
| Range | 29.0–84.0 | 35.0–89.0 |
| Disease length at inclusion | ||
| n | 503 | 289 |
| Median (Q1, Q3) | 4.0 (1.5, 8.0) | 4.0 (2.0, 7.0) |
| Range | 0.0–36.0 | 0.0–33.0 |
| Hoehn &Yahr | ||
| n | 514 | 295 |
| Median (Q1, Q3) | 2.0 (1.5, 3.0) | 2.0 (1.5, 3.0) |
| Range | 0.0-5.0 | 0.0-5.0 |
| CISI-PD | ||
| n | 518 | 301 |
| Median (Q1, Q3) | 5.0 (3.0, 8.0) | 5.0 (2.0, 7.0) |
| Range | 0.0–21.0 | 0.0–20.0 |
| PDQ-8 | ||
| n | 518 | 299 |
| Median (Q1, Q3) | 6.0 (2.0, 10.0) | 7.0 (3.0, 11.0) |
| Range | 0.0–25.0 | 0.0–21.0 |
Data retrieved from the Swedish Parkinson Registry. CISI-PD, Clinical Impression of Severity Index – Parkinson’s Disease, summary score; PDQ-8, Parkinson’s Disease Questionnaire – 8, summary score.
Epidemiological characteristics of PD in Sweden
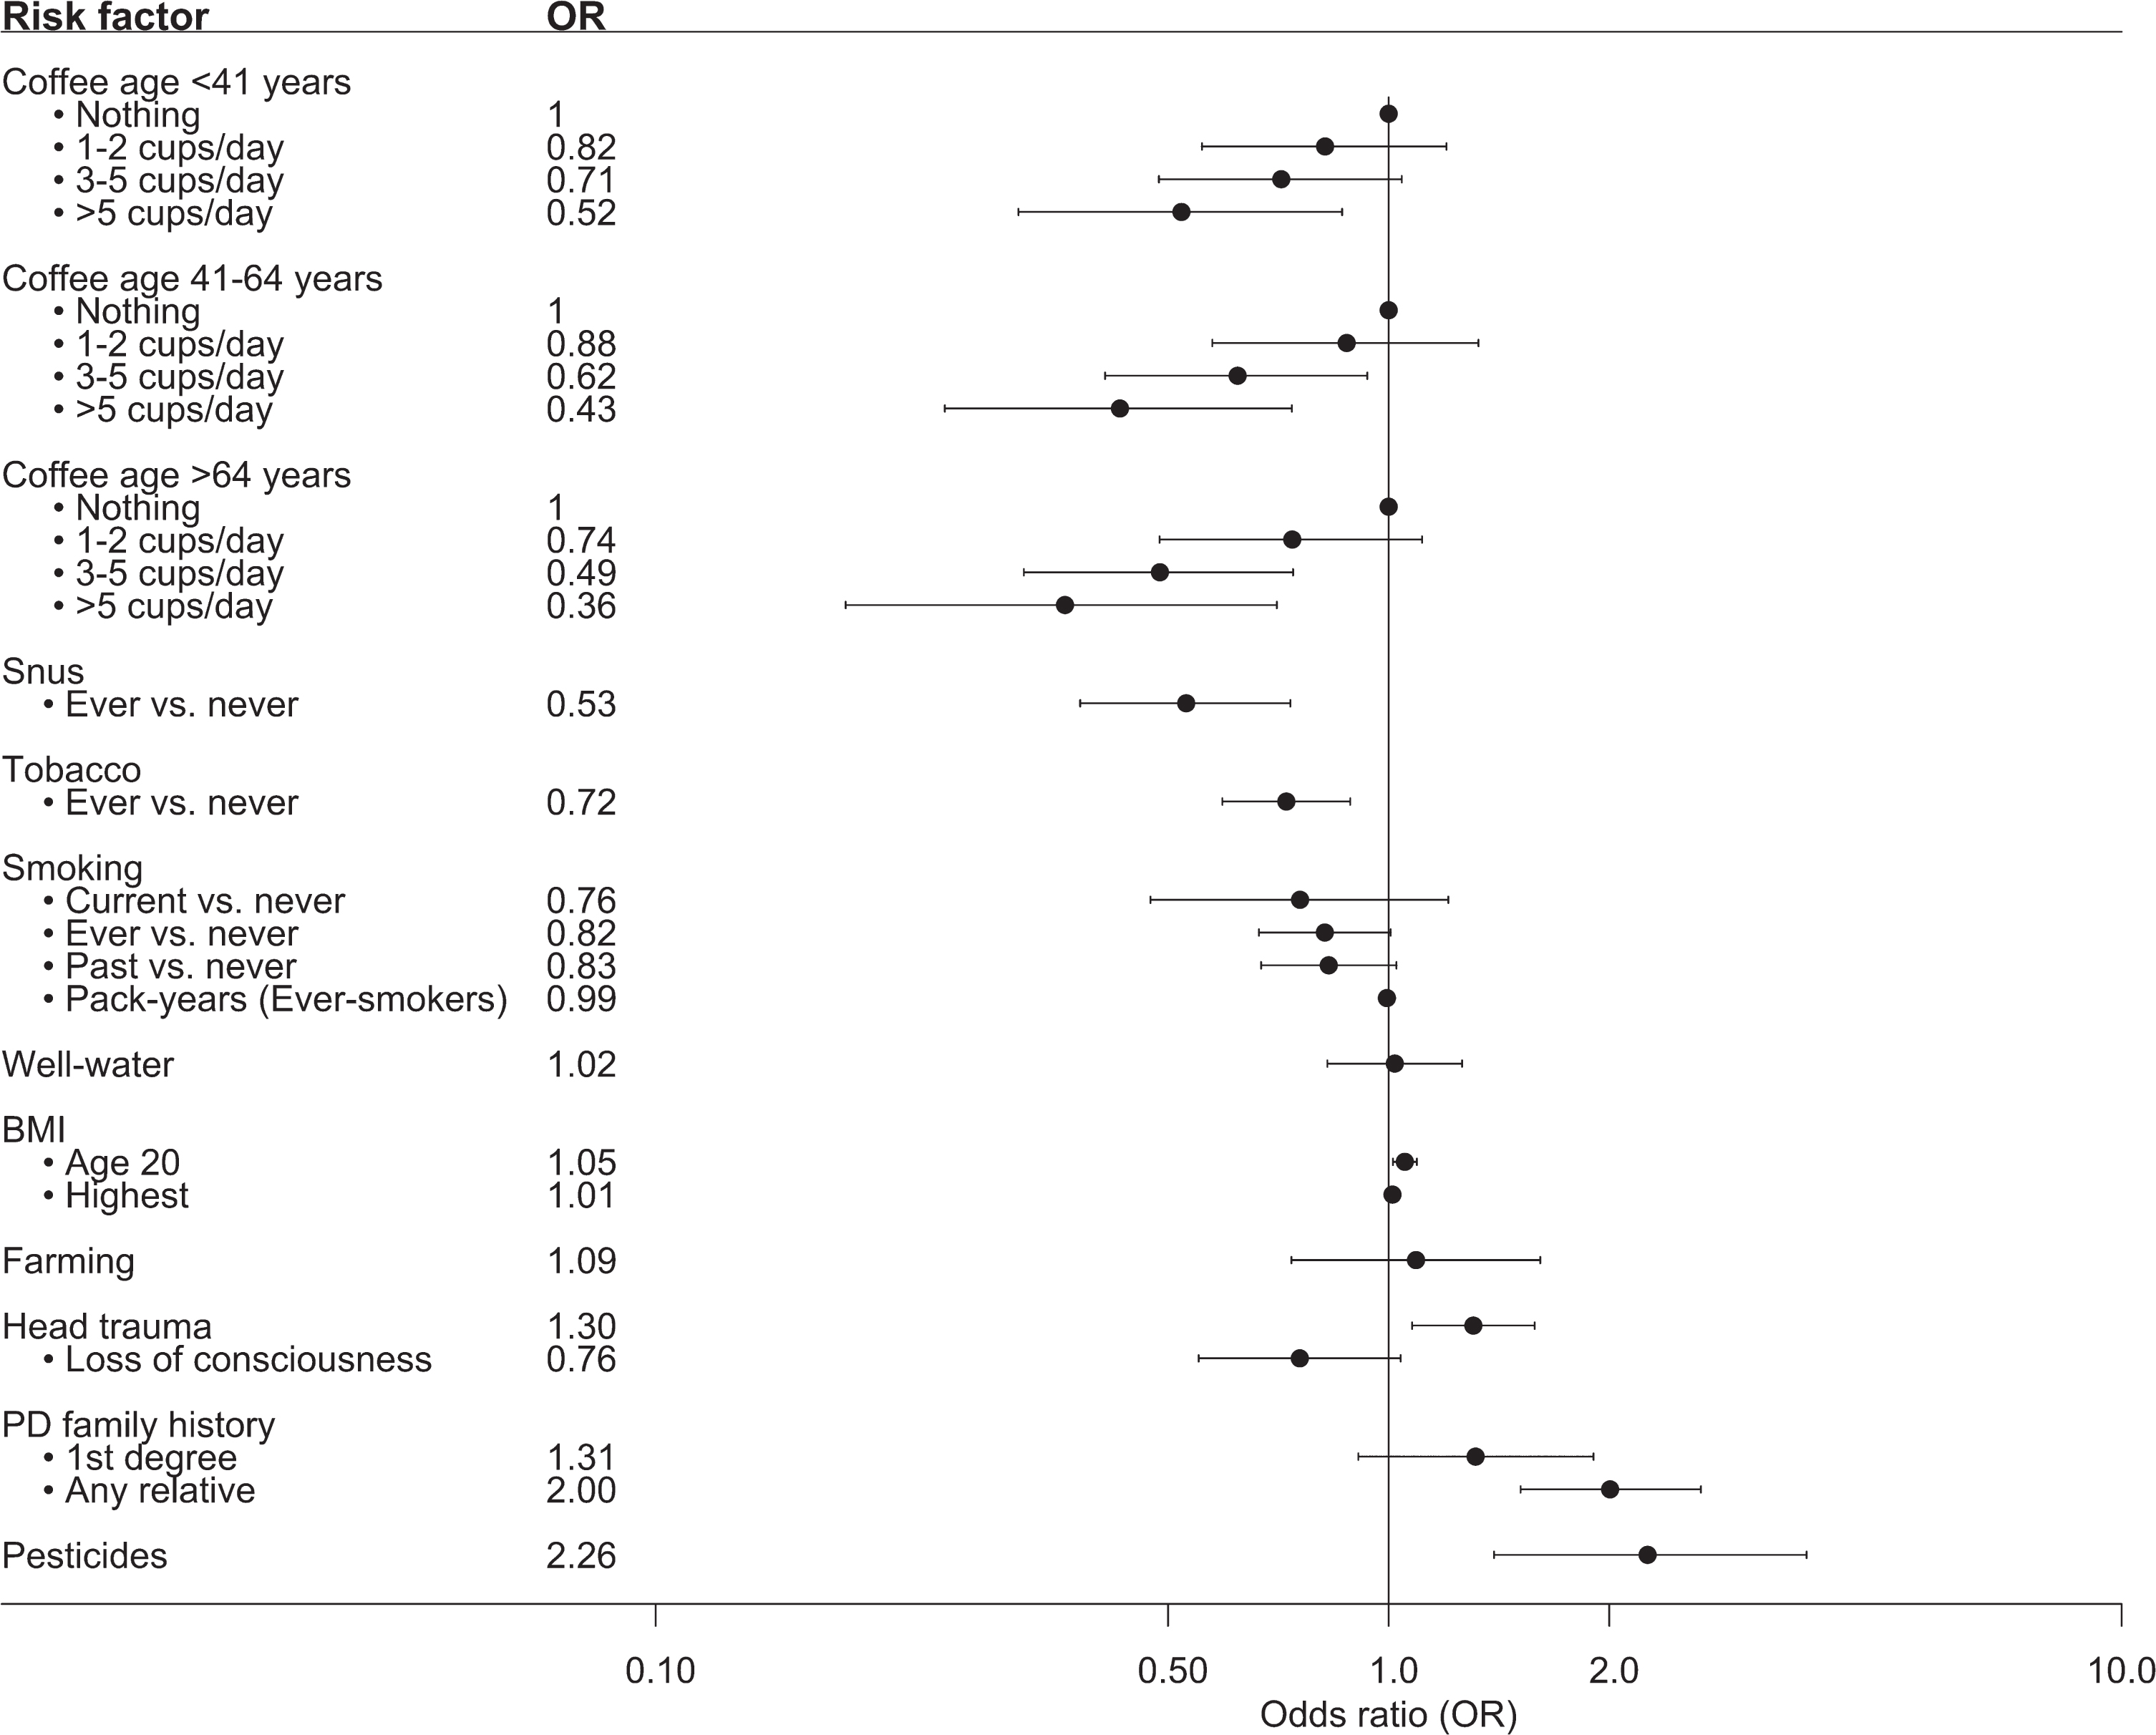
We further set out to evaluate previously confirmed risk factors for PD in a regional, Swedish context (Fig. 1, Supplementary Table 2). A positive family history (at least one relative diagnosed with PD) was overrepresented among PD patients compared to controls (20% vs. 11%). Consequently, having a relative diagnosed with PD doubled the risk of having PD (OR = 2.00, 95% CI 1.51–2.67). An association between pesticide exposure and PD was confirmed at an OR of 2.26 (95% CI 1.39–3.72). A significant association was also seen between PD and a history of head trauma (OR = 1.30, 95% CI 1.08–1.58). However, no association between loss of consciousness and PD was observed among study participants who reported a history of head trauma. A slightly higher OR was seen for a higher BMI at the age of 20 years (1.05, 95% CI 1.01–1.09), indicating that a one unit increase in BMI increased the risk of having PD by 5%. However, no difference was observed for the highest reported BMI. We observed an inverse association between having ever smoked and PD, but the association was not statistically significant after adjustment for confounders (ever- vs. never-smoking OR = 0.82, 95% CI 0.67–1.01). A statistically significant inverse association between snus and PD was observed also after adjusting for confounders (OR = 0.53, 95% CI 0.38–0.73). An inverse association was also observed for the combined effect of tobacco products on PD (adjusted OR = 0.72, 95% CI 0.59–0.88). Moreover, a trend of lower OR for PD with increasing amount of coffee drinking at all investigated age groups was observed, where drinking > 5 cups of coffee per day was inversely associated with PD (OR 0.36–0.52, 95% CI 0.18–0.86).
Fig. 1
Forest plot over the associations between risk factors and PD in MPBC. Showing the adjusted OR and 95% CI. Number of individuals in each analysis is found in Supplementary Table 1.
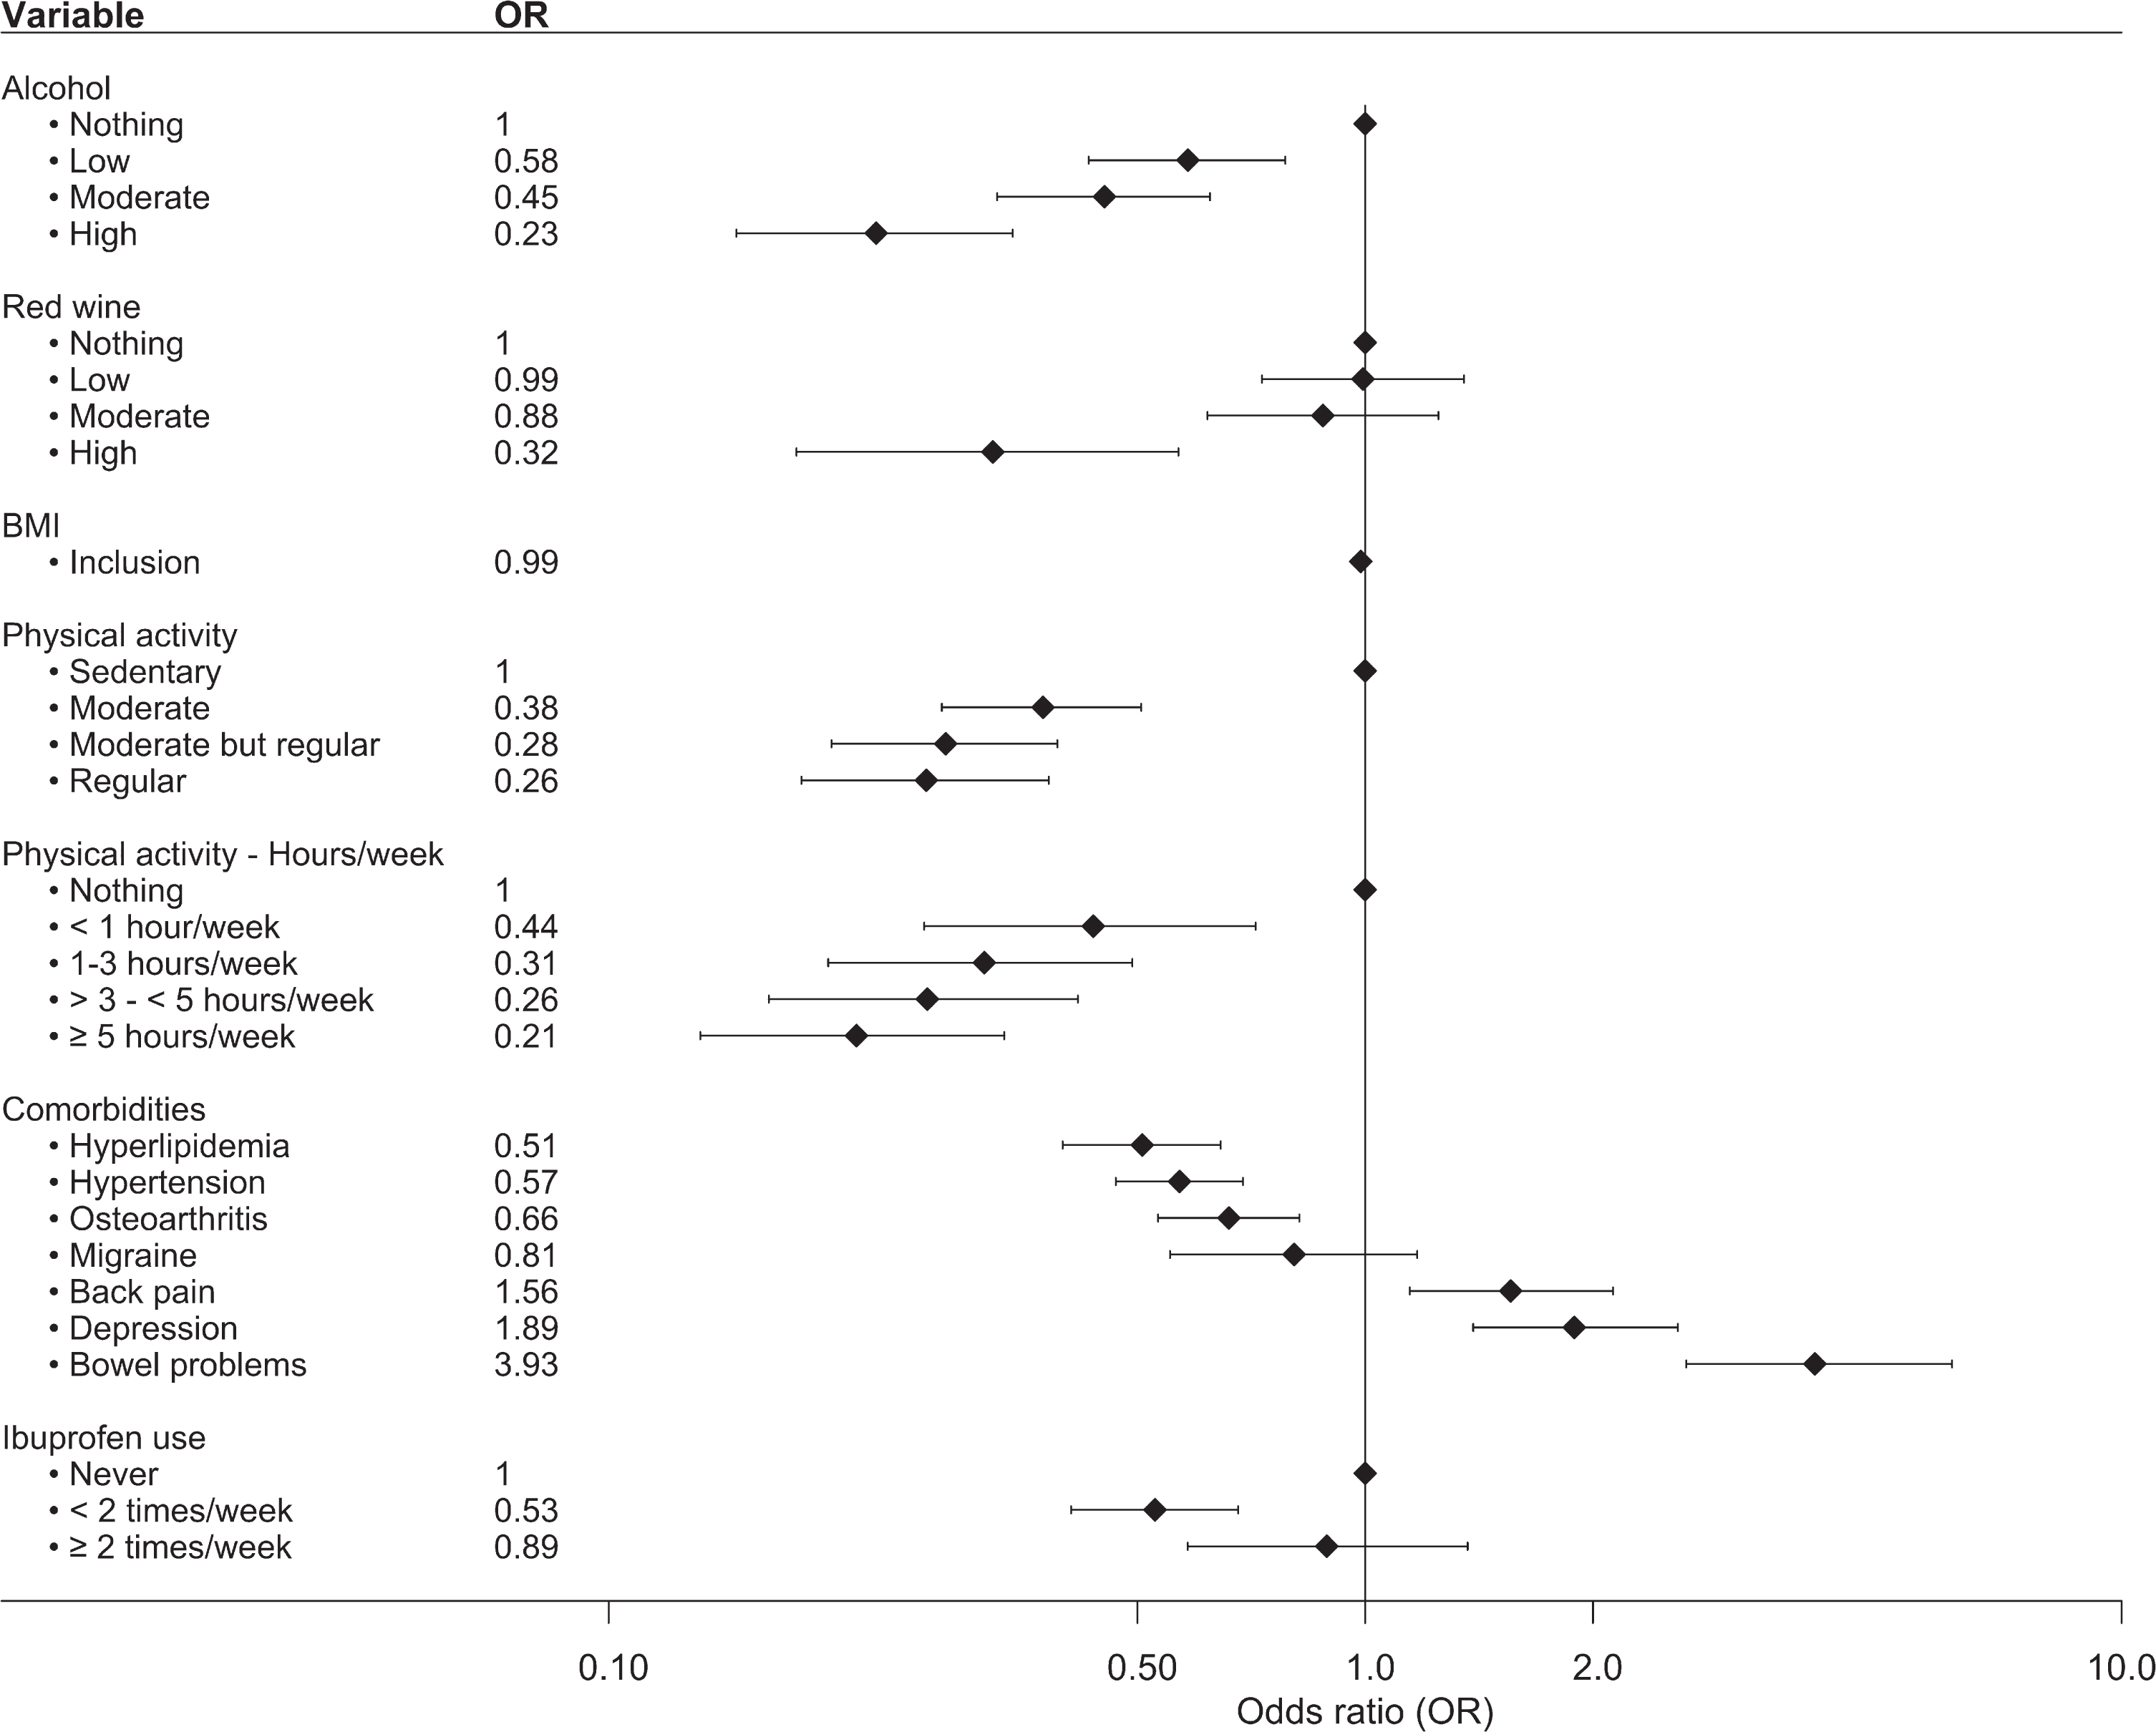
Additionally, variables related to exposure/use within the past year were examined to describe potential differences between the age- and sex-matched groups at inclusion (Fig. 2, Supplementary Table 3). The patients consumed less alcohol and engaged in less physical activity both in regard to level of physical activity (regular activity level vs. nothing OR = 0.26, 95% CI 0.18–0.38) and hours per week (≥5 hours/week vs. nothing, OR = 0.21, 95% CI 0.13–0.33). No significant association between PD and BMI at inclusion was observed (OR = 0.99, 95% CI 0.96–1.00). For comorbidities, statistically significant inverse associations between PD and a diagnosis of hyperlipidemia (OR = 0.51, 95% CI 0.40–0.64), hypertension (OR = 0.57, 95% CI 0.47-0.69), and osteoarthritis (OR = 0.66, 95% CI 0.53–0.82) were seen. A significant association with PD was observed for a diagnosis of depression (OR = 1.89, 95% CI 1.39–2.59), back pain (OR = 1.56, 95% CI 1.15–2.13), and bowel problems, where bowel problems (defined as having constipation or diarrhea that required treatment on a regular basis) almost quadrupled the likelihood of having PD (OR = 3.93, 95% CI 2.66–5.97). We observed an OR of 0.53 (95% CI 0.41–0.68) for the use of ibuprofen < 2 times/week compared to never. However, the association was lost for ibuprofen use ≥2 times/week. No associations were observed for the use of other nonsteroidal anti-inflammatory drugs (NSAIDs), such as diclofenac or naproxen (data not shown).
Fig. 2
Forest plot over the associations between various variables and PD. Analyzed variables were obtained from questions regarding exposure/use within the past year prior to study inclusion. The plot shows OR and 95% CI adjusted by age at inclusion and sex. Number of individuals in each analysis is found in Supplementary Table 2.
GWAS of PD risk nominated a novel genome-wide significant variant in the PLPP4 locus
The variant rs356182 in SNCA was reported in the latest GWAS meta-analysis as one of the 90 risk loci associated with PD in a cohort of European ancestry [12]. In our GWA analysis for PD risk, this and another three variants in the SNCA locus were observed at low p-values(rs356182, beta = –0.38, SE = 0.07, p = 5.64E-08; rs356203, beta = –0.36, SE = 0.07, p = 1.27E-07; rs356220, beta = 0.36, SE = 0.07, p = 1.39E-07; rs356219, beta = –0.36, SE = 0.07, p = 2.32E-07), but none reached genome-wide significance (Fig. 3, Table 3, Supplementary Figure 7). In addition to the SNCA variants, we found associations for 23 of the 90 previously reported PD risk loci in this Swedish cohort at an uncorrected p-value of 0.05 (Supplementary Table 4). Results from PCA showing the population structure, as compared to the HapMap3 reference populations, revealed that this Swedish cohort clusters near the other European population, but the centers of the clusters differ slightly, indicating differences in population structures that could result in population-specific risk alleles (Supplementary Figure 6). The GWA analysis also revealed a novel genome-wide significant association signal in the PLPP4 locus, rs12771445 (10 : 122318147, beta = –0.44, SE = 0.07, p = 1.30E-08), as being associated with PD in this Swedish cohort (Fig. 3, Table 3). No association for this variant has been seen previously with PD (Table 3) [12]. The significant variant was an intron variant in the gene Phospholipid Phosphatase 4 (PLPP4) and was imputed with Rsq = 0.99 and MAF = 0.31 (Supplementary Table 4). The MAF is similar to the value observed in the Swedish reference population, SweGen, of 0.32 [26]. The estimated MAF was 0.27 in the patient group and 0.36 in the control group, indicating a potential protective effect of the minor allele (T) with an OR of 0.64. To further display the association signals relative to genomic position and local LD, locus zoom plots for PLPP4 rs12771445 and SNCA rs356182 were produced (Fig. 4 and Supplementary Figure 8). Variants in SNCA have been reported to also be associated with PD AAO [46]. We performed a GWA for the related variable AAD of PD in the cohort. However, we did not detect any genome-wide statistically significant associations and could not replicate previously reported variants associated with PD AAO at low p-values, likely due to smaller sample size (792 vs. 28,568) [46] and limited statistical power (Supplementary Figures 9 and 10).
Fig. 3
Manhattan plot showing the result from PD GWA analysis. A total of 5,445,841 SNPs (MAF > 5%) were tested for 929 PD patients vs. 935 controls. The y-axis represents the negative log (two-sided p-values) for association of variants with PD and the x-axis represent the genomic position on genome build GRCh37. The horizontal dashed line indicates the genome-wide significance level (p = 5E-08).
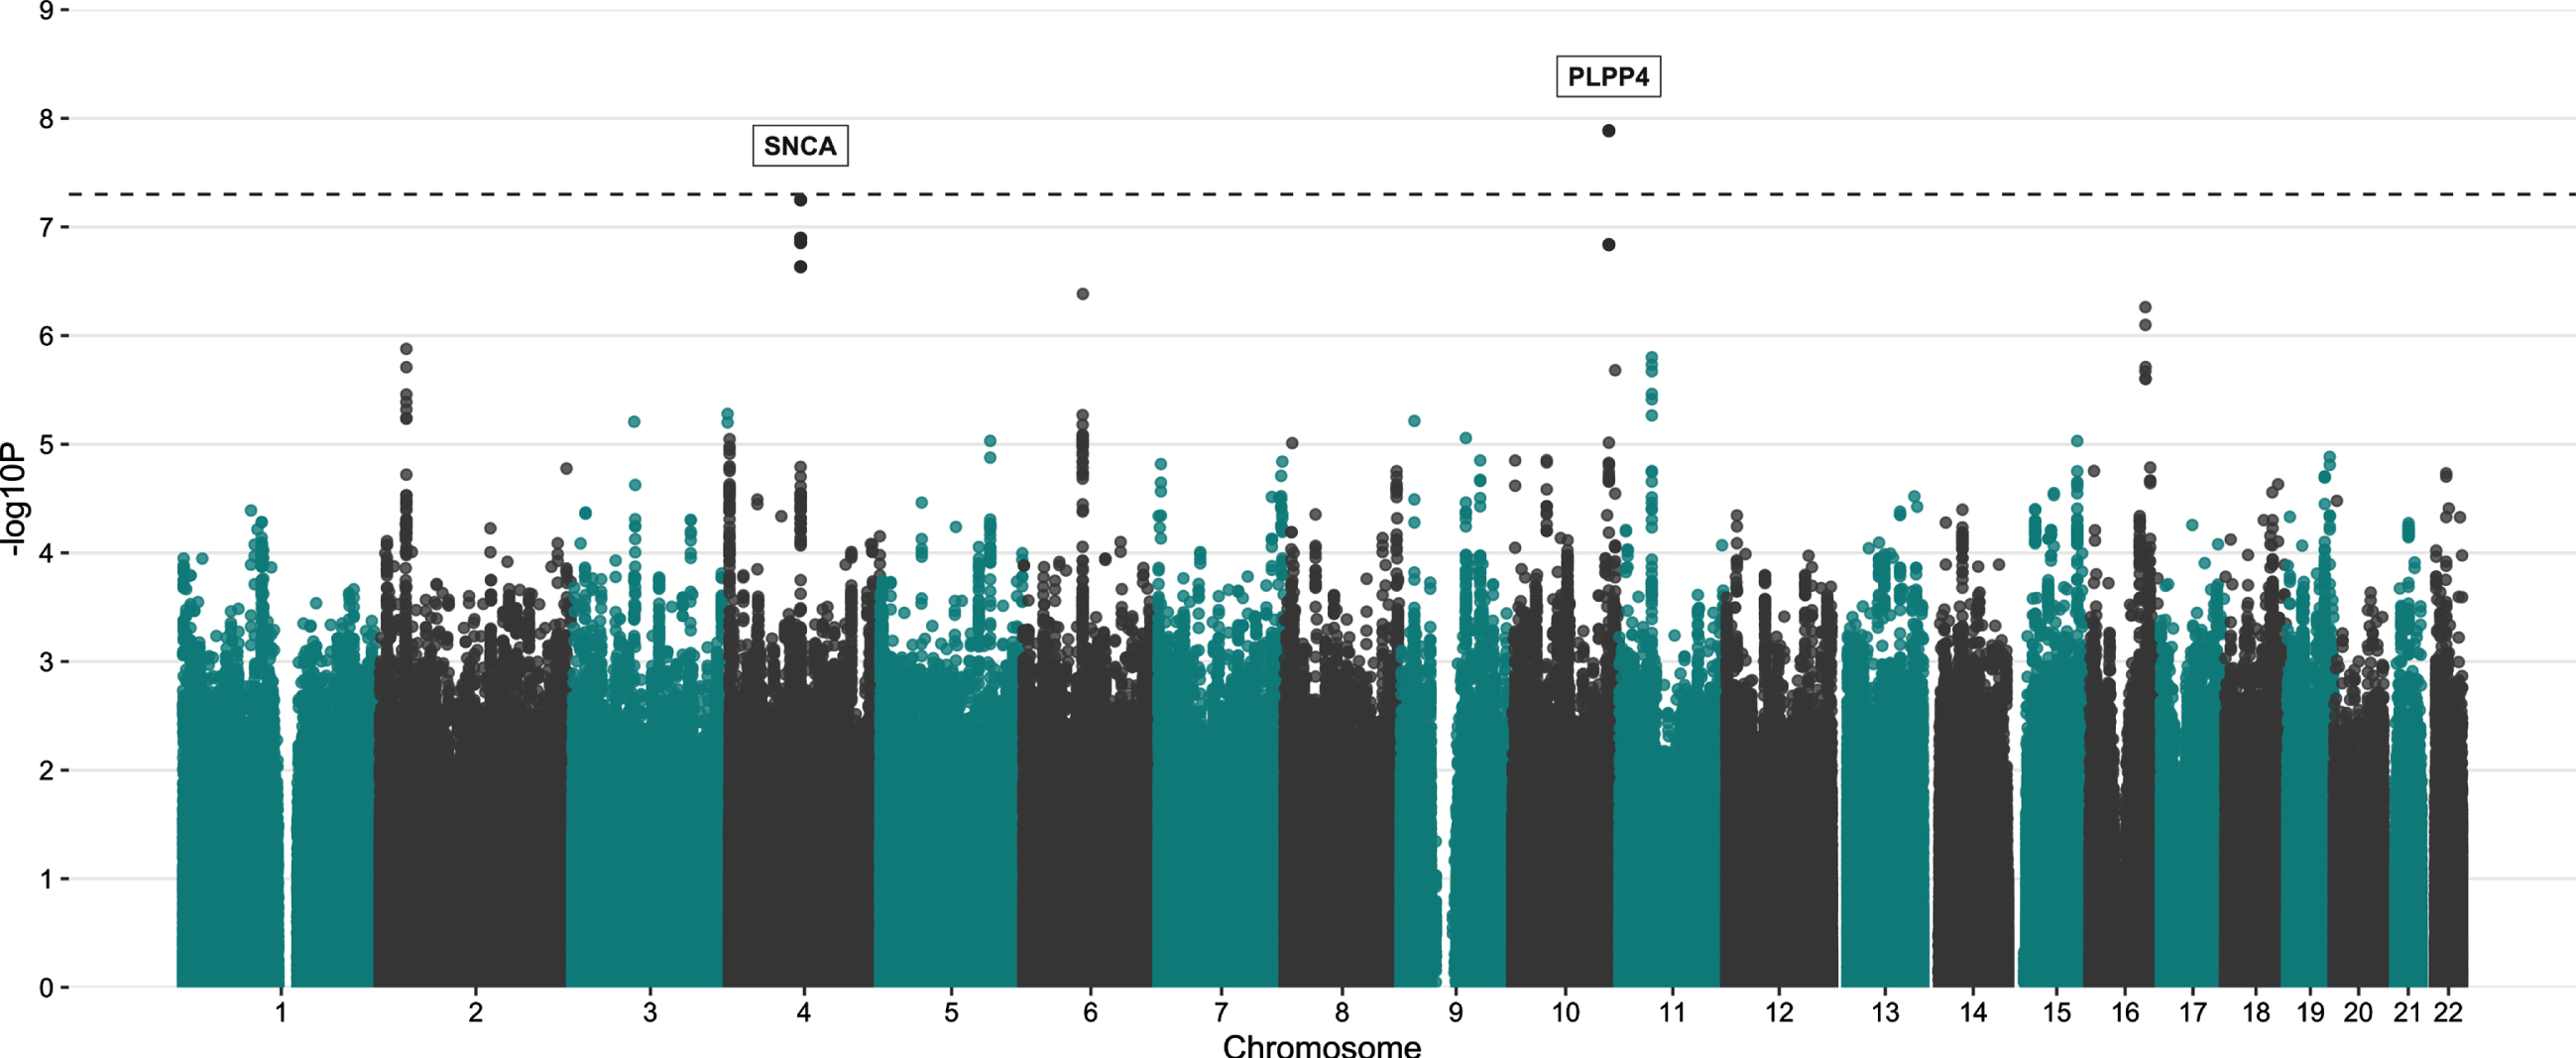
Table 3
Top loci and variants associated with PD in MPBC from GWA analysis. Table showing the results from GWA analysis in MPBC along with information from summary statistics on the variants retrieved from the latest GWAS meta-analysis of individuals with European ancestry
| Nearest gene(s) | Top SNP | CHR | POS | Effect allele | Alt. allele | EAF | MAF | Genotyped | Rsq | Beta | OR | SE | p | EAFa | MAFa | Betaa | OR | SEa | pa |
| PLPP4 | rs12771445 | 10 | 122318147 | T | C | 0.314 | 0.314 | Imputed | 0.986 | –0.411 | 0.663 | 0.072 | 1.30E-08 | 0.324 | 0.324 | 0.015 | 1.015 | 0.021 | 4.88E-01 |
| SNCA | rs356182 | 4 | 90626111 | A | G | 0.617 | 0.383 | Genotyped | 0.997 | –0.377 | 0.686 | 0.069 | 5.64E-08 | 0.616 | 0.384 | –0.255 | 0.775 | 0.021 | 9.41E-34 |
| COL12A1/ | rs7752646 | 6 | 75447088 | T | G | 0.873 | 0.127 | Imputed | 0.958 | –0.715 | 0.489 | 0.106 | 4.13E-07 | 0.862 | 0.139 | –0.060 | 0.942 | 0.033 | 6.62E-02 |
| LOC105377858 |
aNalls 2019 without 23andMe data [12]. SNCA rs356182 can also be found in Supplementary Table 4. EAF, effect allele frequency; MAF, minor allele frequency; OR, odds ratio; CHR, chromosome; POS, position; SE, standard error.
In order to analyze more genetic variants, im-putation was done using the beta-version of the TOP-Med Imputation Reference panel [47]. Using the same post-imputation QC, 6,214,098 variants were generated and analyzed in a GWAS for PD risk (Supplementary Figures 11 and 12). Two variants passed genome-wide significance, rs12772937 (chr10 : 122318146, beta = –0.40, SE = 0.07, p = 2.48E-08) and our previously identified rs12771445 (10 : 122318147, beta = –0.40, SE = 0.07, p = 2.48E-08). Since the TOPMed panel was still in the beta stage as of our analysis, we continued using the data imputed with the HRC version r1.1 2016 panel.
Haplotype analysis of PLPP4
Because of the identification of the novel genome-wide signal (rs12771445) associated with PD in this cohort, we further looked at haplotypes among the genotyped variants in the nearest gene, PLPP4 (±100 kb), to capture the genetic variance in the region. We identified 92 genotyped variants passing QC in the region, where 32 were in PLPP4, all intron variants. The median GenCall scores of these variants was 0.87 (IQR: 0.83–0.91) (Supplementary Figure 13). A total of 45 different haplotypes in 12 different blocks (H1-H12) in the region were identified (Table 4, Supplementary Figure 14). A statistically significant association with PD was observed for a haplotype in one block (H6) (p = 2.45E-05), both before and after adjustment. The haplotype block spanned over 41.9 kB (chr10 : 122302038-122343950) and consisted of five genetic variants and six different haplotypes. The rs978854(G)-rs7910507(G)-rs10886711(G)-rs11199417(G)-rs10886717(A) haplotype was sta-tistically significantly inversely associated with PD at an OR of 0.69 (95% CI 0.59–0.82, p = 2.54E-05) and with a MAF = 0.24 for patients and 0.30 for controls.
Table 4
Identified haplotypes in the PLPP4 locus
| Locus | SNPs (n) | KB | SNPs | Haplotype | MAF Pat. | MAF Ctrls | ORa | 95% CIa | P-valuea | ORb | 95% CIb | P-valueb | ORc | 95% CI | P-valuec |
| H1 | 8 | 41.3 | rs2420703, rs71484626, rs2420706, rs2420707, rs2901235, rs12571802, rs2901237, rs17100130 | GACGGGGG | 0.90 | 0.91 | 1.00 | 1 | 3.00E-01 | 1.00 | 1 | 3.20E-01 | 1.00 | 1 | 3.00E-01 |
| AGAAAAAA | 0.01 | 0.01 | 1.19 | 0.92–1.54 | 1.73E-01 | 1.19 | 0.92–1.54 | 8.20E-01 | 1.20 | 0.92–1.55 | 1.70E-01 | ||||
| GGCGAGGG | 0.08 | 0.07 | 1.09 | 0.60–1.97 | 8.10E-01 | 1.08 | 0.59–1.97 | 1.80E-01 | 1.07 | 0.58–1.94 | 8.60E-01 | ||||
| H2 | 2 | 10.8 | rs7068076, rs36108282 | GG | 0.75 | 0.76 | 1.00 | 1 | 3.28E-01 | 1.00 | 1 | 3.16E-01 | 1.00 | 1 | 4.39E-01 |
| AA | 0.07 | 0.05 | 1.56 | 1.17–2.06 | 1.48E-03 | 1.54 | 1.16–2.04 | 2.31E-03 | 1.48 | 1.11–1.97 | 5.57E-03 | ||||
| AG | 0.18 | 0.19 | 0.97 | 0.82–1.14 | 4.15E-01 | 0.97 | 0.82–1.15 | 4.74E-01 | 0.96 | 0.81–1.14 | 4.23E-01 | ||||
| H3 | 3 | 7.15 | rs4595466, rs2244544, rs77772193 | GAG | 0.45 | 0.45 | 1.00 | 1 | 9.07E-01 | 1.00 | 1 | 9.93E-01 | 1.00 | 1 | 8.53E-01 |
| GGG | 0.13 | 0.09 | 1.34 | 1.08–1.65 | 1.30E-03 | 1.33 | 1.07–1.65 | 1.36E-03 | 1.31 | 1.06–1.63 | 1.99E-03 | ||||
| GGA | 0.08 | 0.07 | 1.19 | 0.92–1.53 | 1.56E-01 | 1.17 | 0.91–1.51 | 1.83E-01 | 1.14 | 0.89–1.48 | 2.38E-01 | ||||
| AGG | 0.34 | 0.39 | 0.88 | 0.76–1.02 | 4.12E-03 | 0.88 | 0.76–1.01 | 3.30E-03 | 0.87 | 0.75–1.01 | 3.10E-03 | ||||
| H4 | 2 | 5.47 | rs60288721, rs1536389 | CA | 0.49 | 0.51 | 1.00 | 1 | 2.35E-01 | 1.00 | 1 | 2.71E-01 | 1.00 | 1 | 3.12E-01 |
| CG | 0.43 | 0.42 | 1.08 | 0.95–1.24 | 2.83E-01 | 1.07 | 0.94–1.23 | 3.44E-01 | 1.07 | 0.94–1.22 | 3.65E-01 | ||||
| AA | 0.08 | 0.07 | 1.07 | 0.83–1.38 | 8.08E-01 | 1.08 | 0.83–1.39 | 7.49E-01 | 1.06 | 0.82–1.37 | 8.24E-01 | ||||
| H5 | 2 | 5.91 | rs11199378, rs12768425 | CA | 0.48 | 0.49 | 1.00 | 1 | 4.72E-01 | 1.00 | 1 | 5.06E-01 | 1.00 | 1 | 5.46E-01 |
| AC | 0.49 | 0.48 | 1.06 | 0.93–1.06 | 3.82E-01 | 1.05 | 0.92–1.20 | 4.33E-01 | 1.04 | 0.92–1.19 | 5.04E-01 | ||||
| AA | 0.01 | 0.01 | 1.21 | 0.63–2.32 | 6.15E-01 | 1.19 | 0.61–2.30 | 6.51E-01 | 1.26 | 0.65–2.45 | 5.28E-01 | ||||
| CC | 0.02 | 0.02 | 0.81 | 0.50–1.32 | 3.34E-01 | 0.84 | 0.51–1.39 | 4.30E-01 | 0.86 | 0.52–1.41 | 4.75E-01 | ||||
| H6 | 5 | 41.9 | rs978854, rs7910507, rs10886711, rs11199417, rs10886717 | GGAGA | 0.41 | 0.36 | 1.00 | 1 | 2.03E-03 | 1.00 | 1 | 1.59E-03 | 1.00 | 1 | 1.59E-03 |
| GAGGA | 0.04 | 0.03 | 1.17 | 0.82–1.68 | 1.03E-01 | 1.19 | 0.83–1.70 | 8.96E-02 | 1.15 | 0.80–1.65 | 1.29E-01 | ||||
| AGGAA | 0.21 | 0.19 | 0.97 | 0.81–1.16 | 1.16E-01 | 0.98 | 0.82–1.17 | 9.48E-02 | 0.97 | 0.81–1.16 | 1.08E-01 | ||||
| GAGGG | 0.05 | 0.05 | 0.91 | 0.67–1.24 | 8.35E-01 | 0.90 | 0.66–1.24 | 8.67E-01 | 0.91 | 0.66–1.25 | 8.08E-01 | ||||
| GGGGA | 0.24 | 0.30 | 0.70 | 0.60–0.83 | 4.67E-05 | 0.70 | 0.59–0.82 | 3.28E-05 | 0.69 | 0.59–0.82 | 2.54E-05 | ||||
| AGGGA | 0.05 | 0.06 | 0.59 | 0.44–0.81 | 7.14E-03 | 0.59 | 0.43–0.81 | 7.29E-03 | 0.97 | 0.81–1.16 | 8.92E-03 | ||||
| H7 | 3 | 2.75 | rs75318356, rs7912073, rs11199429 | GGG | 0.44 | 0.41 | 1.00 | 1 | 6.06E-02 | 1.00 | 1 | 9.14E-02 | 1.00 | 1 | 7.22E-02 |
| GGA | 0.40 | 0.40 | 0.93 | 0.81–1.07 | 9.55E-01 | 0.94 | 0.82–1.09 | 8.91E-01 | 0.93 | 0.81–1.08 | 9.83E-01 | ||||
| AAA | 0.12 | 0.12 | 0.87 | 0.70–1.07 | 3.95E-01 | 0.88 | 0.71–1.10 | 4.86E-01 | 0.87 | 0.70–1.08 | 4.20E-01 | ||||
| GAA | 0.04 | 0.07 | 0.63 | 0.47–0.85 | 4.83E-03 | 0.63 | 0.46–0.85 | 5.00E-03 | 0.64 | 0.47–0.87 | 7.71E-03 | ||||
| H8 | 2 | 0.417 | rs9943454, rs41287958 | GG | 0.66 | 0.68 | 1.00 | 1 | 1.85E-01 | 1.00 | 1 | 2.16E-01 | 1.00 | 1 | 2.09E-01 |
| AG | 0.26 | 0.25 | 1.07 | 0.92–1.24 | 5.11E-01 | 1.07 | 0.92–1.24 | 5.14E-01 | 1.07 | 0.92–1.25 | 4.71E-01 | ||||
| GA | 0.08 | 0.07 | 1.21 | 0.93–1.56 | 1.95E-01 | 1.18 | 0.91–1.53 | 2.54E-01 | 1.17 | 0.90–1.52 | 2.91E-01 | ||||
| H9 | 2 | 6.03 | rs2420779, rs12415215 | AG | 0.52 | 0.51 | 1.00 | 1 | 5.01E-01 | 1.00 | 1 | 5.12E-01 | 1.00 | 1 | 5.39E-01 |
| CG | 0.43 | 0.44 | 0.96 | 0.84–1.10 | 6.20E-01 | 0.96 | 0.84–1.10 | 6.28E-01 | 0.96 | 0.84–1.10 | 6.18E-01 | ||||
| AA | 0.05 | 0.05 | 0.92 | 0.69–1.24 | 6.90E-01 | 0.93 | 0.69–1.25 | 6.97E-01 | 0.94 | 0.70–1.28 | 7.91E-01 | ||||
| H10 | 3 | 12.0 | rs10886725, rs7068008, rs4752444 | AGA | 0.29 | 0.29 | 1.00 | 1 | 9.01E-01 | 1.00 | 1 | 9.89E-01 | 1.00 | 1 | 9.86E-01 |
| AGG | 0.27 | 0.25 | 1.11 | 0.93–1.41 | 9.20E-02 | 1.11 | 0.93–1.32 | 7.26E-02 | 1.11 | 0.93–1.32 | 6.41E-02 | ||||
| AAG | 0.28 | 0.28 | 1.01 | 0.85–1.20 | 9.95E-01 | 0.99 | 0.84–1.18 | 8.87E-01 | 1.00 | 0.84–1.19 | 9.09E-01 | ||||
| GAG | 0.16 | 0.18 | 0.89 | 0.73–1.08 | 7.51E-02 | 0.87 | 0.72–10.6 | 5.85E-02 | 0.87 | 0.71–1.06 | 4.66E-02 | ||||
| H11 | 3 | 0.87 | rs2420768, rs7914572, rs11594222 | AGG | 0.52 | 0.53 | 1.00 | 1 | 5.42E-01 | 1.00 | 1 | 5.91E-01 | 1.00 | 1 | 6.15E-01 |
| GAG | 0.25 | 0.24 | 1.07 | 0.92–1.26 | 3.07E-01 | 1.08 | 0.92–1.26 | 2.75E-01 | 1.12 | 0.91–1.38 | 2.62E-01 | ||||
| GGG | 0.12 | 0.11 | 1.12 | 0.91–1.38 | 2.72E-01 | 1.11 | 0.90–1.37 | 3.12E-01 | 1.08 | 0.92–1.26 | 2.64E-01 | ||||
| GGA | 0.10 | 0.12 | 0.89 | 0.72–1.09 | 1.21E-01 | 0.88 | 0.71–1.08 | 9.46E-02 | 0.86 | 0.70–1.06 | 6.28E-02 | ||||
| H12 | 3 | 18.8 | rs10458766, rs11199483, rs12570141 | CGA | 0.36 | 0.36 | 1.00 | 1 | 8.97E-01 | 1.00 | 1 | 9.90E-01 | 1.00 | 1 | 9.12E-01 |
| AAA | 0.28 | 0.26 | 1.10 | 0.93–1.30 | 8.82E-02 | 1.08 | 0.92–1.28 | 1.35E-01 | 1.09 | 0.92–1.29 | 1.43E-01 | ||||
| AGA | 0.27 | 0.28 | 0.98 | 0.83–1.15 | 6.53E-01 | 0.98 | 0.83–1.15 | 7.19E-01 | 0.98 | 0.83–1.16 | 6.62E-01 | ||||
| AGG | 0.08 | 0.10 | 0.84 | 0.66–1.07 | 9.04E-02 | 0.83 | 0.66–1.06 | 8.19E-02 | 0.87 | 0.68–1.10 | 1.55E-01 |
Identified haplotypes from genotyped variants in PLPP4±100 kb upstream or downstream. A total of 45 haplotypes were identified in 12 haplotype blocks. aUnadjusted logistic regression analyses. bLogistic regression analyses adjusted for age, sex, and PC1-5. cLogistic regression analyses adjusted for age, sex, PC1-5, and tobacco use. Haplotypes indicating a significant association with PD at a corrected p-value threshold of 0.003 are marked in bold. MAF, minor allele frequency; KB, kilobases; OR, odds ratio; CI, confidence interval.
Analysis of the joint effect of variants in PLPP4 on PD risk
We further evaluated the joint effect of more rare variants (MAF < 5%) in PLPP4 on PD risk using both genotyped and imputed data. No coding variants in the gene were identified in the genotyped data and only one was identified in the imputed data (Table 5). When focusing on all variants, an association in the genotyped data at MAF < 5% was observed (p = 0.002), passing Bonferroni correction. A trend of a potential joint effect of variants with a MAF < 5% was still observed in the imputed data (p = 0.005). However, it did not reach multiple testing corrections (p-value threshold = 0.05/628 = 7.96E-05). Only one variant with MAF < 1% was present in the genotyped data, and no statistically significant association was observed for variants with MAF < 1% in neither the genotyped nor the imputed data.
Table 5
Number of variants in PLPP4 tested through the sequence kernel association test (SKAT) and the results statistics at MAF threshold 1% and 5% in the genotyped data vs. the imputed
| MAF < 1% | MAF < 5% | |||
| No. Variants | p | No. Variants | p | |
| Genotyped data | ||||
| All variants | 1 | NA | 16 | 0.002 |
| Coding variants | 0 | NA | 0 | NA |
| Imputed data | ||||
| All variants | 402 | 0.109 | 628 | 0.005 |
| Coding variants | 1 | 0.562 | 1 | 0.562 |
Analyses were adjusted for age at inclusion, sex, and PC1-5. Results significant at Bonferroni correction are highlighted in bold.
Genetic PD risk profile
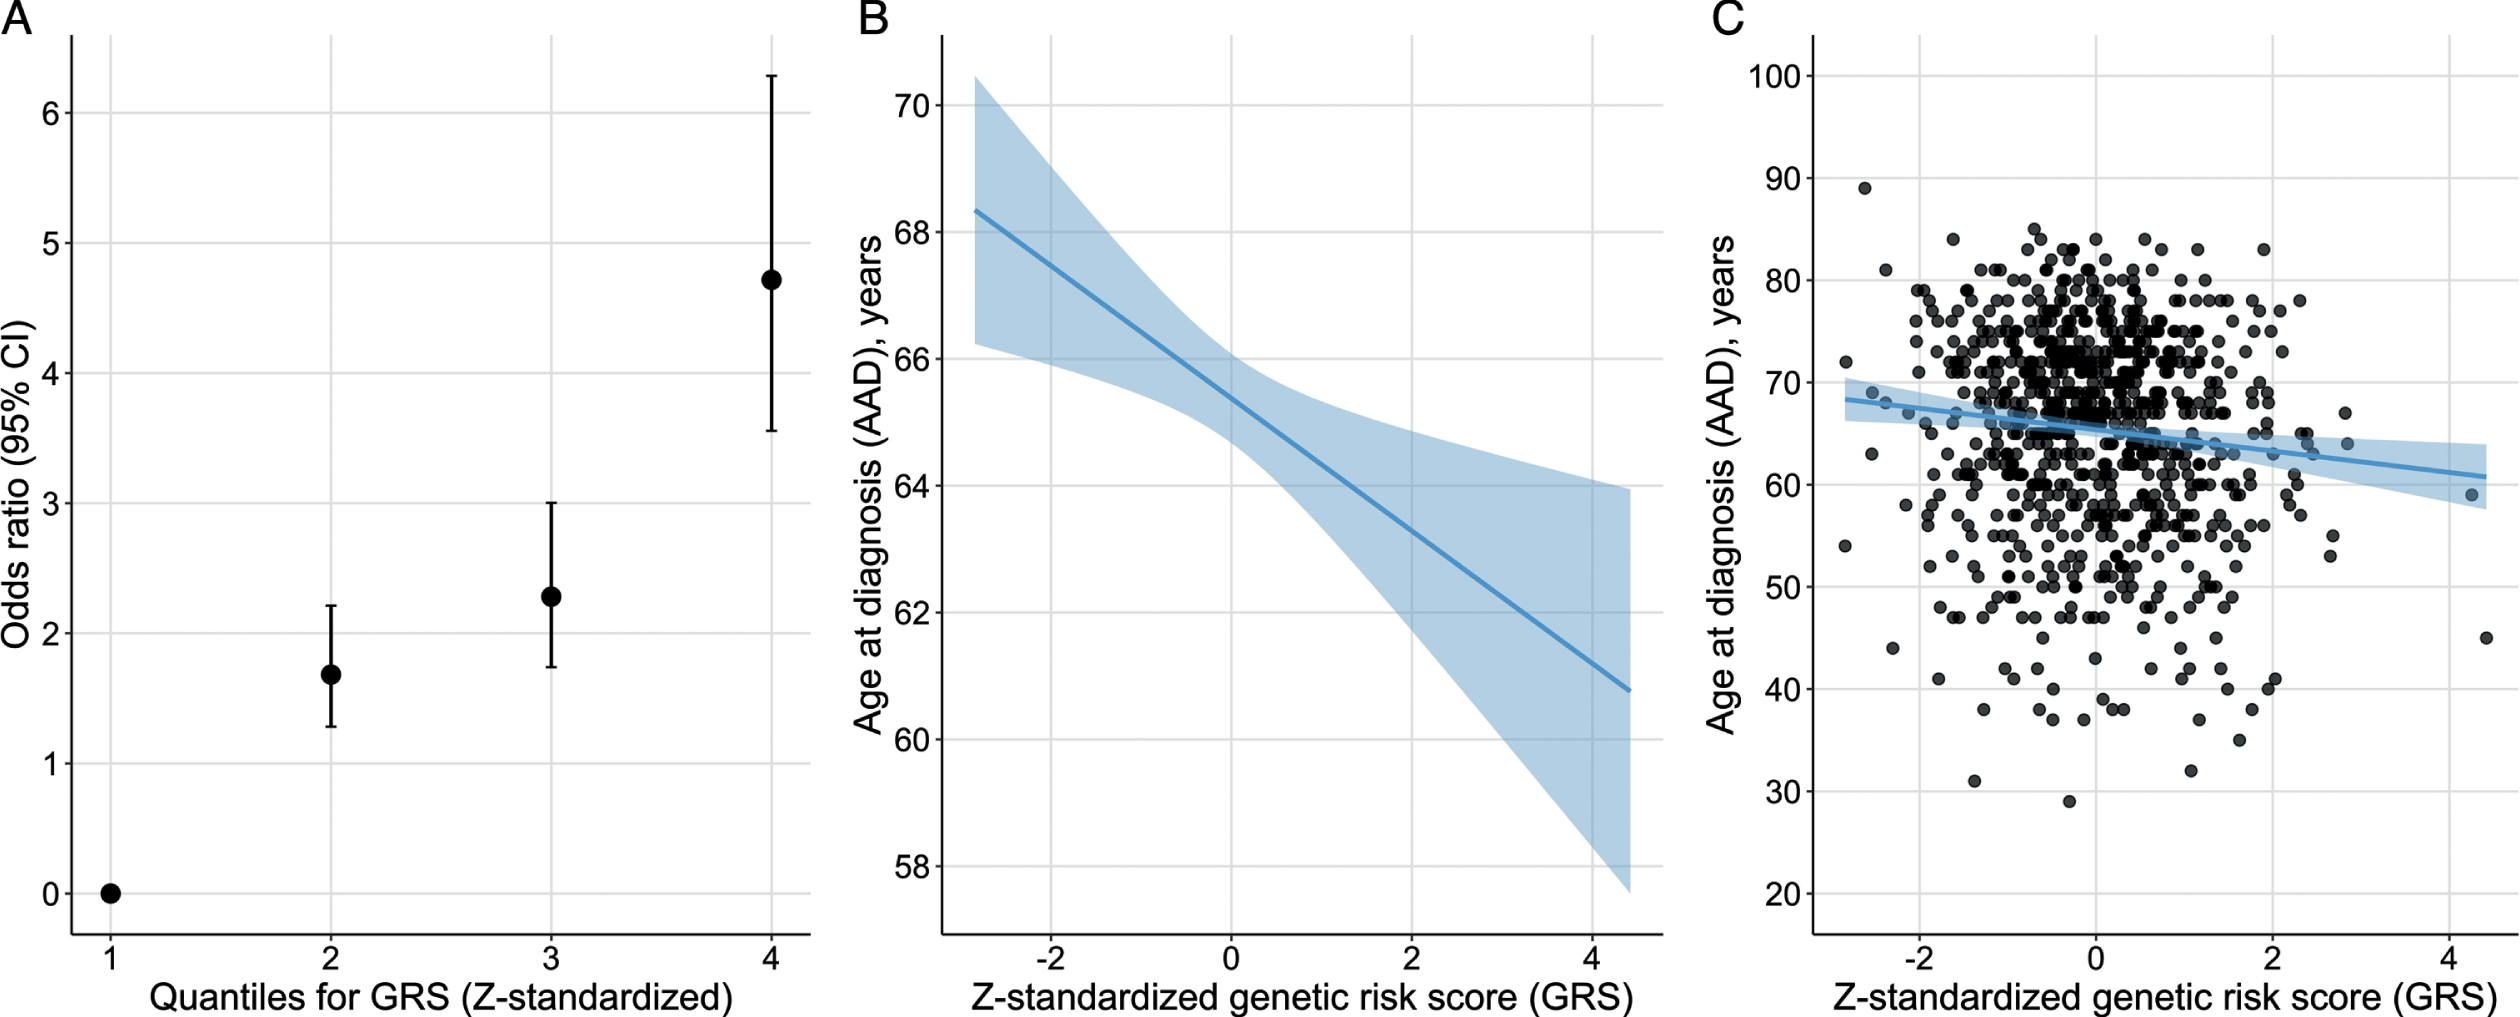
The PD risk profile analysis showed that the Z-standardized GRS from Nalls et al. was associated with PD status also in this Swedish case-control cohort [12]. For each SD increase from the reference mean value, the OR increased by 1.8 (beta = 0.59, SE = 0.05, p < 2.22E-16) (Fig. 5). Study participants in the highest GRS quartile were estimated to be 4.7 times more likely to have PD compared to the participants in the lowest quartile using an adjusted model. There was also an inverse association between the GRS and AAD, where one SD increase in the Z-standardized GRS was associated with approximately one-year earlier AAD (beta = –0.97, SE = 0.36, p = 0.007, adjusted r2 = 0.011).
Fig. 4
LocusZoom plot for PD GWAS PLPP4 locus. Imputed and genotyped variants passing QC in the PLPP4 gene +/- 100 kb (10 : 122116466-122449376) mapped to genome build GRCh37. The only coding gene in the region is PLPP4, other include pseudogenes (AC073587.1) and long non-coding RNA (LINC01561, AC023282.1, WDR11-AS1). The variant with lowest p-value (index) is indicated as a purple diamond. Marker colors indicate the strength of LD as r2 between the index variant and other variants in the 1000 Genomes EUR population.
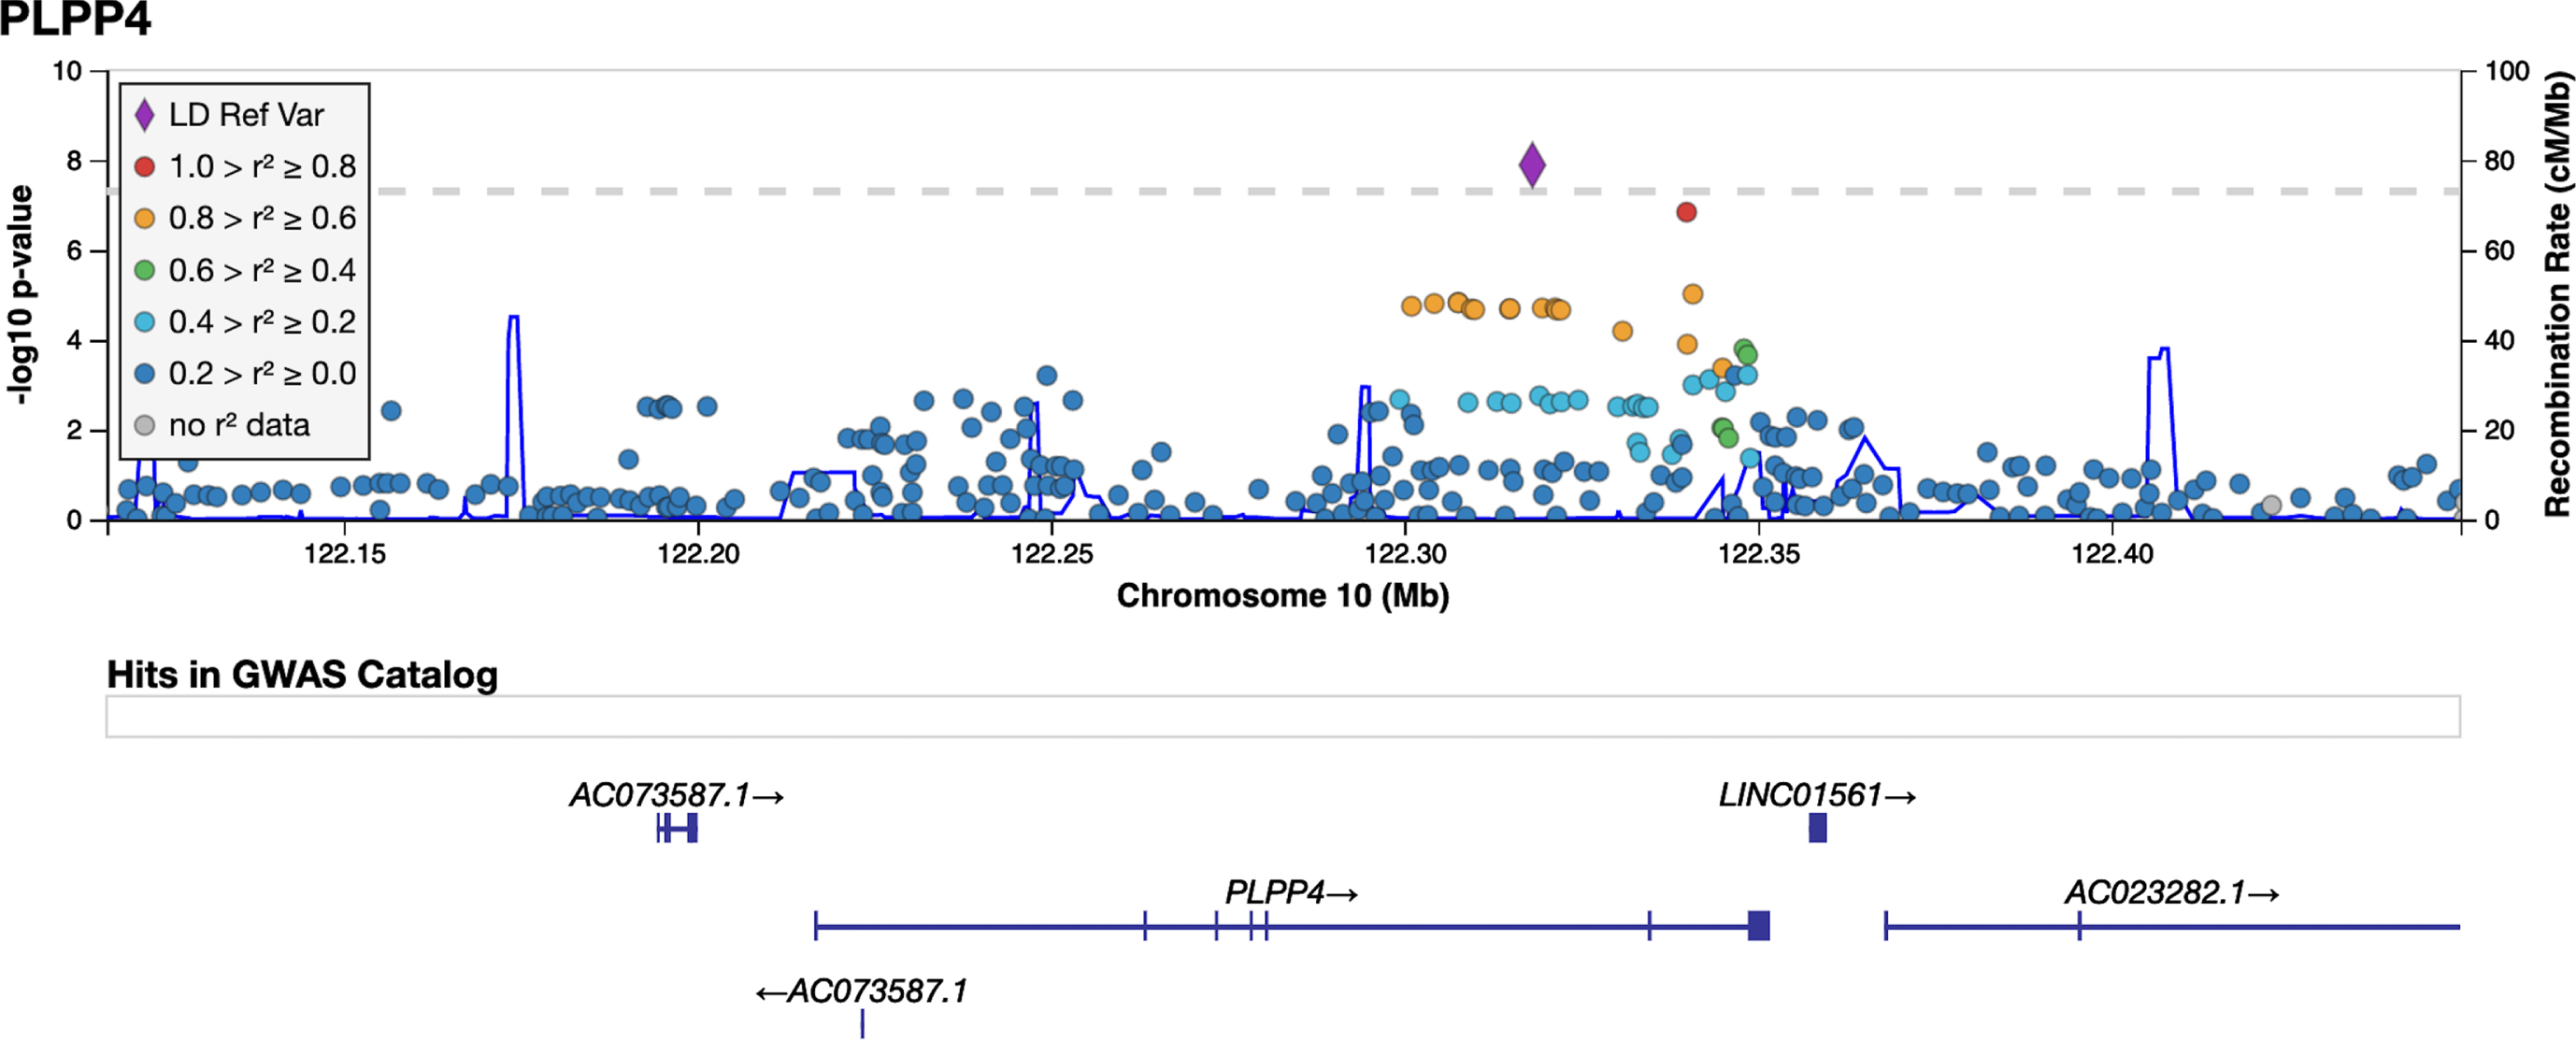
Fig. 5
Genetic risk score (GRS) quartiles vs. disease status (A) and age at diagnosis (AAD) (B and C). A) Odds ratio of PD status per risk quartile of the Z-standardized GRS. B) Regression line for the association between the Z-standardized GRS and AAD. The line represents the parameter estimate and the shading the 95% CI of the regression model. The model was adjusted for sex, PD family history, and PC1-5. C) AAD and Z-standardized GRS for each study participant with the regression model in plot B fitted to the plot.
DISCUSSION
This study is, to our knowledge, the largest case-control study of PD performed in a Swedish cohort. The study includes a well-defined recruitment of matched study participants from a specific region in southern Sweden. Multiple previously reported environmental and genetic risk factors were confirmed to affect PD risk. Interestingly, a novel genome-wide significant association with PD risk at the PLPP4 locus was observed, both in the GWA and the haplotype analysis, but further validation of the nominated variant is needed.
The MPBC cohort demonstrates similar characteristics compared to other PD cohorts. At inclusion, the patients had a relatively short disease duration (average 4 years), which was reflected in the PD rating scales with an average score of 2 on the H&Y scale and low scores on the CISI-PD and PDQ-8 scales. This can be explained by the study inclusion design as patients with advanced PD, who could not visit a neurology clinic, were not eligible. For self-reported PD symptoms, hypokinesia/bradykinesia was most common, occurring in 72% of the patients. Non-motor symptoms occurring at later stages of the disease, such as delusions and hallucinations were less frequent (6.0% and 16.8%), also highlighting the lower number of patients with advanced PD in the cohort [48]. The lack of an association between BMI at inclusion and PD further highlight this. Weight loss has frequently been observed in PD patients as a consequence of reduced energy intake in combination with an increased energy expenditure due to, e.g., levodopa-induced dyskinesia [49]. It has been estimated that PD patients lose 3.5 kg every eight years post-diagnosis and that levodopa-induced dyskinesia commonly develops after 3–5 years [49, 50]. Approximately 92% of the patients in the cohort reported using levodopa therapy.
Several previously reported environmental PD risk factors could be confirmed in this Swedish cohort. Among those, an association between pesticide exposure and PD was observed, where exposure to pesticides more than doubled the risk of having PD. The number of participants exposed to pesticides was overrepresented among those who had reported farming and well water consumption. However, no statistically significant association was observed between farming or well water and PD in the cohort. Several pesticides have been reported to be linked to PD, including paraquat, glyphosate, and pyrethroids [51]. Paraquat was banned in Sweden in 1983 while glyphosates and pyrethroids are still used [52]. However, further actions need to be taken to investigate which chemicals stand behind the observed association.
Having a relative with a PD diagnosis doubled the risk of having PD in the cohort. Among the 20% of patients that reported a positive family history, 8.9% had a first-degree relative with PD. Other studies report similar numbers with 15–25% of PD patients having a positive family history and 10–25% having a first-degree relative with PD [53]. It has been suggested that the risk of PD increases shortly after a traumatic brain injury and that a history of concussions results in a higher risk of PD [54, 55]. We also observed a statistically significant association between a history of head trauma and PD, but whether the association is causative or a consequence of prodromal PD remains to be determined. Among participants reporting head trauma, no association was observed between PD and loss of consciousness.
The inverse association between smoking and PD is well-known and has been reported in numerous studies [17]. This was initially replicated in the cohort, but was no longer statistically significant after adjustment for confounders, which could be due to the common co-occurrence of smoking and the use of snus. Interestingly though, a strong inverse association between the Swedish moist tobacco snus and PD was observed also after adjustment. The amount of nicotine reaching the blood when using snus is equivalent to that of cigarette smoking, and the observation reduces the number of candidate compounds underlying the inverse association between smoking and PD [56, 57]. It has previously been reported that non-smoking, snus-using Swedish men had 60% lower risk of PD compared to men who had never used snus [57]. Snus is more frequently used than smoking tobacco among men in Sweden, where 18% use snus and 7% smoke on a daily basis. Among Swedish women, 5% use snus and 7% smoke on a daily basis [58]. We investigated the total effect of smoking and snus on PD risk and found a statistically significant inverse association with PD also for the combined variable “Tobacco”. Our findings support previous reports and suggest either that components in tobacco leaves influence biological processes underlying PD, or that there is a reverse causation between tobacco use and PD. Nicotine has been suggested to have neuroprotective properties but it is also known to stimulate dopamine release from nigrostriatal dopaminergic terminals. Hence, the lower use of tobacco products could be a consequence of a reduced nicotine-evoked dopamine release among prodromal PD patients [59]. Caffeine has also been reported to have neuroprotective effects in PD animal models, and several epidemiological studies have reported a relationship between increased coffee consumption and decreased risk of developing PD [10]. We could also observe a trend of lower OR for PD with higher coffee consumption in all investigated age groups in this cohort.
The comorbidities hypertension, hyperlipidemia, and osteoarthritis were inversely associated with PD in the cohort. Autonomic dysfunction can occur in PD, resulting in abnormalities in blood pressure, and orthostatic hypotension is common [60]. In concordance with our results, meta-analysis of PD risk factors has identified an inverse association between hypertension and PD risk [16]. However, this was only observed in case-control studies, indicating that the association might be a consequence of the disease. For hyperlipidemia, there are conflicting reports on the association with PD, but a meta-analysis supports an inverse association [61]. It is possible that the use of lipid-lowering drugs (statins) contributes to the observed conflicting associations [62]. The study participants were asked whether they had been diagnosed with hyperlipidemia and, hence, it was likely that they used pharmacological treatments. Statins are the most commonly prescribed lipid-lowering drugs in Sweden, and we cannot rule out that the observed inverse association between PD and hyperlipidemia is a consequence of statin use. Moreover, the PD patients were less likely to have a diagnosis of osteoarthritis (21% patients vs. 29% controls). Contrary to our observation, arthritis (no distinction was made between rheumatoid arthritis and osteoarthritis) has been reported to be the most prevalent comorbidity in PD, with almost 47% reported having the condition [63], indicating that our observation could be a consequence of underdiagnosis of osteoarthritis among the PD patients [64]. Furthermore, associations between PD and the comorbidities depression, back pain, and bowel problems were observed. Use of ibuprofen has been reported to be inversely associated with PD in a dose-dependent manner [65]. We observed a reduced PD risk for the use of the NSAID ibuprofen < 2 times/week but not for≥2 times/week and, a recently published large study does not support any evidence of a decreased PD incidence among NSAID users [66].
Here, we describe, to our knowledge, the first GWAS of PD composed solely of PD patients from Sweden, specifically the southernmost region of Sweden. Although the relatively small sample size is a limitation in this study, issues with population stratification are expected to be lower due to region-specific study recruitment and, potentially, more homogenous ancestry. The observed near genome-wide significance associated variants at the SNCA locus indicate that this cohort is a well-designed case-control cohort of PD, and one of the variants was reported among the 90 risk loci in the largest GWAS meta-analysis to date [12]. Another 23 of the 90 risk loci were replicated at a nominal uncorrected p-value < 0.05. Notably, this study had insufficient statistical power to detect variants with low MAF or small effect size, and the majority of 90 risk loci had an OR of 0.8–1.2 [12]. Insufficient statistical power is likely also the reason for the lack of an identification of any loci associated with AAD. Two genome-wide significant association signals have previously been reported to be linked to PD AAO, one at the SNCA locus and one at TMEM175.
Interestingly, the GWA analysis identified a novel variant, rs12771445, associated with PD at a genome-wide significance level. This variant was not associated with PD in the largest meta-GWAS of PD [12] and has not, to our knowledge, been reported to be associated with PD in the literature, but may be specific for the Swedish population. It could be that this common variant is a tagging a population-specific rare variant as the Swedish population appears to contain a substantial number of genetic variants that are not represented in other European populations [26]. However, the significant variant was imputed, and we remain cautious in drawing any conclusions. As expected, we further identified one haplotype in PLPP4 significantly associated with PD. The haplotype was more common among controls, indicating a decreased risk of PD among carriers. Furthermore, we investigated the joint effect of rare variants (MAF < 5%) in PLPP4 on PD. Due to the low coverage of coding variants, we adapted the non-burden SKAT and observed an association with PD risk for the genotyped variants but not for the imputed variants. Replication studies in larger Swedish cohorts are needed in order to validate our findings of a potential association between PLPP4 and PD in the Swedish population.
The gene PLPP4 encodes for a phospholipid phos-phatase that catalyzes the dephosphorylation of bio-active lipid mediators such as phosphatidic acid (PA) [67]. Another regulator of PA content, the diacylgly-cerol kinase, DGKQ, has previously been reported as a potential PD risk factor [68, 69]. The role of lipids in PD is receiving greater attention, and the question whether if PD is a lipidopathy rather than a proteino-pathy has been lifted [70]. Several reasons stand behind this hypothesis, including the proposal that α-synuclein is a lipid-binding protein that physiologi-cally interacts with phospholipids and fatty acids [70].
Although only 23 out of 90 previously reported risk variants were replicated in this Swedish cohort, the cumulative GRS based on the 90 variants showed an almost five-fold higher risk for PD in the highest quartile compared to the lowest quartile. Combining the GRS with information on age, sex, family history of PD, and the University of Pennsylvania Smell Identification Test (UPSIT) score (olfactory function) has been reported to further increase the sensitivity and specificity of the PD status model [45]. Having access to all factors but the UPSIT score, we added information on age, sex, family history of PD and PC1-5 to our model. GRS alone gave an area under the roc curve (AUC) of 0.67 while the adjusted model gave an AUC of 0.68. The non-observed difference for the two models could be due to the large proportion of the variance explained by the UPSIT score in the reported prediction model (63.1%) compared to the substantially lower values for GRS (13.6%), family history (11.4%), gender (6.0%) and age (5.9%) [45]. The lack of association with PD in the Swedish cohort for 67/90 risk variants could also have an impact on the fit of the model applied in our cohort. Although the model is functional enough to compare risk for disease status at a population level, additional information would be needed for disease prediction. Interestingly, we observed an association between the GRS and AAD despite a small sample size, with one SD increase in the Z-standardized GRS being associated with approximately one-year earlier AAD. This result is in concordance with previous results in other, larger, PD cohorts [22, 46].
Among the 90 risk variants, the LRRK2 G2019S (rs34637584) had the largest effect estimate (2.43). This variant was genotyped in our dataset but excluded during the pre-imputation QC due to low MAF (0.2%). Previous studies of PD cohorts in Sweden have shown that the prevalence of LRRK2 G2019S carriers is low in Sweden, 0.54% of screened 2206 PD patients were carriers [71]. It has been estimated that the G2019S mutation worldwide accounts for 4% of familial and 1% of idiopathic PD cases [72]. In our study, the fraction of carriers among the patients was 0.75%, further confirming a low prevalence of LRRK2 G2019S carriers among Swedish PD patients.
In conclusion, this work represents a comprehensive description of a new PD case-control cohort from southern Sweden in which we nominate a novel GWA variant in the PLPP4 locus. However, subsequent studies are needed in order to validate whether PLPP4 is associated with PD within the Swedish population. This study contributes to the understanding of environmental and genetic risk factors in PD in the Swedish population, and the combination of epidemiological, clinical, and genetic data in the cohort makes it suitable for future studies of PDetiology.
ACKNOWLEDGMENTS
This research was supported by MultiPark – a Strategic Research Area at Lund University and by grants from the Swedish Research Council (VR), Åke Wiberg’s foundation, Parkinsonfonden, Åhlén foundation, Lindhés advokatbyrå, and Sigurd & Elsa Golje’s memorial foundation (KB/MS). This work was also supported in part by the Intramural Research Program of the National Institute on Aging (NIA) (SBC/CB), part of the National Institutes of Health, Department of Health and Human Services. We thank the individuals who have contributed and donated blood samples to MPBC. We would also like to thank the research nurses and statistician Helene Jacobsson at MultiPark for conducting data collections, and previous students of the Translational Neurogenetics Unit who have helped with questionnaire registration to REDCap. We would like to thank Megg Garcia and Alexander Svanbergsson for technical help and feedback, and the International Parkinson’s Disease Genomic Consortium (IPDGC) and its trainee network for additional help during the project, in particularly Lynne Krohn and Manuela Tan. We would also like to acknowledge the Global Parkinson’s Genetics Program (GP2) learning platform for training courses and code in Parkinson’s disease genetics. We would also like to acknowledge Ashfaq Ali at the National Bioinformatics Infrastructure Sweden at SciLifeLab for bioinformatics advice. The Region Skåne Biobank Facility (BD47) has performed the biobank services in the project.
AP receives research support from the Swedish government (ALF), Region Skåne, Skåne University Hospital, Bundy Academy, Hans Gabriel and Alice Trolle Wachtmeister Stiftelse för Medicinsk Forskning, The Swedish Parkinson Association, The Swedish Parkinson Academy, SCA network, all in Sweden, and receives reimbursement from Elsevier Ltd. PO has received research support from The Swedish National Government and County Councils, Skåne University Hospital Foundations and Donations, Region Skåne, Parkinsonfonden, Swedish Parkinson Academy and Åhlens Foundation.
CONFLICT OF INTEREST
KB, MS, SBC, CB, AP, PO, and HW have no conflicts of interest to report. OH has acquired research support (for the institution) from AVID Radiopharmaceuticals, Biogen, Eli Lilly, Eisai, GE Healthcare, Pfizer, and Roche. In the past 2 years, he has received consultancy/speaker fees from AC Immune, Alzpath, Biogen, Cerveau, and Roche.
SUPPLEMENTARY MATERIAL
[1] The supplementary material is available in the electronic version of this article: https://dx.doi.org/10.3233/JPD-212818.
REFERENCES
[1] | GBD 2016 Parkinson’s Disease Collaborators ((2018) ) Global, regional, and national burden of Parkinson’s disease, 1990-2016: a systematic analysis for the Global Burden of Disease Study 2016. Lancet Neurol 17: , 939–953. |
[2] | GBD 2016 Neurology Collaborators ((2019) ) Global, regional, and national burden of neurological disorders, 1990-2016: a systematic analysis for the Global Burden of Disease Study 2016. Lancet Neurol 18: , 459–480. |
[3] | Blauwendraat C , Nalls MA , Singleton AB ((2020) ) The genetic architecture of Parkinson’s disease. Lancet Neurol 19: , 170–178. |
[4] | Bonifati V , Rizzu P , van Baren MJ , Schaap O , Breedveld GJ , Krieger E , Dekker MC , Squitieri F , Ibanez P , Joosse M , van Dongen JW , Vanacore N , van Swieten JC , Brice A , Meco G , van Duijn CM , Oostra BA , Heutink P ((2003) ) Mutations in the DJ-1 gene associated with autosomal recessive early-onset parkinsonism. Science 299: , 256–259. |
[5] | Kitada T , Asakawa S , Hattori N , Matsumine H , Yamamura Y , Minoshima S , Yokochi M , Mizuno Y , Shimizu N ((1998) ) Mutations in the parkin gene cause autosomal recessive juvenile parkinsonism. Nature 392: , 605–608. |
[6] | Polymeropoulos MH , Lavedan C , Leroy E , Ide SE , Dehejia A , Dutra A , Pike B , Root H , Rubenstein J , Boyer R , Stenroos ES , Chandrasekharappa S , Athanassiadou A , Papapetropoulos T , Johnson WG , Lazzarini AM , Duvoisin RC , Di Iorio G , Golbe LI , Nussbaum RL ((1997) ) Mutation in the alpha-synuclein gene identified in families with Parkinson’s disease. Science 276: , 2045–2047. |
[7] | Valente EM , Abou-Sleiman PM , Caputo V , Muqit MM , Harvey K , Gispert S , Ali Z , Del Turco D , Bentivoglio AR , Healy DG , Albanese A , Nussbaum R , González-Maldonado R , Deller T , Salvi S , Cortelli P , Gilks WP , Latchman DS , Harvey RJ , Dallapiccola B , Auburger G , Wood NW ((2004) ) Hereditary early-onset Parkinson’s disease caused bymutations in PINK1. Science 304: , 1158–1160. |
[8] | Zimprich A , Benet-Pagès A , Struhal W , Graf E , Eck SH , Offman MN , Haubenberger D , Spielberger S , Schulte EC , Lichtner P , Rossle SC , Klopp N , Wolf E , Seppi K , Pirker W , Presslauer S , Mollenhauer B , Katzenschlager R , Foki T , Hotzy C , Reinthaler E , Harutyunyan A , Kralovics R , Peters A , Zimprich F , Brücke T , Poewe W , Auff E , Trenkwalder C , Rost B , Ransmayr G , Winkelmann J , Meitinger T , Strom TM ((2011) ) A mutation in VPS35, encoding a subunit of the retromer complex, causes late-onset Parkinson disease. Am J Hum Genet 89: , 168–175. |
[9] | Zimprich A , Biskup S , Leitner P , Lichtner P , Farrer M , Lincoln S , Kachergus J , Hulihan M , Uitti RJ , Calne DB , Stoessl AJ , Pfeiffer RF , Patenge N , Carbajal IC , Vieregge P , Asmus F , Müller-Myhsok B , Dickson DW , Meitinger T , Strom TM , Wszolek ZK , Gasser T ((2004) ) Mutations in LRRK2 cause autosomal-dominant parkinsonism with pleomorphic pathology. Neuron 44: , 601–607. |
[10] | de Lau LM , Breteler MM ((2006) ) Epidemiology of Parkinson’s disease. Lancet Neurol 5: , 525–535. |
[11] | Vollstedt EJ , Kasten M , Klein C ((2019) ) Using global team science to identify genetic parkinson’s disease worldwide. Ann Neurol 86: , 153–157. |
[12] | Nalls MA , Blauwendraat C , Vallerga CL , Heilbron K , Bandres-Ciga S , Chang D , Tan M , Kia DA , Noyce AJ , Xue A , Bras J , Young E , von Coelln R , Simón-Sánchez J , Schulte C , Sharma M , Krohn L , Pihlstrøm L , Siitonen A , Iwaki H , Leonard H , Faghri F , Gibbs JR , Hernandez DG , Scholz SW , Botia JA , Martinez M , Corvol J-C , Lesage S , Jankovic J , Shulman LM , Sutherland M , Tienari P , Majamaa K , Toft M , Andreassen OA , Bangale T , Brice A , Yang J , Gan-Or Z , Gasser T , Heutink P , Shulman JM , Wood NW , Hinds DA , Hardy JA , Morris HR , Gratten J , Visscher PM , Graham RR , Singleton AB , 23andMe ResearchTeam; System Genomics of Parkinson’s Disease Consortium;International Parkinson’s Disease Genomics Consortium ((2019) ) Identification of novel risk loci, causal insights, and heritablerisk for Parkinson’s disease: a meta-analysis of genome-wideassociation studies. Lancet Neurol 18: , 1091–1102. |
[13] | Foo JN , Chew EGY , Chung SJ , Peng R , Blauwendraat C , Nalls MA , Mok KY , Satake W , Toda T , Chao Y , Tan LCS , Tandiono M , Lian MM , Ng EY , Prakash KM , Au WL , Meah WY , Mok SQ , Annuar AA , Chan AYY , Chen L , Chen Y , Jeon BS , Jiang L , Lim JL , Lin JJ , Liu C , Mao C , Mok V , Pei Z , Shang HF , Shi CH , Song K , Tan AH , Wu YR , Xu YM , Xu R , Yan Y , Yang J , Zhang B , Koh WP , Lim SY , Khor CC , Liu J , Tan EK ((2020) ) Identification of risk loci for Parkinson disease in Asians and comparison of risk between Asians and Europeans: a genome-wide association study. JAMA Neurol 77: , 746–754. |
[14] | Génin E ((2020) ) Missing heritability of complex diseases: casesolved? . Hum Genet 139: , 103–113. |
[15] | Young AI ((2019) ) Solving the missing heritability problem. PLoS Genet 15: , e1008222. |
[16] | Noyce AJ , Bestwick JP , Silveira-Moriyama L , Hawkes CH , Giovannoni G , Lees AJ , Schrag A ((2012) ) Meta-analysis of early nonmotor features and risk factors for Parkinson disease. Ann Neurol 72: , 893–901. |
[17] | Bellou V , Belbasis L , Tzoulaki I , Evangelou E , Ioannidis JP ((2016) ) Environmental risk factors and Parkinson’s disease: An umbrella review of meta-analyses. Parkinsonism Relat Disord 23: , 1–9. |
[18] | Sirugo G , Williams SM , Tishkoff SA ((2019) ) The missing diversity in human genetic studies. Cell 177: , 26–31. |
[19] | Popejoy AB , Fullerton SM ((2016) ) Genomics is failing on diversity. Nature 538: , 161–164. |
[20] | International Parkinson Disease Genomics Consortium (IPDGC) ((2020) ) Ten years of the international Parkinson Disease Genomics Consortium: progress and next steps. J Parkinsons Dis 10: , 19–30. |
[21] | Loesch DP , Horimoto A , Heilbron K , Sarihan EI , Inca-Martinez M , Mason E , Cornejo-Olivas M , Torres L , Mazzetti P , Cosentino C , Sarapura-Castro E , Rivera-Valdivia A , Medina AC , Dieguez E , Raggio V , Lescano A , Tumas V , Borges V , Ferraz HB , Rieder CR , Schumacher-Schuh A , Santos-Lobato BL , Velez-Pardo C , Jimenez-Del-Rio M , Lopera F , Moreno S , Chana-Cuevas P , Fernandez W , Arboleda G , Arboleda H , Arboleda-Bustos CE , Yearout D , Zabetian CP , Cannon P , Thornton TA , O’Connor TD , Mata IF ((2021) ) Characterizing the genetic architecture of Parkinson’s disease in Latinos. Ann Neurol 90: , 353–365. |
[22] | Bandres-Ciga S , Ahmed S , Sabir MS , Blauwendraat C , Adarmes-Gómez AD , Bernal-Bernal I , Bonilla-Toribio M , Buiza-Rueda D , Carrillo F , Carrión-Claro M , Gómez-Garre P , Jesús S , Labrador-Espinosa MA , Macias D , Méndez-Del-Barrio C , Periñán-Tocino T , Tejera-Parrado C , Vargas-González L , Diez-Fairen M , Alvarez I , Tartari JP , Buongiorno M , Aguilar M , Gorostidi A , Bergareche JA , Mondragon E , Vinagre-Aragon A , Croitoru I , Ruiz-Martínez J , Dols-Icardo O , Kulisevsky J , Marín-Lahoz J , Pagonabarraga J , Pascual-Sedano B , Ezquerra M , Cámara A , Compta Y , Fernández M , Fernández-Santiago R , Muñoz E , Tolosa E , Valldeoriola F , Gonzalez-Aramburu I , Sanchez Rodriguez A , Sierra M , Menéndez-González M , Blazquez M , Garcia C , Suarez-San Martin E , García-Ruiz P , Martínez-Castrillo JC , Vela-Desojo L , Ruz C , Barrero FJ , Escamilla-Sevilla F , Mínguez-Castellanos A , Cerdan D , Tabernero C , Gomez Heredia MJ , Perez Errazquin F , Romero-Acebal M , Feliz C , Lopez-Sendon JL , Mata M , Martínez Torres I , Kim JJ , Dalgard CL , American Genome C , Brooks J , Saez-Atienzar S , Gibbs JR , Jorda R , Botia JA , Bonet-Ponce L , Morrison KE , Clarke C , Tan M , Morris H , Edsall C , Hernandez D , Simon-Sanchez J , Nalls MA , Scholz SW , Jimenez-Escrig A , Duarte J , Vives F , Duran R , Hoenicka J , Alvarez V , Infante J , Marti MJ , Clarimón J , López de Munain A , Pastor P , Mir P , Singleton A , A, International Parkinson Disease Genomics Consortium ((2019) ) The genetic architecture of Parkinson disease in Spain: characterizing population-specific risk, differential haplotype structures, and providing etiologic insight. Mov Disord 34: , 1851–1863. |
[23] | Pihlstrøm L , Axelsson G , Bjørnarå KA , Dizdar N , Fardell C , Forsgren L , Holmberg B , Larsen JP , Linder J , Nissbrandt H , Tysnes OB , Ohman E , Dietrichs E , Toft M ((2013) ) Supportive evidence for 11loci from genome-wide association studies in Parkinson’s disease. Neurobiol Aging 34: , 1708.e1707–1713. |
[24] | Humphreys K , Grankvist A , Leu M , Hall P , Liu J , Ripatti S , Rehnström K , Groop L , Klareskog L , Ding B , Grönberg H , Xu J , Pedersen NL , Lichtenstein P , Mattingsdal M , Andreassen OA , O’Dushlaine C , Purcell SM , Sklar P , Sullivan PF , Hultman CM , Palmgren J , Magnusson PKE ((2011) ) The genetic structure of the Swedish population. PloS One 6: , e22547–e22547. |
[25] | Nelis M , Esko T , Mägi R , Zimprich F , Zimprich A , Toncheva D , Karachanak S , Piskácková T , Balascák I , Peltonen L , Jakkula E , Rehnström K , Lathrop M , Heath S , Galan P , Schreiber S , Meitinger T , Pfeufer A , Wichmann HE , Melegh B , Polgár N , Toniolo D , Gasparini P , D’Adamo P , Klovins J , Nikitina-Zake L , Kucinskas V , Kasnauskiene J , Lubinski J , Debniak T , Limborska S , Khrunin A , Estivill X , Rabionet R , Marsal S , Julià A , Antonarakis SE , Deutsch S , Borel C , Attar H , Gagnebin M , Macek M , Krawczak M , Remm M , Metspalu A ((2009) ) Genetic structure ofEuropeans: a view from the North-East. PloS One 4: , e5472. |
[26] | Ameur A , Dahlberg J , Olason P , Vezzi F , Karlsson R , Martin M , Viklund J , Kähäri AK , Lundin P , Che H , Thutkawkorapin J , Eisfeldt J , Lampa S , Dahlberg M , Hagberg J , Jareborg N , Liljedahl U , Jonasson I , Johansson Å , Feuk L , Lundeberg J , Syvänen AC , Lundin S , Nilsson D , Nystedt B , Magnusson PK , Gyllensten U ((2017) ) SweGen: a whole-genome data resource of genetic variability in a cross-section of the Swedish population. Eur J Hum Genet 25: , 1253–1260. |
[27] | Salmela E , Lappalainen T , Liu J , Sistonen P , Andersen PM , Schreiber S , Savontaus M-L , Czene K , Lahermo P , Hall P , Kere J ((2011) ) Swedish population substructure revealed by genome-wide single nucleotide polymorphism data. PloS One 6: , e16747. |
[28] | Harris PA , Taylor R , Thielke R , Payne J , Gonzalez N , Conde JG ((2009) ) Research electronic data capture (REDCap)—A metadata-driven methodology and workflow process for providing translational research informatics support. J Biomed Inform 42: , 377–381. |
[29] | R Core Team (2020) R Foundation for Statistical Computing, Vienna, Austria. |
[30] | Burström K , Sun S , Gerdtham UG , Henriksson M , Johannesson M , Levin L , Zethraeus N ((2014) ) Swedish experience-based value sets for EQ-5D health states. Qual Life Res 23: , 431–442. |
[31] | Burström K , Teni FS , Gerdtham UG , Leidl R , Helgesson G , Rolfson O , Henriksson M ((2020) ) Experience-based Swedish TTO and VAS value sets for EQ-5D-5L health states. Pharmacoeconomics 38: , 839–856. |
[32] | Textor J , van der Zander B , Gilthorpe MS , Liśkiewicz M , Ellison GTH ((2016) ) Robust causal inference using directed acyclic graphs:the R package ‘dagitty’. Int J Epidemiol 45: , 1887–1894. |
[33] | Purcell S , Neale B , Todd-Brown K , Thomas L , Ferreira MA , Bender D , Maller J , Sklar P , de Bakker PI , Daly MJ , Sham PC ((2007) ) PLINK: a tool set for whole-genome association and population-based linkage analyses. Am J Hum Genet 81: , 559–575. |
[34] | Chang CC , Chow CC , Tellier LC , Vattikuti S , Purcell SM , Lee JJ ((2015) ) Second-generation PLINK: rising to the challenge of larger and richer datasets. Gigascience 4: , 7. |
[35] | Gibbs RA , Belmont JW , Hardenbol P , Willis TD , Yu F , Yang H , Ch’ang L-Y , Huang W , Liu B , Shen Y , et al ((2003) ) The International HapMap Project. Nature 426: , 789–796. |
[36] | Das S , Forer L , Schonherr S , Sidore C , Locke AE , Kwong A , Vrieze SI , Chew EY , Levy S , McGue M , Schlessinger D , Stambolian D , Loh PR , Iacono WG , Swaroop A , Scott LJ , Cucca F , Kronenberg F , Boehnke M , Abecasis GR , Fuchsberger C ((2016) ) Next-generation genotype imputation service and methods. Nat Genet 48: , 1284–1287. |
[37] | Loh PR , Danecek P , Palamara PF , Fuchsberger C , Y AR , H KF , Schoenherr S , Forer L , McCarthy S , Abecasis GR , Durbin R , Price AL ((2016) ) Reference-based phasing using the Haplotype Reference Consortium panel. Nat Genet 48: , 1443–1448. |
[38] | McCarthy S , Das S , Kretzschmar W , Delaneau O , Wood AR , Teumer A , Kang HM , Fuchsberger C , Danecek P , Sharp K , Luo Y , Sidore C , Kwong A , Timpson N , Koskinen S , Vrieze S , Scott LJ , Zhang H , Mahajan A , Veldink J , Peters U , Pato C , van Duijn CM , Gillies CE , Gandin I , Mezzavilla M , Gilly A , Cocca M , Traglia M , Angius A , Barrett JC , Boomsma D , Branham K , Breen G , Brummett CM , Busonero F , Campbell H , Chan A , Chen S , Chew E , Collins FS , Corbin LJ , Smith GD , Dedoussis G , Dorr M , Farmaki AE , Ferrucci L , Forer L , Fraser RM , Gabriel S , Levy S , Groop L , Harrison T , Hattersley A , Holmen OL , Hveem K , Kretzler M , Lee JC , McGue M , Meitinger T , Melzer D , Min JL , Mohlke KL , Vincent JB , Nauck M , Nickerson D , Palotie A , Pato M , Pirastu N , McInnis M , Richards JB , Sala C , Salomaa V , Schlessinger D , Schoenherr S , Slagboom PE , Small K , Spector T , Stambolian D , Tuke M , Tuomilehto J , Van den Berg LH , Van Rheenen W , Volker U , Wijmenga C , Toniolo D , Zeggini E , Gasparini P , Sampson MG , Wilson JF , Frayling T , de Bakker PI , Swertz MA , McCarroll S , Kooperberg C , Dekker A , Altshuler D , Willer C , Iacono W , Ripatti S , Soranzo N , Walter K , Swaroop A , Cucca F , Anderson CA , Myers RM , Boehnke M , McCarthy MI , Durbin R ((2016) ) A reference panel of 64,976 haplotypes for genotype imputation. Nat Genet 48: , 1279–1283. |
[39] | Zhan X , Hu Y , Li B , Abecasis GR , Liu DJ ((2016) ) RVTESTS: an efficient and comprehensive tool for rare variant association analysis using sequence data. Bioinformatics 32: , 1423–1426. |
[40] | Wang K , Li M , Hakonarson H ((2010) ) ANNOVAR: functional annotation of genetic variants from high-throughput sequencing data. Nucleic Acids Res 38: , e164. |
[41] | Gabriel SB , Schaffner SF , Nguyen H , Moore JM , Roy J , Blumenstiel B , Higgins J , DeFelice M , Lochner A , Faggart M , Liu-Cordero SN , Rotimi C , Adeyemo A , Cooper R , Ward R , Lander ES , Daly MJ , Altshuler D ((2002) ) The structure of haplotype blocks in the human genome. Science 296: , 2225–2229. |
[42] | Barrett JC , Fry B , Maller J , Daly MJ ((2005) ) Haploview: analysis and visualization of LD and haplotype maps. Bioinformatics 21: , 263–265. |
[43] | Uhl GR , Drgon T , Johnson C , Walther D , David SP , Aveyard P , Murphy M , Johnstone EC , Munafò MR ((2010) ) Genome-wide association for smoking cessation success: participants in the Patch in Practice trial of nicotine replacement. Pharmacogenomics 11: , 357–367. |
[44] | Lee S , Emond MJ , Bamshad MJ , Barnes KC , Rieder MJ , Nickerson DA , Christiani DC , Wurfel MM , Lin X ((2012) ) Optimal unified approach for rare-variant association testing with application to small-sample case-control whole-exome sequencing studies. Am J Hum Genet 91: , 224–237. |
[45] | Nalls MA , McLean CY , Rick J , Eberly S , Hutten SJ , Gwinn K , Sutherland M , Martinez M , Heutink P , Williams NM , Hardy J , Gasser T , Brice A , Price TR , Nicolas A , Keller MF , Molony C , Gibbs JR , Chen-Plotkin A , Suh E , Letson C , Fiandaca MS , Mapstone M , Federoff HJ , Noyce AJ , Morris H , Van Deerlin VM , Weintraub D , Zabetian C , Hernandez DG , Lesage S , Mullins M , Conley ED , Northover CAM , Frasier M , Marek K , Day-Williams AG , Stone DJ , Ioannidis JPA , Singleton AB , Parkinson’s Disease Biomarkers Program and Parkinson’s Progression Marker Initiative investigators ((2015) ) Diagnosis of Parkinson’s disease on the basis of clinical and genetic classification: a population-based modelling study. , 1002-. Lancet Neurol 14: , 1009. |
[46] | Blauwendraat C , Heilbron K , Vallerga CL , Bandres-Ciga S , von Coelln R , Pihlstrom L , Simon-Sanchez J , Schulte C , Sharma M , Krohn L , Siitonen A , Iwaki H , Leonard H , Noyce AJ , Tan M , Gibbs JR , Hernandez DG , Scholz SW , Jankovic J , Shulman LM , Lesage S , Corvol JC , Brice A , van Hilten JJ , Marinus J , Eerola-Rautio J , Tienari P , Majamaa K , Toft M , Grosset DG , Gasser T , Heutink P , Shulman JM , Wood N , Hardy J , Morris HR , Hinds DA , Gratten J , Visscher PM , Gan-Or Z , Nalls MA , Singleton AB ((2019) ) Parkinson’s disease age at onset genome-wide association study: Defining heritability, genetic loci, and alpha-synuclein mechanisms. Mov Disord 34: , 866–875. |
[47] | Taliun D , Harris DN , Kessler MD , Carlson J , Szpiech ZA , Torres R , Taliun SAG , Corvelo A , Gogarten SM , Kang HM , et al. ((2021) ) Sequencing of 53,831 diverse genomes from the NHLBI TOPMed Program. Nature 590: , 290–299. |
[48] | Schapira AHV , Chaudhuri KR , Jenner P ((2017) ) Non-motor features of Parkinson disease. Nat Rev Neurosci 18: , 435–450. |
[49] | Kashihara K ((2006) ) Weight loss in Parkinson’s disease. , Vii. J Neurol 253 Suppl 7: , 38–41. |
[50] | Pandey S , Srivanitchapoom P ((2017) ) Levodopa-induced dyskinesia: clinical features, pathophysiology, and medical management. Ann Indian Acad Neurol 20: , 190–198. |
[51] | Freire C , Koifman S ((2012) ) Pesticide exposure and Parkinson’s disease: Epidemiological evidence of association. Neurotoxicology 33: , 947–971. |
[52] | KEMI, KEMI, Statistics on pesticides, Swedish Chemicals Agency, https://www.kemi.se/en/statistics-on-chemicalsin-sweden/statistics-on-pesticides, November 27 2020, Accessed May 5 2021. |
[53] | Sellbach AN , Boyle RS , Silburn PA , Mellick GD ((2006) ) Parkinson’s disease and family history. Parkinsonism Relat Disord 12: , 399–409. |
[54] | Marras C , Hincapié CA , Kristman VL , Cancelliere C , Soklaridis S , Li A , Borg J , af Geijerstam JL , Cassidy JD ((2014) ) Systematic reviewof the risk of Parkinson’s disease after mild traumatic braininjury: results of the International Collaboration on Mild TraumaticBrain Injury Prognosis. Arch Phys Med Rehabil 95: , S238–244. |
[55] | Jafari S , Etminan M , Aminzadeh F , Samii A ((2013) ) Head injury and risk of Parkinson disease: a systematic review and meta-analysis. Mov Disord 28: , 1222–1229. |
[56] | Holm H , Jarvis MJ , Russell MA , Feyerabend C ((1992) ) Nicotine intake and dependence in Swedish snuff takers. Psychopharmacology (Berl) 108: , 507–511. |
[57] | Yang F , Pedersen NL , Ye W , Liu Z , Norberg M , Forsgren L , Trolle Lagerros Y , Bellocco R , Alfredsson L , Knutsson A , Jansson JH , Wennberg P , Galanti MR , Lager ACJ , Araghi M , Lundberg M , Magnusson C , Wirdefeldt K ((2017) ) Moist smokeless tobacco (Snus) use and risk of Parkinson’s disease. Int J Epidemiol 46: , 872–880. |
[58] | Tobacco, Public Health Agency of Sweden, https://www.folkhalsomyndigheten.se/the-public-health-agency-of-sweden/living-conditions-and-lifestyle/alcohol-narcotics-doping-tobacco-and-gambling/tobacco/, June 28 2019, Accessed April 20. |
[59] | Quik M ((2004) ) Smoking, nicotine and Parkinson’s disease. Trends Neurosci 27: , 561–568. |
[60] | Hou L , Li Q , Jiang L , Qiu H , Geng C , Hong J-S , Li H , Wang Q ((2018) ) Hypertension and diagnosis of Parkinson’s disease: a meta-analysis of cohort studies. Front Neurol 9: , 162–162. |
[61] | Jiang Z , Xu X , Gu X , Ou R , Luo X , Shang H , Song W ((2020) ) Effects of higher serum lipid levels on the risk of Parkinson’s disease: a systematic review and meta-analysis. Front Neurol 11: , 597. |
[62] | Yan J , Qiao L , Tian J , Liu A , Wu J , Huang J , Shen M , Lai X ((2019) ) Effect of statins on Parkinson’s disease: A systematic review and meta-analysis. Medicine (Baltimore) 98: , e14852. |
[63] | Jones JD , Malaty I , Price CC , Okun MS , Bowers D ((2012) ) Health comorbidities and cognition in 1948 patients with idiopathic Parkinson’s disease. Parkinsonism Relat Disord 18: , 1073–1078. |
[64] | Rugbjerg K , Friis S , Jørgensen TL , Ritz B , Korbo L , Olsen JH ((2010) ) Risk for Parkinson’s disease among patients with osteoarthritis: a Danish cohort study. Mov Disord 25: , 2355–2360. |
[65] | Gao X , Chen H , Schwarzschild MA , Ascherio A ((2011) ) Use of ibuprofen and risk of Parkinson disease. Neurology 76: , 863–869. |
[66] | Brakedal B , Tzoulis C , Tysnes OB , Haugarvoll K ((2021) ) NSAID use is not associated with Parkinson’s disease incidence: A Norwegian Prescription Database study. PLoS One 16: , e0256602. |
[67] | Zhang X , Zhang L , Lin B , Chai X , Li R , Liao Y , Deng X , Liu Q , Yang W , Cai Y , Zhou W , Lin Z , Huang W , Zhong M , Lei F , Wu J , Yu S , Li X , Li S , Li Y , Zeng J , Long W , Ren D , Huang Y ((2017) ) Phospholipid Phosphatase 4 promotes proliferation and tumorigenesis, and activates Ca(2+)-permeable Cationic Channel in lung carcinoma cells. Mol Cancer 16: , 147. |
[68] | Simón-Sánchez J , van Hilten JJ , van de Warrenburg B , Post B , Berendse HW , Arepalli S , Hernandez DG , de Bie RM , Velseboer D , Scheffer H , Bloem B , van Dijk KD , Rivadeneira F , Hofman A , Uitterlinden AG , Rizzu P , Bochdanovits Z , Singleton AB , Heutink P ((2011) ) Genome-wide association study confirms extant PD risk lociamong the Dutch. Eur J Hum Genet 19: , 655–661. |
[69] | Nalls MA , Pankratz N , Lill CM , Do CB , Hernandez DG , Saad M , DeStefano AL , Kara E , Bras J , Sharma M , Schulte C , Keller MF , Arepalli S , Letson C , Edsall C , Stefansson H , Liu X , Pliner H , Lee JH , Cheng R ; International Parkinson’s Disease Genomics Consortium (IPDGC); Parkinson’s Study Group (PSG) Parkinson’s Research: The Organized GENetics Initiative (PROGENI); 23andMe; GenePD; NeuroGenetics Research Consortium (NGRC); Hussman Institute of Human Genomics (HIHG); Ashkenazi Jewish Dataset Investigator; Cohorts for Health and Aging Research in Genetic Epidemiology (CHARGE); North American Brain Expression Consortium (NABEC); United Kingdom Brain Expression Consortium (UKBEC); Greek Parkinson’s Disease Consortium; Alzheimer Genetic Analysis Group Ikram MA , Ioannidis JP , Hadjigeorgiou GM , Bis JC , Martinez M , Perlmutter JS , Goate A , Marder K , Fiske B , Sutherland M , Xiromerisiou G , Myers RH , Clark LN , Stefansson K , Hardy JA , Heutink P , Chen H , Wood NW , Houlden H , Payami H , Brice A , Scott WK , Gasser T , Bertram L , Eriksson N , Foroud T , Singleton AB ((2014) ) Large-scale meta-analysis of genome-wide association data identifies six new risk loci for Parkinson’s disease. Nat Genet 46: , 989–993. |
[70] | Fanning S , Selkoe D , Dettmer U ((2020) ) Parkinson’s disease: proteinopathy or lipidopathy? . NPJ Parkinsons Dis 6: , 3. |
[71] | Puschmann A , Jiménez-Ferrer I , Lundblad-Andersson E , Mårtensson E , Hansson O , Odin P , Widner H , Brolin K , Mzezewa R , Kristensen J , Soller M , Rödström EY , Ross OA , Toft M , Breedveld GJ , Bonifati V , Brodin L , Zettergren A , Sydow O , Linder J , Wirdefeldt K , Svenningsson P , Nissbrandt H , Belin AC , Forsgren L , Swanberg M ((2019) ) Low prevalence of known pathogenic mutations indominant PD genes: A Swedish multicenter study. ParkinsonismRelat Disord 66: , 158–165. |
[72] | Tolosa E , Vila M , Klein C , Rascol O ((2020) ) LRRK2 in Parkinson disease: challenges of clinical trials. Nat Rev Neurol 16: , 97–107. |


