
Effects of a Highly Challenging Balance Training Program on Motor Function and Brain Structure in Parkinson’s Disease
Abstract
Background:
Parkinson’s disease (PD) is characterized by motor deficits and brain alterations having a detrimental impact on balance, gait, and cognition. Intensive physical exercise can induce changes in the neural system, potentially counteracting neurodegeneration in PD and improving clinical symptoms.
Objective:
This randomized controlled trial investigated effects of a highly challenging, cognitively demanding, balance and gait training (HiBalance) program in participants with PD on brain structure.
Methods:
95 participants were assigned to either the HiBalance or an active control speech training program. The group-based interventions were performed in 1-hour sessions, twice per week over a 10-week period. Participants underwent balance, gait, cognitive function, and structural magnetic resonance imaging assessments before and after the interventions. Voxel-based morphometry was analyzed in 34 HiBalance and 31 active controls. Additionally, structural covariance networks were assessed.
Results:
There was no significant time by group interaction between the HiBalance and control training in balance, gait, or brain volume. Within-HiBalance-group analyses showed higher left putamen volumes post-training. In repeated measures correlation a positive linear, non-significant relationship between gait speed and putamen volume was revealed. In the HiBalance group we found community structure changes and stronger thalamic-cerebellar connectivity in structural covariance networks. Neither brain volume changes nor topology changes were found for the active controls after the training.
Conclusion:
Thus, subtle structural brain changes occur after balance and gait training. Future studies need to determine whether training modifications or other assessment methods lead to stronger effects.
INTRODUCTION
Parkinson’s disease (PD) is associated with brain atrophy, network changes, and motor deficits that have a detrimental impact on gait, balance as well as cognition. To this date, no effective treatment without side effects has been found for PD, thus there is an urgent need to develop new therapies that maintain and improve the quality of life of patients. Neural system level changes through physical exercise could be used as a method to counteract potential neurodegenerative processes related to PD [1].
Studies have shown that physical exercise is associated with improved motor function in animal models of PD [2]. However, despite these encouraging results, studies investigating effects on the neural system of physical exercise targeting balance and gait deficits in human participants are rare, especially in PD [3]. For instance, a previous balance exercise study in participants with PD showed improved balance performance and gray matter volume changes after six weeks of training in comparison to healthy controls [1]. Participants were scanned after each training session throughout the training period. Of note, an overall training effect in the right cerebellum was revealed showing a time-dependent linear gray matter volume increase. Further, both increases and decreases occurred in gray matter volume in the right parietal, temporal, and lingual gyri during the intervention period. To our knowledge, there are no other studies assessing structural brain changes related to gait and balance exercise in participants with PD, although literature exist in other populations such as elderly and Alzheimer’s disease [4, 5]. In another study, 59 healthy, but sedentary, participants between 60–79 years were enrolled in a six-month randomized controlled trial (RCT) to compare an aerobic training with an active control group [4]. The aerobic training group showed gray matter volume increases in the left anterior cingulate, supplementary motor cortex, right inferior frontal gyrus, and left superior temporal gyrus in comparison to the control group. In contrast, Frederiksen et al. [5] found no training effect of an intensive aerobic exercise on brain plasticity in 21 participants with Alzheimer’s disease in an RCT. Even though there was no training effect, exercise load correlated with increased hippocampal volume and frontal cortical thickness after 16 weeks of training. These aforementioned studies measured volumetric changes, but we are not aware of any studies investigating connectivity changes related to balance and gait exercises.
Behavioral effects of physical exercises have been established in research, clinical as well as home-based settings [6–8]. The framework of our HiBalance training has been shown to positively effect gait and balance performance in participants with PD [7, 8]. Further, van der Kolk et al. [6] found increased physical activity and decreased motor severity, but no changes in balance performance, in participants with PD after a home-based aerobic training when compared to an active control group.
Altogether, the results from previous studies on balance and physical exercise among different participant groups show varying results, with some reporting a behavioral effect, whereas others show changes in structural magnetic resonance imaging (MRI) measures in the absence of behavioral improvement. To further explore the benefits of gait and balance exercise on motor function, cognitive performance, and brain structure in PD, we conducted an RCT with a double-blinded design: EXPANd Trial - EXercise in PArkinson’s disease and Neuroplasticity [9]. We applied a highly challenging balance and gait training program (HiBalance), which previously showed an improvement on gait, balance, and cognition [8, 10].
Our aim was to investigate structural brain alterations due to the HiBalance program in comparison to an active control group in a cohort of participants with mild to moderate PD. We hypothesized that after receiving the highly challenging exercise training, participants would show increases of gray matter volume in motor and cognitive-related brain areas, defined by whole-brain analyses and regions of interest (ROI), compared to an active control group. Further, we hypothesized that improvements in variables measuring the efficacy of the training would correlate with structural MRI changes. Finally, we explored the brain connectivity changes in structural covariance network analyses after the intervention.
METHODS
Study design
Data was acquired within the framework of the randomized controlled EXPANd trial and a detailed description can be found elsewhere [9]. In brief, main inclusion criteria for participants were mild to moderate disease stage of idiopathic PD, a Hoehn & Yahr stage between 2, 3, age≧60 years, and a Montreal Cognitive Assessment (MoCA) score≧21. Participants with PD were randomly assigned to either the HiBalance program (physical exercise) or to an active control group program addressing speech and communication. The interventions took place in small groups of 5–8 participants, two times a week, in 1 h sessions for 10 weeks. Additionally, a 1 h weekly home exercise program was also performed for both programs. The participants underwent a comprehensive assessment of balance/gait, speech/communication, motor functions, a neuropsychological test battery, and structural MRI 1–3 weeks before and after the interventions.
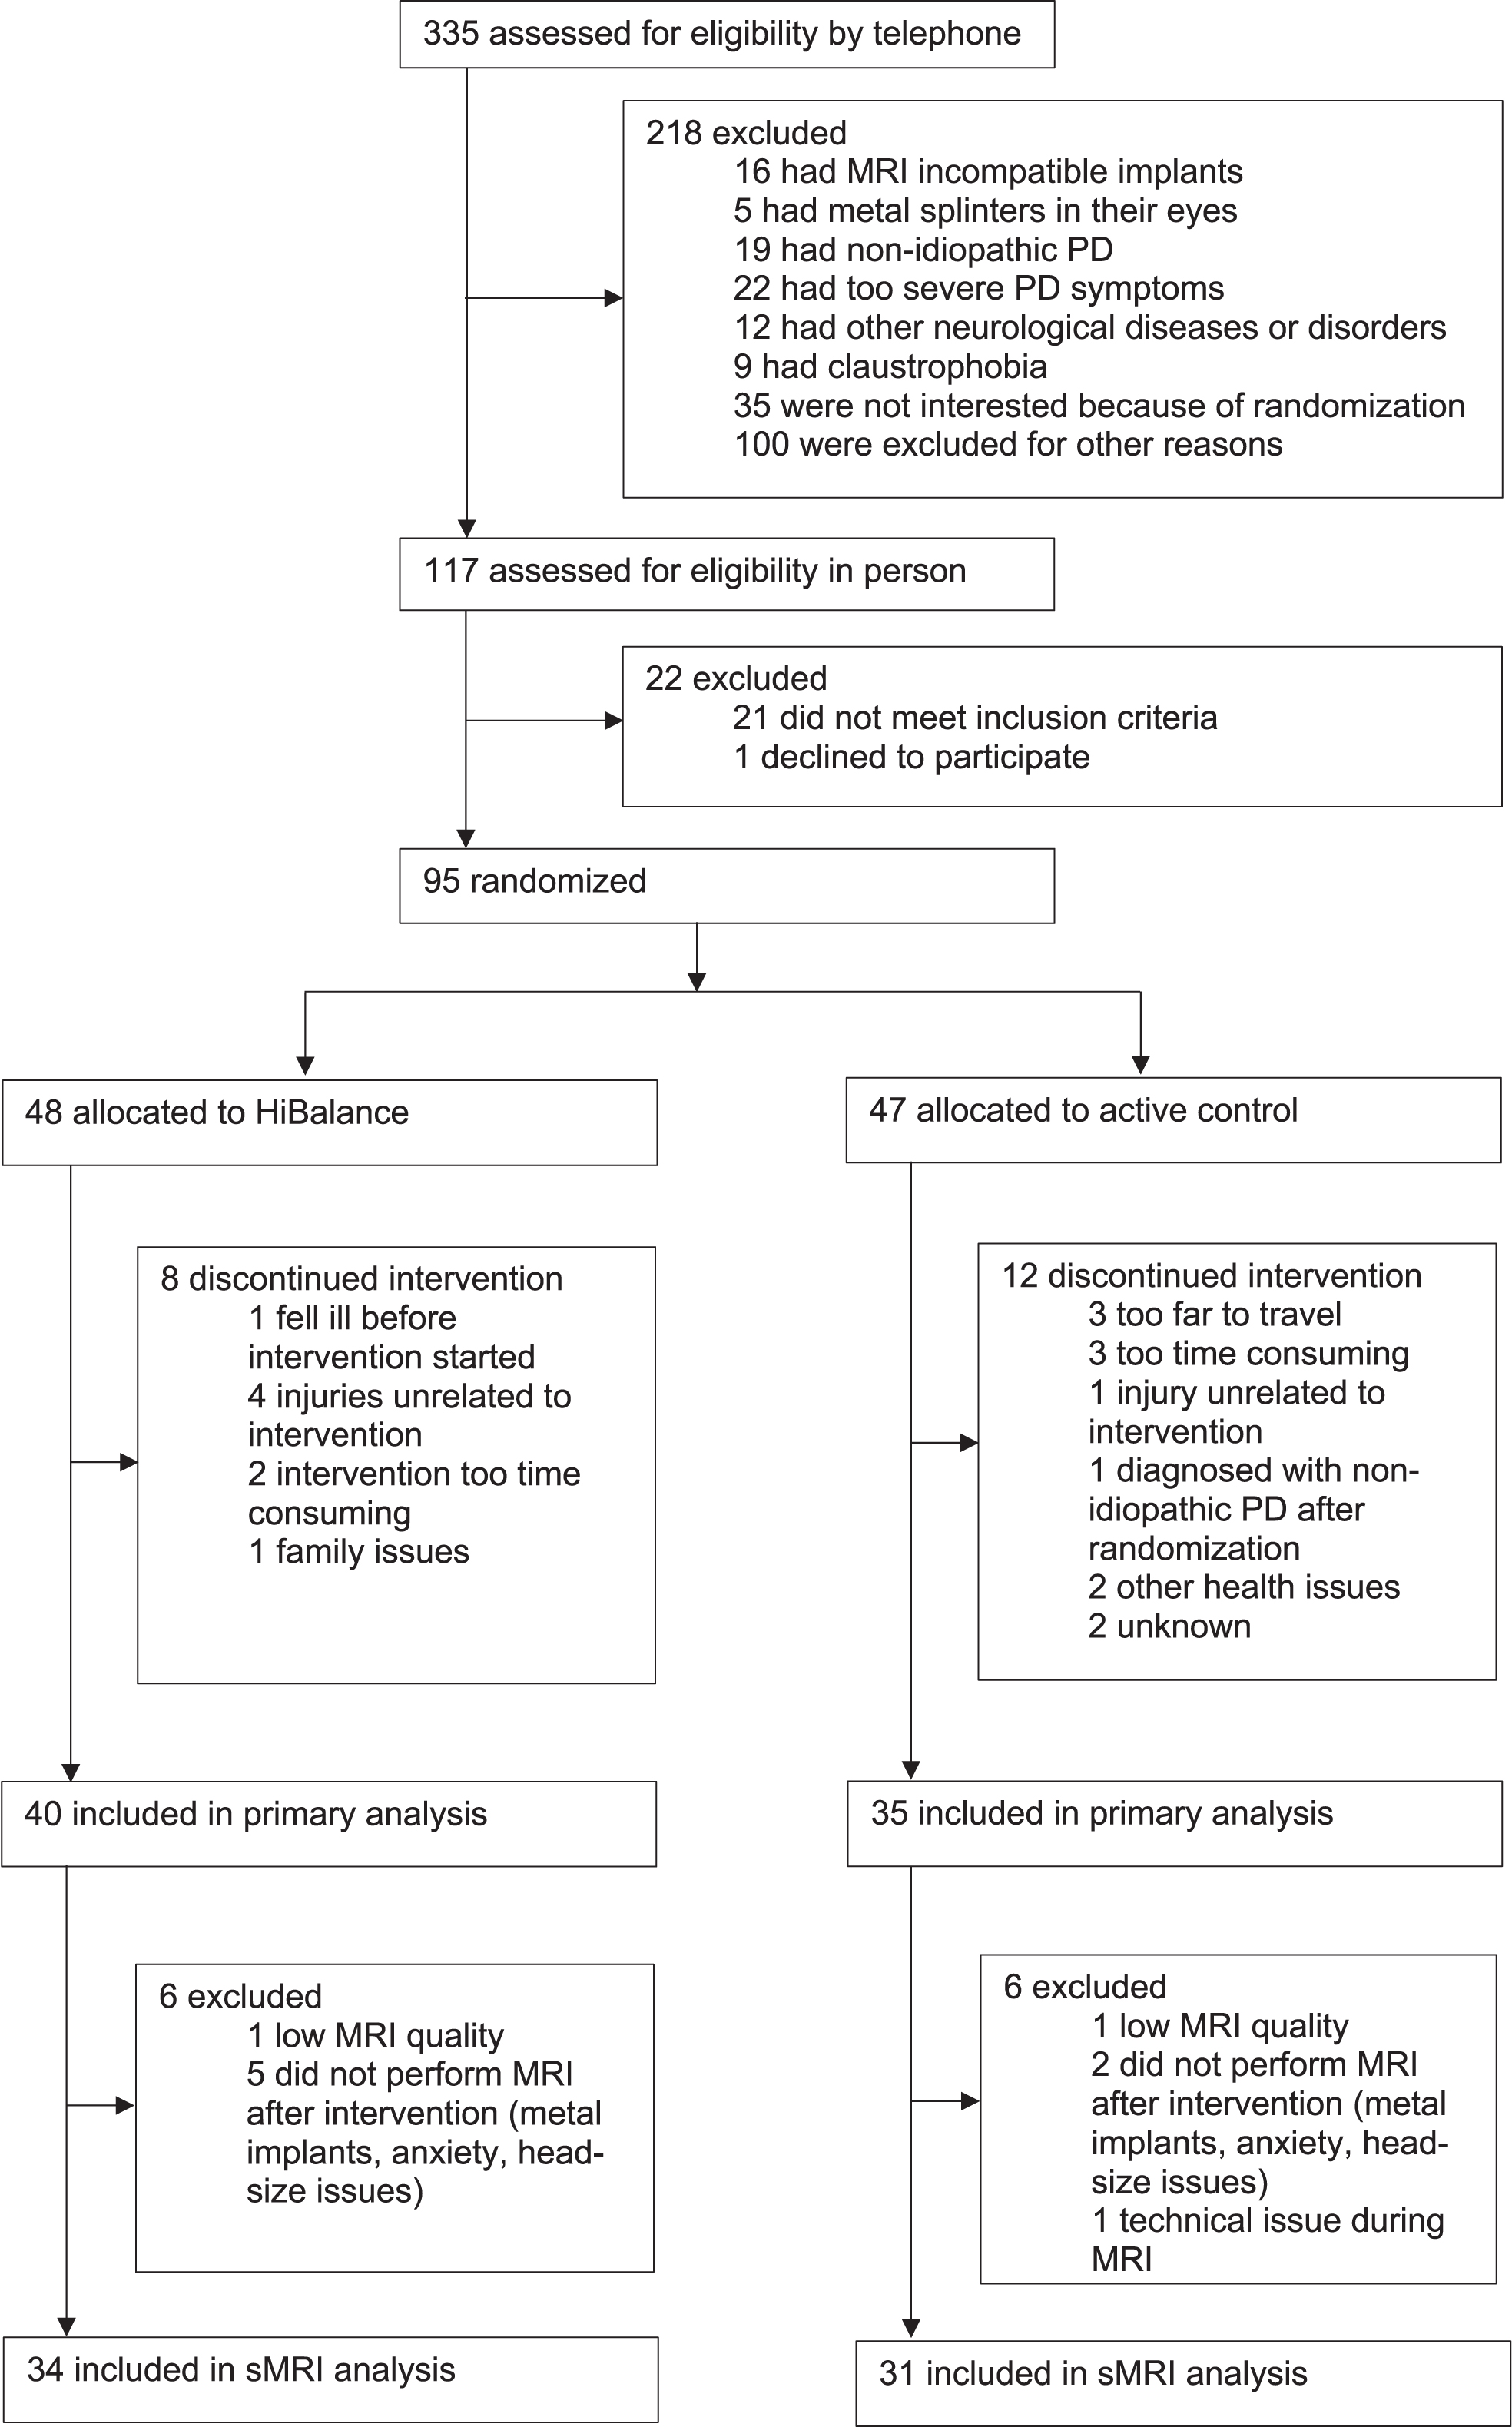
A group of 95 participants with PD were included in the original RCT. However, due to dropouts, technical issues, and MRI contraindications only 65 participants with longitudinal data were analyzed (Fig. 1). During the data collection, all actively involved assessors were blinded to the assignment of intervention groups. Only authors performing the analyses were unblinded for this study in two steps. First, for analyses, the group allocation was revealed, assigning random names for the groups. Second, for discussing the results, the actual training program was assigned to the groups.
Fig. 1
Flow chart of stepwise exclusion of participants for the longitudinal sMRI cohort of the EXPANd trial. PD, Parkinson’s disease; sMRI, structural magnetic resonance imaging.
Balance, gait, motor, and cognitive assessments
To assess balance performance, the Mini Balance Evaluation Systems Test score (Mini-BESTest) was applied before and after training. This test is a validated scale for individuals with PD [11]. In our study, the total Mini-BESTest score is the main behavioral outcome of the efficacy of the HiBalance program.
Gait speed was assessed before and after the intervention using an electronic walkway system (GAITRite®, active zone: 8.3 m, CIR Systems, Inc., Havertown, PA, USA). Participants walked six times back and forth on the walkway at a self-selected speed. To ensure a steady state walking, we accounted for acceleration and deceleration phases by instructing participants to start walking 3 m before and stop 3 m after the end of the walkway.
We applied the Movement Disorders Society Unified Parkinson’s Disease Rating Scale (MDS-UPDRS) to characterize disease-related symptoms before and after the interventions. The motor scale (III) and total score were used to describe the cohort. Motor phenotypes of tremor dominant (TD) and postural instability/gait difficulty (PIGD) PD were assessed based on the criteria from Stebbins et al. [12] using ratios of items of the MDS-UPDRS. Participants that fall in between the criteria were classified as ‘indetermined’.
All participants underwent a comprehensive cognitive test battery including the Delis-Kaplan Executive Function System (D-KEFS) [13], the Wechsler Adult Intelligence Scale-Fourth Edition (WAIS-IV) [14], the Ray Auditory Verbal Learning Test (RAVLT) [15], and Brief Visuospatial Memory Test-Revised (BVMT-R) [16].
PD mild cognitive impairment (PD-MCI) status was calculated according to the criteria of Litvan et al. [17] level 2 category using two tests from the above-mentioned test battery within each of the five cognitive domains. For the domain of executive function, trial 4 from Color-Word Interference Test and trial 2 from verbal fluency (semantic fluency) were used. The attention/working memory domain was calculated from digit span (total score) and trial 4 of Trail Making Test. The episodic memory domain consisted of the delayed recall from RAVLT and BVMT-R. For the visuospatial domain the Copy condition from BVMT-R and the wire cube subtest from MoCA were used. Here, the wire cube scoring was recalculated according to Addenbrooke’s cognitive examination scoring [18], i.e., from 0, 1 to now 0–2, using normative data from Charernboon et al. [19] as comparison. For the BVMT-R Copy condition normative values from Romero et al. [20] were used. The language domain consisted of Naming and Sentences subtests from MoCA and normative data from Borland et al. [21] was applied. The performance in the ten test scales was compared to normative mean values setting the cutoff for PD-MCI <1.5 standard deviation above norm.
Imaging acquisition and preprocessing
Structural T1-weighted MRI scans were acquired before and after the interventions on a 3T Phillips Ingenia scanner with a 15 channel headcoil with the following parameters: repetition/ echo time (TR/TE) = 6.1/2.8 ms, 211 slices, 9° flip angle, and voxel-size of 1×1×1 mm.
All scans were preprocessed using the longitudinal pipeline of CAT12 (version 12.7) [22] in SPM12 (version 7771). The longitudinal pipeline accounts for the specifics of intra-subject analysis and is suitable for experiments with short distances between timepoints. First, the baseline and longitudinal images of each subject were registered to their mean image using inverse-consistent realignment. Then, a mean of the realigned images was estimated, segmented, and spatially normalized, while preserving the total amount of gray matter volume. Images were subsequently smoothed with a 12 mm kernel at full-width half-maximum (FWHM). In addition to whole-brain gray matter volume maps, we also extracted the volume of 128 ROIs from the neuromorphometrics atlas.
MRI data quality was evaluated by the measures of weighted overall image quality and sample homogeneity available in CAT12. Quality ratings below ‘sufficient’ indicated, which images to exclude. Further, all segmented images were additionally inspected visually by one author (FA). Two participants were excluded due to head motion artifacts (i.e., ringing). The HiveDB was used for MRI data management [23].
Statistical analyses
Since we analyzed participants that underwent structural MRI within the RCT, which depicts a subsample of the original RCT, comparisons of clinical and demographic variables between the participants with PD of the HiBalance and active control groups were performed using an analysis of variance (ANOVA). To assess time by group interaction effects in balance performance and gait speed between groups, we performed two linear mixed effects model analyses using the main behavioral outcomes balance (Mini-BESTest) and gait speed as the dependent variables. Group (HiBalance versus active controls), time (pre- versus post-intervention), and the interaction of group by time were included as independent variables. We allowed for random intercepts. Secondly, we estimated models with age and sex as fixed effects. These analyses were conducted in R (R Core Team, 2012, version 4.0.2).
To compare whole-brain gray matter volume images and ROIs between groups, a flexible factorial design with the factors group (HiBalance versus active controls) and time (pre- versus post-intervention) was applied in CAT12. In addition, voxel-wise whole-brain regression analyses were carried out in SPM12 on following regressors: balance performance (Mini-BESTest), gait speed, cognitive, and motor phenotype.
According to the recommendation of the CAT12 manual, in a longitudinal design with short timepoints, no covariates need to be included in the flexible factorial model. An average image of normalized and warped (‘mwp1r’) files from all participants was created to use as an explicit mask in the statistical analyses. This mean image was set with a threshold at 0.2 and binarized. Clusters were detected using a voxel-threshold of p < 0.001 and corrected for multiple comparisons using a family-wise error corrected cluster-threshold (FWEc) of p < 0.05. For exploratory analyses, a voxel-threshold of p < 0.001 and a cluster-forming threshold of 100 voxels were applied.
For post-hoc regional clinico-structural regressions, we applied repeated measures correlations between extracted gray matter values and balance as well as gait speed to test for common linear association in paired repeated measures data. Moreover, partial Pearson’s correlations were fitted for pre and post-intervention as well as delta (post-pre) gray matter values and behavioral measures while controlling for total intracranial volume. Both analyses were done in R.
We further analyzed the relationship between the extracted ROIs in the HiBalance and active controls group pre and post-intervention using graph theory analyses with BRAPH (version 1.0.0, Matlab R2019b) [24]. Volume measures extracted from CAT12 were used to define the nodes of the structural covariance networks. The neuromorphometrics atlas was used to construct matrices with 128 nodes. The edges between the nodes were computed by Pearson correlations between every pair of nodes resulting in a representative adjacency matrix for each group. The resulting adjacency matrices were analyzed in two ways. First approach was to construct a weighted undirected graph to obtain the adjacency matrix. Second, we used a binarized undirected graph, which was binarized at a range of thresholds to account for number of connections within the structural covariance networks (0.55–0.75, in steps of 0.1). Negative correlations were set to 0. In these structural covariance networks, community structure was investigated using the Louvain algorithm in a weighted undirected graph [25]. Community structure measures subnetworks in a network, while the Louvain algorithm accounts for maximal within-network and minimal between-network connectivity. We computed nodal degree measures from the binary structural covariance network across the different thresholds. Nodal degree calculates the number of connections of a given node. Non-parametric permutation tests were applied for each density to compare the pre- and post- intervention differences with 1000 permutations.
Ethics
The RCT [9] has been approved by the Regional Ethical Review Board in Stockholm 2016/1264–31/4, 2017/1258–32 and 2017/2445–32. Participants received written and oral information about the study and all assessments, as well as provided written informed consent before the start of the assessments.
Data availability statement
Data was collected within the framework of the EXPANd trial and the study protocol is published [9]. The statistical analysis plan of the current study was preregistered at aspredicted.org and is available together with the behavioral statistics analysis scripts in the Supplement (Supplementary Material 1 and 2). The data generated/analyzed during the current study are not publicly available due to Swedish and EU personal data legislation. Upon reasonable request, data are available from the corresponding author. Sharing of the data will be regulated via a data transfer and user agreement with the recipient.
Deviations from preregistration
We preregistered our hypotheses, methods, and analyses for this project at aspredicted.org (Supplementary Material 1 and 2). We deviated from this protocol and performed additional analyses. Instead of only analyzing single ROIs, we applied the available function in CAT12 and analyzed 128 ROIs within the neuromorphometrics atlas. We did not include analyses on cortical thickness. Further, we did not analyze BDNF because of missing values.
RESULTS
Sample characteristics
The group of 34 PD participants that underwent HiBalance training was characterized by a mean age of 70.3 years (range 61–83) and 5 years (0–16) disease duration (Table 1, Supplementary Table 1). The 31 PD participants of the active control group were characterized by an age of 70.5 years (61–82) and 5 years (1–15) disease duration. Demographic variables did not differ significantly between the groups (Table 1).
Table 1
Demographic and clinical characteristics of included participants with Parkinson’s disease before and after the training program
| HiBalance | Active | Total | p | |
| (N = 34) | Control Group | (N = 65) | ||
| (N = 31) | ||||
| Age, y | 0.900 | |||
| Mean (SD) | 70.26 (5.82) | 70.45 (6.11) | 70.35 (5.92) | |
| Range | 61.00–83.00 | 61.00–82.00 | 61.00–83.00 | |
| Sex | 0.638 | |||
| Male | 20 (58.8%) | 20 (64.5%) | 40 (61.5%) | |
| Female | 14 (41.2%) | 11 (35.5%) | 25 (38.5%) | |
| Disease duration, y | 0.245 | |||
| Mean (SD) | 5.71 (4.55) | 4.52 (3.49) | 5.14 (4.09) | |
| Range | 0–16.00 | 1.00–15.00 | 0–16.00 | |
| Levodopa equivalent dose | 0.072 | |||
| Mean (SD) | 610.50 (355.83) | 458.30 (293.26) | 536.85 (333.33) | |
| Range | 0.00–1324.00 | 0.00–1224.00 | 0.00–1324.00 | |
| Hoehn &Yahr | 0.401 | |||
| Mean (SD) | 2.12 (0.33) | 2.20 (0.41) | 2.16 (0.37) | |
| Range | 2.00–3.00 | 2.00–3.00 | 2.00–3.00 | |
| MDS-UPDRS scale III | 0.235 | |||
| Mean (SD) | 31.55 (12.91) | 28.03 (10.00) | 29.87 (11.66) | |
| Range | 10.00–70.00 | 11.00–50.00 | 10.00–70.00 | |
| MDS-UPDRS total score | 0.245 | |||
| Mean (SD) | 52.30 (20.79) | 46.77 (16.06) | 49.67 (18.75) | |
| Range | 22.00–110.00 | 22.00–84.00 | 22.00–110.00 | |
| MoCA total score | 0.768 | |||
| Mean (SD) | 26.12 (2.61) | 25.93 (2.41) | 26.03 (2.49) | |
| Range | 21.00–30.00 | 22.00–30.00 | 21.00–30.00 | |
| Mini-BESTest pre | 0.589 | |||
| Mean (SD) | 21.09 (3.70) | 21.57 (3.19) | 21.32 (3.45) | |
| Range | 14.00–27.00 | 14.00–27.00 | 14.00–27.00 | |
| Mini-BESTest post | 0.912 | |||
| Mean (SD) | 22.12 (3.26) | 22.03 (3.11) | 22.08 (3.16) | |
| Range | 11.00–27.00 | 14.00–26.00 | 11.00–27.00 | |
| Gait speed pre, m/s | 0.988 | |||
| Mean (SD) | 1.23 (0.18) | 1.23 (0.20) | 1.23 (0.19) | |
| Range | 0.82–1.51 | 0.77–1.56 | 0.77–1.56 | |
| Gait speed post, m/s | 0.292 | |||
| Mean (SD) | 1.28 (0.16) | 1.24 (0.21) | 1.26 (0.18) | |
| Range | 1.08–1.69 | 0.85–1.60 | 0.85–1.69 |
p-values of the baseline values obtained by analysis of variance test (ANOVA). Mini-BESTest, Mini Balance Evaluation Systems Test; MoCA, Montreal Cognitive Assessment score; SD, standard deviation; y, years.
Effects of training on motor function
The linear mixed models did not show significant interactions between group and time in balance performance and gait speed, but there was a significant main effect on gait speed, which increased over time in both groups (beta = 0.15, standard error = 2.09, p = 0.010, Supplementary Table 3). When controlling for age and gender as fixed effects in a second analysis, none of the observed effects changed.
Effects of training on brain volumes
There were no significant interactions between group and time in gray matter volume in whole-brain or ROI analyses, after adjusting for multiple comparisons (FWEc p < 0.05 and voxel-threshold p < 0.001).
No significant correlations were found using FWEc < 0.05 and voxel threshold p < 0.001 between the whole-brain gray matter volume maps and variables of balance performance (MiniBESTest), gait speed, or cognitive/motor phenotype.
Exploratory analyses and training effects on structural covariance networks
Since we hypothesized effects of the HiBalance training on gray matter structure, we explored the whole-brain at an uncorrected voxel-threshold of p < 0.001 with a cluster forming threshold of 100 voxels. When comparing both groups over time, the main effect of time showed differences in gray matter volume bilaterally in the inferior temporal gyrus and thalamus, in the right hemisphere, the precuneus/cuneus and, on the left side, the middle temporal and inferior occipital gyrus, cerebellum exterior, posterior cingulate gyrus, and posterior insula/transverse temporal gyrus (Supplementary Table 4). We then explored within-group gray matter volume changes. For within-active-control-group analyses, we found higher gray matter volume pre-intervention when compared to post-intervention in the left cerebellum exterior, middle temporal gyrus, inferior occipital gyrus, and anterior cingulate gyrus (Supplementary Table 4). Further, in the right hemisphere gray matter volume was higher before than after the intervention in the thalamus, supplementary motor cortex, precuneus/cuneus, inferior temporal gyrus, lingual gyrus/hippocampus, and superior occipital gyrus. There were no increases after the intervention. Moreover, performing within-HiBalance-group analyses, there was no lower gray matter before the intervention, but we found increases in gray matter volume in the left putamen after the training (Fig. 2, Table 2).
Fig. 2
Increased gray matter volume in the HiBalance cohort compared before and after the training. Cluster is uncorrected for multiple comparisons, p < 0.001 with a cluster forming threshold of k = 100 voxels. L left.
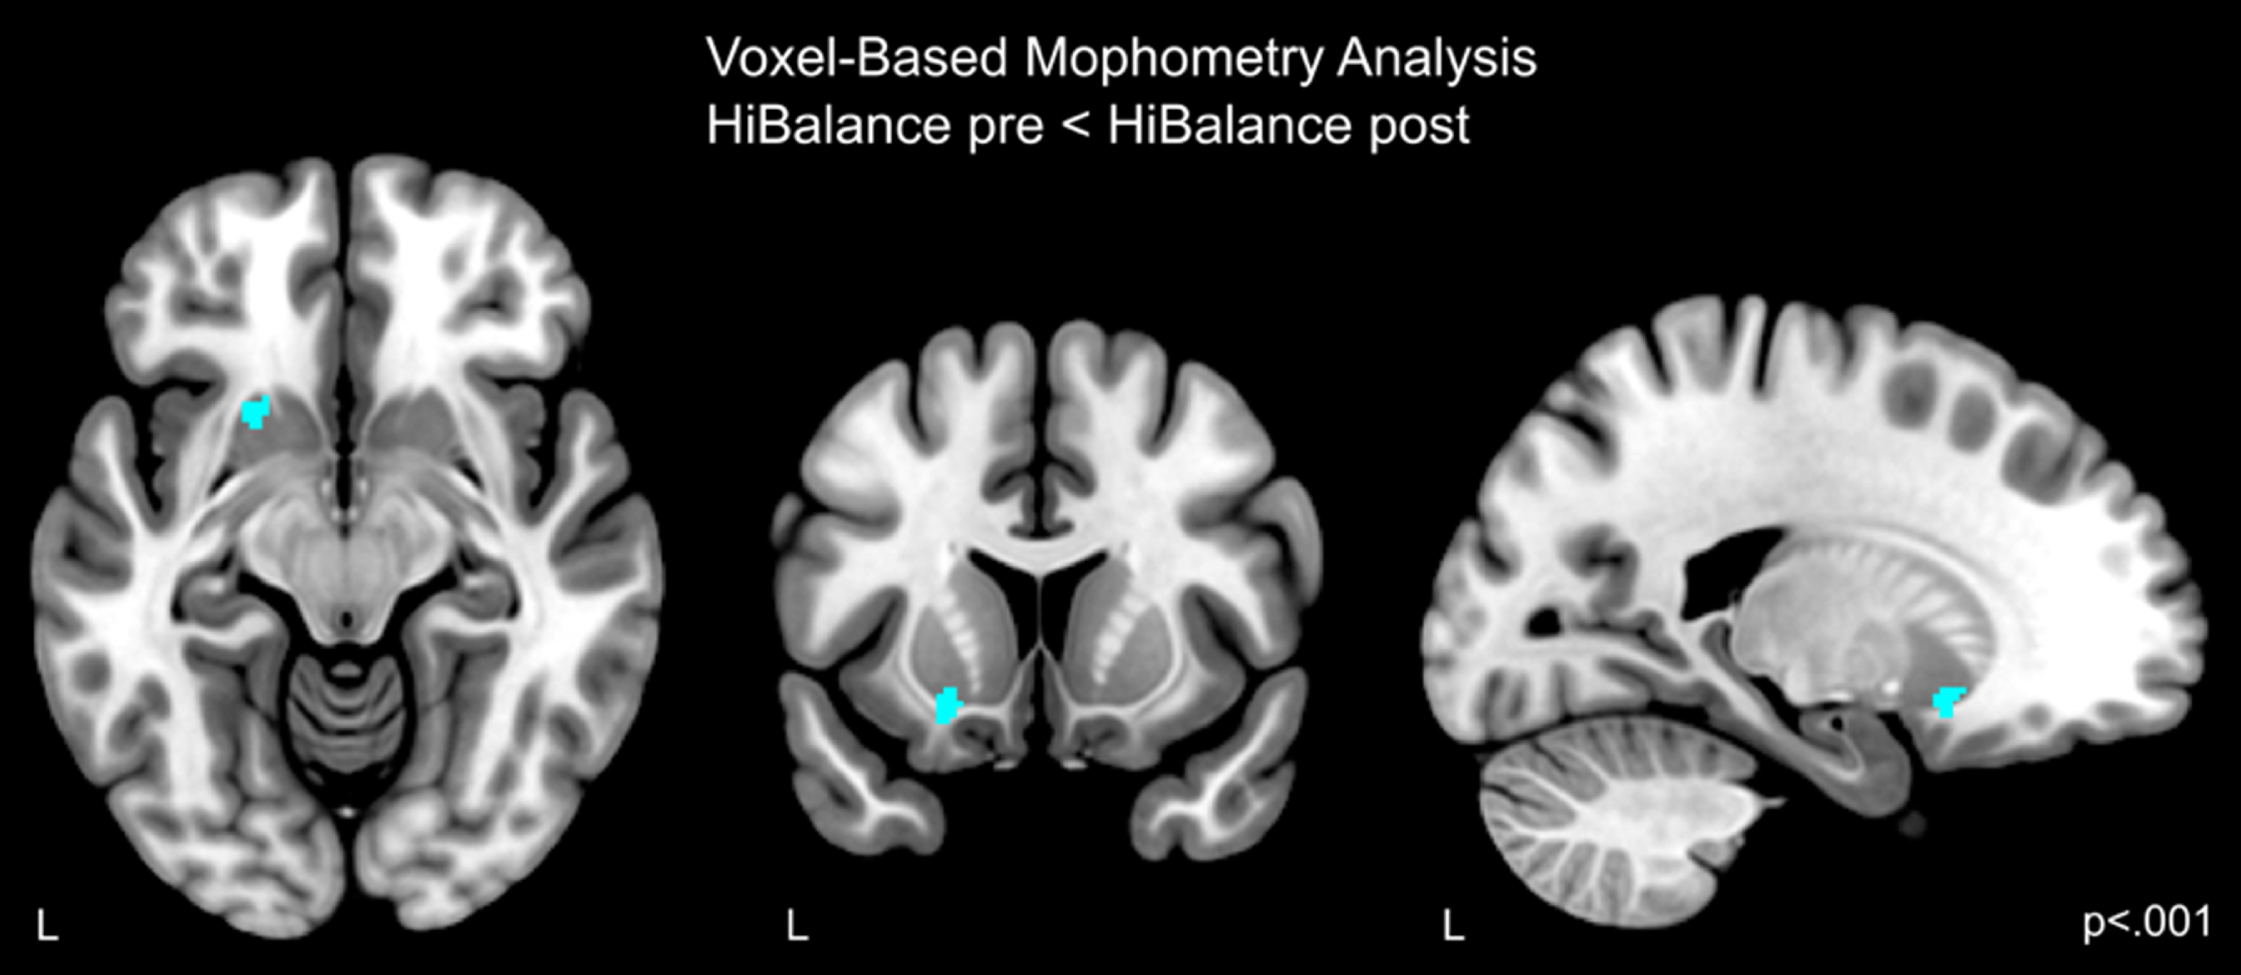
Table 2
Coordinates of brain structure alterations
| Cluster p (FWE) | Voxels | T | Z | Peak p | x,y,z | Anatomical Region |
| (uncorrected) | ||||||
| VBM HiBalancepre < post, p < 0.001, k = 100 | ||||||
| 0.702 | 163 | 3.89 | 3.67 | <0.001 | –20 14 –12 | Left putamen |
FWE, family-wise error rate; VBM, voxel-based morphometry.
To assess whether the putamen volume increases in the HiBalance group were associated with changes on structural covariance, we built a network for each group and timepoint using the areas of the neuromorphometrics atlas as nodes and Pearson correlations between gray matter areas as the edges or connections. These analyses showed that there were significant increases in connectivity strength between the bilateral thalami and the right cerebellum in the HiBalance group at several network thresholds (0.55–0.75, false discovery rate (FDR) = 0.6, Fig. 3), but not for the active controls group. Additionally, we found that the left putamen community in the HiBalance training group changed from a frontotemporal network (encompassing orbital, angular, and temporal gyrus) to a more temporoparietal network (including temporal and occipital gyrus) (Fig. 4, Supplementary Table 5). Nodes (i.e., brain regions) that were stable from pre- to post-intervention were the bilateral nucleus accumbens, right putamen, bilateral posterior insulae, bilateral basal cerebrum/ forebrain, bilateral subcallosal area, and left planum temporale. Pre-intervention, additionally to the aforementioned nodes, 35 nodes built the left putamen community. Post-intervention, additionally to the aforementioned nodes, 21 nodes built the left putamen community, which pre-to-post comprises a 69,56% change.
Fig. 3
Nodal degree in the HiBalance cohort. Left side: changes in degree significant in three nodes (turquoise). In red are the connections shown that differed between before and after the HiBalance training program. Right side: diagram showing number of connections of the significant nodes before and after the training program. R, right; L, left.
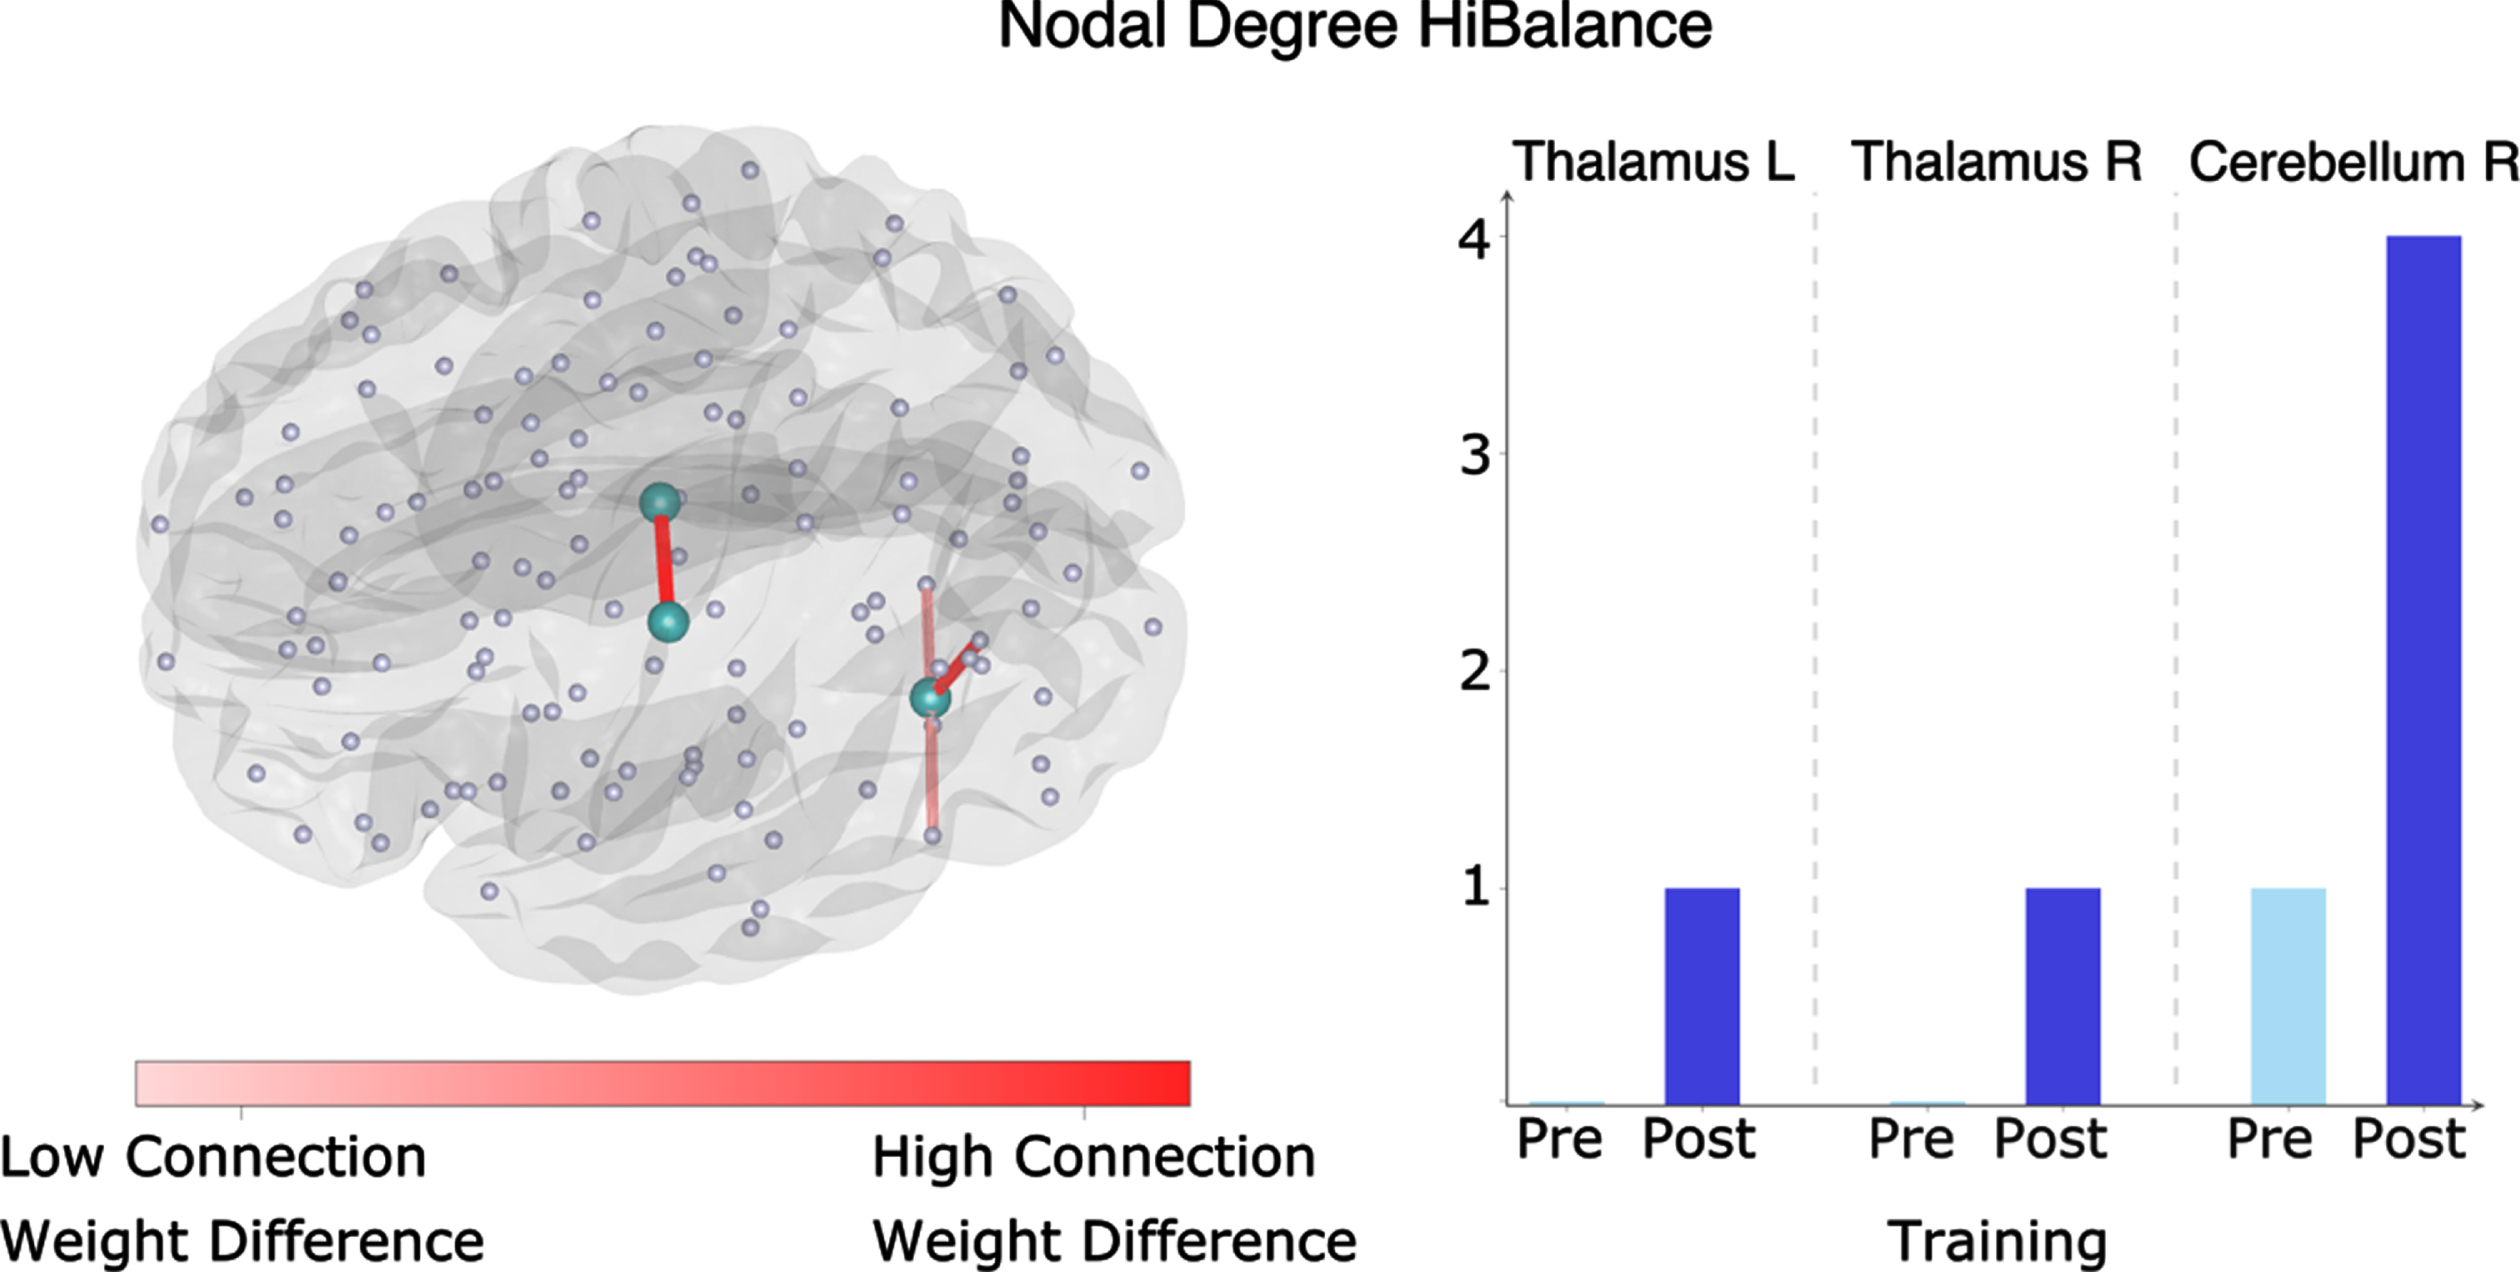
Fig. 4
Graph theory measures in the HiBalance training program cohort (left and middle column) and active control group (right column). Changes in community structure from pre to post- training program within the HiBalance cohort (left and middle column). There were no changes in the active control group (right column). The red dot with a black border shows the left putamen, which showed increased volume after training in the HiBalance cohort. Communities are depicted in different colors. Red dots show the community the left putamen belongs to (switching from community 2 pre-training to community 1 post-training). Community 1 is shown in purple pre-training and in red post-training. Community 2 is red pre-training and blue post-training. Community 3 is depicted in green. Community 4 is shown in blue pre-training and purple after-training. L left.
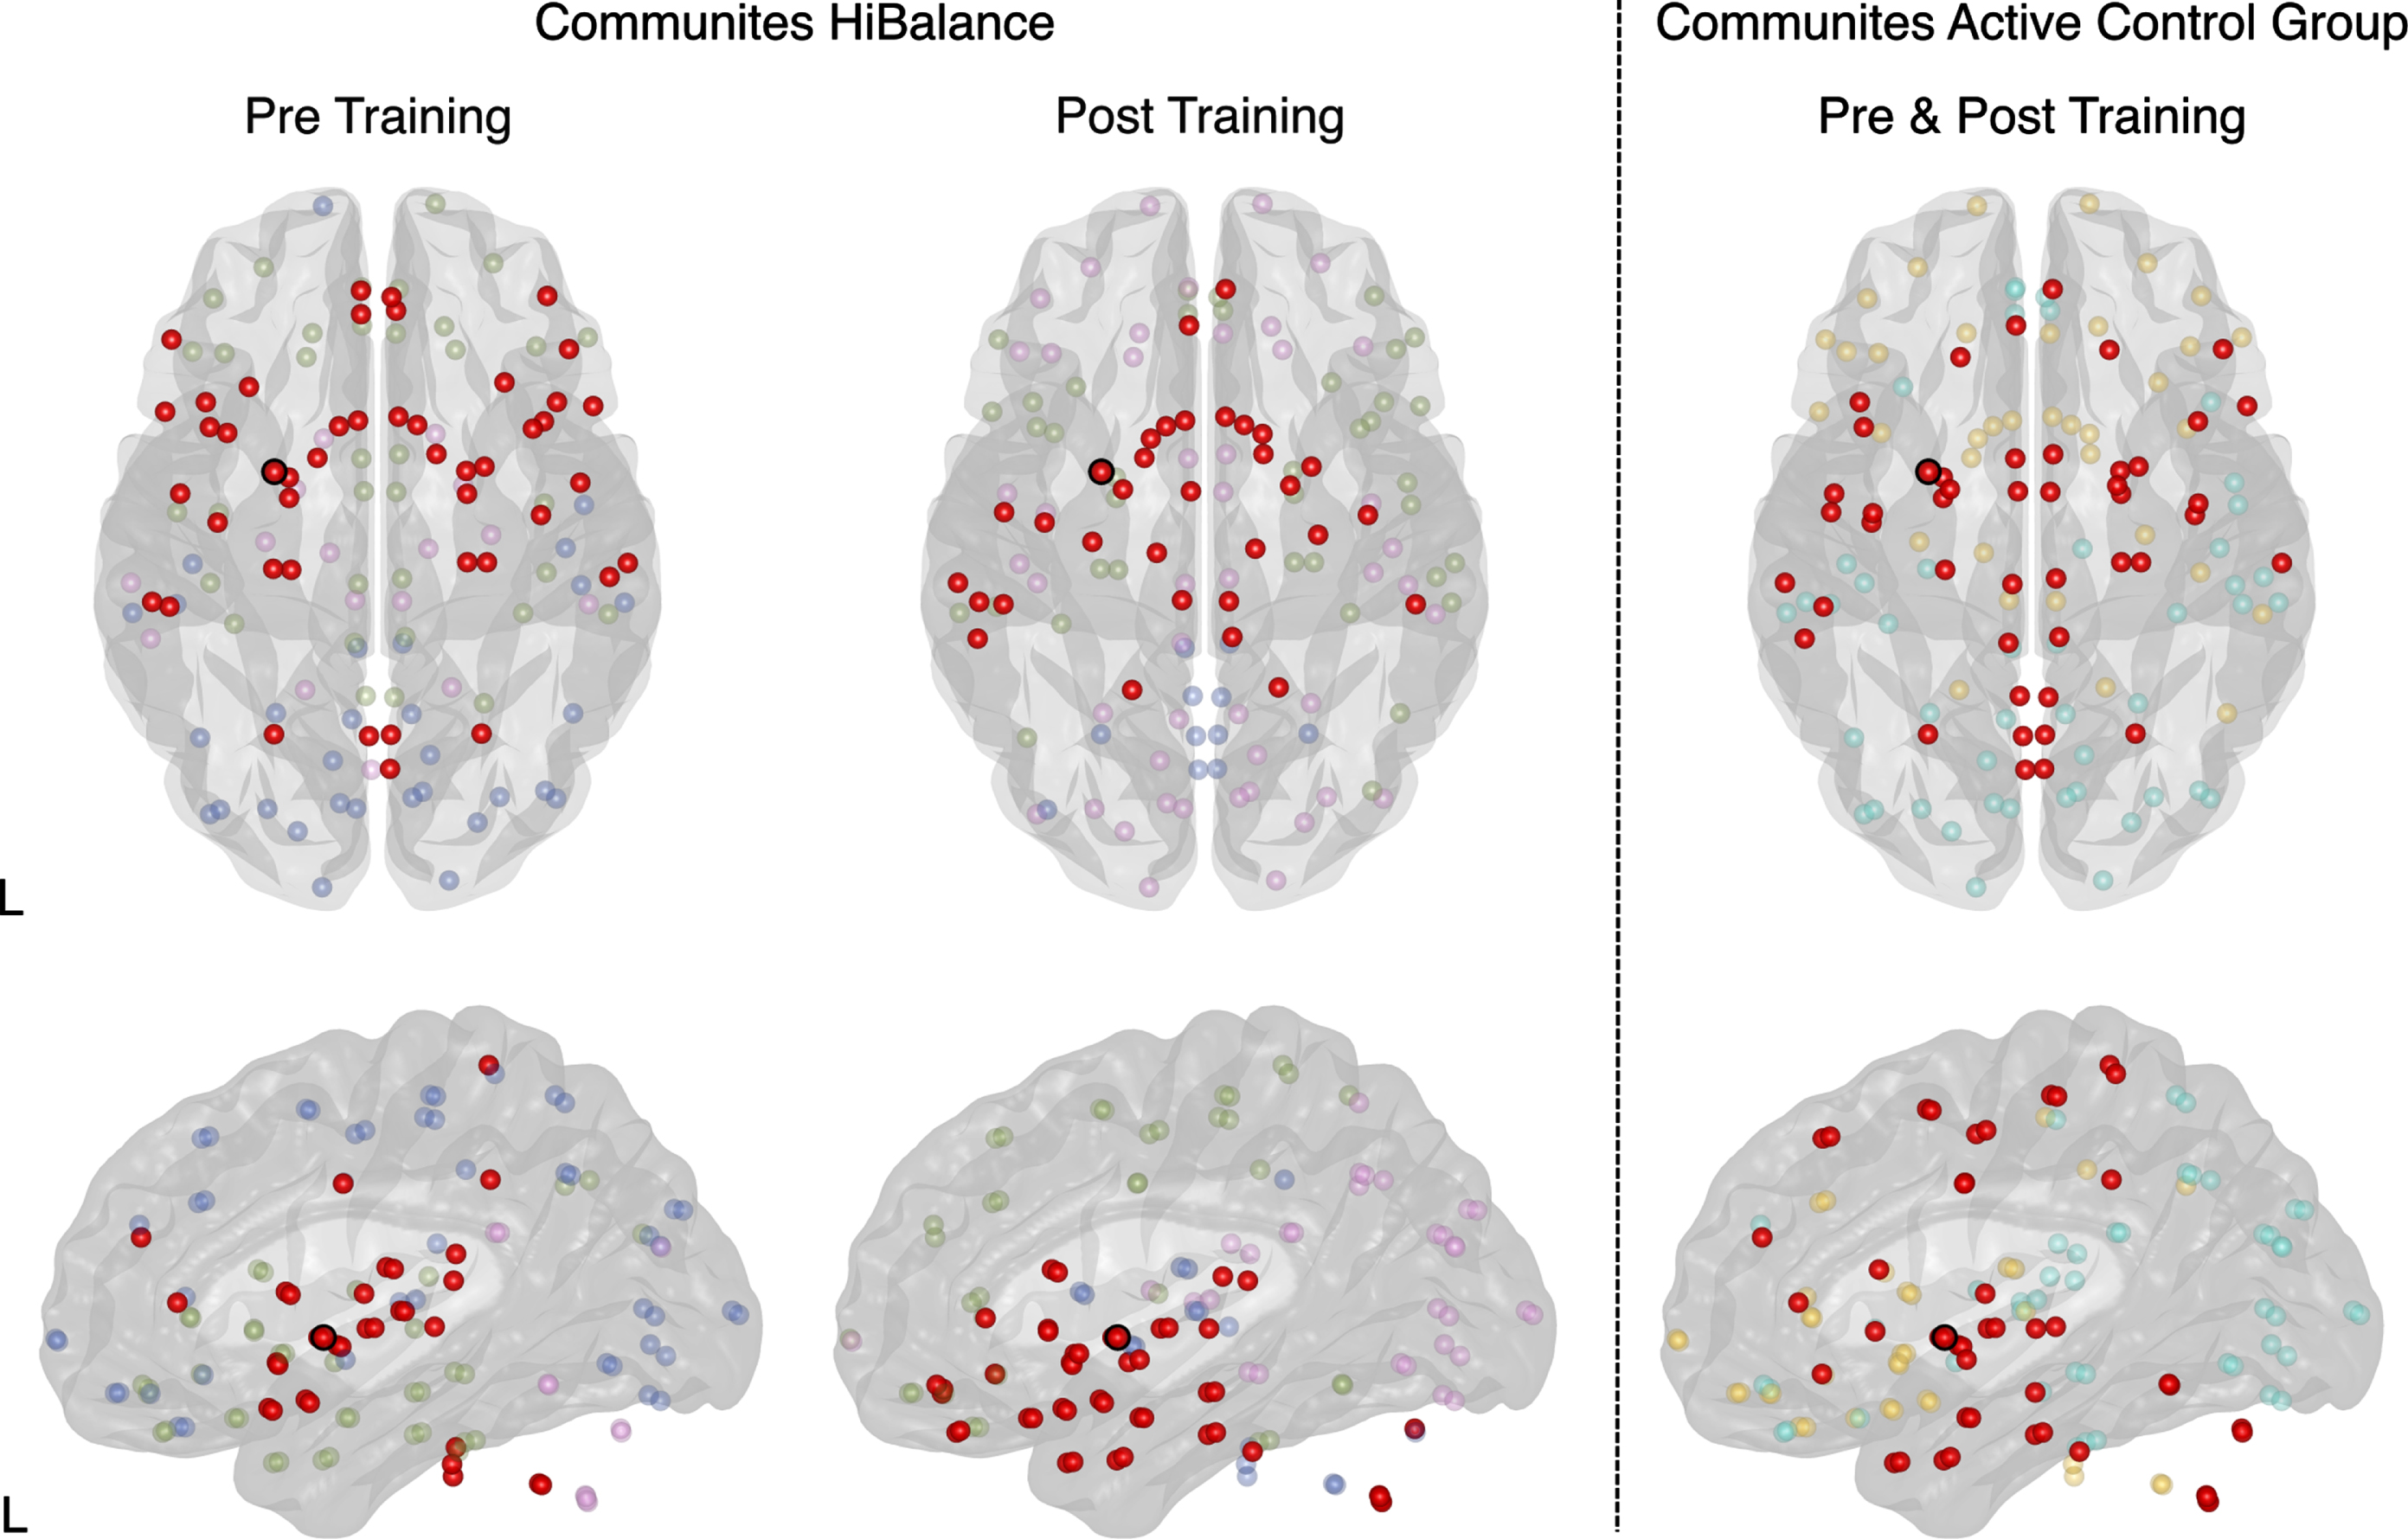
Fig. 5
Repeated measures correlation for the HiBalance training (left) and active control (right) program. Correlations of pre and post-training measures for balance performance as measured by MiniBESTest scores and gait speed (m/s). Gray matter volumes were extracted from the cluster obtained by the comparison of HiBalance pre < post for all participants pre and post-training.
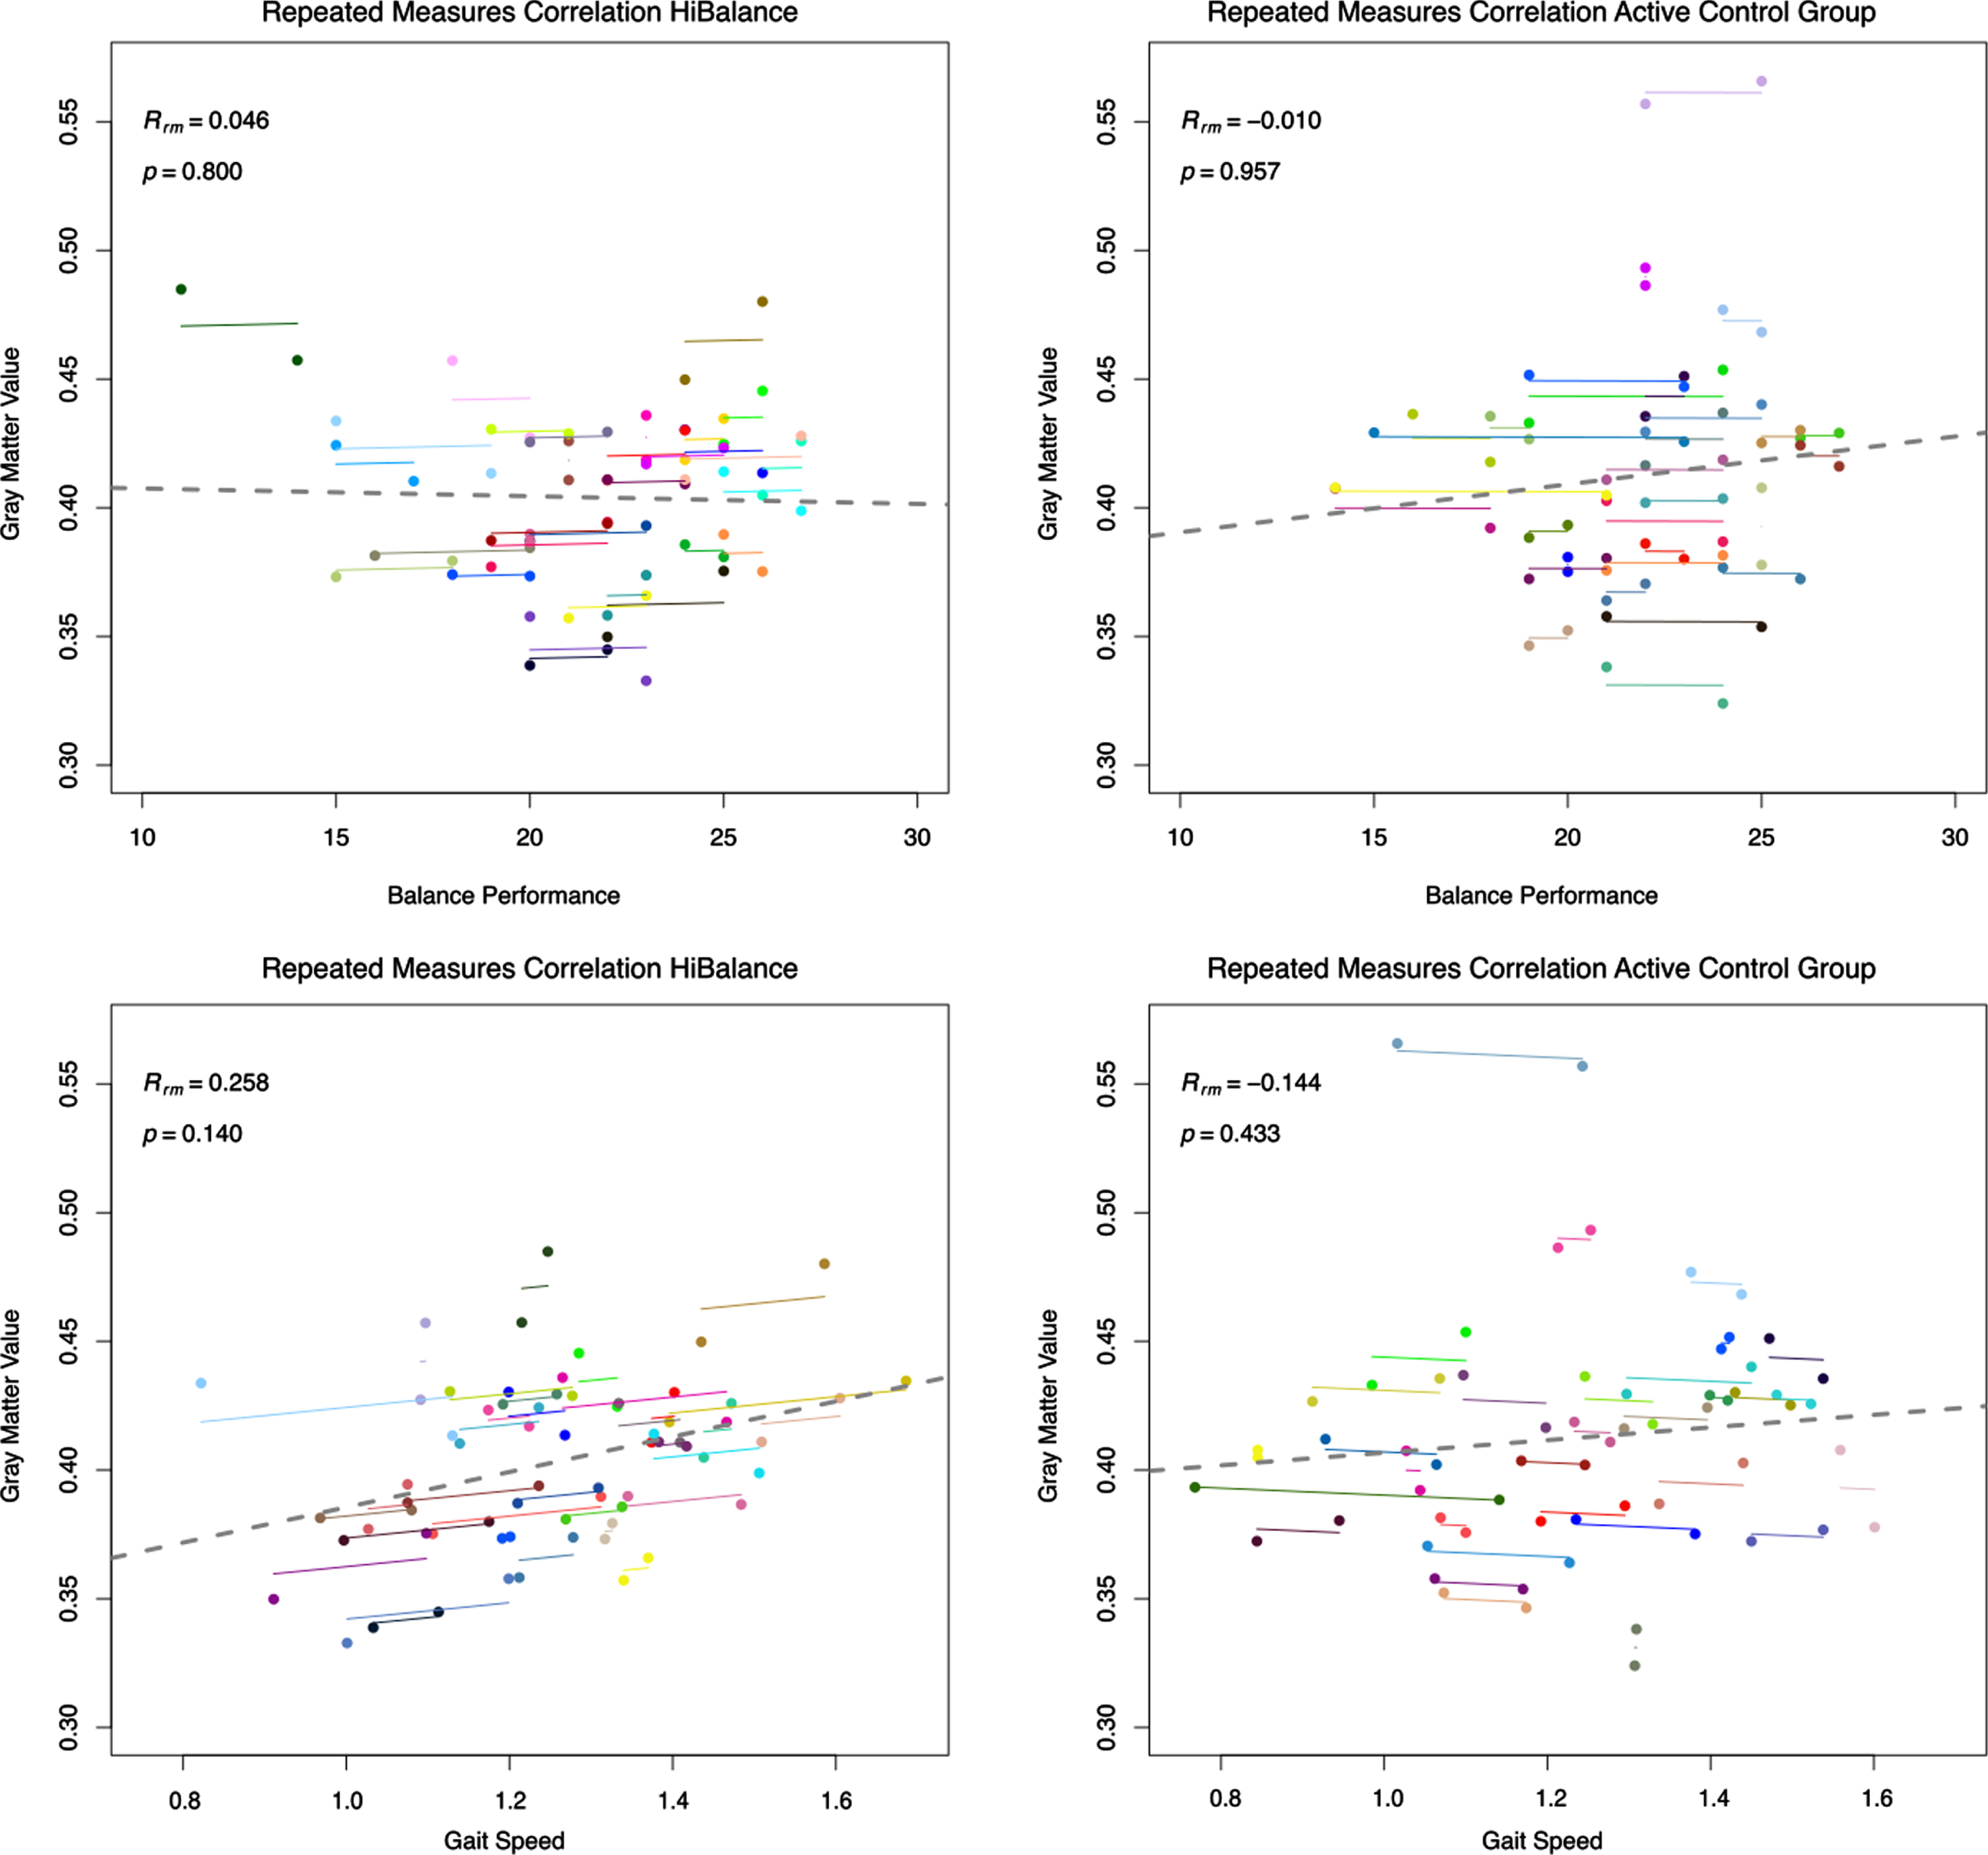
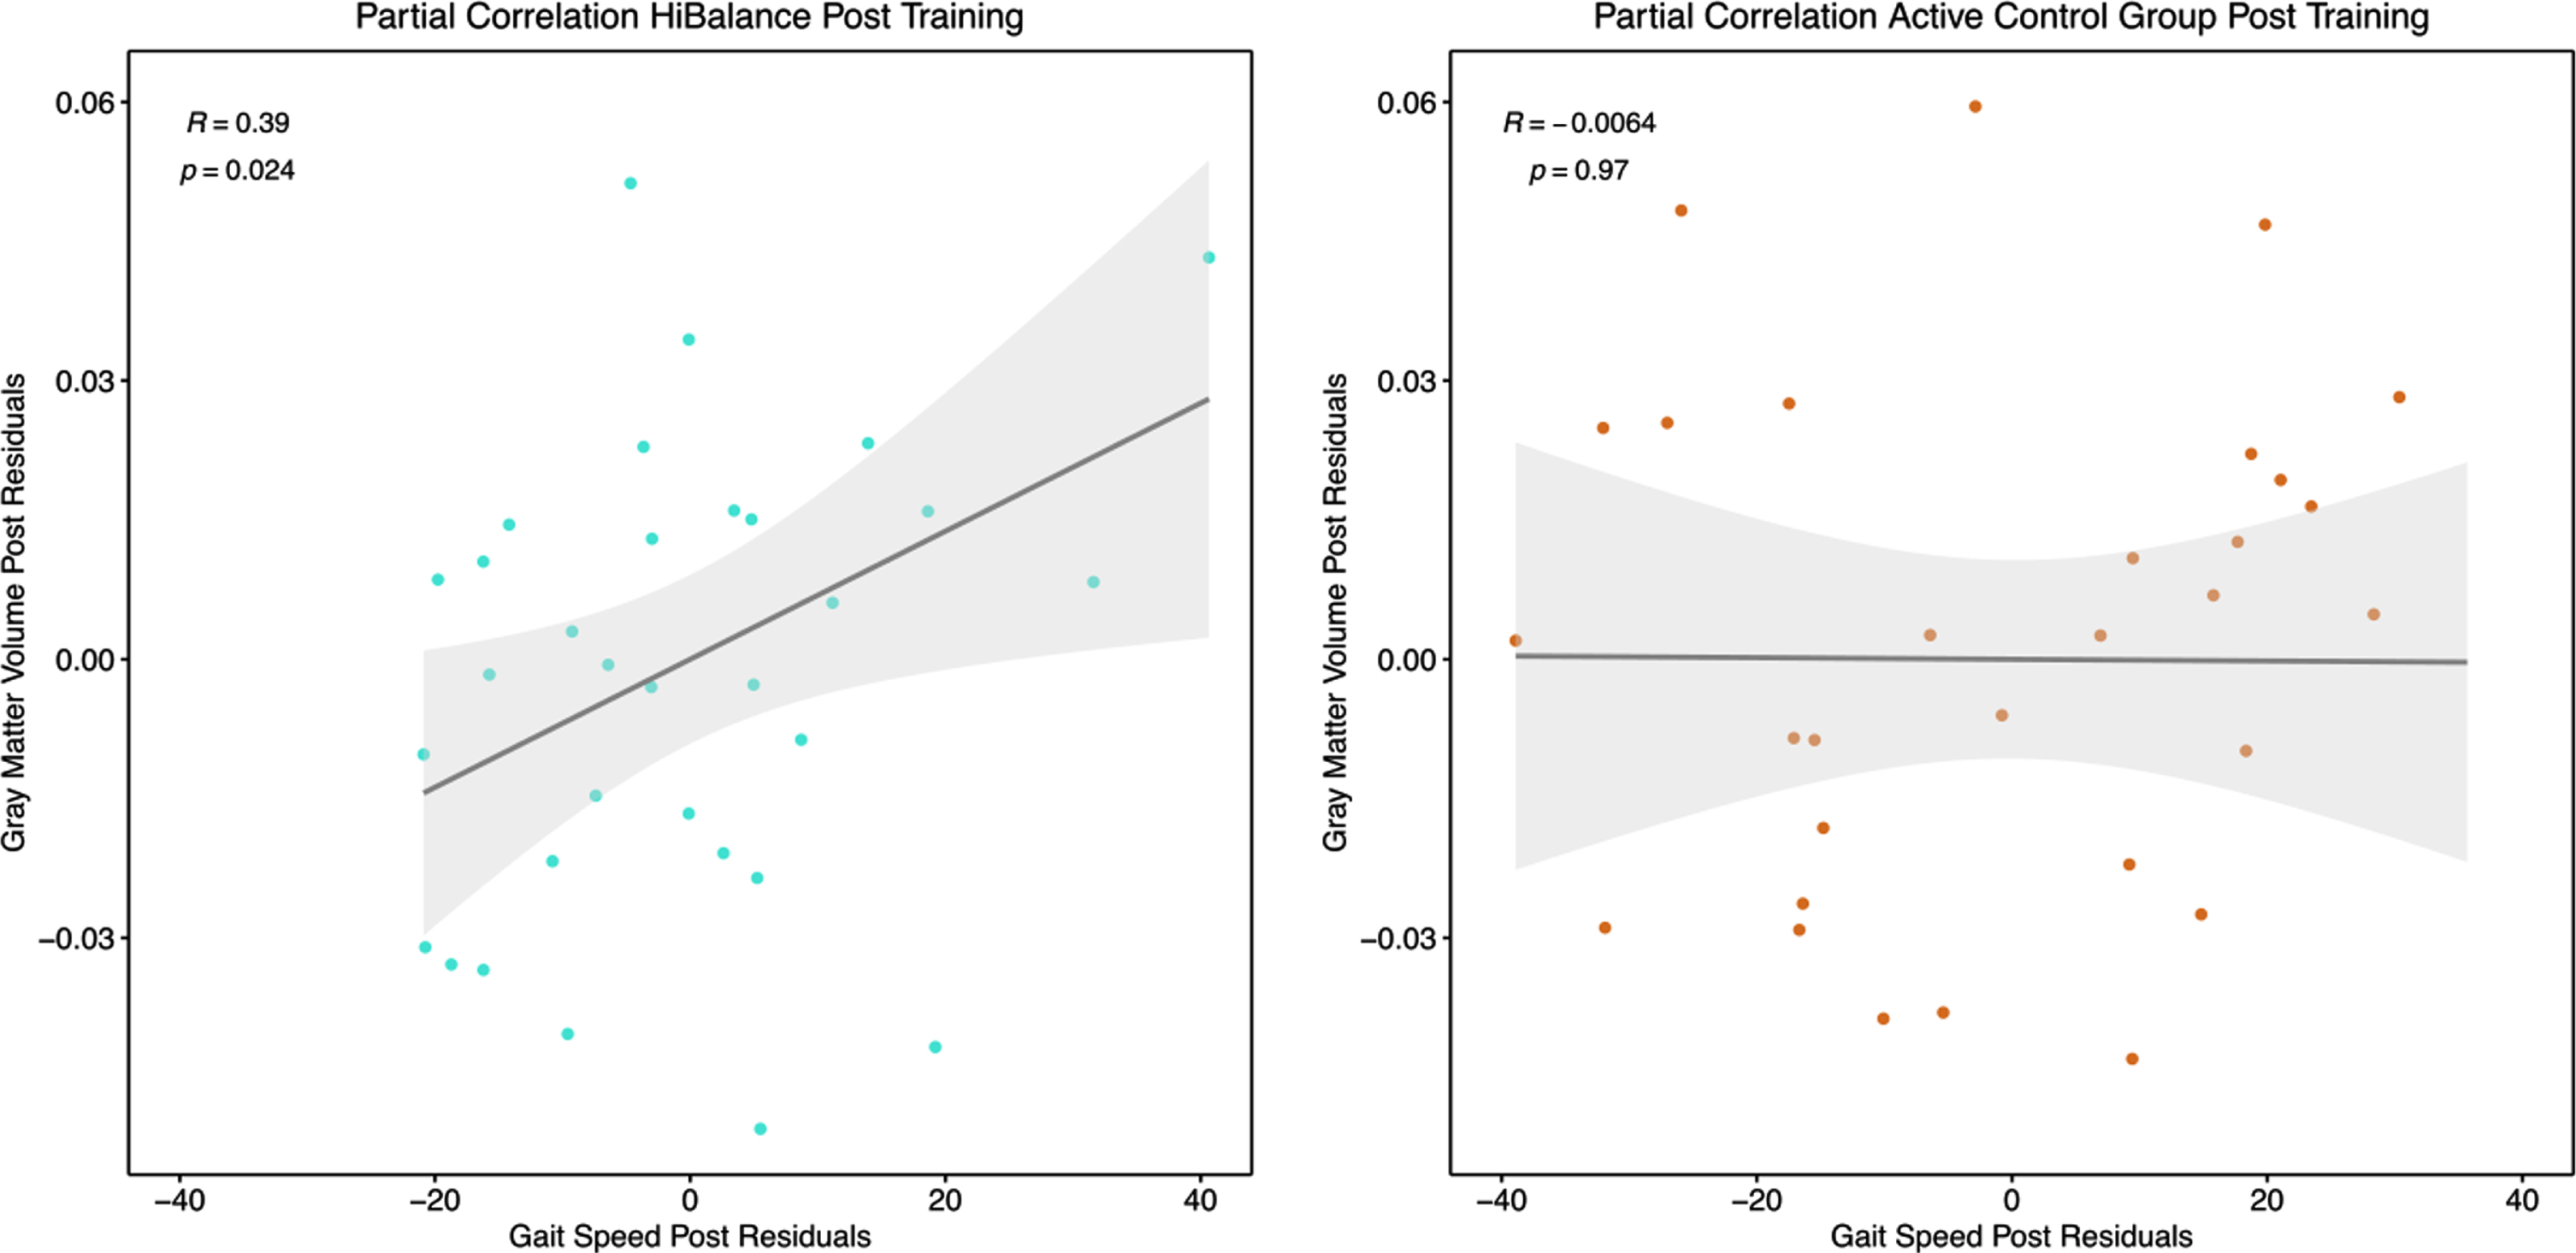
Fig. 6
Partial Pearson’s correlation for the HiBalance training (left) and active control (right) program. Correlation between post-training gray matter values extracted at the left putamen and gait speed (m/s) as measured after training controlled for total intracranial volume.
Note that also the overall structure of communities changed after the HiBalance training program (Fig. 4, Supplementary Table 6). The Louvain algorithm identified four communities pre and post-intervention. Each of the communities changed their node composition. Before the HiBalance training program, community one consisted of deeper brain structures such as the brainstem, caudate nucleus, pallidum, thalamus. After the training it reorgansized to a more temporoparietal network including the left putamen. Community two reorganized from a mainly frontotemporal and cerebellar network to an only cerebellum and posterior cingulate network. Interestingly, before the training, the left putamen was involved in this community but switched to community one. Community three involved temporo-occipital areas before the training and after training more temporoparietal areas. Community four increased its nodes participation after training switching from a mainly frontal network to a more fronto-occipital network.
In the active control group, three communities were obtained which did not change from before to after the intervention. No other structural covariance network changes were found.
To further investigate if the effect in the left putamen was related to the HiBalance training, gray matter volumes were extracted from the putamen for each participant at each time point. In repeated measures correlations, we correlated gray matter volumes of the left putamen and the behavioral variables measuring the effectiveness of the HiBalance training, i.e., balance performance (Mini-BESTest score) and gait speed. No relation was found between the left putamen volume and balance performance (Fig. 5, upper row). A low positive linear, non-significant relationship was shown for the HiBalance group between putamen volume and gait speed (Rrm = 0.25, df = 32, p = 0.14), but not for the active control group (Rrm = –0.14, df = 30, p = 0.43) (Fig. 5, bottom row). Partial Pearson’s correlations between only post training measures and corrected for post intracranial volume underlined that gait speed and left putamen volume correlated significantly in the HiBalance group (R = 0.39, t = 2.34, p = 0.026), but not in the active control group (R = –0.01, t = –0.03, p = 0.97) (Fig. 5, Supplementary Table 7). Other correlations of pre values and delta (post-pre) values were not significant (Supplementary Table 7).
DISCUSSION
In the present study, we examined potential changes in brain structure and motor performance related to a highly challenging balance and gait training in participants with PD. The results showed no group by time training effect on brain structure, balance performance or gait speed. However, post-hoc analyses revealed that HiBalance participants’ brain network topology changed, resulting in reorganization of communities and increased bilateral thalamic to right cerebellar connectivity. In within-HiBalance-group analyses, increased whole-brain gray matter volume was found in the left putamen after the training. Of note, the left putamen volume correlated positively with post measures of gait speed after the HiBalance training.
When performing within-active-controls comparisons, gray matter atrophy was found in parietal, temporal, and occipital cortices. Since there were no increases after the intervention, the aforementioned results could be described as natural disease progression. There were no changes in community structure in the active controls. Of note, also the left putamen community remained unchanged. Altogether, our results show tendencies that the HiBalance training program has an impact on brain structure in participants with PD and that this effect could lead to better motor performance. The study yields an important contribution to physical exercise as treatment and informs further clinical intervention studies.
Effects of intensive physical exercise on brain structure and behavior
The present study showed no time by group interaction effects of the HiBalance training on gait or balance (i.e., gait speed and Mini-BESTest). These results are in contrast to findings from earlier studies using the HiBalance training where we saw significant positive effects on balance performance and gait speed [7, 8]. However, the participants of our previous studies showed more motor impairments. Due to the added MRI assessments and exclusion criteria, participants in this sample were healthier. Further, compared to our previous study, we decreased the number of training sessions per week to increase clinical applicability [8]. The aforementioned facts could be reason for missing significant intervention effects on motor outcome. Nevertheless, two other RCTs assessing the behavioral effects of physical exercise in participants with PD showed as well no significant results on balance and gait performance [6, 26]. Only the study by van der Kolk et al. [6] found significant changes in the aerobic exercise intervention group in the OFF state on UPDRS-III and physical fitness (VO2 max). Worth mentioning is that the active control cohort increased in motor severity after the intervention. Of note, no effect was found in the ON state or any other measures (also not for balance performance as measured by the Mini-BESTest).
Physical exercise research in neurodegenerative diseases has shown contradictory findings on training-induced brain plasticity. Vigorous physical activity has been shown to counteract atrophy in animal models [27], but human studies show mixed results. For instance, the study by Sehm et al. [1] revealed an overall time by group interaction effect in the right cerebellum and also several other gray matter volume decreases and increases throughout the training period in participants with PD. In comparison, we only identified increases in left putamen volume within the HiBalance training group. Some major dissimilarities compared to our study design might have contributed to diverse findings. Importantly, the study of Sehm et al. [1] compared a healthy cohort to participants with PD, while our study applied an RCT design with an active control cohort consisting of participants with PD. Sehm et al. [1] evaluated a one-dimensional balance task in a controlled research environment. In comparison, the HiBalance program challenges balance and gait using real-life tasks in a progressively difficult manner, which may increase treatment applicability. Further, due to repeated MRI measurements during the training period, Sehm et al. [1] observed increases and decreases in gray matter volume over time in the participants with PD. This phenomenon could be described by the expansion-renormalization model for plastic changes, which further explains their finding of overall structural changes to a higher degree than our study [28]. Interestingly, increase in gray matter volume only appeared in the first weeks while in the later training phase, no significant changes were found. This is in line with the expansion-renormalization model, which describes that in the beginning of skill acquisition there is neural growth leading to expansion [28]. These new synapses, neurons, and glia will be selected, and only optimal neural circuits remain. This process results in a renormalization by partial or even complete return to baseline brain volume. Of note, not all volume changes across the brain can be explained by neurogenesis since this only occurs in the dentate gyrus, olfactory bulb, and striatum in humans [28]. A combination of changes across different cell types lead to alterations that are detectable by MRI. Thus, this model also yields an explanation why our results, and other study’s results with only pre-post measurements, show no training-related volume change. Indeed, as mentioned before, a study on participants with Alzheimer’s disease showed no group by time interaction effect on gray matter structure, but a positive correlation of exercise load with hippocampal volume and frontal cortical thickness [5]. This study also implemented an RCT comparing an exercise training to an active control group. In this HiBalance program study, we did not assess objective exercise load, but level of difficulty and intensity was adjusted for each participant individually by experienced physiotherapists. This ensured that each participant was challenged in an equally intense manner but adjusted to their own capacities. However, we measured the progressiveness of the HiBalance training with accelerometers in a previous study. Training activity increased throughout the training program, which was also reflected in how challenging participants rated the balance training [29].
Our study offers additional information in regard to previous publications by including structural covariance network topology measures to investigate training effects. Of note, the HiBalance training program was associated with changes in structural covariance network topology on a global and nodal level. We are not aware of any other study investigating structural covariance network topology changes due to highly challenging physical exercise in participants with PD. Community structure changed in the HiBalance group but not in the active control group. Important to highlight is that the structure of the left putamen community only changed in the HiBalance group and remained unchanged in the active control group. It is interesting that the active control group showed no overall altered community structure since our control group was an active group performing a speech and communication training. Further, structural covariance network topology changes in the HiBalance group underline what the expansion-renormalization model assumes: changes in neural circuits consolidate without a persistent effect on gray matter volume. These are relevant findings since for example the cerebellum, which showed connectivity strength increases in our study, is involved in aspects related to the training and affected in PD such as sensorimotor and vestibular performance as well as cognition [30].
Another reason for differing effects of physical exercise on brain structure might be the opposite assumption to the expansion-renormalization model, namely that structural changes need longer training periods to manifest. Voxel-based morphometry identifies morphological brain abnormalities, while other techniques such as task-based functional MRI and PET capture early effects of neuronal and synaptic changes. Indeed, in a study with nine mild to moderate participants with PD by Alberts et al. [31], it was shown that physical exercise may have a positive effect on instant functional connectivity. After performing a forced exercise training, participants with PD showed increased activation during functional MRI in the ROIs of the bilateral putamen, globus pallidus, thalamus, primary motor, and supplementary motor area. Note that this is not capturing a training effect but might indicate which areas are involved in intensive physical exercise.
Putamen and gait
Our analyses suggest there is a link between gait and balance training with the structure of the putamen but need to be interpreted with caution given the lack of control for multiple comparisons. Motor cortex and basal ganglia, including the putamen, play an important role in the neurodegenerative processes in PD. A meta-analysis of resting-state connectivity MRI found that the left putamen shows decreased activity in participants with PD [32]. The putamen is especially related to timing control while moving and automatic processing of movements [33]. As aforementioned, there is evidence for a relation between physical exercise and metabolic as well as functional changes in the putamen [31, 34]. Moreover, the putamen has been linked to PD and specifically gait speed [35]. Nineteen participants with PD imagined walking during functional MRI while activation was measured. Additionally, walking at a self-selected speed was recorded. Higher activation in the left putamen during walking imaginary tasks correlated with higher actual gait speed. Note that participants were OFF medication and mean gait speed was lower (0.97 m/s) than in our study (1.23 m/s), even though disease severity (Hoehn & Yahr and MDS-UPDRS-III motor score) was comparable.
In the HiBalance cohort, we found that the left putamen changed its community participation after the training, shifting from a frontotemporal network to a more temporoparietal network. This finding is interesting given that both networks are involved in gait and postural control as well as in cognitive control. The cognitive control network comprises frontotemporal areas but also the parietal cortex [36]. The included areas - dorsolateral prefrontal cortex, anterior cingulate cortex, presupplementary motor area, dorsal premotor cortex, anterior insula, inferior frontal junction, and posterior parietal cortex - implement cognitive control in a range of different tasks [36]. Some of these frontal areas also process gait and posture information and enable movement [37]. On the other hand, the temporoparietal cortex stores and updates body information (e.g., body schema). This updated information is transferred to frontal areas in order to adjust one’s gait and posture during walking [37]. Hence, information from the temporoparietal cortex enables an accurate gait control. Therefore, connectivity between frontal and temporoparietal areas is important and leads to a better incorporation of body representation and visual stimuli to update gait and posture. Disturbances in this circuit of processing in the temporoparietal cortex might play a role in freezing of gait, which can be seen in PD [37, 38]. One might cautiously argue that the community structure change in the HiBalance cohort reflects a shift from a more demanding walking process to better automatized walking, which is resulting in faster gait speed. This could be interpreted as a sign of less cognitive control and more automatic control of gait and movement.
Limitations
Our study is based on a rigorously planned RCT with strict inclusion criteria and well-characterized participants [9]. Nevertheless, some limitations should be acknowledged. For instance, these results are based on a subsample with available structural MRI data of the original RCT, which could influence the robustness of our results. Hence, the randomization we performed for the RCT does not apply for the structural MRI subsample.
We calculated statistical power before starting the RCT which was based on the main outcome variable (balance performance) and not on structural MRI data [9]. Here we calculated that a group-size of n = 40 would give sufficient power to observe a motor improvement. Taking into account dropouts and technical/quality structural MRI issues (Fig. 1), data for 31 and 34 participants were analyzed. Thus, our sample size might be too small to detect motor effects and potentially additional structural MRI effects. In line with the argument that our structural MRI study might be slightly underpowered is the finding that the HiBalance training group marginally improved in gait speed. This suggests that the results were going in the hypothesized direction. Additionally, although our sample was larger compared to previous studies and a randomization strategy was used when assigning subjects to the training groups, an active control condition was selected for comparing the efficacy of the HiBalance training program [1, 5]. This could have limited our ability to detect behavioral and motor effects in our study since the active controls performed a speech and communication training which involves motor aspects and an active participation, i.e., commuting to the intervention site. Compared to our previous studies showing positive findings, participants of this RCT were characterized by a milder disease severity [7, 8]. We acknowledge that the lack of structural findings could be due to either the assumptions of the expansion-renormalization model or the training period might not have been long enough to manifest pronounced effects on brain structure. We identified structural covariance network changes in the HiBalance training group but not in the active control group. The functional relevance of this change cannot be clearly defined since there are no other comparable studies investigating community changes after physical exercise training. Nevertheless, we discussed the relevance of the putamen-related changes in the light of gait and balance training. Further studies should include network approaches to confirm our results.
CONCLUSIONS
This RCT with participants with PD aimed at finding a therapeutic method to counteract neurodegeneration and behavioral symptoms based on a highly challenging balance and gait training program. Our study could not identify a significant training effect at the behavioral level as measured by balance performance or gait speed. One may assume that behavioral effects are necessary to underly brain structure effects. Indeed, there was no group by time interaction effect of the HiBalance training on brain structure. Despite no interaction effect, the HiBalance group showed post-training a higher putamen volume, which correlated with a better motor performance, increased brain connectivity strength, and community reorganization. This suggests that subtle morphological changes may precede a significant behavioral effect. Of note, there were no brain topology or volume changes after the training in the active control group.
Based on these results, we cannot draw a definite conclusion that the training is effective. However, our results show a tendency that the training impacts participants’ brain structure. These findings add important knowledge about the design of physical intervention studies. For instance, the monitoring of training effects might be improved in future studies by several MRI acquisitions during the intervention to assess the expansion-renormalization phase. Further, more sensitive behavioral measurements might be needed to capture subtle changes in motor performance. Since PD is a heterogenous disease, the influence of disease severity, brain atrophy or other biomarkers on training effectiveness should be investigated by including participants with different levels of impairment to enable personalized treatment. The results of our highly challenging, supervised training are an important step towards more specific, more effective, personalized treatment strategies for participants with PD and inform development of further training intervention strategies.
CONFLICT OF INTEREST
The authors declare no conflict of interest.
ACKNOWLEDGMENTS
The authors thank all participants and actively involved assessors in study. This research was supported by the uMOVE core facility and the Jonasson Centre for Medical Imaging by providing equipment and assistance. We further thank J. Sebastian Muehlboeck for support in data handling, preprocessing, and data storing and Prof. Giovanni Volpe for assistance in the graph theory analyses.
SUPPLEMENTARY MATERIAL
[1] The supplementary material is available in the electronic version of this article: https://dx.doi.org/10.3233/JPD-212801.
REFERENCES
[1] | Sehm B , Taubert M , Conde V , Weise D , Classen J , Dukart J , Draganski B , Villringer A , Ragert P ((2014) ) Structural brain plasticity in Parkinson’s disease induced by balance training. Neurobiol Aging 35: , 232–239. |
[2] | Petzinger GM , Fisher BE , McEwen S , Beeler JA , Walsh JP , Jakowec MW ((2013) ) Exercise-enhanced neuroplasticity targeting motor and cognitive circuitry in Parkinson’s disease. Lancet Neurol 12: , 716–726. |
[3] | Johansson H , Hagströmer M , Grooten WJA , Franzén E ((2020) ) Exercise-induced neuroplasticity in Parkinson’s disease: A metasynthesis of the literature. Neural Plast 2020: , 8961493. |
[4] | Colcombe SJ , Erickson KI , Scalf PE , Kim JS , Prakash R , McAuley E , Elavsky S , Marquez DX , Hu L , Kramer AF ((2006) ) Aerobic exercise training increases brain volume in aging humans. J Gerontol A Biol Sci Med Sci 61: , 1166–1170. |
[5] | Frederiksen KS , Larsen CT , Hasselbalch SG , Christensen AN , Hogh P , Wermuth L , Andersen BB , Siebner HR , Garde E ((2018) ) A 16-week aerobic exercise intervention does not affect hippocampal volume and cortical thickness in mild to moderate Alzheimer’s disease. Front Aging Neurosci 10: , 293. |
[6] | van der Kolk NM , de Vries NM , Kessels RPC , Joosten H , Zwinderman AH , Post B , Bloem BR ((2019) ) Effectiveness of home-based and remotely supervised aerobic exercise in Parkinson’s disease: A double-blind, randomised controlled trial. Lancet Neurol 18: , 998–1008. |
[7] | Leavy B , Joseph C , Lofgren N , Johansson H , Hagstromer M , Franzen E ((2020) ) Outcome evaluation of highly challenging balance training for people with Parkinson disease: A multicenter effectiveness-implementation study. J Neurol Phys Ther 44: , 15–22. |
[8] | Conradsson D , Löfgren N , Nero H , Hagstromer M , Stahle A , Lokk J , Franzén E ((2015) ) The effects of highly challenging balance training in elderly with Parkinson’s disease: A randomized controlled trial. Neurorehabil Neural Repair 29: , 827–836. |
[9] | Franzén E , Johansson H , Freidle M , Ekman U , Wallen MB , Schalling E , Lebedev A , Lovden M , Holmin S , Svenningsson P , Hagstromer M ((2019) ) The EXPANd trial: Effects of exercise and exploring neuroplastic changes in people with Parkinson’s disease: A study protocol for a double-blinded randomized controlled trial. BMC Neurol 19: , 280. |
[10] | Löfgren N , Conradsson D , Rennie L , Moe-Nilssen R , Franzén E ((2019) ) The effects of integrated single- and dual-task training on automaticity and attention allocation in Parkinson’s disease: A secondary analysis from a randomized trial. Neuropsychology 33: , 147–156. |
[11] | Franchignoni F , Horak F , Godi M , Nardone A , Giordano A ((2010) ) Using psychometric techniques to improve the Balance Evaluation Systems Test: The mini-BESTest. J Rehabil Med 42: , 323–331. |
[12] | Stebbins GT , Goetz CG , Burn DJ , Jankovic J , Khoo TK , Tilley BC ((2013) ) How to identify tremor dominant and postural instability/gait difficulty groups with the movement disorder society unified Parkinson’s disease rating scale: Comparison with the unified Parkinson’s disease rating scale. Mov Disord 28: , 668–670. |
[13] | Fine EM , Delis DC ((2011) ) Delis–Kaplan Executive Functioning System. In Encyclopedia of Clinical Neuropsychology, Kreutzer JS, DeLuca J, Caplan B, eds. Springer New York, New York, NY, pp. 796-801. |
[14] | Wechsler D ((1955) ) Wechsler adult intelligence scale. |
[15] | Schmidt M ((1996) ) Rey auditory verbal learning test: A handbook, Western Psychological Services Los Angeles, CA. |
[16] | Benedict RH , Schretlen D , Groninger L , Dobraski M , Shpritz B ((1996) ) Revision of the Brief Visuospatial Memory Test: Studies of normal performance, reliability, and validity. Psychol Assess 8: , 145. |
[17] | Litvan I , Goldman JG , Troster AI , Schmand BA , Weintraub D , Petersen RC , Mollenhauer B , Adler CH , Marder K , Williams-Gray CH , Aarsland D , Kulisevsky J , Rodriguez-Oroz MC , Burn DJ , Barker RA , Emre M ((2012) ) Diagnostic criteria for mild cognitive impairment in Parkinson’s disease: Movement Disorder Society Task Force guidelines. Mov Disord 27: , 349–356. |
[18] | Mathuranath PS , Nestor PJ , Berrios GE , Rakowicz W , Hodges JR ((2000) ) A brief cognitive test battery to differentiate Alzheimer’s disease and frontotemporal dementia. Neurology 55: , 1613–1620. |
[19] | Charernboon T ((2017) ) Diagnostic accuracy of the overlapping infinity loops, wire cube, and clock drawing tests for cognitive impairment in mild cognitive impairment and dementia. Int J Alzheimers Dis 2017: , 5289239. |
[20] | Romero HR , Monsch AU , Hayden KM , Plassman BL , Atkins AS , Keefe RSE , Brewster S , Chiang C , O’Neil J , Runyan G , Atkinson MJ , Crawford S , Budur K , Burns DK , Welsh-Bohmer KA ((2018) ) TOMMORROW neuropsychological battery: German language validation and normative study. Alzheimers Dement (N Y) 4: , 314–323. |
[21] | Borland E , Nagga K , Nilsson PM , Minthon L , Nilsson ED , Palmqvist S ((2017) ) The Montreal Cognitive Assessment: Normative data from a large Swedish population-based cohort. J Alzheimers Dis 59: , 893–901. |
[22] | Gaser C , Dahnke R ((2016) ) CAT-a computational anatomy toolbox for the analysis of structural MRI data. HBM 2016: , 336–348. |
[23] | Muehlboeck JS , Westman E , Simmons A ((2014) ) TheHiveDB image data management and analysis framework. Front Neuroinform 7: , 49. |
[24] | Mijalkov M , Kakaei E , Pereira JB , Westman E , Volpe G , Alzheimer’s Disease Neuroimaging Initiative ((2017) ) BRAPH: A graph theory software for the analysis of brain connectivity. PLoS One 12: , e0178798. |
[25] | Blondel VD , Guillaume J-L , Lambiotte R , Lefebvre E ((2008) ) Fast unfolding of communities in large networks. J Stat Mech 2008: , P10008. |
[26] | Jung SH , Hasegawa N , Mancini M , King LA , Carlson-Kuhta P , Smulders K , Peterson DS , Barlow N , Harker G , Morris R , Lapidus J , Nutt JG , Horak FB ((2020) ) Effects of the agility boot camp with cognitive challenge (ABC-C) exercise program for Parkinson’s disease. NPJ Parkinsons Dis 6: , 31. |
[27] | Intlekofer KA , Cotman CW ((2013) ) Exercise counteracts declining hippocampal function in aging and Alzheimer’s disease. Neurobiol Dis 57: , 47–55. |
[28] | Wenger E , Brozzoli C , Lindenberger U , Lövdén M ((2017) ) Expansion and renormalization of human brain structure during skill acquisition. Trends Cogn Sci 21: , 930–939. |
[29] | Conradsson D , Nero H , Lofgren N , Hagstromer M , Franzen E ((2017) ) Monitoring training activity during gait-related balance exercise in individuals with Parkinson’s disease: A proof-of-concept-study. BMC Neurol 17: , 19. |
[30] | Schmahmann JD ((2019) ) The cerebellum and cognition. Neurosci Lett 688: , 62–75. |
[31] | Alberts JL , Linder SM , Penko AL , Lowe MJ , Phillips M ((2011) ) It is not about the bike, it is about the pedaling: Forced exercise and Parkinson’s disease. Exerc Sport Sci Rev 39: , 177–186. |
[32] | Wang J , Zhang JR , Zang YF , Wu T ((2018) ) Consistent decreased activity in the putamen in Parkinson’s disease: A meta-analysis and an independent validation of resting-state fMRI. Gigascience 7: , giy071. |
[33] | Wu T , Hallett M , Chan P ((2015) ) Motor automaticity in Parkinson’s disease. Neurobiol Dis 82: , 226–234. |
[34] | Fisher BE , Li Q , Nacca A , Salem GJ , Song J , Yip J , Hui JS , Jakowec MW , Petzinger GM ((2013) ) Treadmill exercise elevates striatal dopamine D2 receptor binding potential in patients with early Parkinson’s disease. Neuroreport 24: , 509–514. |
[35] | Peterson DS , Pickett KA , Duncan RP , Perlmutter JS , Earhart GM ((2014) ) Brain activity during complex imagined gait tasks in Parkinson disease. Clin Neurophysiol 125: , 995–1005. |
[36] | Cole MW , Schneider W ((2007) ) The cognitive control network: Integrated cortical regions with dissociable functions. Neuroimage 37: , 343–360. |
[37] | Takakusaki K ((2013) ) Neurophysiology of gait: From the spinal cord to the frontal lobe. Mov Disord 28: , 1483–1491. |
[38] | Nieuwboer A , Giladi N ((2013) ) Characterizing freezing of gait in Parkinson’s disease: Models of an episodic phenomenon. Mov Disord 28: , 1509–1519. |


