
Unhealthy Behaviours and Risk of Parkinson’s Disease: A Mendelian Randomisation Study
Abstract
Background:
Tobacco smoking and alcohol intake have been identified in observational studies as potentially protective factors against developing Parkinson’s disease (PD); the impact of body mass index (BMI) on PD risk is debated. Whether such epidemiological associations are causal remains unclear. Mendelian randomsation (MR) uses genetic variants to explore the effects of exposures on outcomes; potentially reducing bias from residual confounding and reverse causation.
Objective:
Using MR, we examined relationships between PD risk and three unhealthy behaviours: tobacco smoking, alcohol intake, and higher BMI.
Methods:
19,924 PD cases and 2,413,087 controls were included in the analysis. We performed genome-wide association studies to identify single nucleotide polymorphisms associated with tobacco smoking, alcohol intake, and BMI. MR analysis of the relationship between each exposure and PD was undertaken using a split-sample design.
Results:
Ever-smoking reduced the risk of PD (OR 0.955; 95%confidence interval [CI] 0.921–0.991; p = 0.013). Higher daily alcohol intake increased the risk of PD (OR 1.125, 95%CI 1.025–1.235; p = 0.013) and a 1 kg/m2 higher BMI reduced the risk of PD (OR 0.988, 95%CI 0.979–0.997; p = 0.008). Sensitivity analyses did not suggest bias from horizontal pleiotropy or invalid instruments.
Conclusion:
Using split-sample MR in over 2.4 million participants, we observed a protective effect of smoking on risk of PD. In contrast to observational data, alcohol consumption appeared to increase the risk of PD. Higher BMI had a protective effect on PD, but the effect was small.
INTRODUCTION
Observational studies have identified putative risk factors for Parkinson’s disease (PD) but their effect on aetio-pathogenesis, hence their value as targets for neuroprotection, remains unclear. The impact of three phenotypes in particular—tobacco smoking, alcohol intake, and high body mass index (BMI)—on risk of PD warrants clarification given their prevalence in the general population and their potential for modification should they modulate disease risk.
Observational data suggest that ever-smokers are 40%less likely to develop PD than never-smokers, with a dose-response relationship being observed with pack-years smoked [1]. Similarly, high alcohol intake was associated with a 22%lower risk of PD in a large-scale meta-analysis [2], although this may be driven in part by small-study bias [3]. A recent case-control study supported the negative observational associations with smoking and alcohol [4].
The role of BMI in risk of PD is unclear. Low BMI is apparent in patients with PD in case-control studies, however a meta-analysis of 10 prospective studies found no association between premorbid BMI and PD risk [5].
The extent to which such epidemiological associations are causal or driven by confounding factors and/or reverse causation remains unclear. Risk-averse individuals may be less likely to engage in unhealthy behaviours and more likely to develop PD [6]. Reverse causation is plausible given the long prodromal phase of PD [7]. Indeed, ease of smoking cessation and weight loss may be prodromal features of PD [8, 9].
Using Mendelian randomisation (MR), we sought to explore the nature of associations between PD risk and smoking, alcohol intake, and higher BMI. In MR, genetic variants associated with the exposure are used as instrumental variables to estimate the effect of the exposure on the outcome. The random allocation of genetic variants to offspring means that alleles are generally unrelated to confounding factors. Moreover, the germline genotype cannot be modified by the disease process, minimising bias from reverse causality. MR helps address limitations of randomized controlled trials: ethical (when the intervention is harmful, e.g., smoking) and pragmatic (when adherence cannot be guaranteed, e.g., alcohol intake, BMI modulation) [10].
METHODS
Participants
Participants were customers of 23andMe, Inc., a personal genomics company. Study protocols were approved by an external AAHRPP-accredited institutional review board and conducted in accordance with the Declaration of Helsinki principles. Participants gave informed consent to participate. Data was collected between 10/11/2007 and 1/1/2018.
Defining phenotypic traits
Parkinson’s disease status
PD cases were drawn from the 23andMe participants who self-reported a diagnosis of PD. For a fuller description of recruitment see Do et al. [11]. If multiple PD questions were completed, participants were scored as cases if they reported being a case in any survey. Despite questionnaire data providing less diagnostic accuracy than clinically ascertained data, satisfactory level of agreement between patient-reported PD diagnosis and neurologist assessment has been demonstrated in a small validation study [12]. Participants reporting a change in their diagnosis or uncertainty relating to their diagnosis were excluded. Controls were drawn from the 23andMe participants who self-reported never having been diagnosed with PD. We also removed cases and controls who self-reported having ever been diagnosed with: 1) atypical parkinsonism (e.g., dementia with Lewy bodies, progressive supranuclear palsy, multiple system atrophy, corticobasal degeneration) or a non-parkinsonian tremor disorder; or 2) stroke, deep vein thrombosis, or pulmonary embolism (to reduce the probability of including individuals with vascular parkinsonism). 19,924 PD cases and 2,413,087 controls were included in the analysis. For a description of how 23andMe research participants with PD compare phenotypically to those without PD, see Heilbron et al. (2019) [4].
Unhealthy exposures of interest
Participants self-reported tobacco smoking habits with response categories “ever-smoker (> 100 cigarettes smoked in lifetime)”, or “never-smoker (< 100 cigarettes smoked in lifetime)”. Our tobacco use phenotype followed the established standard definition used by the US Centers for Disease Control and Prevention (CDC) in their National Health Interview Survey [13]. Participants self-reported the number of alcohol measures consumed per day over the past two weeks, where 1 measure corresponds to 12 oz. of beer, 5 oz. of wine, or 1.5 oz of spirits. Response options were grouped as: 0, 0–1, 1, 2, 3, 4, 5 or more measures. Participants self-reported their mass (in kilograms) and height (in metres) squared, from which BMI was calculated. The majority of the exposure data was collected when a 23andMe research participant completed their first survey. If multiple tobacco use questions were completed, participants were scored as ever-smokers if they reported being an ever-smoker in any survey. If multiple alcohol use, mass, height, or PD questions were completed, the first non-missing value was taken from an ordered list of surveys. Responses were highly concordant across surveys (e.g., r = 0.978 between the top two PD surveys). We opted to use 23andMe exposure data to create genetic instruments for each trait of interest rather than external data because of the large available sample sizes and resulting statistical power.
Genome-wide association studies
We performed new GWAS for each exposure using unrelated individuals. We selected unrelated individuals using a segmental identity-by-descent estimation algorithm [14]. Individuals were defined as related if they shared 700 cM identity-by-descent, including regions where the two individuals share one or both genomic segments identical-by-descent. This level of relatedness (∼20%of the genome) corresponds approximately to the minimal expected sharing between first cousins in an outbred population. Ancestry composition was performed as previously reported [15]. Inclusion was restricted to individuals of predominantly European ancestry to minimise confounding by ancestry.
DNA extraction and genotyping were performed on saliva samples by National Genetics Institute. Samples were genotyped on one of five Illumina-based genotyping platforms. The v1 and v2 platforms were variants of the Illumina HumanHap550 + BeadChip, including about 25,000 custom SNPs selected by 23andMe, with a total of about 560,000 SNPs. The v3 platform was based on the Illumina OmniExpress + BeadChip, with custom content to improve the overlap with our v2 array, with a total of about 950,000 SNPs. The v4 platform was a fully customized array, including a lower redundancy subset of v2 and v3 SNPs with additional coverage of lower-frequency coding variation, and about 570,000 SNPs. The v5 platform is an Illumina Infinium Global Screening Array (∼640,000 SNPs) supplemented with ∼50,000 SNPs of custom content. Samples had minimum call rates of 98.5%.
We phased participant data using either an internally-developed tool, Finch (V1-V4 genotyping arrays) or Eagle2 (V5 genotyping array) [16]. Finch implements the Beagle haplotype graph-based phasing algorithm, modified to separate the haplotype graph construction and phasing steps [17]. It extends the Beagle model to accommodate genotyping error and recombination, to handle cases where there are no consistent paths through the haplotype graph for the individual being phased. We constructed haplotype graphs for European and non-European samples on each 23andMe genotyping platform from a representative sample of genotyped individuals, and then performed out-of-sample phasing of all genotyped individuals against the appropriate graph. For the X-chromosome, we built separate haplotype graphs for the non-pseudoautosomal region and each pseudoautosomal region, and these regions were phased separately.
Imputation
Imputation panels created by combining multiple smaller panels have been shown to give better imputation performance than the individual constituent panels alone [18]. To that end, we combined the May 2015 release of the 1000 Genomes Phase 3 haplotypes with the UK10K imputation reference panel to create a single unified imputation reference panel [19, 20]. Multiallelic sites with N alternate alleles were split into N separate biallelic sites. We then removed any site whose minor allele appeared in only one sample. For each chromosome, we used Minimac3 to impute the reference panels against each other, reporting the best-guess genotype at each site [21]. This gave us calls for all samples over a single unified set of variants. We then joined these together to get, for each chromosome, a single VCF with phased calls at every site for 6,285 samples.
In preparation for imputation, we split each chromosome of the reference panel into chunks of no more than 300,000 variants, with overlaps of 10,000 variants on each side. We used a single batch of 10,000 individuals to estimate Minimac3 imputation model parameters for each chunk [21]. We imputed phased participant data against the chunked merged reference panel using Minimac3, treating males as homozygous pseudo-diploids for the non-pseudoautosomal region. Throughout, we treated structural variants and small indels the same as SNPs.
Association tests
We computed association test results by regression assuming additive allelic effects (logistic regression for case-control traits [PD, tobacco use], linear regression for quantitative traits [alcohol consumption, BMI]). We included covariates for age, sex, the top five genetic principal components to account for residual population structure, and indicators for genotype platforms to account for genotype batch effects. The association test p-value we report was computed using a likelihood ratio test. For tests using imputed data, we use the imputed dosages rather than best-guess genotypes. For the X-chromosome, male genotypes were coded as if they were homozygous diploid for the observed allele.
Principal component analysis
We performed the genetic principal components analysis using ∼65,000 high-quality genotyped variants present in all five genotyping platforms and a random sample of one million research participants with predominantly European ancestry. Principal component scores for participants not included in the analysis were obtained by projection, combining the eigenvectors of the analysis and the SNP weights.
Quality control of genotyped GWAS results
We excluded SNPs that: 1) had a call rate < 90%, 2) had a Hardy-Weinberg p < 10–20 in people with predominantly European ancestry, 3) were only genotyped on the V1 and/or V2 platforms, 4) were found on the mitochondrial chromosome or the Y-chromosome, 5) failed a test for parent-offspring transmission (specifically, we regressed the child’s allele count against the mean parental allele count and excluded SNPs with fitted β< 0.6 and p < 10–20 for a test of β< 1), 6) had an association with genotype date (p < 10–50 by ANOVA of SNP genotypes against a factor dividing genotyping date into 20 roughly equal-sized buckets), 7) had a large sex effect (ANOVA of SNP genotypes, r2 > 0.1), or 8) had probes matching multiple genomic positions in the reference genome.
Quality control of imputed GWAS results
We excluded SNPs with imputed r2 < 0.3, as well as SNPs that had strong evidence of a platform batch effect. For each SNP we identified the largest subset of the data passing other quality control criteria based on their original genotyping platform –either v2 + v3 + v4 + v5, v4 + v5, v4, or v5 only –and computed association test results for the largest passing set. The batch effect test is an F test from an ANOVA of the SNP dosages against a factor representing the V4 or V5 platform; we excluded results with p < 10–50.
Additional quality control of GWAS results
Across both genotyped and imputed GWAS results, we excluded SNPs that had sample size of less than 20%of the total GWAS sample size. We also removed SNPs that did not converge during logistic regression, as identified by abs (effect) > 10 or stderr > 10 on the log-odds scale. We removed SNPs with MAF < 0.1%from linear regressions because these SNPs are sensitive to violations of the regression assumption of normally distributed residuals. If SNPs were both genotyped and imputed, and they passed QC for both, we used results from the imputed analysis.
After quality control, we had analysed 904,040 genotyped SNPs and 25,208,208 imputed SNPs.
Instrument construction
SNPs associated with each of the exposures at the genome-wide significance level (p < 5e–8) were included as instrumental variables. We excluded SNPs with a minor allele frequency < 3%and SNPs in the HLA locus (hg19, chromosome 6, 26.0 Mbp –33.7 Mbp). Instrument strength was assessed using the mean F statistic, as calculated by the system_metrics function in the TwoSampleMR R package [22].
Split-sample MR analysis
We performed MR analysis of the relationship between the exposures of interest and PD using a split-sample design, in accordance with published methods [23, 24]. Individuals from the 23andMe cohort were randomly allocated into two evenly sized groups (Table 1). Demographic differences between cases and controls across cohorts are shown in Table 2. The instrument-exposure association was measured in the first group (cohort 1), and the instrument-outcome association was measured in the second group (cohort 2), and MR analyses undertaken. We then repeated the MR analyses but using cohort 1 for the outcome and cohort 2 for the exposure. For each MR method, this resulted in two independent MR estimates, which were combined using an inverse variance weighted (IVW) fixed-effects meta-analysis.
Table 1
Participant numbers in cohort 1 and cohort 2
| Exposure variables | Outcome variable | |||
| Smoking | Alcohol | BMI | Parkinson’s disease | |
| Cohort 1 | Ever-smokers: 533,995 | 1,203,903 | 1,268,201 | Cases: 9,852 |
| Never-smokers: 728,610 | Controls: 1,206,650 | |||
| Cohort 2 | Ever-smokers: 533,704 | 1,204,410 | 1,267,856 | Cases: 10,072 |
| Never-smokers: 728,847 | Controls: 1,206,437 |
Table 2
Demographics of PD cases and controls in cohort 1 and cohort 2
| PD cases | Controls | p | ||||
| N | N | |||||
| Age, mean (SD), y | Cohort 1 | 71.0 (11.2) | 9,852 | 49.8 (17.4) | 1,206,650 | < 0.0001 |
| Cohort 2 | 71.1 (11.0) | 10,072 | 49.8 (17.4) | 1,206,437 | < 0.0001 | |
| Female, no. (%) | Cohort 1 | 3,967 (40.3%) | 9,852 | 665 524 (55.2%) | 1,206,650 | < 0.0001 |
| Cohort 2 | 3,901 (38.7%) | 10,072 | 665 325 (55.1%) | 1,206,437 | < 0.0001 | |
| Education, mean (SD), y | Cohort 1 | 16.3 (2.8) | 7,058 | 15.8 (2.7) | 1,069,986 | < 0.0001 |
| Cohort 2 | 16.3 (2.8) | 7,306 | 15.8 (2.7) | 1,070,797 | < 0.0001 | |
| Ever-smokers, no. (%) | Cohort 1 | 3,202 (37.8%) | 8,461 | 428 924 (37.6%) | 1,140,204 | 0.669 |
| Cohort 2 | 3,396 (39.3%) | 8,631 | 428 280 (37.6%) | 1,140,047 | < 0.0001 | |
| 0 alcohol measures over last 2 weeks, no. (%) | Cohort 1 | 3,133 (46.4%) | 6,745 | 374 145 (34.0%) | 1,099,968 | < 0.0001 |
| Cohort 2 | 3,235 (47.2%) | 6,847 | 374 702 (34.0%) | 1,100,536 | < 0.0001 | |
| BMI, mean (SD), kg/m2 | Cohort 1 | 26.7 (5.2) | 9,852 | 27.5 (6.0) | 1,206,650 | < 0.0001 |
| Cohort 2 | 26.7 (5.2) | 10,072 | 27.5 (6.0) | 1,206,437 | < 0.0001 | |
PD, Parkinson’s disease; SD, standard deviation; N, number of individuals in a cohort.
The effect of an exposure on PD was calculated for each SNP using the Wald ratio method [25]. In the IVW analysis we performed a linear regression constrained through the origin of the variant-exposure and the variant-outcome associations for each instrument, weighted by their inverse variance.
We used four methods to assess the impact of bias on IVW estimates [22]. Heterogeneity in Wald ratio estimates, which can indicate bias due to horizontal pleiotropy, was assessed using the Cochran’s Q test and I2 index [26]. dividual variant contributions to Cochran’s Q was calculated, and variants were excluded in the heterogeneity filtering analysis if their contribution surpassed the Bonferroni-corrected 99.8th percentile of the χ2 (1df) distribution. We performed MR-Egger analysis to assess the magnitude of bias occurring due to horizontal pleiotropy, the weighted median method to assess for invalid instruments, and generalised summary data-based MR (GSMR) to filter out pleiotropic SNPs (Supplementary Table 1).
To minimize misallocation of variants to the exposure rather than outcome group, we applied Steiger filtering to all analyses to remove genetic variants that had a stronger correlation with the outcome than with the exposure [27].
Replication in the International Parkinson’s Disease Genomics Consortium (IPDGC) dataset
Summary statistics from the largest published PD GWAS meta-analysis were used as the outcome data for replication after excluding data from 23andMe (the “IPDGC dataset”) [28]. he outcome summary statistics used for this analysis included 15,056 cases, 18,618 proxy cases, and 449,056 controls, and there were 17,410,431 genotyped and imputed SNPs tested for association with PD. Recruitment and genotyping quality control are described in the original report [28]. Only exposure SNPs from cohort 1 were used in the replication analysis, and we excluded Only exposure SNPs from cohort 1 were used in the replication analysis, and we excluded SNPs on the X-chromosome and palindromic SNPs.
Sensitivity analyses
If tobacco use has a protective effect on PD, we would expect genetic variants that increase the tobacco use to decrease PD risk in tobacco users, but to have no effect on PD risk in non-users. If these variants are protective for PD in separate analyses of both ever-smokers and never-smokers, however, this suggests that the protective effect is mediated by a pleiotropic pathway unrelated to tobacco use. Given that ever/never-smoker status has a positive genetic correlation with “number of cigarettes smoked per day” (ρg = 0.366, p = 4.5×10⁻⁴), we re-ran MR analyses separately for ever-smokers and never-smokers [29]. We also repeated this analysis using a single SNP (rs16969968) that associates with a missense mutation in CHRNA5 and has been shown to affect the amount of tobacco use within tobacco users [30]. In both analyses, we re-computed the effect of our instrument variables on PD in the same cohort, but stratifying on tobacco use status. We employed the same estimates of the effect of the tobacco use SNPs as in the main analysis. For the CHRNA5 SNP, we used the estimate from Millard et al. that each allele that increases tobacco use is associated with an odds ratio of 1.21 for being a “heavy smoker” (95%CI: 1.19–1.23) [30]. Note that this analysis may be subject to collider bias because the variants used here are associated with the phenotype used to stratify the sample [30].
Statistical analysis
Analyses were performed using R statistical software 3.3.2 (2016-10-31).
Data availability statement
Summary data is available via application at 23andMe https://research.23andme.com/dataset-access/.
RESULTS
Tobacco use
385 SNPs were associated with self-reported smoking status (ever- versus never-smoker) in cohort 1 (422 SNPs in cohort 2, Supplementary Tables 2 and 3). These instruments explained an average of 0.80%of the variance in tobacco smoking liability in the out-of-sample cohort (cohort 1 SNPs = 0.80%, cohort 2 SNPs = 0.79%). The F statistic (F = 54.3 in cohort 1, F = 52.6 in cohort 2) was high; validating this instrument for these analyses.
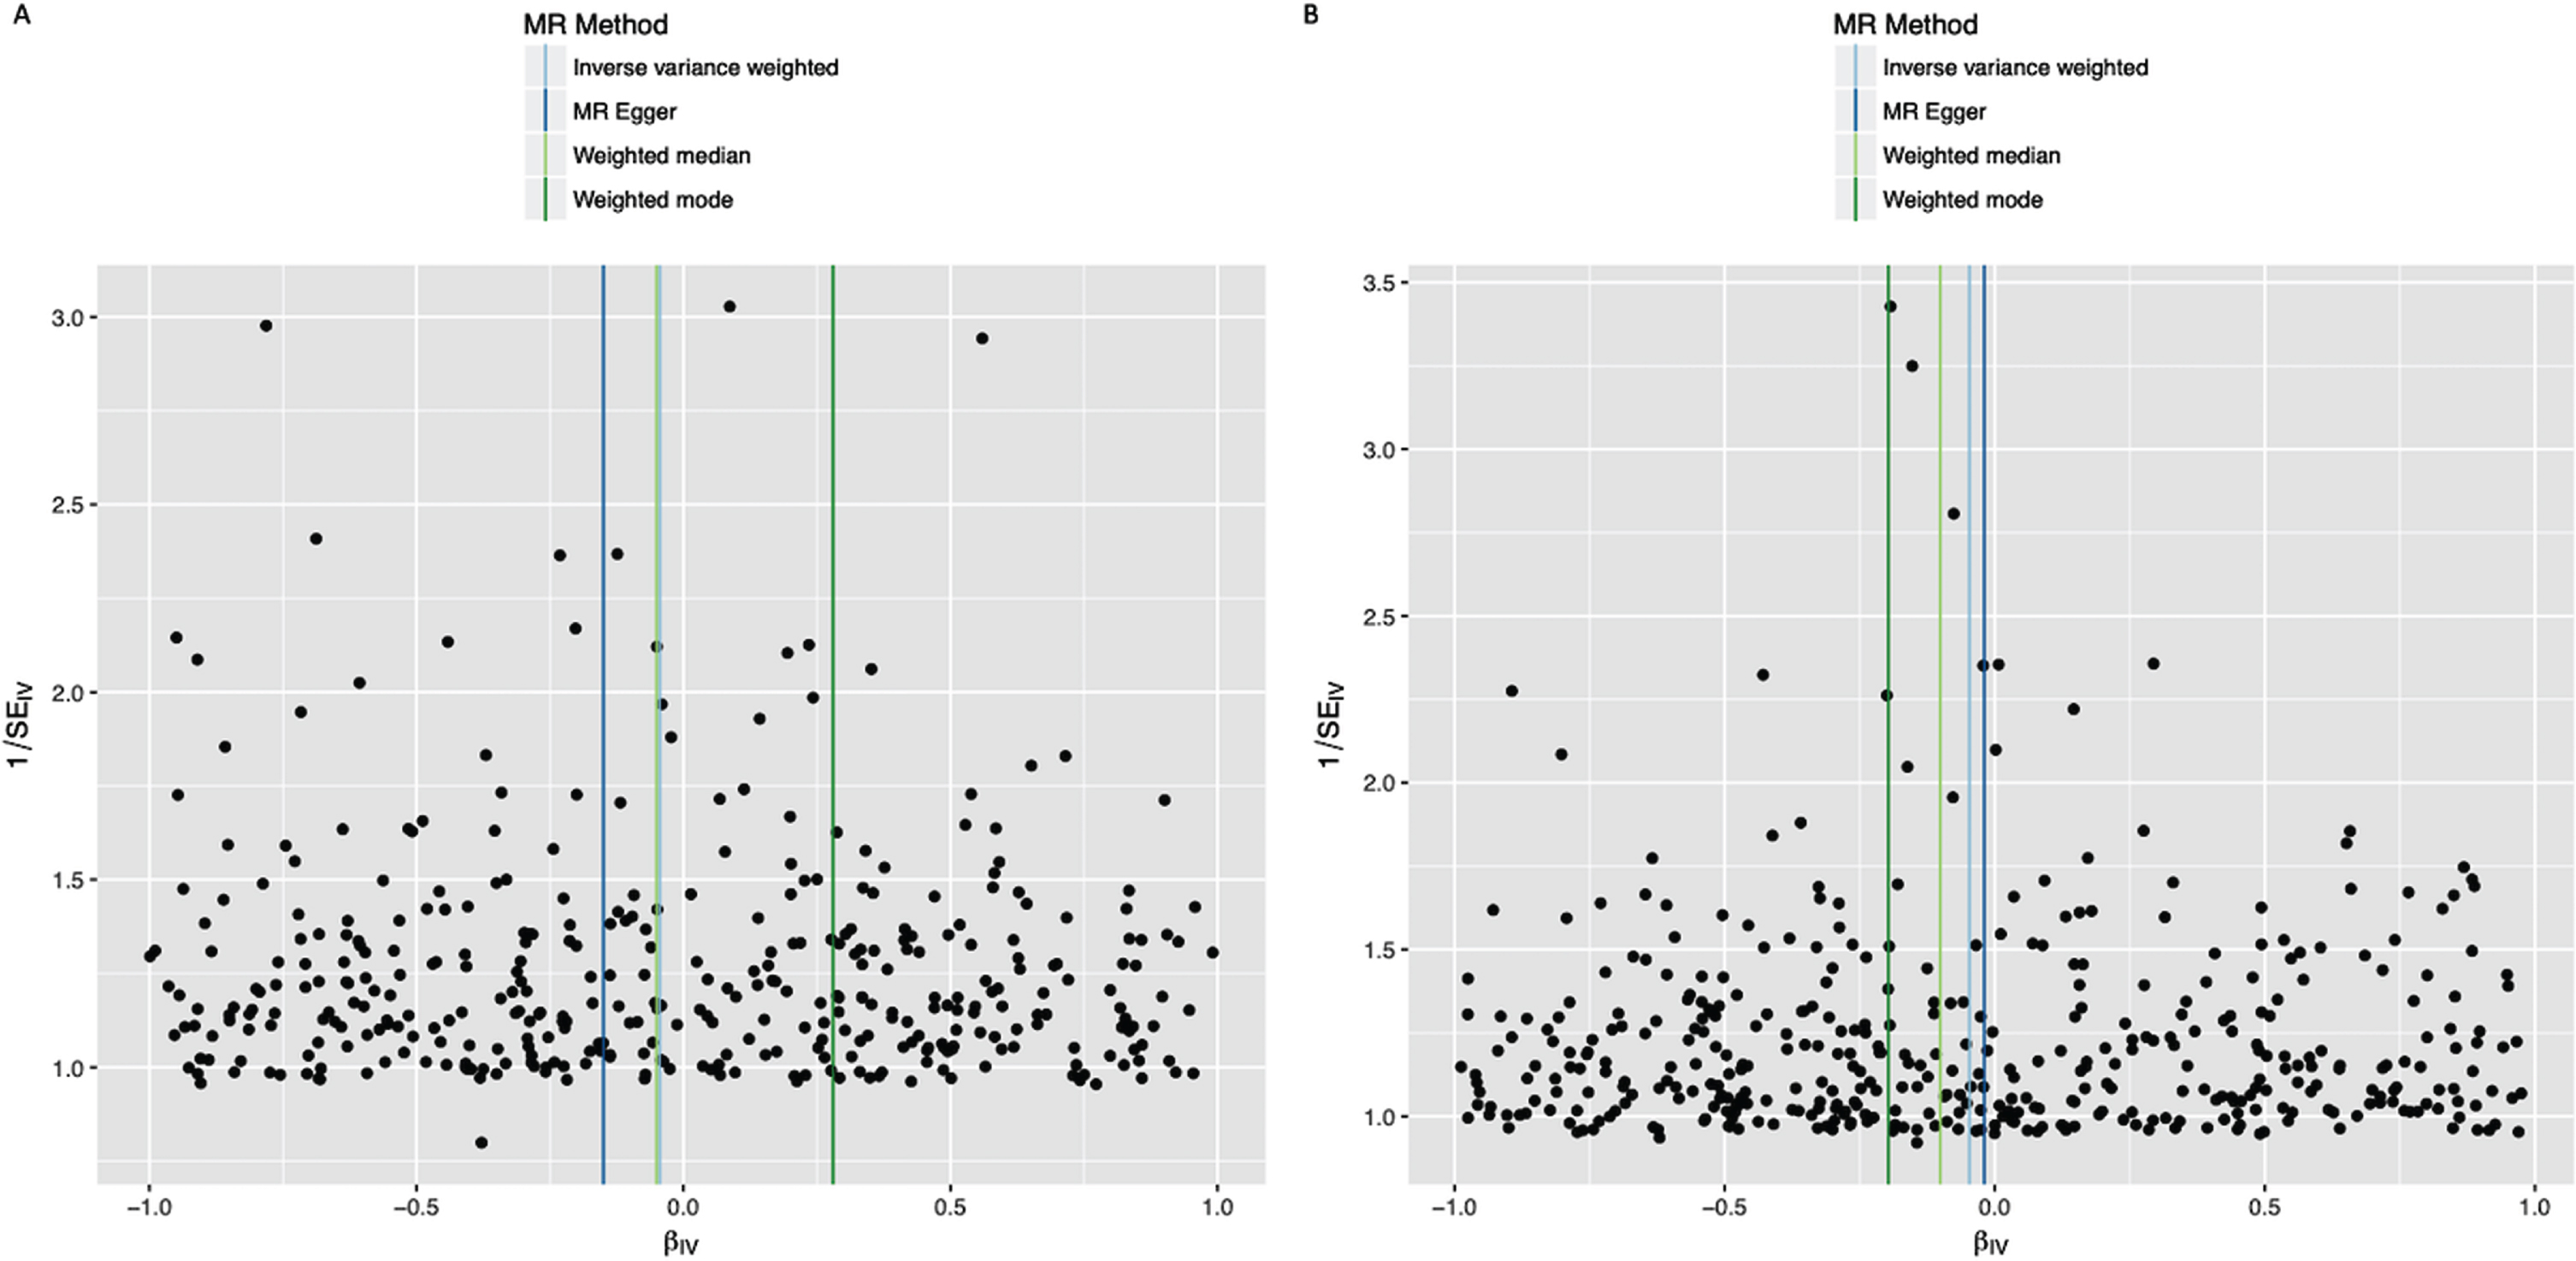
In the IVW analysis, ever-smoking had the effect of reducing PD risk with an OR 0.955 (95%CI 0.921–0.991, p = 0.013) (Fig. 1). Observational multivariate-adjusted ORs for smoking on risk of PD were similar to the IVW results (Supplementary Table 4). There was no clear evidence of heterogeneity in estimates derived from individual SNPs (cohort 1-versus-cohort 2: Cochran’s Q = 184.3, p = 1.000; cohort 2-versus-cohort 1: Cochran’s Q = 182.4, p = 1.000). The MR-Egger intercept was not significant (p = 0.193) and the estimate from MR-Egger was OR 0.867 (95%CI 0.747–1.006, p = 0.061). Funnel plots (Fig. 2A, B) suggested that individual variants were symmetrically distributed around the point estimate. These findings suggest no meaningful bias through unbalanced horizontal pleiotropy. The weighted median results (OR = 0.927, 95%CI 0.857–1.002, p = 0.058) and the GSMR results (OR = 0.955, 95%CI 0.905–1.008, p = 0.096) were similar to the IVW results, suggesting minimal bias due to invalid instruments. We replicated the IVW results in the IPDGC dataset (OR = 0.865, 95%CI 0.756–0.990, p = 0.035) and meta-analysis of the results from the two datasets yielded a stronger p-value than results from either dataset individually (OR = 0.949, 95%CI 0.916–0.983, p = 0.003) (Fig. 1). There was no clear evidence of heterogeneity in MR estimates derived from the two split-sample cohorts, nor between the 23andMe and IPDGC results (Supplementary Tables 5 and 6).
Fig. 1
Forest plot of Mendelian randomisation causal association estimates between risk of Parkinson’s disease and unhealthy behaviours derived from meta-analysis of the 23andMe and IPDGC datasets. The pooled odds ratio (OR), derived from meta-analysis of the inverse variance weighted estimates, and 95%confidence intervals are shown. For smoking, the unit of exposure is never versus ever smoking. For alcohol, the unit of exposure is 1-group difference in daily alcohol intake. For BMI, the unit of exposure is 1 kg/m2. OR, odds ratio; PD, Parkinson’s disease.
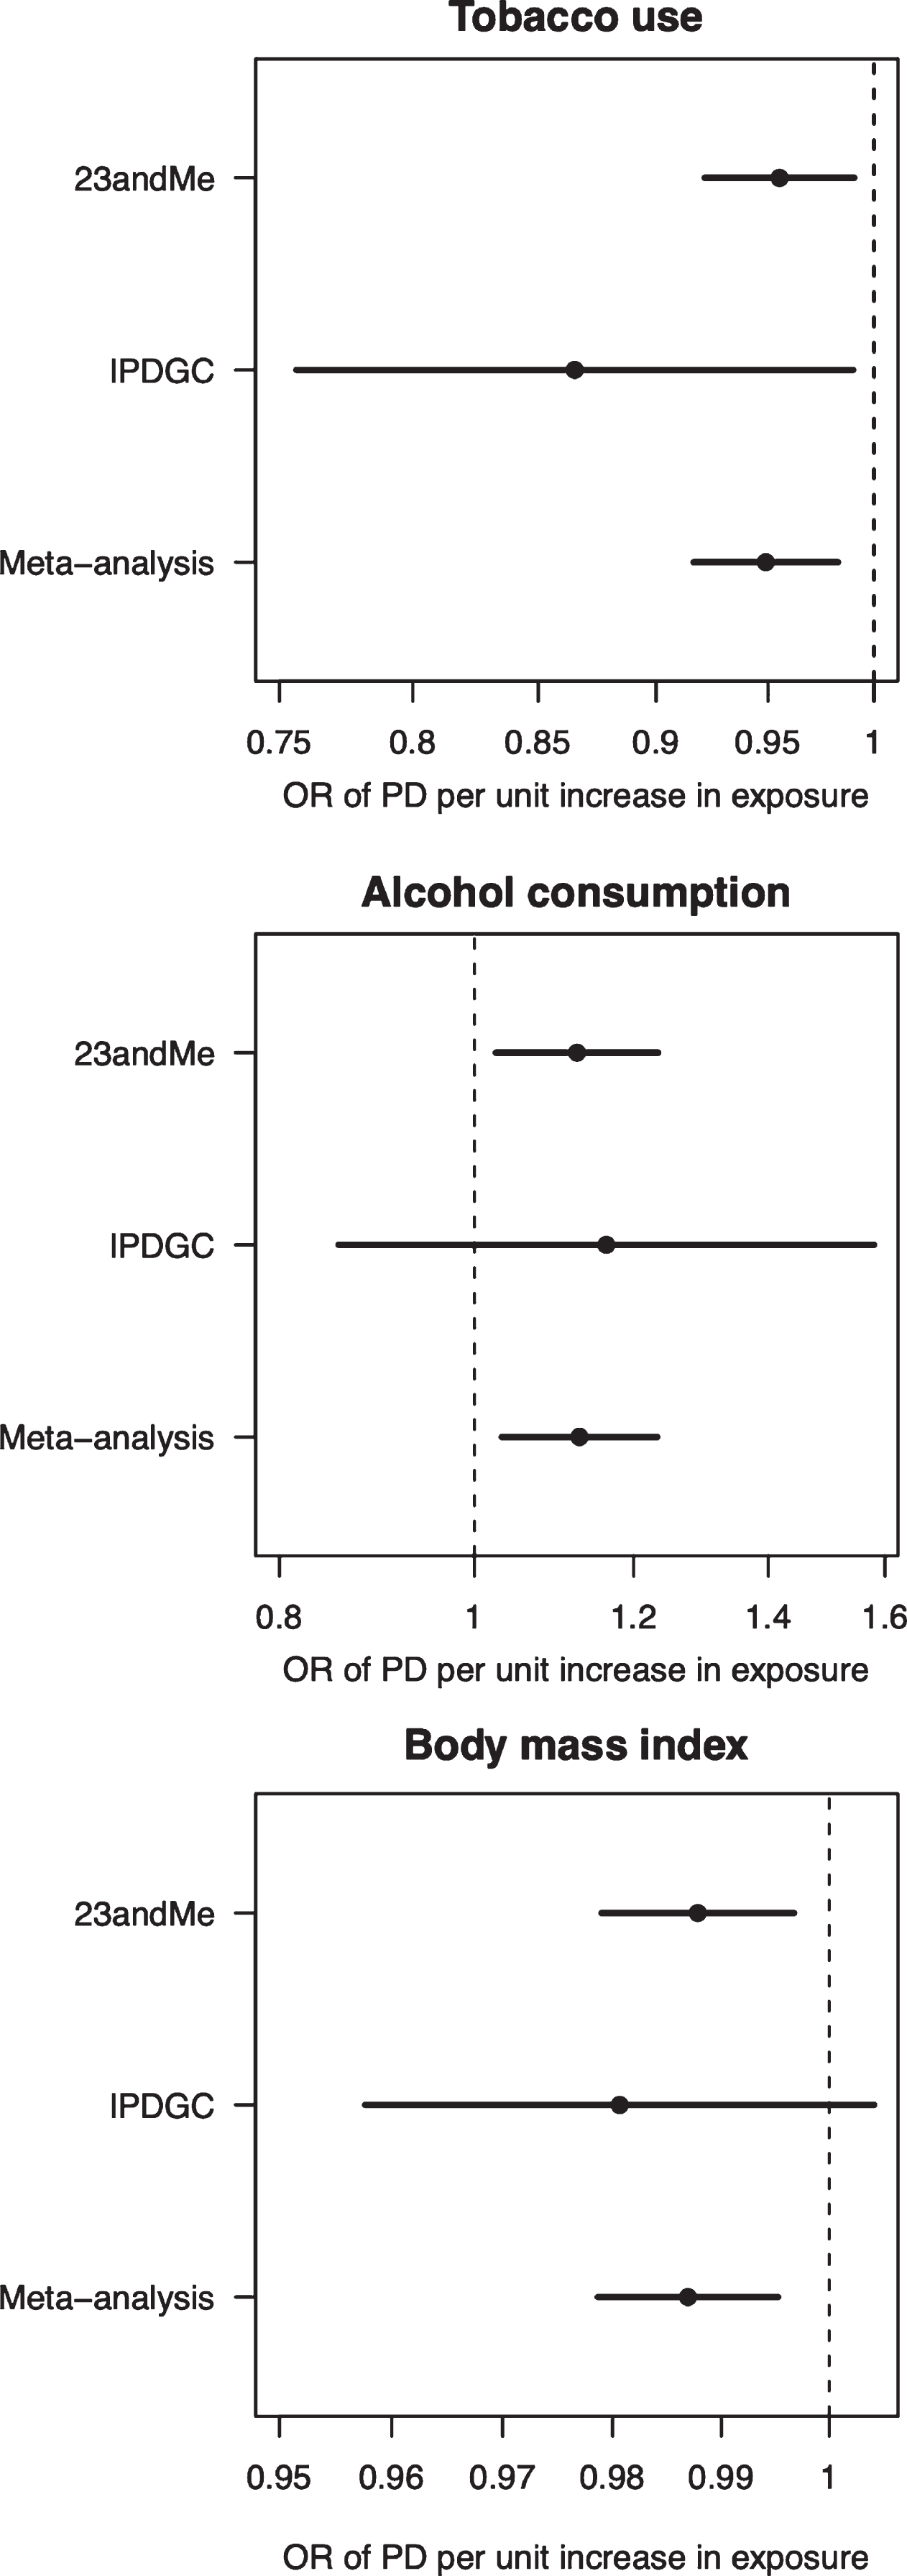
Fig. 2
Funnel plots of individual variant effects for the smoking instrument (from cohort 1 (A) and cohort 2 (B)) plotted against the inverse of their standard error.
As a sensitivity analysis, we re-ran MR in the 23andMe dataset separately for ever-smokers and never-smokers. We found a similar protective effect, although less precisely estimated, in ever-smokers (OR = 0.966, 95%CI 0.885–1.055) and little evidence of a protective effect in never-smokers (OR = 1.030, 95%CI 0.966–1.097). We found similarly imprecise estimates when performing MR using a SNP in CHRNA5 that strongly influences the amount of tobacco use within tobacco users (ever-smokers: OR = 1.037, 95%CI 0.888–1.211; never-smokers: OR = 1.033, 95%CI 0.849–1.256).
Alcohol intake
129 SNPs were associated with self-reported alcohol in cohort 1 (124 SNPs in cohort 2, Supplementary Tables 7 and 8). These instruments explained an average of 0.32%of the variance in alcohol intake liability in the out-of-sample cohort (cohort 1 SNPs = 0.33%, cohort 2 SNPs = 0.31%). The F statistic (F = 49.5 in cohort 1, F = 48.3 in cohort 2). validating this instrument for alcohol intake.
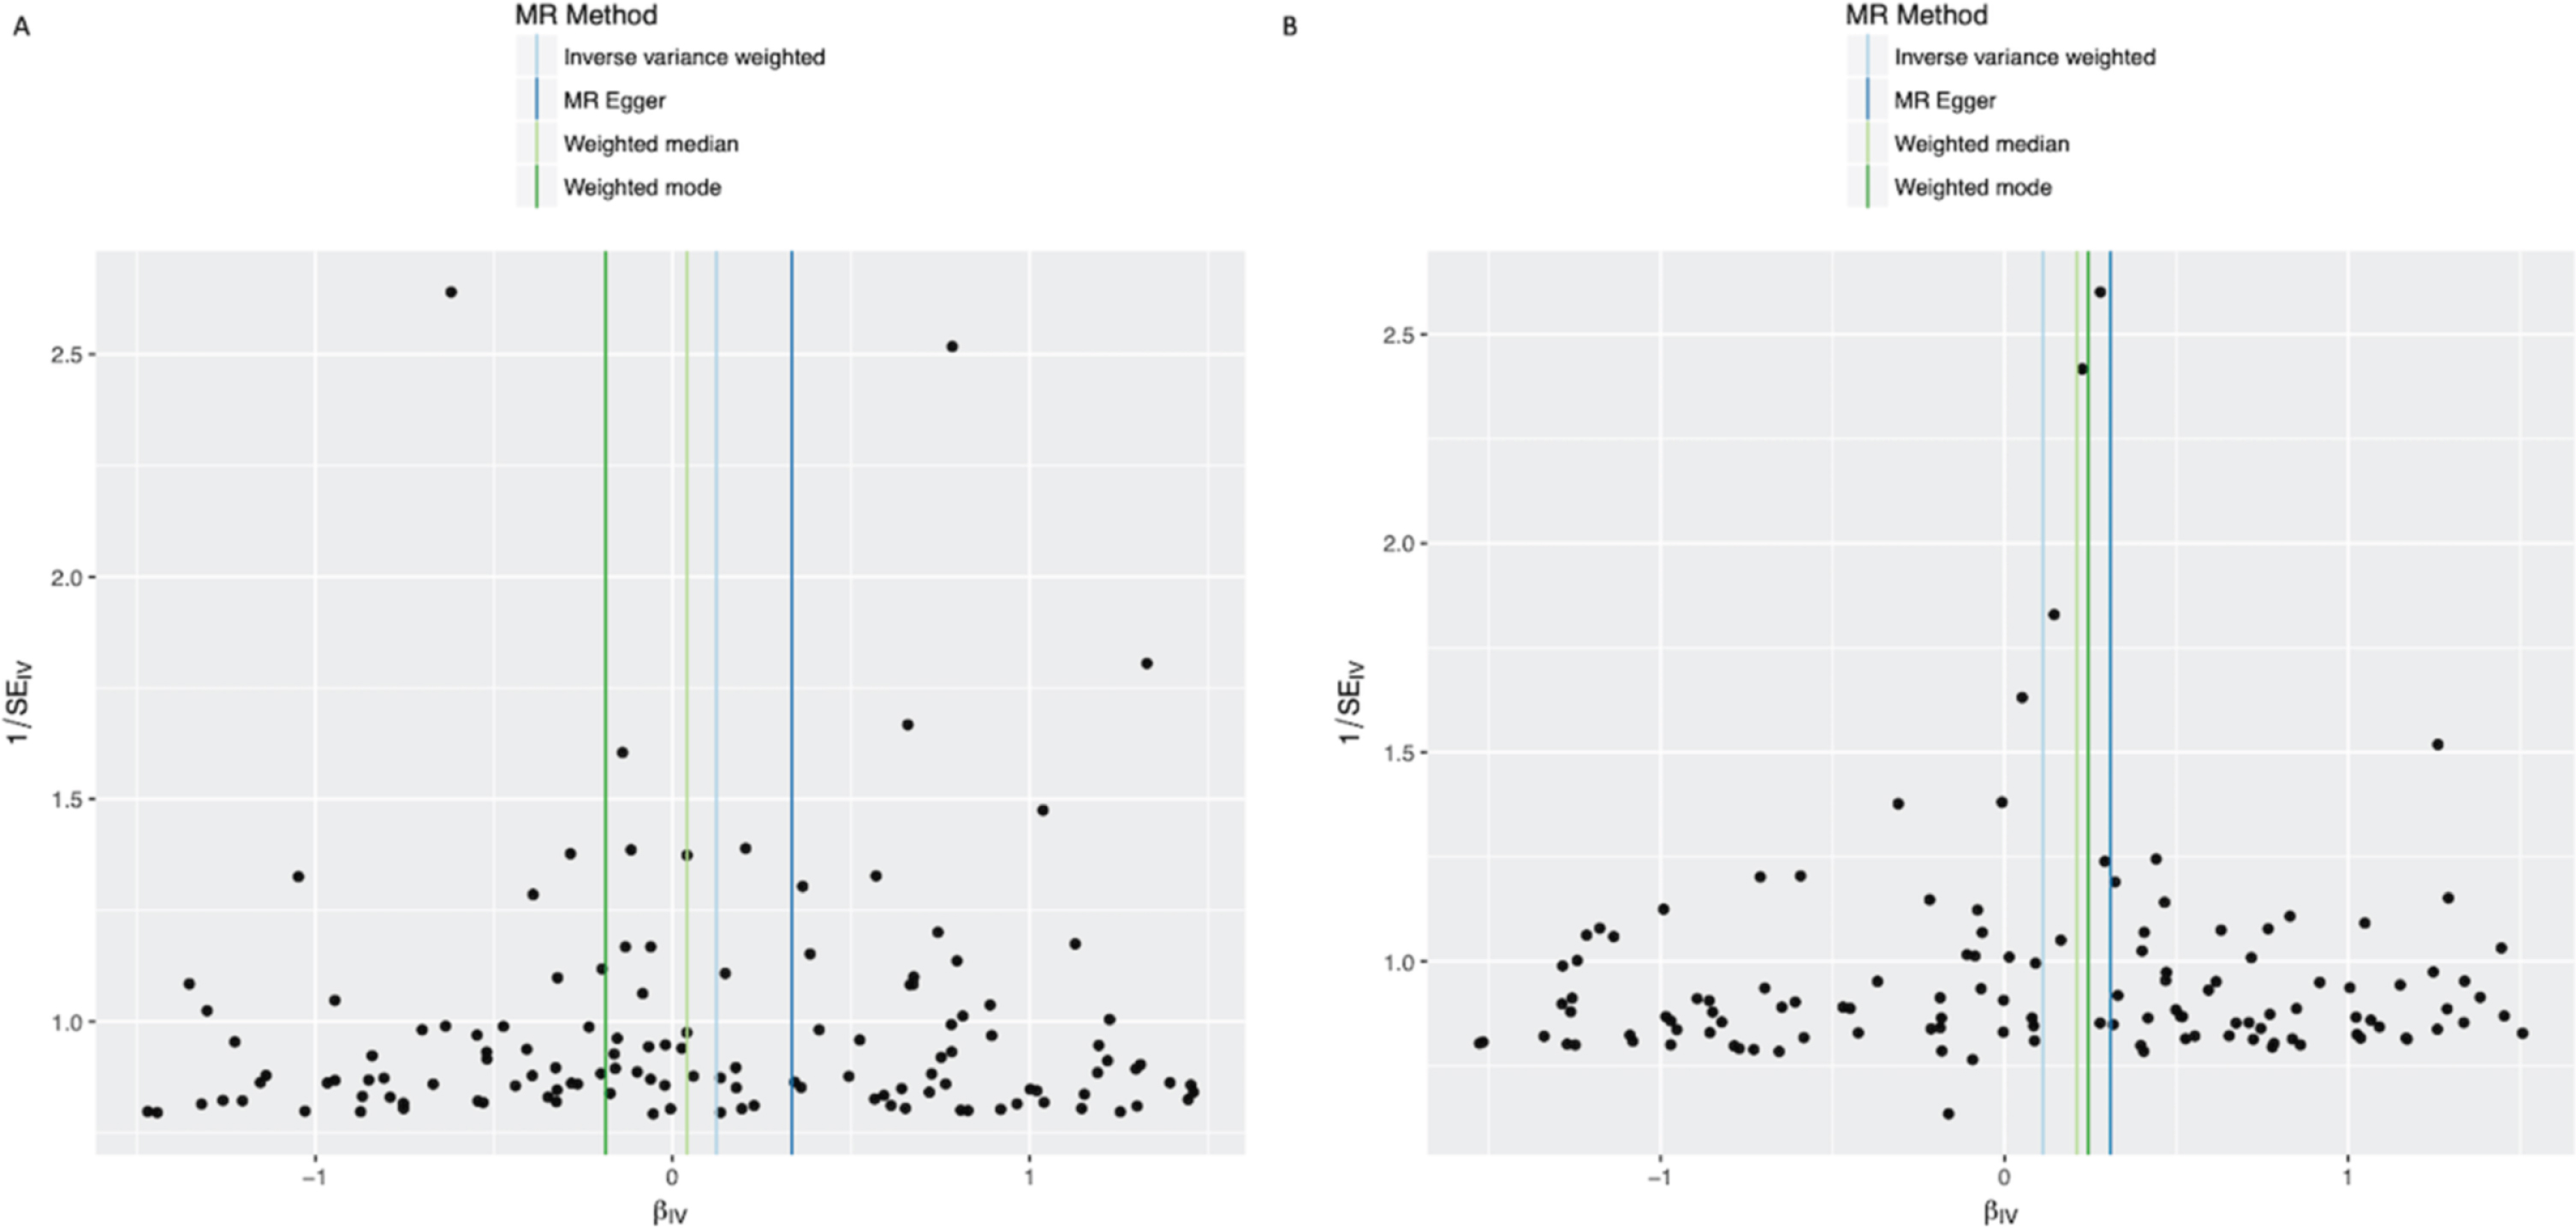
In the IVW analysis, alcohol intake had the effect of increasing PD risk with an OR 1.125 for a 1-group increase in daily alcohol intake (95%CI 1.025–1.235, p = 0.013) (Fig. 1). There was no clear evidence of heterogeneity against estimates derived from individual SNPs (cohort 1-versus-cohort 2: Cochran’s Q = 75.3, p = 1.000; cohort 2-versus-cohort 1: Cochran’s Q = 70.9, p = 1.000). The MR-Egger intercept was not significant (p = 0.152) and the estimate from MR-Egger was OR 1.438 (95%CI 1.014–2.038, p = 0.041). Funnel plots (Fig. 3A, B) suggested that individual variants were symmetrically distributed around the point estimate, suggesting no meaningful bias through unbalanced horizontal pleiotropy. The weighted median results (OR = 1.126, 95%CI 0.943–1.345, p = 0.189) and the GSMR results (OR = 1.125, 95%CI 0.996–1.271, p = 0.059) were consistent with the IVW results, but with wider confidence intervals, suggesting minimal bias due to invalid instruments. The point estimate in the IPDGC dataset was similar to the 23andMe result, but the confidence intervals were wide (OR = 1.163, 95%CI 0.856–1.580, p = 0.334). Meta-analysis of the results from the two datasets yielded a stronger p-value than results from either dataset individually (OR = 1.128, 95%CI 1.032–1.233, p = 0.008) (Fig. 1).
Fig. 3
Funnel plots of individual variant effects for the alcohol instrument (from cohort 1 (A) and cohort 2 (B)) plotted against the inverse of their standard error.
BMI
729 SNPs were associated with self-reported BMI in cohort 1 (693 SNPs in cohort 2, Supplementary Tables 9 and 10). These instruments explained an average of 4.56%of the variance in BMI liability in the out-of-sample cohort (cohort 1 SNPs = 4.63%, cohort 2 SNPs = 4.50%). The F statistic (F = 99.7 in cohort 1, F = 102.2 in cohort 2) indicating the validity of this instrument for BMI.
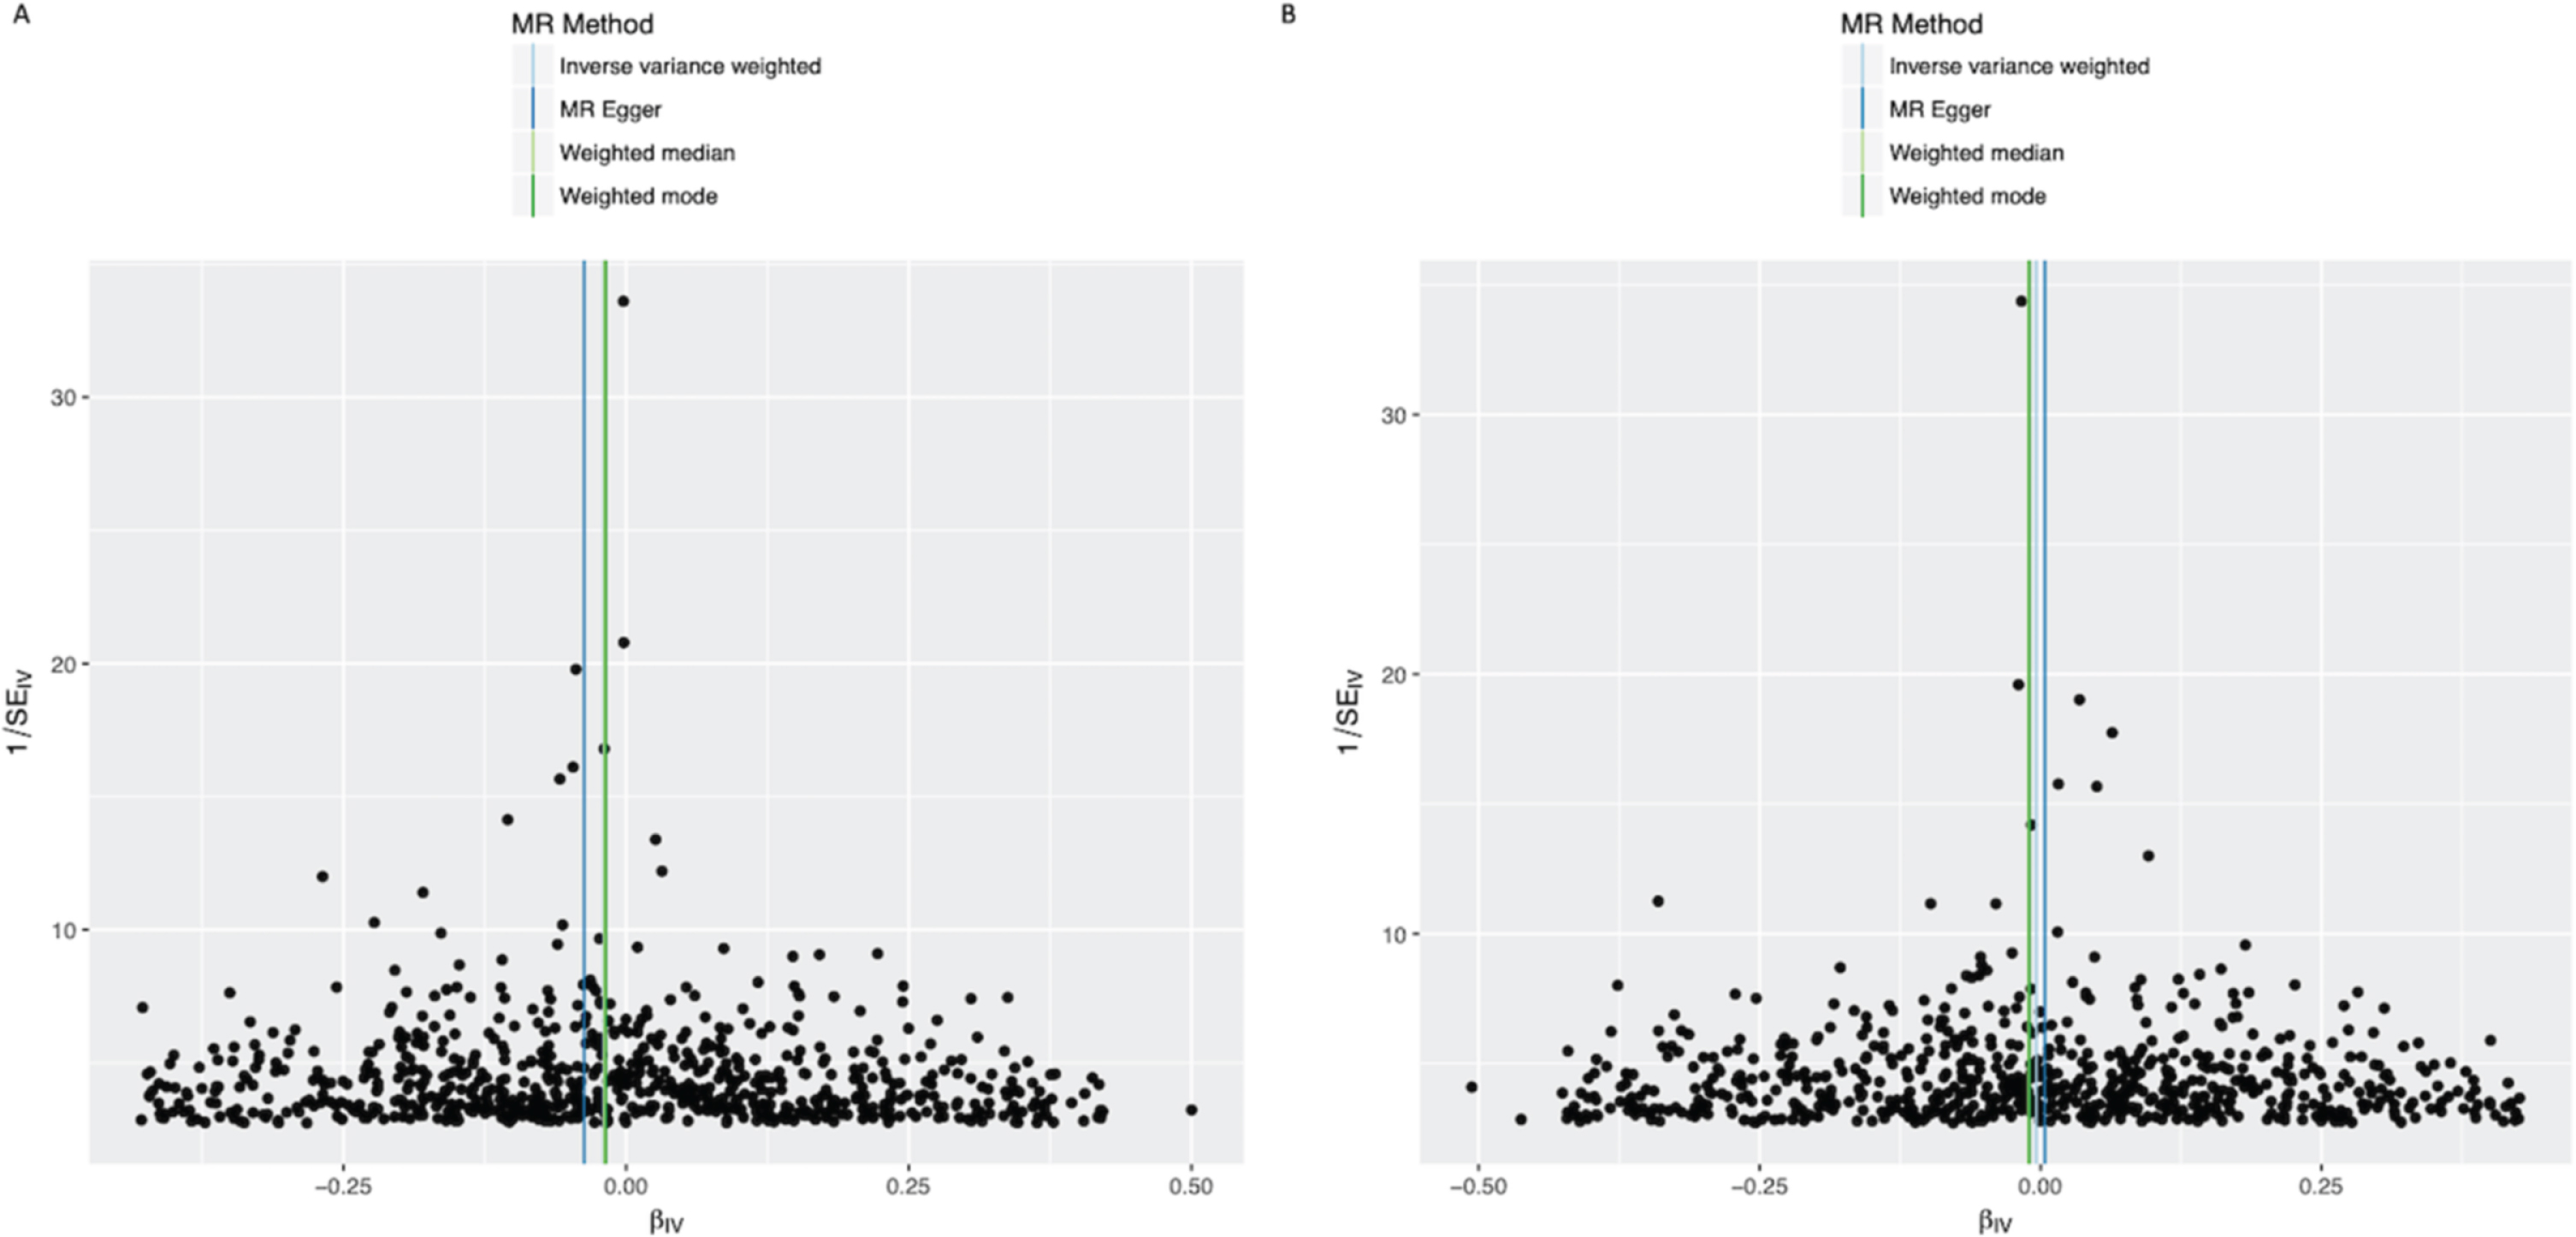
In the IVW analysis, a genetically-estimated 1 kg/m2 higher BMI had the effect of reducing PD risk with an OR 0.988 (95%CI 0.979–0.997, p = 0.008) (Fig. 1). There was no clear evidence of heterogeneity against estimates derived from individual SNPs (cohort 1-versus-cohort 2: Cochran’s Q = 184.3, p = 1.000; cohort 2-versus-cohort 1: Cochran’s Q = 539.8, p = 1.000). The MR-Egger intercept was not significant (p = 0.223) and the estimate from MR-Egger was OR 0.977 (95%CI 0.957–0.997, p = 0.023). Funnel plots (Fig. 4A, B) suggested that individual variants were symmetrically distributed around the point estimate, again suggesting no meaningful bias through unbalanced horizontal pleiotropy. The weighted median results (OR = 0.985, 95%CI 0.965–1.005, p = 0.132) and the GSMR results (OR = 0.988, 95%CI 0.978–0.998, p = 0.022) were consistent with the IVW results, suggesting minimal bias due to invalid instruments. The causal OR in the IPDGC dataset was similar to the 23andMe result, but the confidence intervals were wide (OR = 0.981, 95%CI 0.958–1.004, p = 0.106). Meta-analysis of the results from the two datasets yielded a stronger p-value than results from either dataset individually (OR = 0.987, 95%CI 0.979–0.995, p = 0.002) (Fig. 1).
Fig. 4
Funnel plots of individual variant effects for the BMI instrument (from cohort 1 (A) and cohort 2 (B)) plotted against the inverse of their standard error.
DISCUSSION
Using split-sample MR in a cohort of > 2.4 million participants, ever-smoking reduced the risk of PD by 5%compared to never-smoking. Sensitivity analyses suggested that the effect was unlikely to be driven by horizontal pleiotropy, outliers, or invalid instruments. The findings provide cautious support for a protective effect of smoking in the aetio-pathogenesis of PD.
These findings are concordant with observational studies demonstrating inverse associations between smoking and PD risk [1]. However, observational studies cannot definitively rule out reverse causality: in a study of 220,000 individuals, the protective effect of smoking on PD risk no longer held true among smokers who had quit > 20 years before recruitment, meaning that preclinical dopaminergic changes facilitating smoking cessation could not be excluded [31]. Similarly, a cohort study reported that parental smoking during childhood reduced future PD risk, however a transgenerational exposure, such as a toxin influencing parental smoking behaviour and PD risk in children, could not be excluded [32]. By circumventing the use of proxy measures to overcome unmeasured/residual confounding and reverse causality, the findings from MR analyses more robustly support a protective effect.
Our results are similar to other MR studies (Table 3) exploring the relationship between PD and tobacco use. Grover et al. found a significant protective effect (OR = 0.71 per log-odds of ever-smoking; 95%CI 0.57–0.90), while Nalls et al. found some evidence for a protective effect (OR = 0.94 per log-odds of ever-smoking; 95%CI 0.88–1.00, p = 0.063) [28, 33]. We observed a similar protective effect utilising a stringent instrument selection, large GWAS sample size and various sensitivity analyses, adding to the body of MR evidence suggesting a protective effect of tobacco smoking on the risk of PD.
Table 3
Exposure and outcome sample sizes and reported inverse variance weighted Mendelian randomisation estimates (odds ratio and 95%confidence interval) for the effect of smoking on risk of PD in the present study (23andMe discovery cohort and IPDGC replication cohort), and the two other Mendelian randomisation studies exploring the association between smoking and PD
| Smokers | Non-smokers | PD cases | PD proxy cases | Controls | Odds ratio (with 95% confidence interval) for never vs. ever smokers | |
| Grover et al. | 246,715 | 271,918 | 9,581 | .. | 33,245 | 0.71 (0.57–0.90) |
| Nalls et al. | 208,988 | 244,705 | 37,688 | 18,618 | 1,417,791 | 0.94 (0.88–1.00) |
| 23andMe discovery cohort | 1,067,699 | 1,457,457 | 19,924 | .. | 2,413,087 | 0.96 (0.92–0.99) |
| IPDGC replication cohort | .. | .. | 15,056 | 18,618 | 449,056 | 0.87 (0.76–0.99) |
PD, Parkinson’s disease; IPDGC, International Parkinson’s disease Genomics Consortium.
Early interventional studies demonstrated beneficial effects of nicotine on motor and cognitive deficits in PD [34–41]. However, placebo-controlled studies largely failed to replicate the protective association between smoking and PD [42–44]. This may be because trials assessed transient changes in PD symptoms post-nicotine in small cohorts. Given the heterogeneity in PD progression, demonstrating disease-modification would necessitate large sample sizes and long follow-up. Trials may also have failed because they examined disease-modifying effects of nicotine on established PD. However, the mechanisms underlying PD risk may be different to those driving disease progression. Our study suggests that smoking influences the former, highlighting the need for prevention trials of candidate disease-modifying therapies in pre-manifest PD.
Mechanisms underlying the effect of smoking on PD risk remain speculative. A disease-modifying effect of nicotine is biologically plausible given evidence that it mitigates MPTP- and 6-hydroxydopamine-induced motor dysfunction in animal models of PD [45]. The apparent protective effect of smoking on risk of PD was not observed when stratifying the MR analysis to a SNP in CHRNA5 that is known to strongly influence the amount of tobacco use within tobacco users. However, this analysis had little power to detect an association and yielded a confidence interval that is consistent with a detrimental, null, or beneficial effect on PD risk.
In this study we observed evidence for an increase in risk of PD with higher alcohol intake. Although a recent meta-analysis found that alcohol consumption was associated with a lower risk of PD in case-control studies (OR never versus heavy/moderate drinking: 0.74; 95%CI 0.64–0.85), in meta-analysed cohort studies the difference was non-significant [46]. In this study we similarly observed a corresponding discrepancy between the effect of alcohol intake on risk of PD in the observational analysis (OR 0.4) and MR analysis (OR 1.1). The inverse association observed in case-control studies may be driven by reverse causation, whereby lower alcohol consumption in cases reflects a low dopaminergic state or survivor bias. Our finding is consistent with the neurotoxic effect of excess alcohol in human neuropathological studies, and with studies in rodents showing that alcohol increases oxidative damage in nigral cells [47, 48]. Our results suggest that alcohol consumption is unlikely to help prevent PD.
We have previously observed a protective effect of higher BMI on risk of PD in an MR study [49]. Recently, a hypothesis-free MR approach exploring causal associations between exposures and PD observed that most of the top hits related to a protective effect of increased adiposity [50]. The results of our study support these previous observations.
The key strength of MR analyses is the use of genetic variants to explore the nature of associations between exposures and outcomes, thus limiting bias from residual confounding or reverse causation present in observational studies. However, there are general limitations inherent to all MR studies. Firstly, MR analysis assumes linearity, precluding us from identifying non-linear exposure-outcome associations. Secondly, it has been argued that survival bias may distort MR results. We mitigated this in part by employing two-sample design, which has been shown to minimise the impact of survival bias on effect estimates and previous work has shown that the protective effect of higher BMI on risk of PD was not clearly explained by survival bias [49, 51].
Additional specific limitations of our study include that we did not explore whether effects differed between sub-groups (for example between sexes, as previously suggested for the PD-smoking association) [1]. Our phenotypes were constructed using self-reported data derived from online surveys and may therefore suffer from recall bias and desirability bias. Finally, the individuals studied were not a random sample of the general population (Table 2 for cohort demographics), potentially leading to selection bias. For example, non-randomly-sampled participants can lead to biased SNP effect estimates and alter MR results [52]. Exposures and outcomes (excluding the IPDGC data) were self-reported and therefore our SNP effects may be underestimated. Underestimated SNP effects on the exposure may lead to inflated exposure-outcome IVW estimates away from the null. Nonetheless our results are consistent with a previous MR study demonstrating a protective effect of higher BMI on risk of PD with a larger effect size [49]. Independent replication of our findings in other datasets would provide further evidence that our findings are not an artefact of self-selection in the 23andMe cohort, including showing that our MR instrument for ever-never smoking is predictive of amount smoked.
In conclusion, we provide evidence to support a protective effect of smoking and high BMI on PD risk. Conversely, we observed a detrimental effect of alcohol on PD risk. Although a better understanding of the underlying mechanisms, as well as development of safe delivery methods is necessary, such findings help guide the prioritisation of candidate neuroprotective approaches for randomized controlled trials in participants at risk of developing PD.
ACKNOWLEDGMENTS
The work was financially supported by The Michael J. Fox Foundation for Parkinson’s Research (grant MJFF12737), National Institute on Aging (NIA) part of the National Institutes of Health (NIH) and by 23andMe, Inc. This work was supported in part by the Intramural Research Programs of the National Institute on Aging (NIA). The Preventive Neurology Unit at the Wolfson Institute of Preventive Medicine is funded by the Barts Charity. MPJ acknowledges the Isaac Schapera Trust for funding support.
CONFLICT OF INTEREST
The authors have no potential conflicts of interest to report.
SUPPLEMENTARY MATERIAL
[1] The supplementary material is available in the electronic version of this article: https://dx.doi.org/10.3233/JPD-202487.
REFERENCES
[1] | Li X , Li W , Liu G , Shen X , Tang Y ((2015) ) Association between cigarette smoking and Parkinson’s disease: A meta-analysis. Arch Gerontol Geriatr 61: , 510–516. |
[2] | Zhang D , Jiang H , Xie J ((2014) ) Alcohol intake and risk of Parkinson’s disease: A meta-analysis of observational studies. Mov Disord 29: , 819–822. |
[3] | Bellou V , Belbasis L , Tzoulaki I , Evangelou E , Ioannidis JP ((2016) ) Environmental risk factors and Parkinson’s disease: An umbrella review of meta-analyses. Parkinsonism Relat Disord 23: , 1–9. |
[4] | Heilbron K , Noyce AJ , Fontanillas P , Alipanahi B , Nalls MA , Cannon P ((2019) ) The Parkinson’s phenome-traits associated with Parkinson’s disease in a broadly phenotyped cohort. NPJ Parkinsons Dis 5: , 4. |
[5] | Wang YL , Wang YT , Li JF , Zhang YZ , Yin HL , Han B ((2015) ) Body mass index and risk of Parkinson’s disease: A dose-response meta-analysis of prospective studies. PLoS One 10: , e0131778. |
[6] | Evans AH , Lawrence AD , Potts J , MacGregor L , Katzenschlager R , Shaw K , Zijlmans J , Lees AJ ((2006) ) Relationship between impulsive sensation seeking traits, smoking, alcohol and caffeine intake, and Parkinson’s disease. J Neurol Neurosurg Psychiatry 77: , 317–321. |
[7] | Schrag A , Horsfall L , Walters K , Noyce A , Petersen I ((2015) ) Prediagnostic presentations of Parkinson’s disease in primary care: A case-control study. Lancet Neurol 14: , 57–64. |
[8] | Ritz B , Lee PC , Lassen CF , Arah OA ((2014) ) Parkinson disease and smoking revisited: Ease of quitting is an early sign of the disease. Neurology 83: , 1396–1402. |
[9] | Durcan R , Wiblin L , Lawson RA , Khoo TK , Yarnall AJ , Duncan GW , Brooks DJ , Pavese N , Burn DJ ((2019) ) Prevalence and duration of non-motor symptoms in prodromal Parkinson’s disease. Eur J Neurol 26: , 979–985. |
[10] | Noyce AJ , Nalls MA ((2016) ) Mendelian randomization - the key to understanding aspects of Parkinson’s disease causation? Mov Disord 31: , 478–483. |
[11] | Do CB , Tung JY , Dorfman E , Kiefer AK , Drabant EM , Francke U , Mountain JL , Goldman SM , Tanner CM , Langston JW , Wojcicki A , Eriksson N ((2011) ) Web-based genome-wide association study identifies two novel loci and a substantial genetic component for Parkinson’s disease. PLoS Genet 7: , e1002141. |
[12] | Dorsey ER , Darwin KC , Mohammed S , Donohue S , Tethal A , Achey MA , Ward S , Caughey E , Conley ED , Eriksson N , Ravina B ((2015) ) Virtual research visits and direct-to-consumer genetic testing in Parkinson’s disease. Digit Health 1: , 2055207615592998. |
[13] | Centers for Disease Control and Prevention. Adult Tobacco Use Information. http://cdc.gov/nchs/nhis/tobacco/tobacco_glossary.htm |
[14] | Henn BM , Hon L , Macpherson JM , Eriksson N , Saxonov S , Pe’er I , Mountain JL ((2012) ) Cryptic distant relatives are common in both isolated and cosmopolitan genetic samples. PLoS One 7: , e34267. |
[15] | Durand EY , Do CB , Mountain JL , Macpherson JM ((2014) ) Ancestry composition: A novel, efficient pipeline for ancestry deconvolution. bioRxiv 010512. |
[16] | Loh PR , Danecek P , Palamara PF , Fuchsberger C , Reshef A Y , Finucane K H , Schoenherr S , Forer L , McCarthy S , Abecasis GR , Durbin R , Price L A ((2016) ) Reference-based phasing using the Haplotype Reference Consortium panel. Nat Genet 48: , 1443–1448. |
[17] | Browning SR , Browning BL ((2007) ) Rapid and accurate haplotype phasing and missing-data inference for whole-genome association studies by use of localized haplotype clustering. Am J Hum Genet 81: , 1084–1097. |
[18] | Huang J , Howie B , McCarthy S , Memari Y , Walter K , Min JL , Danecek P , Malerba G , Trabetti E , Zheng HF , Gambaro G , Richards JB , Durbin R , Timpson NJ , Marchini J , Soranzo N ((2015) ) Improved imputation of low-frequency and rare variants using the UK10K haplotype reference panel. Nat Commun 6: , 8111. |
[19] | Auton A , Brooks LD , Durbin RM , Garrison EP , Kang HM , Korbel JO , Marchini JL , McCarthy S , McVean GA , Abecasis GR ((2015) ) A global reference for human genetic variation. Nature 526: , 68–74. |
[20] | Walter K , Min JL , Huang J , Crooks L , Memari Y , McCarthy S , Perry JR , Xu C , Futema M , Lawson D , Iotchkova V , Schiffels S , Hendricks AE , Danecek P , Li R , Floyd J , Wain LV , Barroso I , Humphries SE , Hurles ME , Zeggini E , Barrett JC , Plagnol V , Richards JB , Greenwood CM , Timpson NJ , Durbin R , Soranzo N ((2015) ) The UK10K project identifies rare variants in health and disease. Nature 526: , 82–90. |
[21] | Das S , Forer L , Schonherr S , Sidore C , Locke AE , Kwong A , Vrieze SI , Chew EY , Levy S , McGue M , Schlessinger D , Stambolian D , Loh PR , Iacono WG , Swaroop A , Scott LJ , Cucca F , Kronenberg F , Boehnke M , Abecasis GR , Fuchsberger C ((2016) ) Next-generation genotype imputation service and methods. Nat Genet 48: , 1284–1287. |
[22] | Hemani G , Bowden J , Haycock P , Zheng J , Davis O , Flach P , Gaunt T , Smith GD ((2017) ) Automating Mendelian randomization through machine learning to construct a putative causal map of the human phenome. bioRxiv 173682. |
[23] | Richmond RC , Davey Smith G , Ness AR , den Hoed M , McMahon G , Timpson NJ ((2014) ) Assessing causality in the association between child adiposity and physical activity levels: A Mendelian randomization analysis. PLoS Med 11: , e1001618–e1001618. |
[24] | Angrist JD , Krueger AB ((1995) ) Split-sample instrumental variables estimates of the return to schooling. J Business Econ Stat 13: , 225–235. |
[25] | Lawlor DA , Harbord RM , Sterne JA , Timpson N , Davey Smith G ((2008) ) Mendelian randomization: Using genes as instruments for making causal inferences in epidemiology. Stat Med 27: , 1133–1163. |
[26] | Greco MF , Minelli C , Sheehan NA , Thompson JR ((2015) ) Detecting pleiotropy in Mendelian randomisation studies with summary data and a continuous outcome. Stat Med 34: , 2926–2940. |
[27] | Hemani G , Tilling K , Davey Smith G ((2017) ) Orienting the causal relationship between imprecisely measured traits using GWAS summary data. PLoS Genet 13: , e1007081. |
[28] | Nalls MA , Blauwendraat C , Vallerga CL , Heilbron K , Bandres-Ciga S , Chang D , Tan M , Kia DA , Noyce AJ , Xue A , Bras J , Young E , von Coelln R , Simón-Sánchez J , Schulte C , Sharma M , Krohn L , Pihlstrom L , Siitonen A , Iwaki H , Leonard H , Faghri F , Raphael Gibbs J , Hernandez DG , Scholz SW , Botia JA , Martinez M , Corvol J-C , Lesage S , Jankovic J , Shulman LM , Sutherland M , Tienari P , Majamaa K , Toft M , Andreassen OA , Bangale T , Brice A , Yang J , Gan-Or Z , Gasser T , Heutink P , Shulman JM , Wood N , Hinds DA , Hardy JA , Morris HR , Gratten J , Visscher PM , Graham RR , Singleton AB ((2019) ) Expanding Parkinson’s disease genetics: Novel risk loci, genomic context, causal insights and heritable risk. bioRxiv 388165. |
[29] | Bulik-Sullivan B , Finucane HK , Anttila V , Gusev A , Day FR , Loh PR , Duncan L , Perry JR , Patterson N , Robinson EB , Daly MJ , Price AL , Neale BM ((2015) ) An atlas of genetic correlations across human diseases and traits. Nat Genet 47: , 1236–1241. |
[30] | Millard LAC , Munafò MR , Tilling K , Wootton RE , Davey Smith G ((2019) ) MR-pheWAS with stratification and interaction: Searching for the causal effects of smoking heaviness identified an effect on facial aging. PLoS Genet 15: , e1008353. |
[31] | Gallo V , Vineis P , Cancellieri M , Chiodini P , Barker RA , Brayne C , Pearce N , Vermeulen R , Panico S , Bueno-de-Mesquita B , Vanacore N , Forsgren L , Ramat S , Ardanaz E , Arriola L , Peterson J , Hansson O , Gavrila D , Sacerdote C , Sieri S , Kuhn T , Katzke VA , van der Schouw YT , Kyrozis A , Masala G , Mattiello A , Perneczky R , Middleton L , Saracci R , Riboli E ((2019) ) Exploring causality of the association between smoking and Parkinson’s disease. Int J Epidemiol 48: , 912–925. |
[32] | O’Reilly EJ , Chen H , Gardener H , Gao X , Schwarzschild MA , Ascherio A ((2009) ) Smoking and Parkinson’s disease: Using parental smoking as a proxy to explore causality. Am J Epidemiol 169: , 678–682. |
[33] | Grover S , Lill CM , Kasten M , Klein C , Del Greco MF , Konig IR ((2019) ) Risky behaviors and Parkinson disease: A mendelian randomization study. Neurology 93: , e1412–e1424. |
[34] | Moll H ((1926) ) The treatment of post-encephalitig parkinsonism by nicotine. Br Med J 1: , 1079–1081. |
[35] | Marshall J , Schnieden H ((1966) ) Effect of adrenaline, noradrenaline, atropine, and nicotine on some types of human tremor. J Neurol Neurosurg Psychiatry 29: , 214–218. |
[36] | Ishikawa A , Miyatake T ((1993) ) Effects of smoking in patients with early-onset Parkinson’s disease. J Neurol Sci 117: , 28–32. |
[37] | Mitsuoka T , Kaseda Y , Yamashita H , Kohriyama T , Kawakami H , Nakamura S , Yamamura Y ((2002) ) Effects of nicotine chewing gum on UPDRS score and P300 in early-onset parkinsonism. Hiroshima J Med Sci 51: , 33–39. |
[38] | Kelton MC , Kahn HJ , Conrath CL , Newhouse PA ((2000) ) The effects of nicotine on Parkinson’s disease. Brain Cogn 43: , 274–282. |
[39] | Villafane G , Cesaro P , Rialland A , Baloul S , Azimi S , Bourdet C , Le Houezec J , Macquin-Mavier I , Maison P ((2007) ) Chronic high dose transdermal nicotine in Parkinson’s disease: An open trial. Eur J Neurol 14: , 1313–1316. |
[40] | Lemay S , Chouinard S , Blanchet P , Masson H , Soland V , Beuter A , Bedard MA ((2004) ) Lack of efficacy of a nicotine transdermal treatment on motor and cognitive deficits in Parkinson’s disease. Prog Neuropsychopharmacol Biol Psychiatry 28: , 31–39. |
[41] | Fagerstrom KO , Pomerleau O , Giordani B , Stelson F ((1994) ) Nicotine may relieve symptoms of Parkinson’s disease. Psychopharmacology (Berl) 116: , 117–119. |
[42] | Group PS ((2006) ) Randomized placebo-controlled study of the nicotinic agonist SIB-1508Y in Parkinson disease. Neurology 66: , 408–410. |
[43] | Vieregge A , Sieberer M , Jacobs H , Hagenah JM , Vieregge P ((2001) ) Transdermal nicotine in PD: A randomized, double-blind, placebo-controlled study. Neurology 57: , 1032–1035. |
[44] | Villafane G , Thiriez C , Audureau E , Straczek C , Kerschen P , Cormier-Dequaire F , Van Der Gucht A , Gurruchaga JM , Quere-Carne M , Evangelista E , Paul M , Defer G , Damier P , Remy P , Itti E , Fenelon G ((2018) ) High-dose transdermal nicotine in Parkinson’s disease patients: A randomized, open-label, blinded-endpoint evaluation phase 2 study. Eur J Neurol 25: , 120–127. |
[45] | Costa G , Abin-Carriquiry JA , Dajas F ((2001) ) Nicotine prevents striatal dopamine loss produced by 6-hydroxydopamine lesion in the substantia nigra. Brain Res 888: , 336–342. |
[46] | Jimenez-Jimenez FJ , Alonso-Navarro H , Garcia-Martin E , Agundez JAG ((2019) ) Alcohol consumption and risk for Parkinson’s disease: A systematic review and meta-analysis. J Neurol 266: , 1821–1834. |
[47] | Harper C , Kril J , Daly J ((1987) ) Are we drinking our neurones away? Br Med J (Clin Res Ed) 294: , 534–536. |
[48] | Ambhore N , Antony S , Mali J , Kanhed A , Bhalerao A , Bhojraj S ((2012) ) Pharmacological and biochemical interventions of cigarette smoke, alcohol, and sexual mating frequency on idiopathic rat model of Parkinson’s disease. J Young Pharm 4: , 177–183. |
[49] | Noyce AJ , Kia DA , Hemani G , Nicolas A , Price TR , De Pablo-Fernandez E , Haycock PC , Lewis PA , Foltynie T , Davey Smith G , Schrag A , Lees AJ , Hardy J , Singleton A , Nalls MA , Pearce N , Lawlor DA , Wood NW ((2017) ) Estimating the causal influence of body mass index on risk of Parkinson disease: A Mendelian randomisation study. PLoS Med 14: , e1002314. |
[50] | Noyce AJ , Bandres-Ciga S , Kim J , Heilbron K , Kia D , Hemani G , Xue A , Lawlor DA , Smith GD , Duran R , Gan-Or Z , Blauwendraat C , Gibbs JR , Hinds DA , Yang J , Visscher P , Cuzick J , Morris H , Hardy J , Wood NW , Nalls MA , Singleton AB ((2019) ) The Parkinson’s Disease Mendelian Randomization Research Portal. bioRxiv 604033. |
[51] | Smit RA , Trompet S , Dekkers OM , Jukema JW , le Cessie S ((2019) ) Survival bias in Mendelian randomization studies: A threat to causal inference. Epidemiology 30: , 813–816. |
[52] | Pirastu N , Cordioli M , Nandakumar P , Mignogna G , Abdellaoui A , Hollis B , Kanai M , Rajagopal VM , Della Briotta Parolo P , Baya N , Carey C , Karjalainen J , Als TD , Van der Zee MD , Day FR , Ong KK , Study F , Morisaki T , de Geus E , Bellocco R , Okada Y , Børglum AD , Joshi P , Auton A , Hinds D , Neale BM , Walters RK , Nivard MG , Perry JRB , Ganna A (2020) Genetic analyses identify widespread sex-differential participation bias. bioRxiv, 2020.2003.2022.001453. |


