
Expression of Transcription Factors in CD4 + T Cells as Potential Biomarkers of Motor Complications in Parkinson’s Disease
Abstract
Background:
Management of motor complications (MC) represents a major challenge in the long-term treatment of Parkinson’s disease (PD) patients. In this context, the role of peripheral adaptive immunity may provide new insights, since neuroinflammatory mechanisms have been proved crucial in the disease.
Objective:
The aim of this study was to analyze the transcription factors genes involved in CD4 + T cells development to uncover specific molecular signatures in patients with (PMC) and without (WMC) motor complications.
Methods:
mRNA levels of CD4 + T lymphocytes transcription factor genes TBX21, STAT1, STAT3, STAT4, STAT6, RORC, GATA3, FOXP3, and NR4A2 were measured from 40 PD patients, divided into two groups according to motor complications. Also, 40 age- and sex-matched healthy controls were enrolled.
Results:
WMC patients had higher levels of STAT1 and NR4A2 (p = 0.004; p = 0.003), whereas in PMC we found higher levels of STAT6 (p = 0.04). Also, a ROC curve analysis confirmed STAT1 and NR4A2 as feasible biomarkers to discriminate WMC (AUC = 0.76, 95%CI 0.59–0.92, p = 0.005; AUC = 0.75, 95%CI 0.58–0.90, p = 0.007). Similarly, STAT6 detected PMC patients (AUC = 0.69, 95%CI 0.52–0.86, p = 0.037).
Conclusion:
These results provide evidence of different molecular signatures in CD 4 + T cells of PD patients with and without MC, thus suggesting their potential as biomarkers of MC development.
INTRODUCTION
Levodopa represents the main symptomatic treatment for Parkinson’s disease (PD). Nonetheless, after a variable time, its administration can lead to the development of complications (MC) such as motor fluctuations (MF) and levodopa-induced dyskinesias (LIDs). MF, defined as the worsening or reappearance of motor symptoms (often in parallel with low levodopa plasma concentration), include wearing-off, delayed-ON, no-ON, random ON-OFF, and early morning or nocturnal akinesia [1]. LIDs comprise different hyperkinetic involuntary movements (most commonly chorea and dystonia), which can be peak dose-related or diphasic. Both MF and LIDs have a great impact and affect patients’ quality of life [1, 2]. Known predictors for MC development are the presence of nonmotor features as well as medications and demographic factors (e.g., younger age at PD onset and lower body mass index) [3]. The pathological background of MC is complex and not yet fully understood. Interestingly, peripheral adaptive immunity is known to be a key regulator of neuroinflammation both in the central nervous system and in the periphery: accordingly, on one side T cells can be found in the substantia nigra of PD brains and on the other CD4 + T lymphocytes subsets from peripheral blood may have a crucial role as well [4, 5].
We recently reported reduced CD4 + T cells in PD patients [6] with relatively increased Th1 resulting in a putative pro-inflammatory Th1 bias. Remarkably, the peripheral immune imbalance observed in PD patients was recapitulated by a peculiar transcription factor (TF) gene expression profile in CD4 + T cells [6]. More specifically, in comparison with control subjects, PD patients had lower levels of TBX21, STAT3, STAT4, RORC, and NR4A2, and higher levels of STAT6, GATA3, and FOXP3. A similar peculiar molecular signature in CD4 + T cells, strongly resembling cells from PD patients, was reported in idiopathic REM sleep behavior disorder (iRBD): in both iRBD subjects and PD patients lower levels of TBX21, STAT3, and STAT4, and higher levels of FOXP3 were reported. iRBD represents the strongest risk factor for prodromal PD, and these findings suggested early involvement of peripheral immunity in the disease [7].
Whether neuroinflammation may be involved in disease progression, and in particular in the development of MC, is however still unclear. Boi and coll-eagues showed in an animal model that thalidomide and 3,6’-dithiothalidomide significantly attenuate the severity of L-dopa induced dyskinesias by reducing tumor necrosis factor (TNF)-α levels in the striatum and substantia nigra pars reticulata and increasing the levels of interleukin (IL)-10 [8]. Moreover, amantadine (a noncompetitive antagonist of the N-methyl-D-aspartate glutamate receptor commonly used to treat LIDs) can act on microglia by inhibiting its inflammatory activation [9]. Based on available evidence, it has been recently suggested that in PD abnormally activated microglia and astrocytes lead to altered neuronal-glial communication, thus affecting synaptic activity and neuroplasticity and contributing to the development of LIDs [10]. Similarly, a study from Teema et al. [11] showed in a rat model that treatment with ibuprofen or piroxicam in combination with l-dopa ameliorated wearing-off at the end of week 10, delayed the development of dyskinesia, and decreased striatal cyclooxygenase-2 (COX-2) and vascular endothelial growth factor (VEGF) levels. Taken together, these results point to a potential role of the immune system in the development of MC by affecting both presynaptic and postsynaptic mechanisms.
Although neuroinflammation is increasingly reg-arded as a key mechanism in MC occurring during PD progression, no information exists so far on the possible involvement of peripheral immunity. In the present study we, therefore, decided to explore in CD4 + T cells of PD patients with and without MC, the TF gene expression profile which we previously reported as dysregulated in both established PD as well as in iRBD [6, 7]. The identification of suitable molecular signatures could indeed be crucial for the early identification of subjects at risk of MC development, as well as to find new therapeutic targets and eventually delay MC onset in PD.
MATERIALS AND METHODS
Subjects
This is a retrospective case-control study: patients with an established diagnosis of idiopathic PD [12] were selected from an electronic database established in the context of a research program aimed at the study of peripheral immunity in PD [6, 7, 13]. The database currently includes 205 PD patients and 94 healthy controls (HC). At the time of enrollment, all patients underwent neurological assessment, performed by experienced neurologists in Movement Disorders. Motor symptoms and disease staging were assessed in “ON” condition using respectively the Unified Parkinson’s Disease Rating Scale (UPDRS) part III and the Hoehn and Yahr scale [14, 15]. Other relevant data were collected, including duration and type of antiparkinsonian treatment, age at PD onset, disease duration, interval between PD diagnosis and MC onset, interval between MC onset and blood withdrawal, and levodopa equivalent daily dose or LEDD [16]. For the aforementioned research program protocol, established exclusion criteria were: a history of chronic autoimmune diseases or cancer and administration of immunomodulatory treatment. A peripheral blood venous sample was obtained at enrollment and used to assess complete blood count and peripheral CD4 + T lymphocytes TF gene expression.
For the present study, we carefully revised the records of the 205 PD patients: drug-naïve patients (n = 69) and subjects with a later diagnosis of atypical parkinsonism (n = 4) were excluded from the analysis. Only drug-treated patients with comprehensive clinical and CD4 + T cells gene expression data available were included (n = 132). We subsequently selected those with motor complications (PMC), defined as those subjects who reported one or more of the following (wearing-off, delayed-ON, no-ON, random ON-OFF, early morning/nocturnal akinesia, peak-dose or diphasic dyskinesias). Of the 25 PMC identified, 5 patients were excluded because of moderate/severe dementia (Mini-Mental State Examination < 19 [17]). For each PMC, we selected a PD patient without motor complications (WMC), nearly perfectly matched with respect to sex, UPDRS part III score (±2 points), and duration of antiparkinsonian and levodopa treatment (±2 years). Finally, HC were also selected and matched to each PMC and WMC patient, according to sex and age (±2 years). The institutional Ethics Committee approved the study protocol (CE 65/16) and all subjects gave their informed written consent. The study was conducted according to the Declaration of Helsinki and following the international research ethical principles involving human subjects.
Isolation of CD4 + T cells and real-time PCR
Detailed procedures for isolation of peripheral blood mononuclear cells (PBMC) from whole blood, immunomagnetic isolation of CD4 + T cells, and total RNA extraction and reverse transcription, are described elsewhere [6, 7]. Expression of the TF genes TBX21, STAT1, STAT3, STAT4, STAT6, RORC, GATA3, FOXP3, and NR4A2 was measured by Real-Time PCR. To start Real-Time PCR reactions 2μl aliquots were obtained (cDNA final concentration: 1μg/μl) and the following thermal protocol was used: 20 s at 95°C (x 1, hot start); 2-step cycles as follows: 1 s at 95°C, 20 s at 60°C (x 40). Assays were performed in triplicate for each sample, and levels of mRNA were finally expressed as 2-DCt where DCt = [Ct (sample) - Ct (housekeeping gene)]. Relative expression was determined by normalization to the expression of RPS18, which is the gene for 18S cDNA.
Statistical analysis
Variables were expressed as counts and percentages when categorical and as mean±standard deviation when continuous. Normal distribution of data was assessed using the Shapiro-Wilk test. Differences between groups were analyzed through ANOVA analysis of variance, after testing for the ind-ependence of observations, normality of residuals, homogeneity of variances (Levene statistics) and checking for outliers, or with non-parametric Mann-Whitney U test if these assumptions were not met. Comparisons between categorical variables were ass-essed using Fisher’s exact test. When adjusting for covariates in the two-way ANCOVA model, ass-umptions for homogeneity of regression slopes and absence of interaction between each covariate and factors were tested. A receiver operating characteristic (ROC) curve analysis was carried out to esta-blish the biomarkers’ discriminatory power. Area under the curve (AUC) and significance values were obtained and AUC values interpretation was determined according to Mandrekar [18]. Optimal cut-offs were chosen by coordinate tracing of the ROC curve according to Youden’s index analysis. Sensitivity, specificity, positive, and negative likelihood ratios (LR+, LR-), positive and negative predictive values (PPV, NPV) were computed. Biomarkers’ combination was explored by estimating predicted probabilities from a logistic regression model and using the values obtained as the test variable in the ROC analysis. The significance level was set to p < 0.05. All analyses were performed using SPSS Version 25 (IBM Corporation, Armonk, USA) and Graphpad Prism version 8 (GraphPad Software Inc., San Diego, USA).
RESULTS
For this cross-sectional study we identified 20 PMC, 20 matched WMC, and 40 age- and sex-matched HC. Complete clinical and demographic data are shown in Table 1. PMC reported wearing off (100%), morning and nocturnal akinesia (15%), delayed or no-ON/random ON-OFF (20%), and peak-dose dyskinesias (45%). Fisher’s exact test and Mann-Whitney U test didn’t reveal any statistically significant difference between groups for any variable. Complete blood count showed slightly increased values of mean corpuscular hemoglobin (MCH) and mean corpuscular hemoglobin concentration (MCHC) in PMC compared to WMC (data not shown). Detailed data of TF mRNA levels in PMC, WMC and HC are included in Supplementary Table 1. Compared to HC, PD patients displayed significantly higher levels of STAT1, GATA3, STAT6, and FOXP3. When considering TF mRNA levels between PD subgroups, we found significantly higher levels of STAT1 and NR4A2 in WMC (respectively p = 0.004, p = 0.003), whereas PMC had higher levels of STAT6 (p = 0.04). Complete Real-Time PCR data, including TBX21/STAT4 (pro-Th1), STAT3/RORC (pro-Th17), and GATA3 (pro-Th2), can be seen in Fig. 1. When controlling in a two-way ANCOVA model for remaining potential confounders such as age, sex [19, 20], and disease duration, between-group differences were statistically significant for STAT1 and NR4A2 (see Table 2). We, therefore, evaluated the ability of TF mRNA levels in CD4 + T cells to discriminate between PD subgroups using ROC curve analysis: STAT1 and NR4A2 showed good AUC values (respectively 0.76, 95%CI 0.59–0.92, p = 0.005; 0.75, 95%CI 0.58–0.90, p = 0.007) thus efficiently identifying WMC. The combination of STAT1 and NR4A2 did not increase significantly the discrimination of WMC (AUC = 0.77, p = 0.003). On the other hand, STAT6 allowed MC identification (AUC = 0.69, 95%CI 0.52–0.86, p = 0.037), see Fig. 2. Choosing for STAT1 an optimal cut-off value of 1.99E–004, the LR+and LR- were respectively 12 and 0.4 (sensitivity = 60%, 95%CI 38.6%–78.1%; specificity = 95%, 95%CI 76.4%–99.7%; PPV = 92.3%, NPV = 70.4%). Considering for NR4A2 a cut-off value of 1.09E–004, LR+was 5.5 and the LR–0.5 (sensitivity = 55%, 95%CI 34.2%–74.2%; specificity = 90%, 95%CI 69.9%–98.2%; PPV = 84.6%, NPV = 66.7%). The optimal cut-off value for STAT6 was found at 9.157E–006, with a LR+value of 2.5 and a LR- value of 1.6 (sensitivity = 50%, 95%CI 29.93%–70.07%; specificity = 80%, 95%CI 58.40%–91.93%; PPV = 71%, NPV = 61%). Cut-off values for each TF with sensitivity, specificity, LR+, LR-, PPV and NPV are summarized in Table 3.
Table 1
Clinical and demographic characteristics of PD patients and healthy controls
| Number of patients (N = 40) | PMC (N = 20) | WMC (N = 20) | HC (N = 40) | P PMC vs WMC | P PD vs HC |
| Age (years), mean (SD) | 65.75 (10.3) | 70 (8.6) | 69.2 (8.6) | 0.13 | 0.519 |
| Sex (M/F) | 12/8 | 14/6 | 26/14 | 0.74 | 1.0 |
| Age at PD onset (years), mean (SD) | 57.15 (9.5) | 62.65 (7.8) | 0.07 | ||
| Disease duration, mean (SD) | 8.60 (4.9) | 7.60 (3.6) | 0.62 | ||
| UPDRS part III, mean (SD) | 15 (7.5) | 16.3 (6) | 0.36 | ||
| Hoehn and Yahr stage | |||||
| stage 1, n (%) | 8 (40%) | 13 (65%) | 0.20 | ||
| stage 2, n (%) | 10 (50%) | 6 (30%) | 0.33 | ||
| stage 3-4, n (%) | 2 (10%) | 1 (5%) | 0.50 | ||
| Antiparkinsonian therapy | |||||
| Levodopa, n (%) | 19 (95%) | 17 (85%) | 0.60 | ||
| Levodopa+COMTI, n (%) | 6 (30%) | 2 (10%) | 0.23 | ||
| DA, n (%) | 12 (60%) | 14 (70%) | 0.74 | ||
| MAOIs, n (%) | 12 (60%) | 12 (60%) | 1.0 | ||
| Duration of antiparkinsonian treatment (years), mean (SD) | 7.25 (4.5) | 6.2 (3.99) | 0.47 | ||
| Duration of levodopa treatment (years), mean (SD) | 4.28 (2.7) | 4.85 (2.8) | 0.51 | ||
| LEDD (mg/die), mean (SD) | 745.5 (353) | 625.5 (218.8) | 0.18 | ||
| Interval PD diagnosis-MC onset (years), mean (SD) | 5.1 (2.7) | ||||
| Interval MC onset-blood withdrawal (years), mean (SD) | 2.31 (1) | ||||
| Motor complications, n (%) | Wearing off, 20 (100%); morning/nocturnal akinesia, 3 (15%); delayed-ON/no- ON/random ON-OFF, 4 (20%); peak dose dyskinesias, 9 (45%) |
COMTI, Catechol-O-methyltransferase inhibitors; DA, dopamine agonists; HC, healthy controls; LEDD, levodopa equivalent daily dose; MAOIs, monoamine oxidase inhibitors; MC, motor complications; PD, Parkinson’s disease; PMC, patients with motor complications; WMC, patients without motor complications; UPDRS, Unified Parkinson’s Disease Rating Scale.
Fig. 1
Transcription factors mRNA levels in CD4 + T lymphocytes in PD patients with (PMC) and without (WMC) motor complications. Data are plotted as medians with 25°–75° percentiles (boxes) and min–max values (whiskers).
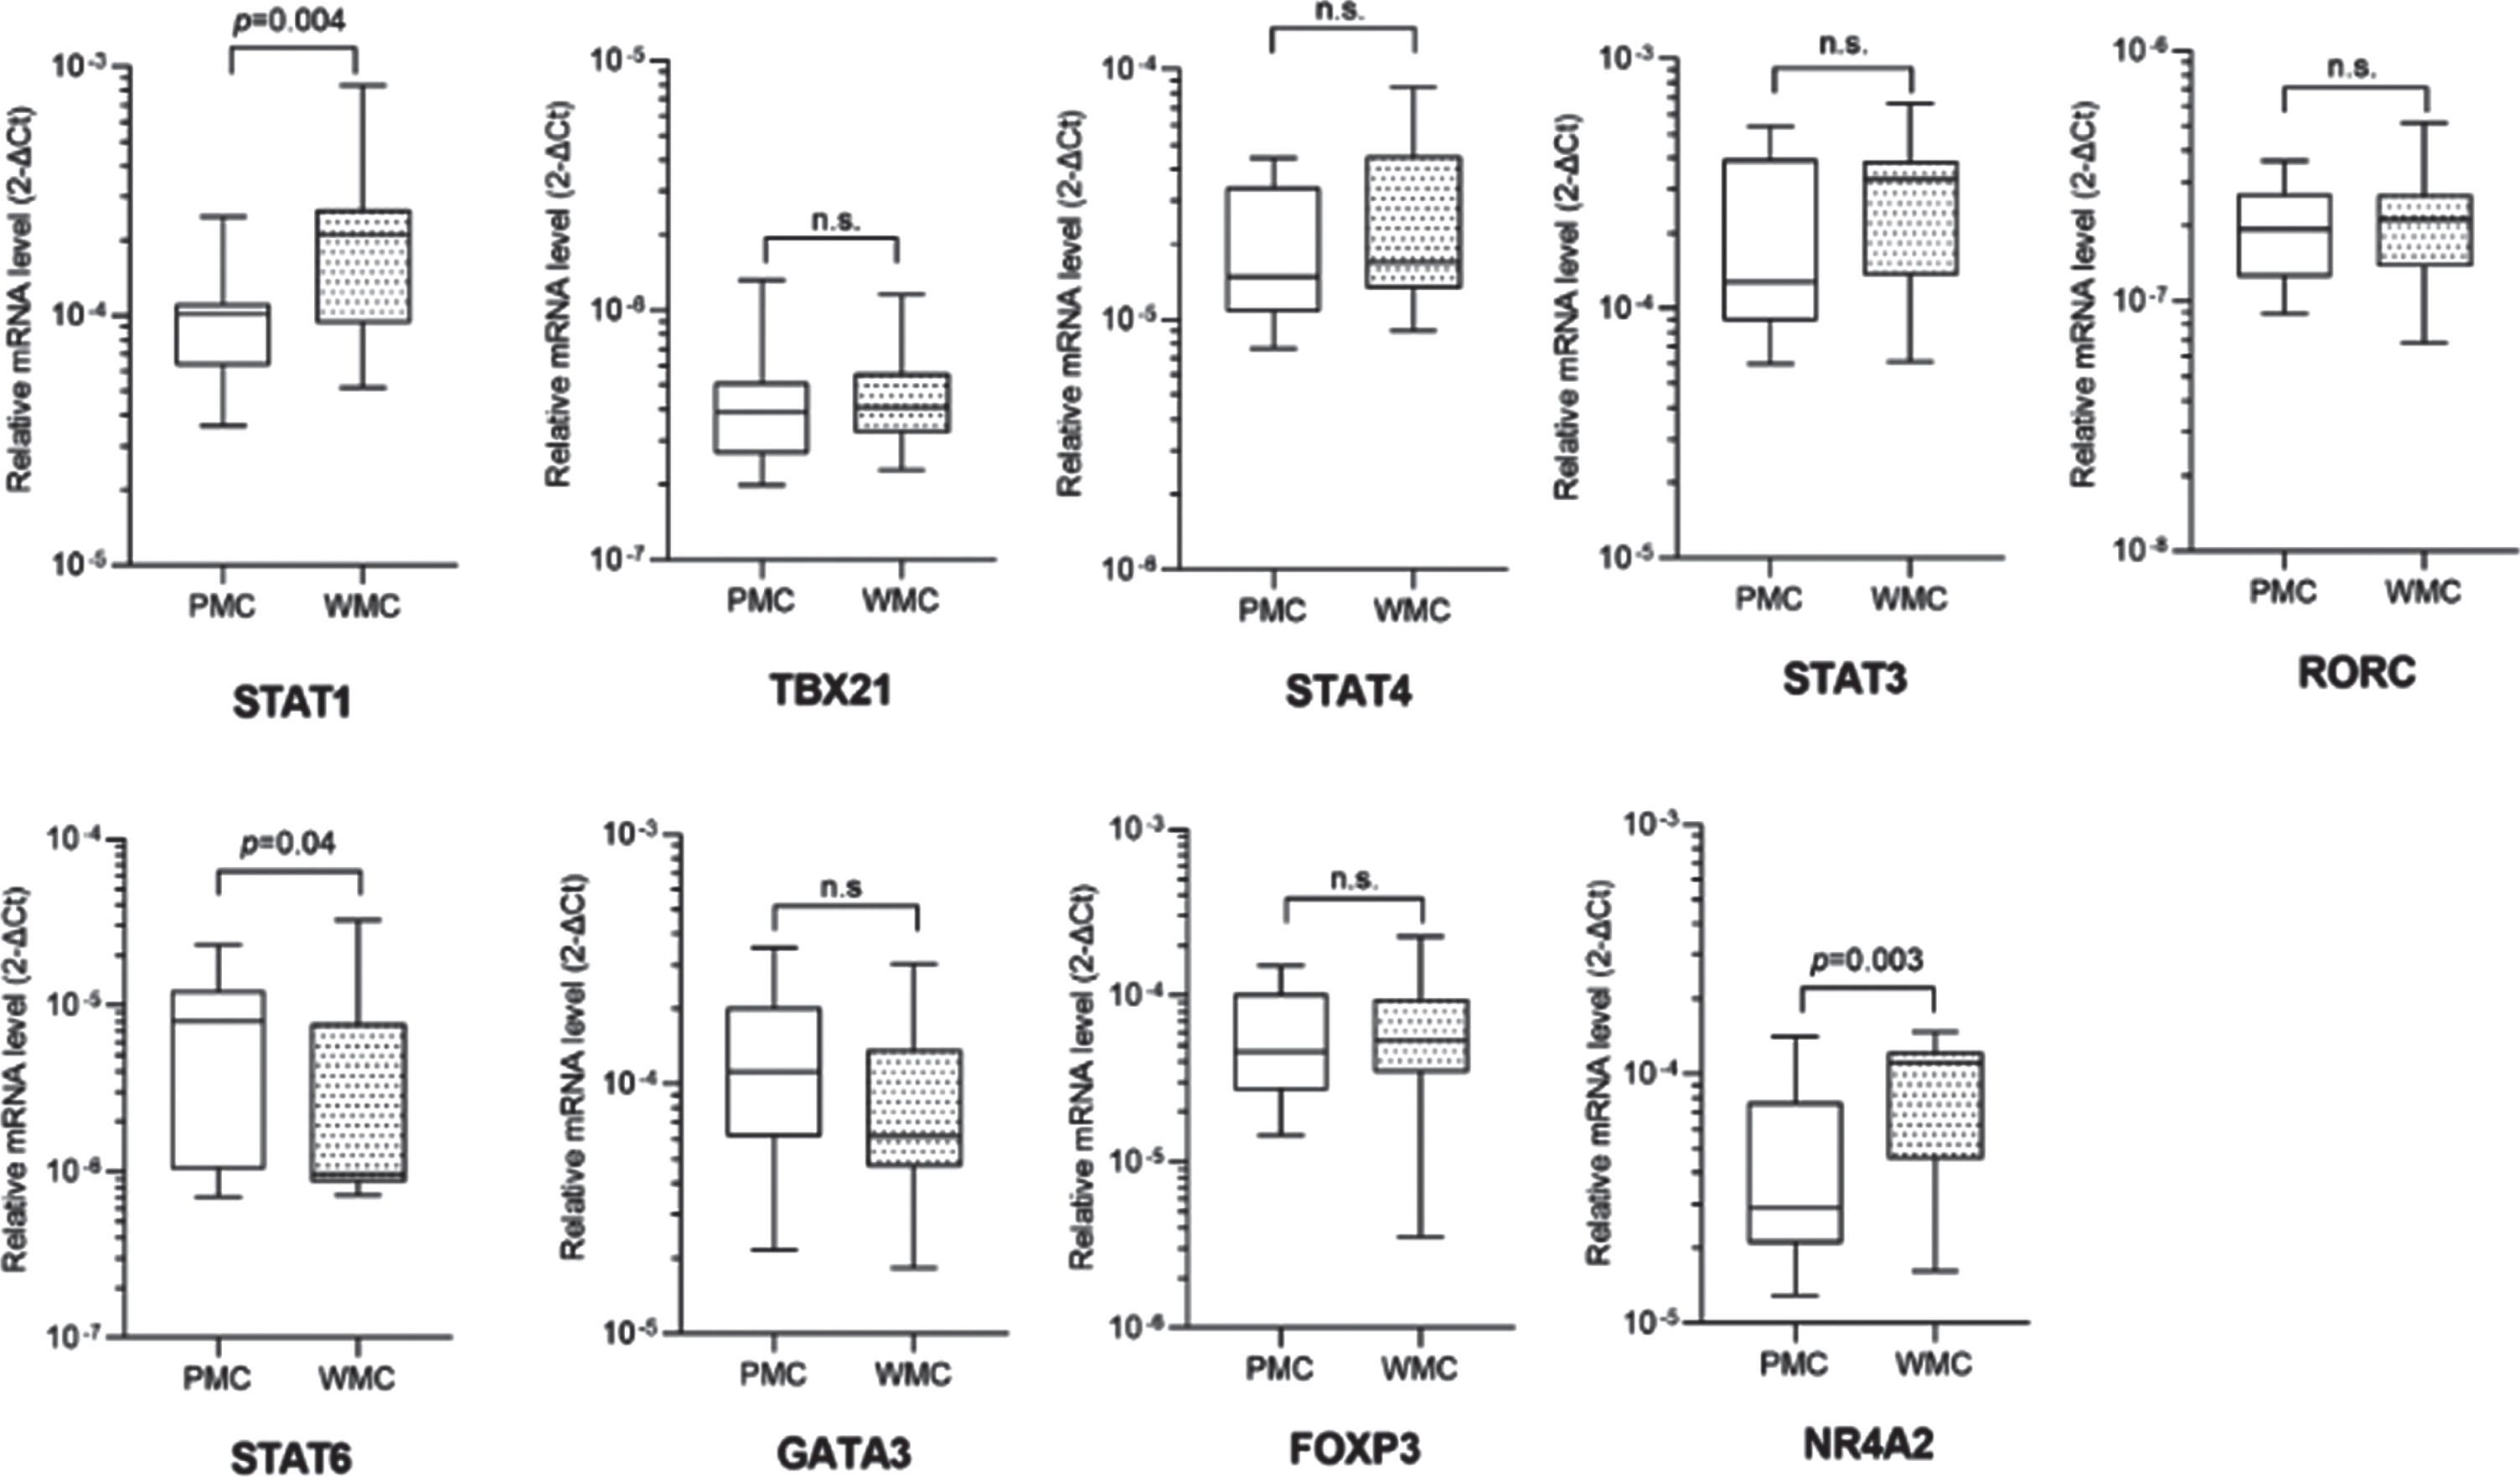
Table 2
Two-way ANCOVA for STAT1, NR4A2, and STAT6 adding age, disease duration, and sex as covariates in the model
| F | p | Partial eta squared | |
| STAT1 | |||
| Age | F(1,34) = 0.051 | 0.823 | 0.001 |
| Disease duration | F(1,34) = 1.683 | 0.203 | 0.047 |
| Sex | F(1,34) = 0.037 | 0.848 | 0.001 |
| Groups | F(1,34) = 5.844 | 0.021 | 0.147 |
| NR4A2 | |||
| Age | F(1,34) = 0.616 | 0.438 | 0.018 |
| Disease duration | F(1,34) = 4.948 | 0.033 | 0.127 |
| Sex | F(1,34) = 0.856 | 0.361 | 0.025 |
| Groups | F(1,34) = 6.243 | 0.017 | 0.155 |
| STAT6 | |||
| Age | F(1,34) = 0.182 | 0.672 | 0.050 |
| Disease duration | F(1,34) = 2.174 | 0.150 | 0.060 |
| Sex | F(1,34) = 0.234 | 0.631 | 0.007 |
| Groups | F(1,34) = 3.091 | 0.088 | 0.083 |
Fig. 2
ROC curves of transcription factors mRNA levels as candidate biomarkers to discriminate between patients with and without motor complications. Also AUC and p values are shown.
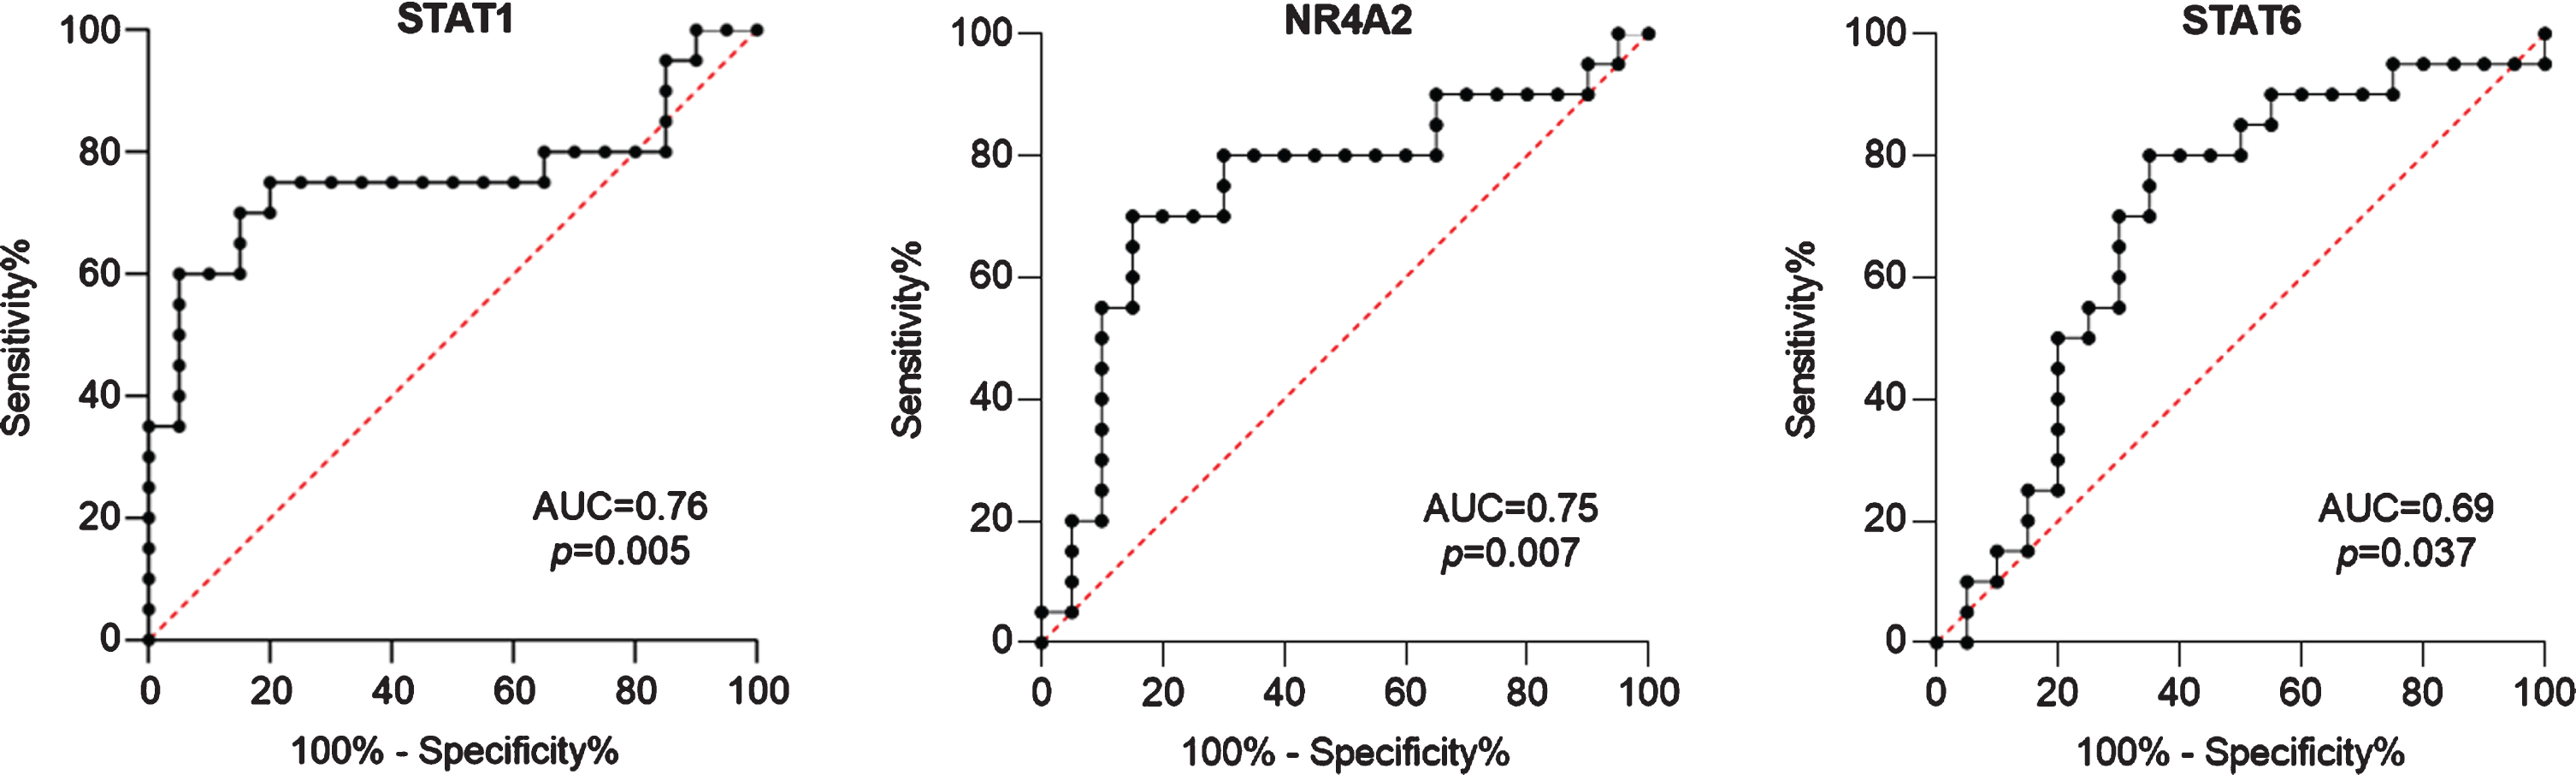
Table 3
Sensitivity, specificity, positive likelihood ratio (LR+), negative likelihood ratio (LR-), positive predictive value (PPV), and negative predictive value (NPV) for established cut-offs
| Genes | Cut-off value | Sensitivity (95%CI) | Specificity (95%CI) | LR+ | LR- | PPV | NPV |
| STAT1 | 1.99E-004 | 60%(38.6–78.1) | 95%(76.4–99.7) | 12 | 0.4 | 92.3% | 70.4% |
| NR4A2 | 1.09E-004 | 55%(34.2–74.2) | 90%(69.9–98.2) | 5.5 | 0.5 | 84.6% | 66.7% |
| STAT6 | 9.157E-006 | 50%(29.93–70) | 80%(58.40–91.9) | 2.5 | 1.6 | 71% | 61% |
DISCUSSION
This study provides evidence that PMC and WMC exhibit striking differences in lymphocytes TF. Distinct molecular patterns have previously been observed in drug-naïve/drug-treated PD patients and healthy controls using the same TF gene panel [6] but no significant data were found concerning disease progression. It is well recognized that STAT1, together with TBX21 and STAT4, drives Th1 differentiation whereas STAT3/RORC are involved in Th17, STAT6/GATA3 in Th2, and FOXP3/NR4A2 in Treg development [21–26]. More in detail, STAT1 and STAT3, in concert with Jmjd3 gene, activate microglia thus driving the production of neurotoxic molecules such as proinflammatory cytokines, chemokines, and nitric oxide [27]. The role of NR4A2 is fairly complex since it is crucial for the development and specification of midbrain dopamine neurons [28] and Le et al. found that its reduced expression increased the vulnerability of mesencephalic dopaminergic neurons to N-methyl–4-phenyl-1,2,3,6-tetrahydropyridine (MPTP)-induced injury [29]. Moreover, Montarolo et al. observed that in peripheral blood mononuclear cells (PBMC) from PD patients there is a marked down-regulated expression of the whole NR4A family subsets (NR4A1, NRA4A2, NRA4A3) [30].
The present study, on one side confirms the role of CD4 + T lymphocytes in discriminating PD patients from HC, while on the other points out novel and intriguing findings. We demonstrated that remarkable differences in STAT1, NR4A2, and STAT6 expression can be detected in PD patients with and without MC. In our previous study [6] these TF genes were similar in drug-treated and drug-naïve patients, thus opening the question of whether therapy or disease progression may influence their expression. Accordingly, the confounding effect of longer disease duration in our PD group (8.10±4.3 years) has been carefully addressed in the ANCOVA model, confirming the prominent role of STAT1 and NR4A2 in identifying WMC subgroup.
The role of neuroinflammation in MC has been explored in various preclinical studies: Barnum et al. tested the anti-dyskinetic effect of corticosterone in 6-hydroxydopamine (6-OHDA)-lesioned rats (made dyskinetic by l-DOPA chronic treatment) and observed that l-DOPA-treated animals showed increased striatal expression of pro-inflammatory cytokines, particularly interleukin-1beta (IL-1β), which was prevented by corticosterone administration [31]. Another study found that there are strong correlations between LIDs occurrence and expression of a pro-inflammatory microglia phenotype: in 6-OHDA-lesioned rats, pulsatile l-DOPA administration but not continuous subcutaneous l-DOPA infusion determined progressive development of abnormal involuntary movements [32].
Nevertheless, evidence from human studies is lacking and the association between peripheral immunity and long-term treatment complications is still elusive. In this scenario, the present study provides for the first time distinctive molecular patterns that discriminate PMC and WMC. Among limitations, the retrospective case-control design, the small sample size which limited subgroup analysis in the PMC group, and missing information related to circulating CD4 + T lymphocytes should be mentioned. However, the limited number of patients recruited was due to the strict matching procedure performed to control for epidemiological and clinical variables: for each PMC we selected a paired patient WMC with similar features. In addition, even though gene expression does not necessarily mirror gene transcript activity and should be interpreted just as a general indication of CD4 + T cells involvement, in previous studies we observed that lower TBX21, STAT3, and STAT4 and higher FOXP3 were associated with reduced Th2, Th17, and Treg, with a relative increase of Th1 and increased production of interferon-γ and tumor necrosis factor (TNF)-α [6]. Based on this scenario, we therefore suggest that the present findings about TF mRNA levels in PD-associated MC likely underlie specific phenotypic and functional immune profiles possibly peculiar of MC, which deserve careful assessment in future investigations.
The present study addressed only molecular patterns in CD4 + T cells from PD patients, providing evidence that STAT1 and NR4A2 show respectively excellent and good positive likelihood ratios and better specificity than sensitivity in identifying the lack of motor complications: a thorough analysis of circulating CD4 + T cells subsets and longitudinal prospective studies are now warranted to elucidate the potential immunological background of long-term treatment complications in PD.
CONCLUSIONS
To the best of our knowledge, this is the first study providing distinctive molecular signatures of PD patients with and without motor complications. Though exploratory, these results shed light on the suitable involvement of the peripheral immune system, thus opening new landscapes in the therapeutic management of PD patients.
CONFLICT OF INTEREST
The authors declare that they have no relevant conflict of interest.
ACKNOWLEDGMENTS
The authors wish to express their gratefulness to Massimiliano Legnaro and Natasa Kustrimovic for their valuable help and collaboration in experimental planning and execution. The research leading to these results has received support from Fondazione CARIPLO (http://www.fondazionecariploit– Pro-ject 2011-0504), Fondazione UBI per Varese Onlus (grant 18/7/2017) and the AGING Project, Department of Excellence, Universitá degli Studi del Piemonte Orientale.
SUPPLEMENTARY MATERIAL
[1] The supplementary material is available in the electronic version of this article: https://dx.doi.org/10.3233/JPD-202417.
REFERENCES
[1] | Chapuis S , Ouchchane L , Metz O , Gerbaud L , Durif F ((2005) ) Impact of the motor complications of Parkinson’s disease on the quality of life. Mov Disord 20: , 224–230. |
[2] | Manson A , Stirpe P , Schrag A ((2012) ) Levodopa-induced-dyskinesias clinical features, incidence, risk factors, management and impact on quality of life. J Parkinsons Dis 2: , 189–198. |
[3] | Kelly MJ , Lawton MA , Baig F , Ruffmann C , Barber TR , Lo C , Klein JC , Ben-Shlomo Y , Hu MT ((2019) ) Predictors of motor complications in early Parkinson’s disease: A prospective cohort study. Mov Disord 34: , 1174–1183. |
[4] | Jiang S , Gao H , Luo Q , Wang P , Yang X ((2017) ) The correlation of lymphocyte subsets, natural killer cell, and Parkinson’s disease: A meta-analysis. Neurol Sci 38: , 1373–1380. |
[5] | Sulzer D , Alcalay RN , Garretti F , Cote L , Kanter E , Agin-Liebes J , Liong C , McMurtrey C , Hildebrand WH , Mao X , Dawson VL , Dawson TM , Oseroff C , Pham J , Sidney J , Dillon MB , Carpenter C , Weiskopf D , Phillips E , Mallal S , Peters B , Frazier A , Lindestam Arlehamn CS , Sette A ((2017) ) T cells from patients with Parkinson’s disease recognize α-synuclein peptides. Nature 546: , 656–661. |
[6] | Kustrimovic N , Comi C , Magistrelli L , Rasini E , Legnaro M , Bombelli R , Aleksic I , Blandini F , Minafra B , Riboldazzi G , Sturchio A , Mauri M , Bono G , Marino F , Cosentino M ((2018) ) Parkinson’s disease patients have a complex phenotypic and functional Th1 bias: Cross-sectional studies of CD4+Th1/Th2/T17 and Treg in drug-naïve and drug-treated patients. J Neuroinflammation 15: , 205. |
[7] | De Francesco E , Terzaghi M , Storelli E , Magistrelli L , Comi C , Legnaro M , Mauri M , Marino F , Versino M , Cosentino M ((2020) ) CD4+T-cell transcription factors in idiopathic REM sleep behavior disorder and Parkinson’s disease. Mov Disord, doi: 10.1002/mds.28137 |
[8] | Boi L , Pisanu A , Greig NH , Scerba MT , Tweedie D , Mulas G , Fenu S , Carboni E , Spiga S , Carta AR ((2019) ) Immunomodulatory drugs alleviate l-dopa-induced dyskinesia in a rat model of Parkinson’s disease. Mov Disord 34: , 1818–1830. |
[9] | Kim J-H , Lee H-W , Hwang J , Kim J , Lee M-J , Han H-S , Lee W-H , Suk K ((2012) ) Microglia-inhibiting activity of Parkinson’s disease drug amantadine. Neurobiol Aging 33: , 2145–2159. |
[10] | Carta AR , Mulas G , Bortolanza M , Duarte T , Pillai E , Fisone G , Vozari RR , Del-Bel E ((2017) ) l-DOPA-induced dyskinesia and neuroinflammation: Do microglia and astrocytes play a role? Eur J Neurosci 45: , 73–91. |
[11] | Teema AM , Zaitone SA , Moustafa YM ((2016) ) Ibuprofen or piroxicam protects nigral neurons and delays the development of l -dopa induced dyskinesia in rats with experimental Parkinsonism: Influence on angiogenesis. Neuropharmacology 107: , 432–450. |
[12] | Postuma RB , Berg D , Stern M , Poewe W , Olanow CW , Oertel W , Obeso J , Marek K , Litvan I , Lang AE , Halliday G , Goetz CG , Gasser T , Dubois B , Chan P , Bloem BR , Adler CH , Deuschl G ((2015) ) MDS clinical diagnostic criteria for Parkinson’s disease. Mov Disord 30: , 1591–1601. |
[13] | Kustrimovic N , Rasini E , Legnaro M , Bombelli R , Aleksic I , Blandini F , Comi C , Mauri M , Minafra B , Riboldazzi G , Sanchez-Guajardo V , Marino F , Cosentino M ((2016) ) Dopaminergic receptors on CD4+T naive and memory lymphocytes correlate with motor impairment in patients with Parkinson’s disease. Sci Rep 6: , 33738. |
[14] | Goetz CG , Tilley BC , Shaftman SR , Stebbins GT , Fahn S , Martinez-Martin P , Poewe W , Sampaio C , Stern MB , Dodel R , Dubois B , Holloway R , Jankovic J , Kulisevsky J , Lang AE , Lees A , Leurgans S , LeWitt PA , Nyenhuis D , Olanow CW , Rascol O , Schrag A , Teresi JA , van Hilten JJ , LaPelle N , for the Movement Disorder Society UPDRS Revision Task Force ((2008) ) Movement Disorder Society-sponsored revision of the Unified Parkinson’s Disease Rating Scale (MDS-UPDRS): Scale presentation and clinimetric testing results. Mov Disord 23: , 2129–2170. |
[15] | Goetz CG , Poewe W , Rascol O , Sampaio C , Stebbins GT , Counsell C , Giladi N , Holloway RG , Moore CG , Wenning GK , Yahr MD , Seidl L , Movement Disorder Society Task Force on Rating Scales for Parkinson’s Disease ((2004) ) Movement Disorder Society Task Force report on the Hoehn and Yahr staging scale: Status and recommendations. Mov Disord 19: , 1020–1028. |
[16] | Tomlinson CL , Stowe R , Patel S , Rick C , Gray R , Clarke CE ((2010) ) Systematic review of levodopa dose equivalency reporting in Parkinson’s disease. Mov Disord 25: , 2649–2653. |
[17] | Folstein MF , Folstein SE , McHugh PR ((1975) ) “Mini-mental state”. A practical method for grading the cognitive state of patients for the clinician. J Psychiatr Res 12: , 189–198. |
[18] | Mandrekar JN ((2010) ) Receiver operating characteristic curve in diagnostic test assessment. J Thorac Oncol 5: , 1315–1316. |
[19] | Holcar M , Goropevsek A , Ihan A , Avcin T ((2015) ) Age-related differences in percentages of regulatory and effector T lymphocytes and their subsets in healthy individuals and characteristic STAT1/STAT5 signalling response in helper T lymphocytes. J Immunol Res 2015: , 1–13. |
[20] | Piasecka B , Duffy D , Urrutia A , Quach H , Patin E , Posseme C , Bergstedt J , Charbit B , Rouilly V , MacPherson CR , Hasan M , Albaud B , Gentien D , Fellay J , Albert ML , Quintana-Murci L , the Milieu Intérieur Consortium ((2018) ) Distinctive roles of age, sex, and genetics in shaping transcriptional variation of human immune responses to microbial challenges. Proc Natl Acad Sci U S A 115: , E488–E497. |
[21] | Oestreich KJ , Weinmann AS ((2012) ) Transcriptional mechanisms that regulate T helper 1 cell differentiation. Curr Opin Immunol 24: , 191–195. |
[22] | Chen Z , Laurence A , O’Shea JJ ((2007) ) Signal transduction pathways and transcriptional regulation in the control of Th17 differentiation. Semin Immunol 19: , 400–408. |
[23] | Maier E , Duschl A , Horejs-Hoeck J ((2012) ) STAT6-dependent and -independent mechanisms in Th2 polarization: HIGHLIGHTS. Eur J Immunol 42: , 2827–2833. |
[24] | Ho I-C , Tai T-S , Pai S-Y ((2009) ) GATA3 and the T-cell lineage: Essential functions before and after T-helper-2-cell differentiation. Nat Rev Immunol 9: , 125–135. |
[25] | Lu L , Barbi J , Pan F ((2017) ) The regulation of immune tolerance by FOXP3. Nat Rev Immunol 17: , 703–717. |
[26] | Won HY , Hwang ES ((2016) ) Transcriptional modulation of regulatory T cell development by novel regulators NR4As. Arch Pharm Res 39: , 1530–1536. |
[27] | Przanowski P , Dabrowski M , Ellert-Miklaszewska A , Kloss M , Mieczkowski J , Kaza B , Ronowicz A , Hu F , Piotrowski A , Kettenmann H , Komorowski J , Kaminska B ((2014) ) The signal transducers Stat1 and Stat3 and their novel target Jmjd3 drive the expression of inflammatory genes in microglia. J Mol Med 92: , 239–254. |
[28] | Jankovic J , Chen S , Le WD ((2005) ) The role of Nurr1 in the development of dopaminergic neurons and Parkinson’s disease. Prog Neurobiol 77: , 128–138. |
[29] | Le W , Conneely OM , Zou L , He Y , Saucedo-Cardenas O , Jankovic J , Mosier DR , Appel SH ((1999) ) Selective agenesis of mesencephalic dopaminergic neurons in Nurr1-deficient mice. Exp Neurol 159: , 451–458. |
[30] | Montarolo F , Perga S , Martire S , Navone DN , Marchet A , Leotta D , Bertolotto A ((2016) ) Altered NR4A subfamily gene expression level in peripheral blood of Parkinson’s and Alzheimer’s disease patients. Neurotox Res 30: , 338–344. |
[31] | Barnum CJ , Eskow KL , Dupre K , Blandino P , Deak T , Bishop C ((2008) ) Exogenous corticosterone reduces l-DOPA-induced dyskinesia in the hemi-parkinsonian rat: Role for interleukin-1β. Neuroscience 156: , 30–41. |
[32] | Mulas G , Espa E , Fenu S , Spiga S , Cossu G , Pillai E , Carboni E , Simbula G , Jadzić D , Angius F , Spolitu S , Batetta B , Lecca D , Giuffrida A , Carta AR ((2016) ) Differential induction of dyskinesia and neuroinflammation by pulsatile versus continuous l -DOPA delivery in the 6-OHDA model of Parkinson’s disease. Exp Neurol 286: , 83–92. |


