
Postprandial Increase in Mesenteric Blood Flow is Attenuated in Parkinson’s Disease: A Dynamic PC-MRI Study
Abstract
Background:
Gastrointestinal dysfunction and related clinical symptoms are common in Parkinson’s disease (PD), but the underlying mechanisms are still poorly understood.
Objective:
In this study, we investigated how PD affects the postprandial vascular response in the splanchnic circulation.
Methods:
23 patients with PD in the “ON-medication” state and 23 age- and sex-matched healthy control participants underwent serial phase-contrast magnetic resonance imaging (PC-MRI) to measure the postprandial blood flow response in the superior mesenteric artery (SMA). Participants ingested a standardized liquid test meal (∼400 kcal) and underwent four PC-MRI runs within the following hour. Each PC-MRI run consisted of six consecutive measurements of SMA blood flow.
Results:
In both groups, standardized food intake triggered an increase of blood flow in the SMA, but absolute and relative increases in blood flow were attenuated in patients compared to the control group (p < 0.001). While baseline blood flow in the SMA was comparable in both groups, the postprandial maximum blood flow was attenuated in patients (p = 0.03). The temporal dynamics of the postprandial blood flow did not differ between groups. Postprandial SMA blood flow increase in patients correlated neither with subjective reports of non-motor symptoms or upper gastrointestinal complaints, nor with levodopa equivalent daily dose or disease duration. Blood glucose measurements in between the PC-MRI runs showed a smaller postprandial increase in blood glucose in the patient group (p = 0.006).
Conclusion:
This study provides first-time evidence that patients with PD have an attenuated postprandial blood flow response in the SMA, indicating an impaired functional regulation of gastrointestinal perfusion in response to food intake in PD.
INTRODUCTION
Parkinson’s disease (PD) is a neurodegenerative disease characterized by the accumulation of α-syn-uclein and formation of Lewy inclusion bodies [1, 2]. The classical motor symptoms are caused by progressive loss of dopaminergic neurons in the substantia nigra [1–5], but the neurodegenerative process affects many other structures of the central, peripheral and enteric nervous system [1–8]. Widespread neurodegeneration causes a multitude of non-motor symptoms [3–5]. Non-motor symptoms may precede the onset of motor symptoms by several years, reflecting the progressive caudal-to-rostral spread of pathology in the brainstem [2–8]. Gastrointestinal symptoms are very common in PD. Slow gastric emptying and constipation give rise to disabling symptoms in up to 90%of patients at all stages of PD [9–13]. In recent years, imaging methods have been introduced to capture alterations of gastrointestinal motility and transit time, revealing esophageal and gastric dysmotility, constipation and defecation dysfunctions in PD [10–14].
Food ingestion triggers a substantial increase in gastrointestinal regional blood flow [15–17]. This increase in regional blood flow secures the supply of oxygen and essential nutrients for ingestion and facilitates the transportation of digested substances to the liver [16, 18]. Several neural, humoral and paracrine mechanisms contribute to postprandial hyperemia, including extrinsic and intrinsic enteric innervation, circulating hormones and tissue metabolic activity [15–17]. Blood flow in each artery supplying the gastrointestinal tract increases sequentially as the digested chyme is transported along the gastrointestinal tract and is exposed to the mucosal surface supplied by that particular artery [15–17, 19]. The local postprandial hyperemic response depends on the composition of the meal, because the constituents of the chyme stimulating a local hyperemic response differ in different regions of the gastrointestinal tract [15–17, 20, 21].
Postprandial hyperemia has mainly been studied in the superior mesenteric artery (SMA) using Doppler ultrasonography in healthy individuals, revealing large inter-individual variation [18]. The postprandial increase in regional blood flow scales positively with the ingested energy content [22, 23]. To our knowledge postprandial intestinal hyperemia in PD has only been investigated in a single study, in which the ingestion of 75 g glucose led to an immediate increase in regional blood flow in SMA and peaked approximately an hour after glucose intake [24]. Since that study lacked a healthy control group and only tested the effect of glucose ingestion, it remained unclear whether the postprandial gastrointestinal blood flow response after a mixed meal was normal or affected by the disease.
Here, we employed serial MRI-based measurements of blood flow in the SMA to quantify the postprandial increase in splanchnic arterial blood flow in patients with PD and a control group of age- and sex-matched healthy individuals. The enteric nervous system and the dorsal motor nucleus of the vagus nerve are affected by α-synucleinopathy at an early stage of PD [6–8, 25–28]. We therefore hypothesized that PD affects the postprandial blood flow response.
METHODS
Participants
Twenty-three patients with PD and 23 healthy age- and sex-matched individuals volunteered to participate in the present study. Patients were recruited from the Outpatient Clinic for Movement Disorders at Bispebjerg and Frederiksberg Hospital. Healthy individuals were recruited via advertising flyers posted at Hvidovre Hospital and online advertisements posted on http://www.forsoegsperson.dk/, a Danish homepage for recruitment of test subjects. PD patients and control subjects were included independently of the presence or the degree of gastrointestinal symptoms. Exclusion criteria were pregnancy or breastfeeding, diabetes mellitus, respiratory, cardiac or hepatic disease, history of other neurologic or psychiatric disease, treatment with a pacemaker or other implanted electronic devices, and claustrophobia. Patients had to be older than 50 years and be diagnosed with PD by a movement disorder specialist according to the Movement Disorder Society Clinical Diagnostic Criteria for Parkinson’s Disease [29]. Routine dopamine transporter SPECT (Single-photon emission computerized tomography) was available in all 23 PD patients, confirming a reduction in striatal dopamine transporter density in all patients.
MRI examinations and questionnaires were performed with PD patients in “ON-medication” state to avoid motor discomfort, because test subjects had to ingest the standardized meal in lying position and had to lie quiet in the MRI-scanner. Levodopa equivalent daily dose (LEDD) was calculated based on the patients’ anti-parkinsonian medication using the conversion factors suggested by Tomlinson et al. [30].
Ethics statement
The study was approved by the Regional Committee on Health Research Ethics of the Capital Region of Denmark (H-18054923). All participants gave their written informed consent.
Experimental procedures
Experimental procedures are outlined in Fig. 1. Participants were instructed to fast for at least seven hours prior to MRI scanning. Phase-contrast magnetic resonance imaging (PC-MRI) was performed on a 1.5T MRI scanner to assess postprandial increases in mesenteric blood flow. Blood glucose concentration was measured from a drop of blood obtained by puncturing a fingertip, while subjects were lying in the MRI scanner, using a glucose meter (HemoCue® Glucose 201 RT System, Denmark).
Fig. 1
Experimental timeline. The questionnaires included the Non-Motor Symptoms Questionnaire and the first 9 items of the Gastrointestinal Symptom Rating Scale. Scout scans were performed to locate the superior mesenteric artery. The standardized liquid test meal consisted of 95 g Queal™ blended with 200 ml water. PC-MRI, phase-contrast magnetic resonance imaging; BF, blood flow.
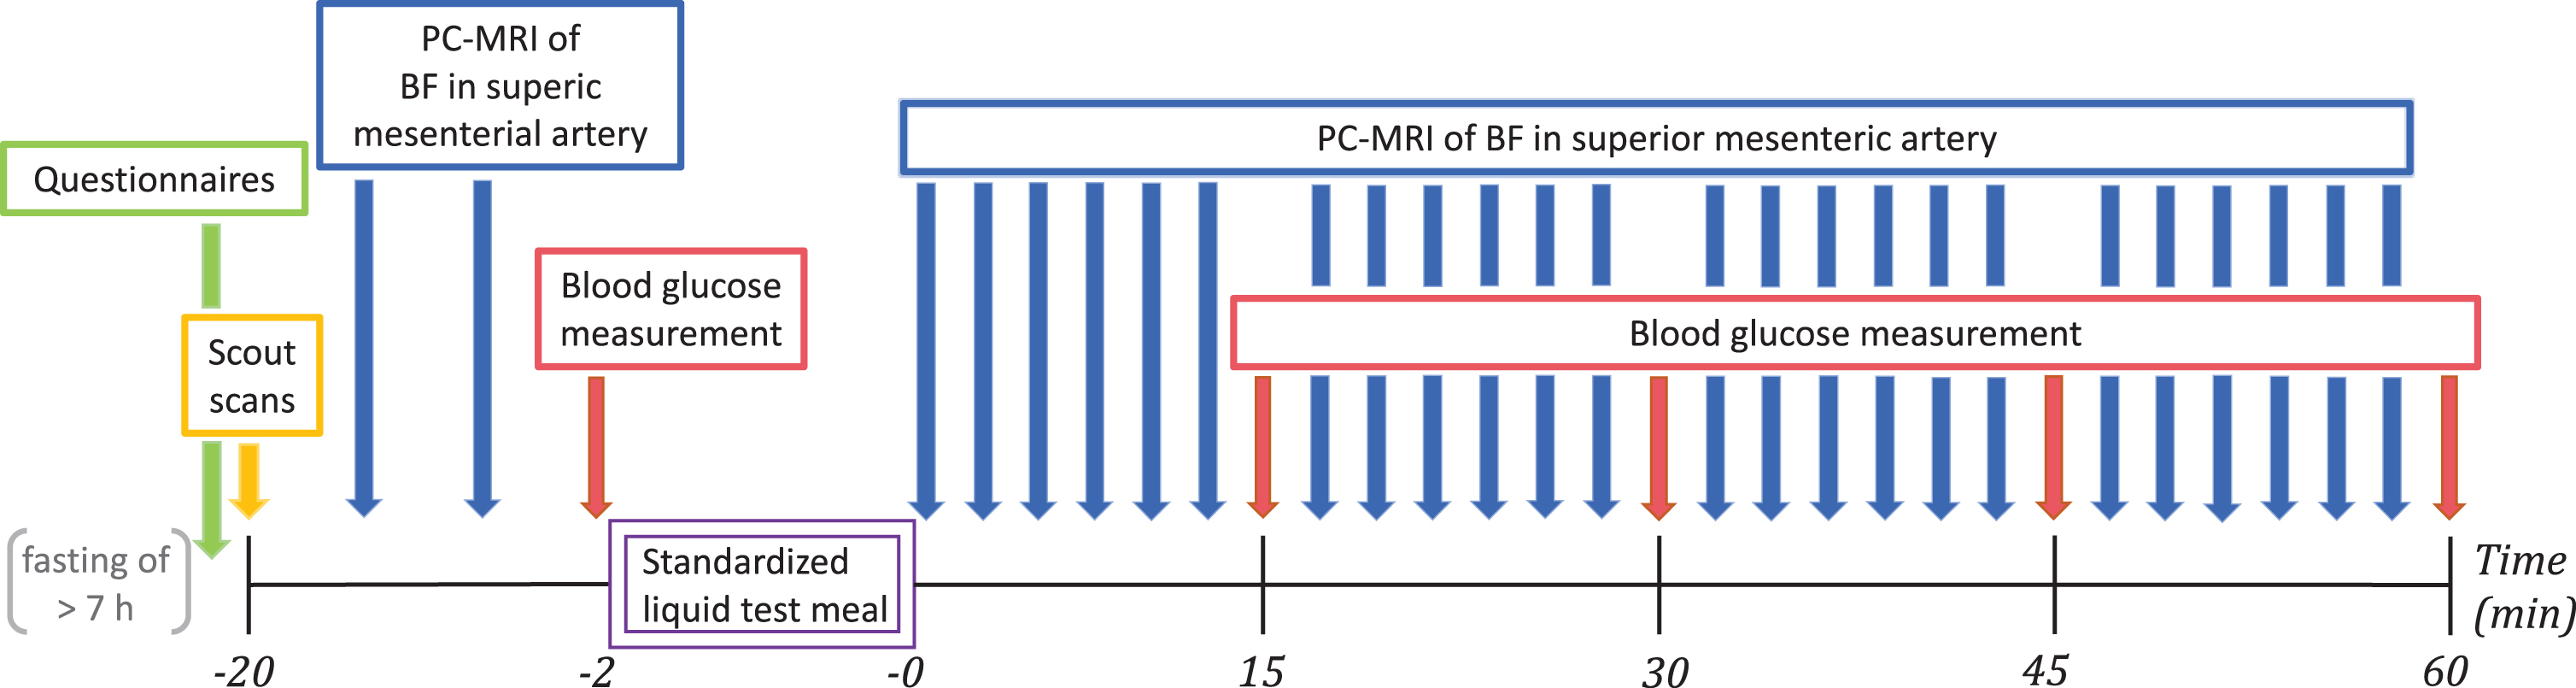
Before PC-MRI, participants completed two questionnaires to access subjective non-motor symptoms and gastrointestinal symptoms. Participants were positioned in the MRI scanner and the SMA was located with a scout scan. Two pre-meal baseline measurements of mesenteric blood flow were performed followed by measurement of baseline blood glucose level. Participants were given two minutes to ingest a standardized liquid test meal. They used a straw for meal intake while lying on the bed outside the scanner bore. Immediately after meal intake, we performed blocks of six consecutive blood flow measurements in the SMA using PC-MRI. Each block of blood flow measurements was followed by a new blood glucose measurement. Alternating blood flow and blood glucose measurement were repeated at least four times (Fig. 1).
Questionnaires
Participants completed the Non-Motor Symptoms Questionnaire (NMS-Quest) and the Gastrointestinal Symptom Rating Scale (GSRS) on arrival at the day of the study. The NMS-Quest consists of 30 items grouped into nine domains [31, 32]. The score ranges from minimum 0, indicating absence of non-motor symptoms, to maximum 30, indicating presence of all non-motor symptoms in question. Recall period was the month before participation. Participants responded to the first nine items of the GSRS which assessed reflux, abdominal pain and indigestion [33, 34]. Each item is rated on a 7-point Likert-type scale, where 1 denotes absence of symptoms and 7 represents the most pronounced symptoms. The total score is divided by the number of items, yielding the mean score. Recall period was the week before participation.
Phase-contrast magnetic resonance imaging (PC-MRI)
MR imaging was obtained at Hvidovre Hospital’s Radiology Unit using a Siemens Avanto 1.5T MRI Scanner (Siemens AG, Healthcare Sector, Erlangen, Germany). The participants were placed with MR compatible clothes in a supine position in the scanner. To achieve physiological blood flow conditions, participants were scanned at rest and were allowed to breathe freely. A 6-element Body MATRIX Coil (Siemens AG, Healthcare Sector, Erlangen, Germany) was placed on the participant’s abdomen. In addition, participants were equipped with hearing protection and an emergency call button. Electrocardiogram (ECG) for cardiac gating was obtained by placing MRI compatible electrodes on the participant’s chest and allowed for optimal retrospective reconstruction of PC-MRI scans. Afterwards the participants were positioned with the abdomen in the isocenter of the scanner.
Firstly, a set of localizer sequences, including TRUFI (true fast imaging with steady-state free pre-cession), HASTE (half-Fourier acquisition single-shot turbo spin-echo) and TOF (time of flight), were used to locate the SMA and to position the imaging slice perpendicular to the vessel. The SMA was positioned centrally within the imaging slice to optimize vessel identification under blood flow analysis. An appropriate velocity range for the participant in question was obtained by doing a VENC (velocity encoding) scout before performing PC-MRI.
Quantitative blood flow images were obtained by phase-contrast sequences using retrospective ECG-gated Cartesian two-dimensional cine fast low angle shots. Thirty cardiac phases were reconstructed per cardiac cycle. PC acquisition parameters were: repetition time/echo time = 49.45/3.37 ms, temporal resolution = approximately 15–33 ms depending on the heart rate, flip angle = 30 degrees, field of view = 120×120 mm, in-plane resolution = 0.896×0.625 mm, slice thickness = 5.0 mm, number of averages =4, bandwidth = 521 Hz/Px. The proximal point where the SMA artery becomes perpendicular after arising from the aorta was used as a predetermined anatomical fixpoint for the flow measurements, so that the scans could be standardized.
We measured the blood flow dynamics in the SMA, which supplies the gastrointestinal tract from lower part of the duodenum to left colic flexure [17]. During piloting of PC-MRI, we could not establish reliable blood flow measurements in the celiac artery (CA) and left gastric artery (LGA), which supply stomach, liver and spleen [17]. The LGA was anatomically variable and in most cases too small to be located by the initial localizer scan. The CA has only a very short segment after arising from the aorta and before dividing into different branches, making it often impossible to position the imaging slice perpendicular. Our exclusive focus on the SMA enabled repeated blood flow measurements at short intervals. In the present study, blood flow measurements were repeated every 2–4 minutes (depending on heart rate) and were only interrupted by interspersed blood glucose measurements. Thus, our measurements reliably captured the temporal dynamics of the postprandial blood flow increase and systemic glucose uptake.
All flow data were subsequently analyzed by using CVI42 Version 5.6.5 (Software by Circle Cardiovascular Imaging BV, Amsterdam, The Netherlands). The region of interest was drawn manually by a single investigator (T.H.S.) in one of the 30 cardiac phase images by outlining the vessel wall. Subsequently, an automated contour detection method was applied. Every phase image was controlled manually and if needed corrected. Based on the vessel lumen across the 30 images the mean arterial blood flow (L/min) during the cardiac cycle was calculated. This procedure was repeated for every PC-MRI measurement and for all participants.
Standardized liquid test meal
A standardized liquid test meal consisting of 95 g ready-made powdered shake mix Queal™ Steady Standard 5.0 (Queal BV, Rotterdam, The Netherlands) blended with 200 ml water was administered to participants following baseline measurements. Queal™ Steady Standard 5.0 is a ready-made powdered meal product, designed to provide full nutrition based on dietary standards with a ratio of macronutrients as recommended by the European Food Safety Authority and containing all 27 essential vitamins and minerals. 176 g of Queal™ Steady Standard 5.0 blended with 350 milliliters of water gives a complete meal of 700 kcal and contains 47%carbohydrates, 32%fats and 21%proteins.
During initial piloting of the present study the minimal amount of Queal™ Steady Standard 5.0, which still gave a significant increase in postprandial blood flow in the SMA, was found to be 95 g blended with 200 ml water.
95 g Queal™ Steady Standard 5.0 contains 398 kcal energy; 13.8 g fat of which 1.7 g saturated; 45.7 g carbohydrates of which 14.4 g sugars; 20 g protein; 6.7 g fibers and numerous vitamins and minerals.
Statistical analysis
Statistical analysis was performed using R software (RStudio Inc., Version 1.2.1335). Based on Sha-piro-Wilk test of normality the demographic and clinical group data in Table 1 are reported as mean±standard deviation or median and 10%- & 90%-quantiles as appropriate. Wilcoxon rank-sum test was used to test for differences between groups when normal distribution could not be assumed. Between-group differences were analyzed using unpaired two-samples t-test in case of normal distribution. Statistical significance was accepted at p <0.05. Correlations were determined using Spearman’s rank correlation. To correct for multiple comparisons, we used the Bonferroni method with an adjusted significance level of p < 0.0025.
Table 1
Demographic and clinical data of patients with PD and control subjects
| Healthy controls | PD patients | p-value | |
| Gender (male/female) | 13/10 | 16/7 | |
| Age (y) | 60.7±7.7 | 63.6±6.5 | 0.18 |
| Body mass index (kg/m2) | 25.9±3.2 | 26.2±2.9 | 0.74 |
| Levodopa equivalent daily dose (mg) | - | 625±299 | |
| Disease duration (y) | - | 4 (2–10) | |
| NMS-Quest | |||
| Total score | 1 (0–4) | 8 (3–14) | <0.0001 |
| GSRS (Items 1–9) | |||
| Total score | 1.22 (1.00–1.87) | 1.33 (1.00–2.40) | 0.48 |
| Superior mesenteric artery | |||
| blood flow (BF) (l/min) | |||
| Baseline BF | 0.38 (0.24–0.53) | 0.43 (0.27–0.59) | 0.26 |
| Postprandial maximal BF | 1.08 (0.68–1.33) | 0.89 (0.61–1.12) | 0.03 |
| Postprandial increase in BF | 0.67 (0.45–0.95) | 0.43 (0.26–0.67) | <0.001 |
| Time to maximum (min) | 28.2 (18.9–38.6) | 30.8 (19.5–51.3) | 0.55 |
| Smoothed postprandial BF changes* | |||
| Relative increase in BF (%) | 177 (117–318) | 103 (52–157) | <0.0001 |
| Time to maximum (min) | 27.7 (18.9–39.5) | 31.7 (19.5–50.5) | 0.58 |
| Maximal slope (l/min) | 0.06 (0.04–0.08) | 0.04 (0.03–0.7) | 0.007 |
| Blood glucose (BG) (mmol/l) | |||
| Baseline BG | 4.9 (4.4–5.3) | 5.0 (4.2–5.9) | 0.36 |
| Postprandial maximal BG | 7.4 (6.4–8.6) | 6.7 (6.2–7.7) | 0.09 |
| Postprandial increase in BG | 2.2 (1.6–3.7) | 1.8 (1.1–3.2) | 0.006 |
| Time to maximum (min) | 58.8 (41.1–63.6) | 52.7 (33.5–64.7) | 0.42 |
Data given as mean±SD or median (10%quantile–90%quantile). *A local polynomial regression fitting curve was fitted to the individual time series of blood flow measurements applying a 25%smoothing span, and then blood flow estimates were predicted at a sample rate of one sample per minute.
The time at which the individual participant finished intake of the standardized liquid test meal was set as t = 0 minutes. Serial blood flow (BF) data were expressed as percentage of individual baseline and calculated by (BF –Baseline BF) * Baseline BF * 100%. To obtain robust, equidistant blood flow estimates, the individual time series of blood flow measurements were then smoothed using local polynomial regression fitting with a 25%smoothing span, and blood flow estimates were predicted at a sample rate of one sample per minute to extract the relative increase in blood flow, time to maximum and maximal slope.
RESULTS
Demographic and clinical group data along with the statistical results of between-group comparisons are listed in Table 1. All PD patients had bilateral or midline involvement with or without impairment of balance, but were physically independent, corresponding to Hoehn and Yahr stage 2 and 3 [35]. Participants completed the study without reporting any adverse events. MRI examinations and questionnaires were performed with PD patients in the “ON-medication” state and all 23 PD patients received anti-parkinsonian medication. Six patients were only treated with levodopa/decarboxylase inhibitor. In 10 patients, levodopa/decarboxylase inhibitor was combined with a dopamine agonist (n = 9) or COMT inhibitor (n = 1). The remaining seven patients were treated with a dopamine agonist and MAO-B inhibitor (n = 3), dopamine agonist, levodopa/decarboxylase inhibitor and MAO-B-inhibitor (n = 2), dopamine agonist, levodopa/decarboxylase inhibitor and COMT inhibitor (n = 1), or levodopa/decarboxylase inhibitor, dopamine agonist, MAO-B inhibitor and COMT inhibitor (n = 1). Eight PD patients and one healthy control participant received prescriptive laxative treatment daily (Macrogol, Sodium Picosulfate), which they continued with at the day of the study.
PD patients had significantly more non-motor symptoms (as indexed by higher NMS-Quest scores), but they reported a similar amount of upper gas-trointestinal symptoms as healthy control participants. Fasting levels of blood glucose were normal (<6.3 mmol/l). We found a positive correlation between age and baseline blood glucose levels across the entire group (Spearman’s rank correlation coefficient ρ= 0.5, p = 0.001), indicating that pre-ingestion blood glucose levels increased with participant’s age. No difference in body mass index was found between the two groups (p = 0.74, Table 1).
Postprandial blood flow and blood glucose changes
Mean group data as well as individual data are presented separately for patients and healthy control participants in Figs. 2, 3. All participants showed a rise in SMA blood flow and blood glucose levels after ingestion of the standardized test meal, but responses varied substantially among participants (Figs. 2a, b, 3). At the group level, the absolute postprandial increase in SMA blood flow was smaller in PD than healthy controls (p < 0.001, Table 1 and Fig. 3). Maximum blood flow levels after food intake were also found to be reduced in patients compared to healthy controls (p = 0.03). Differences between groups also emerged when comparing the postprandial increase in blood flow relative to baseline (Table 1 and Fig. 2a). Patients showed an attenuated relative blood flow increase after meal intake compared to the healthy control group (p < 0.0001). Likewise, the maximal slope of the fitted curves, representing maximal rate of blood flow change, was flattened in the PD group relative to the slope in the healthy control group (p = 0.007). In contrast, the baseline levels as well as the time to reach maximal blood flow did not differ between groups.
Fig. 3
Postprandial superior mesenteric artery blood flow measurements in healthy controls (HC) and participants with Parkinson’s disease (PD). The absolute blood flow measurements are connected using linear interpolation.
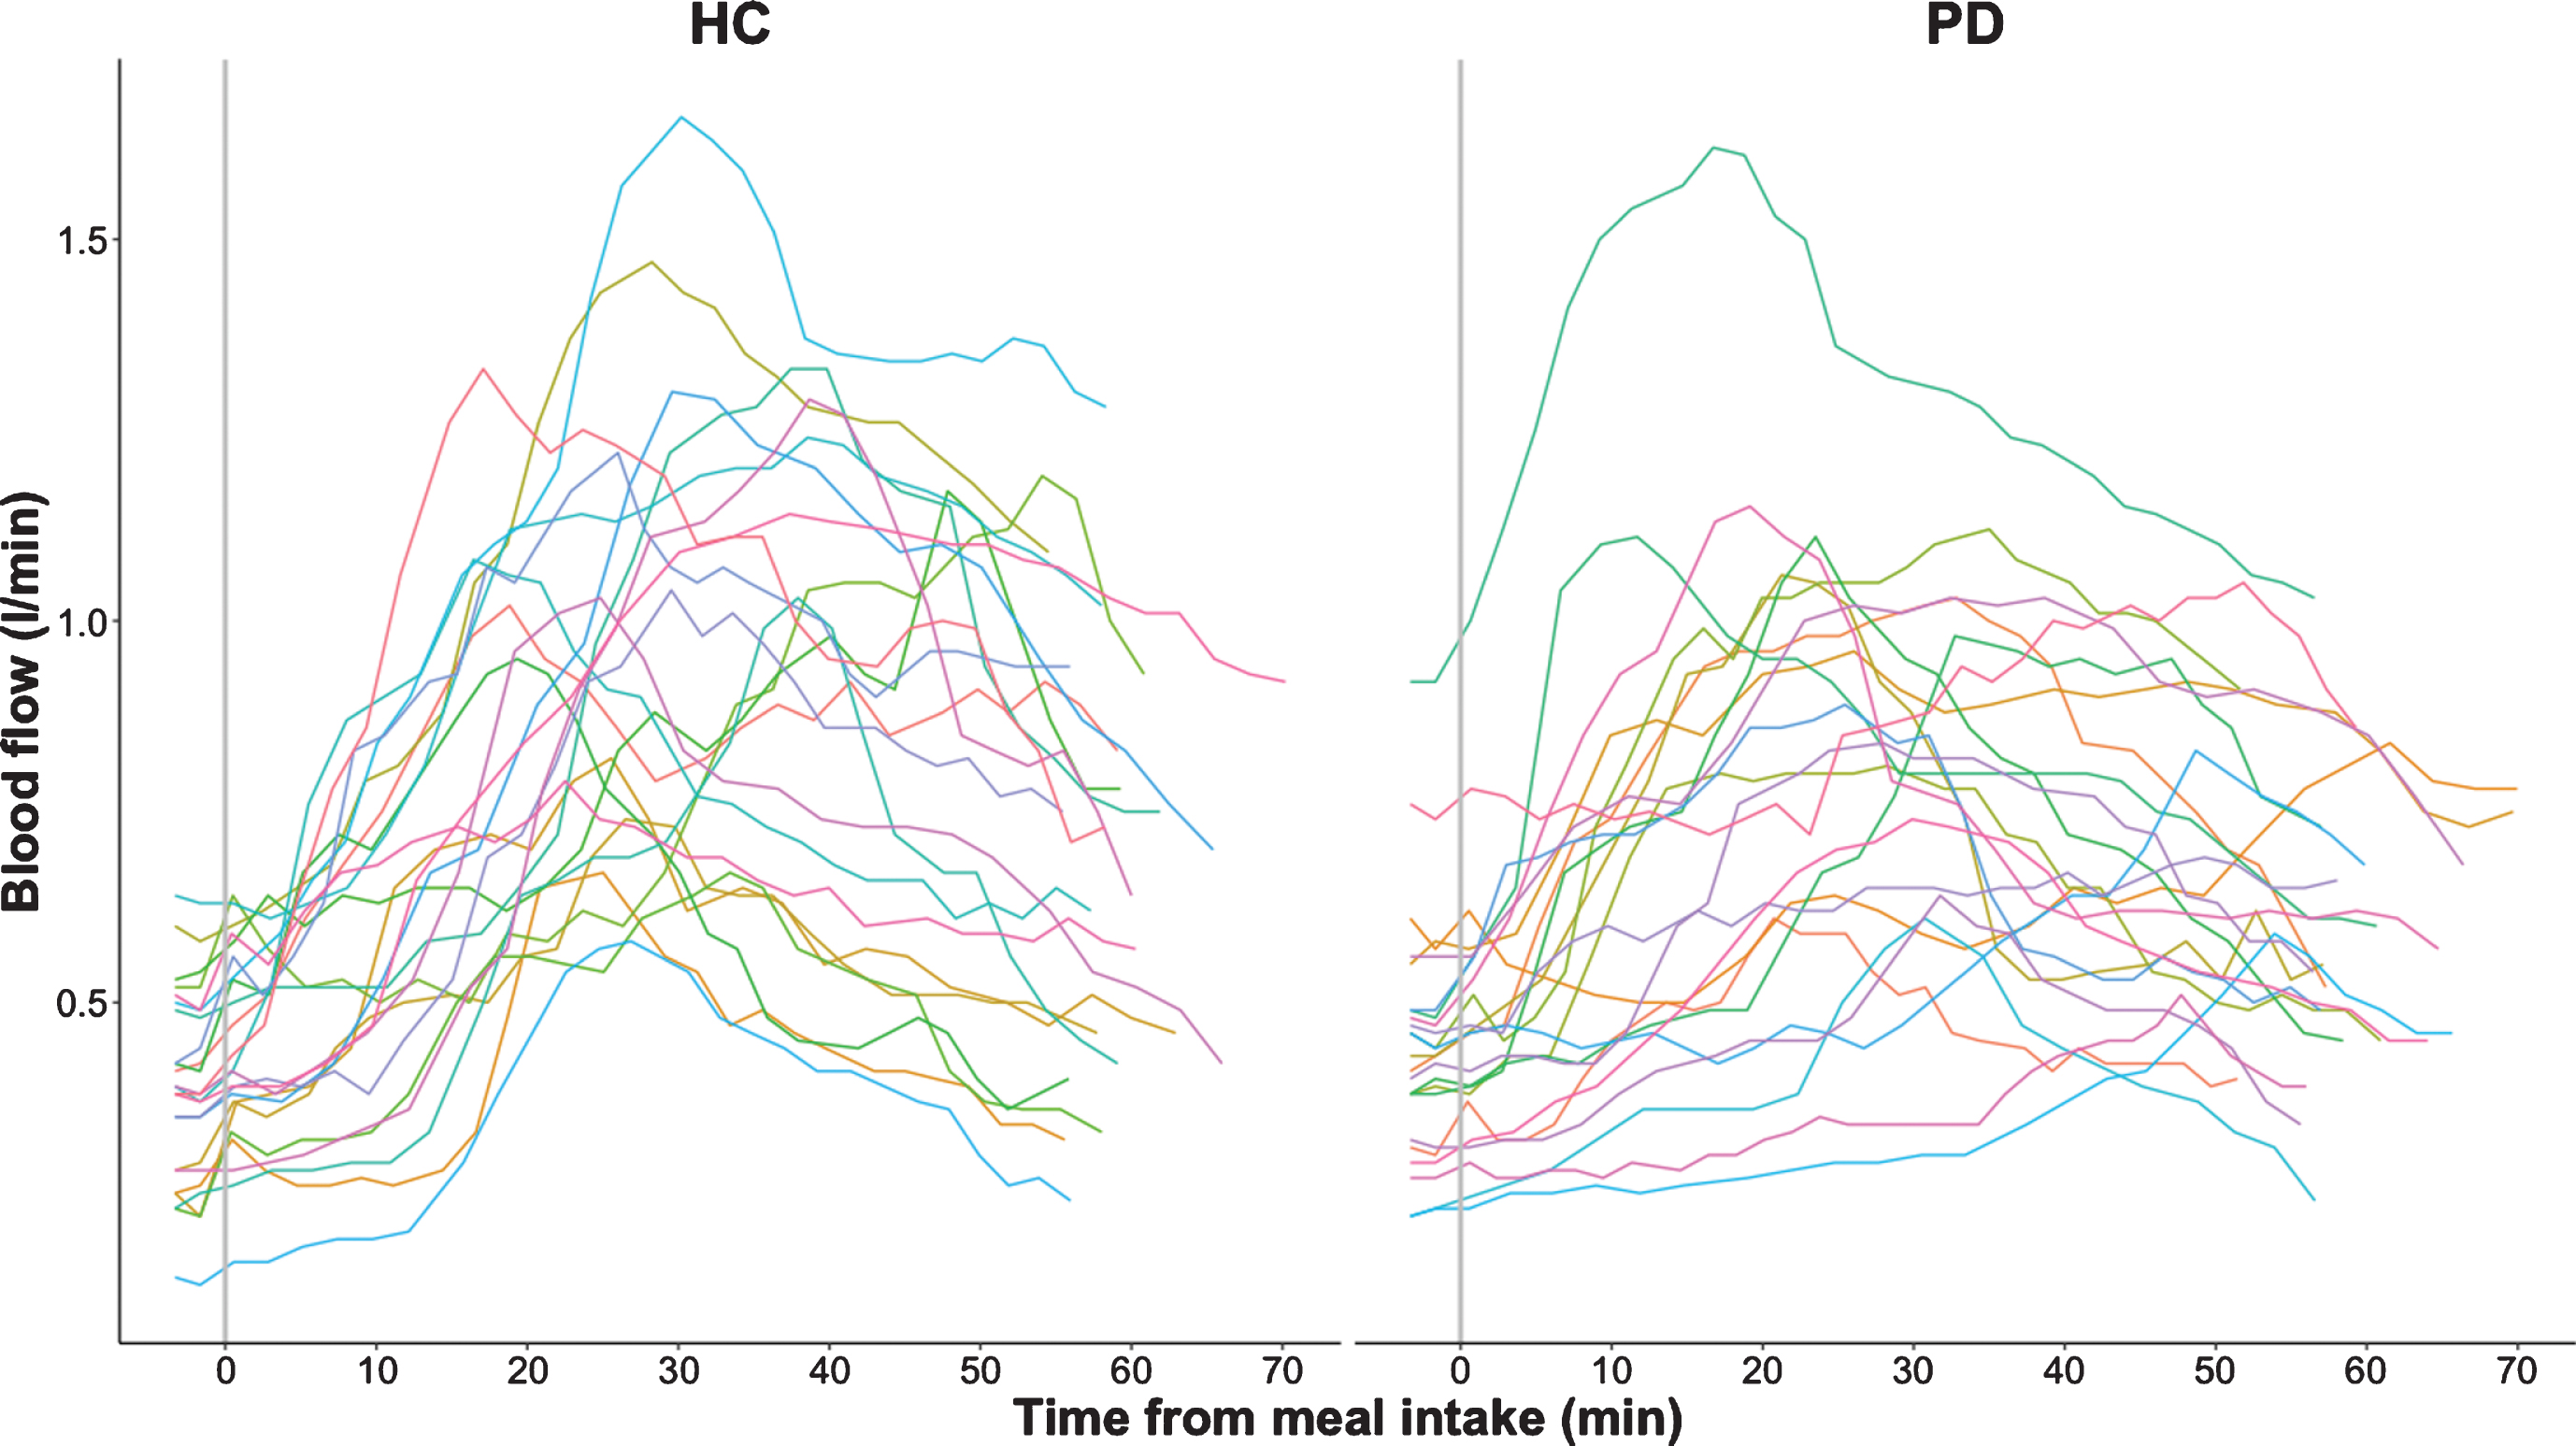
Fig. 2a
Relative smoothed postprandial superior mesenteric artery blood flow changes in healthy controls (HC) and participants with Parkinson’s disease (PD). Relative blood flow changes from baseline are calculated as (BF –Baseline BF) * Baseline BF * 100 %. Curves are fitted to the individual time series of blood flow measurements using local polynomial regression fitting with a 25%smoothing span. The black curve with shaded areas marks the mean and standard error for the PD group and the healthy control group, while the vertical dotted line marks the median for the maximal blood flow measurements of each group. The vertical dashes mark the maximal blood flow for each subject.
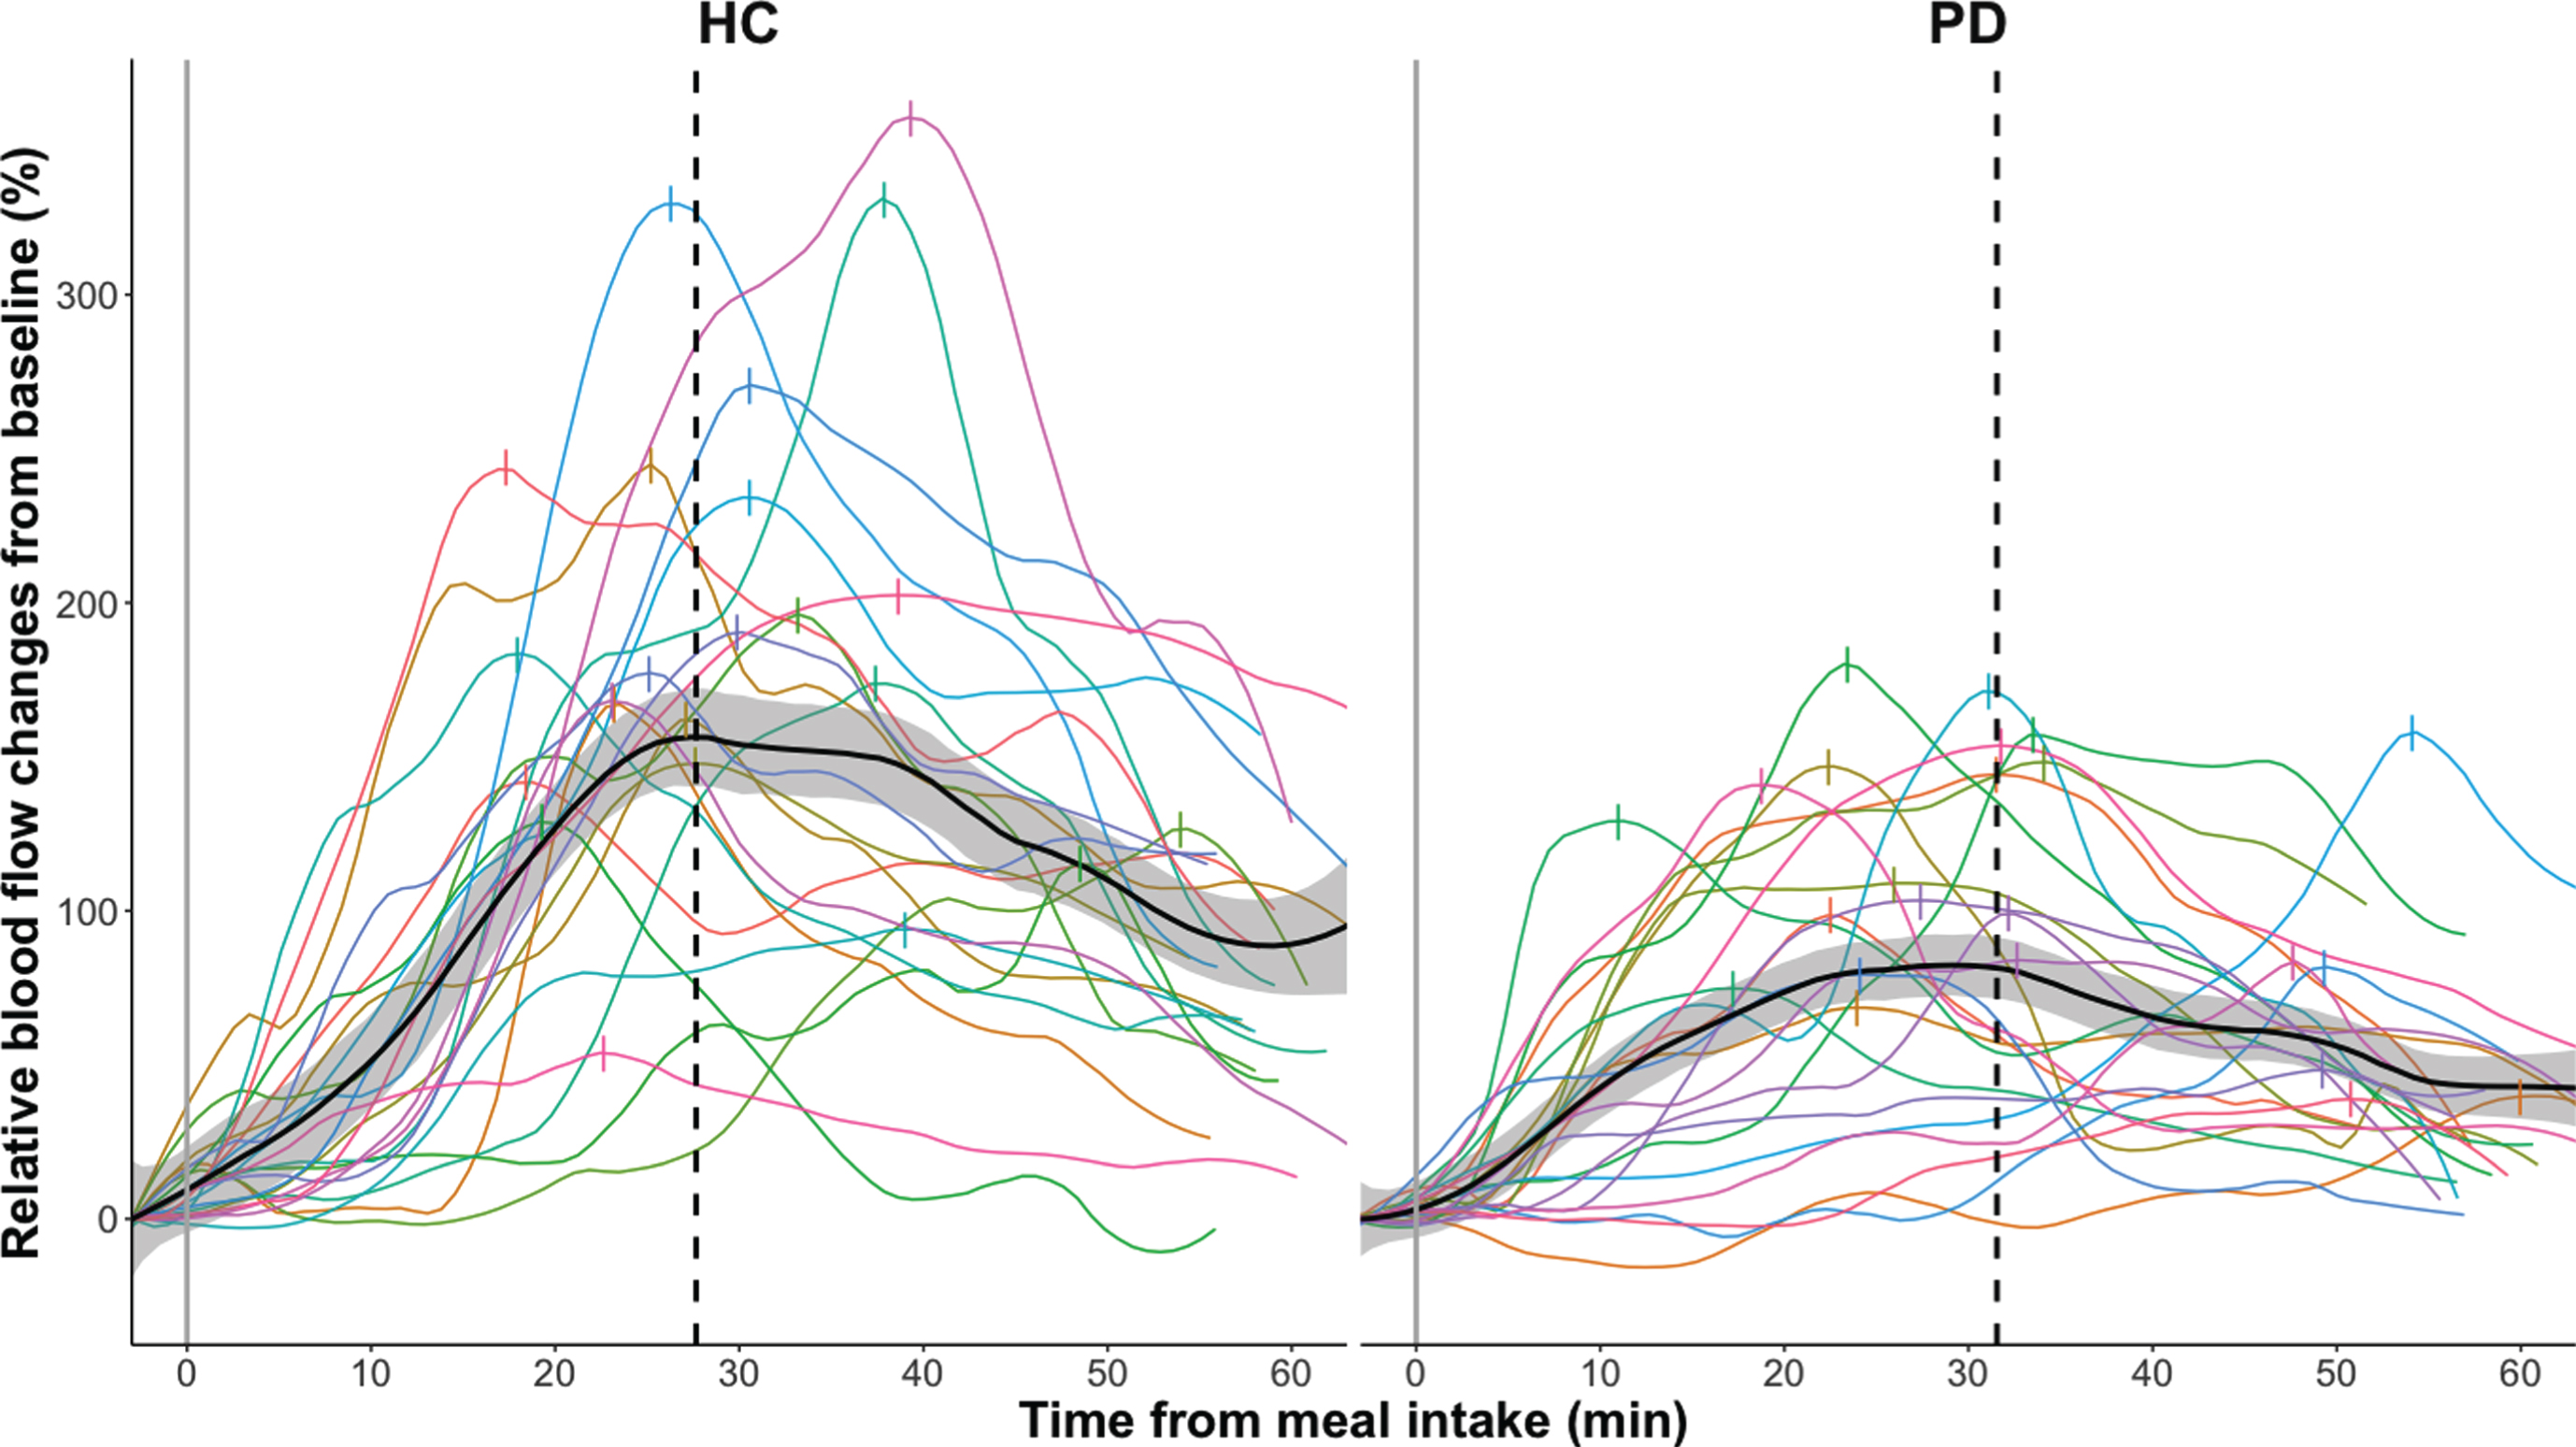
Fig. 2b
Postprandial blood glucose measurements in healthy controls (HC) and participants with Parkinson’s disease (PD). The absolute blood glucose measurements are connected using linear interpolation. The black curve with shaded areas marks the mean and standard error for the PD group and the healthy control group.
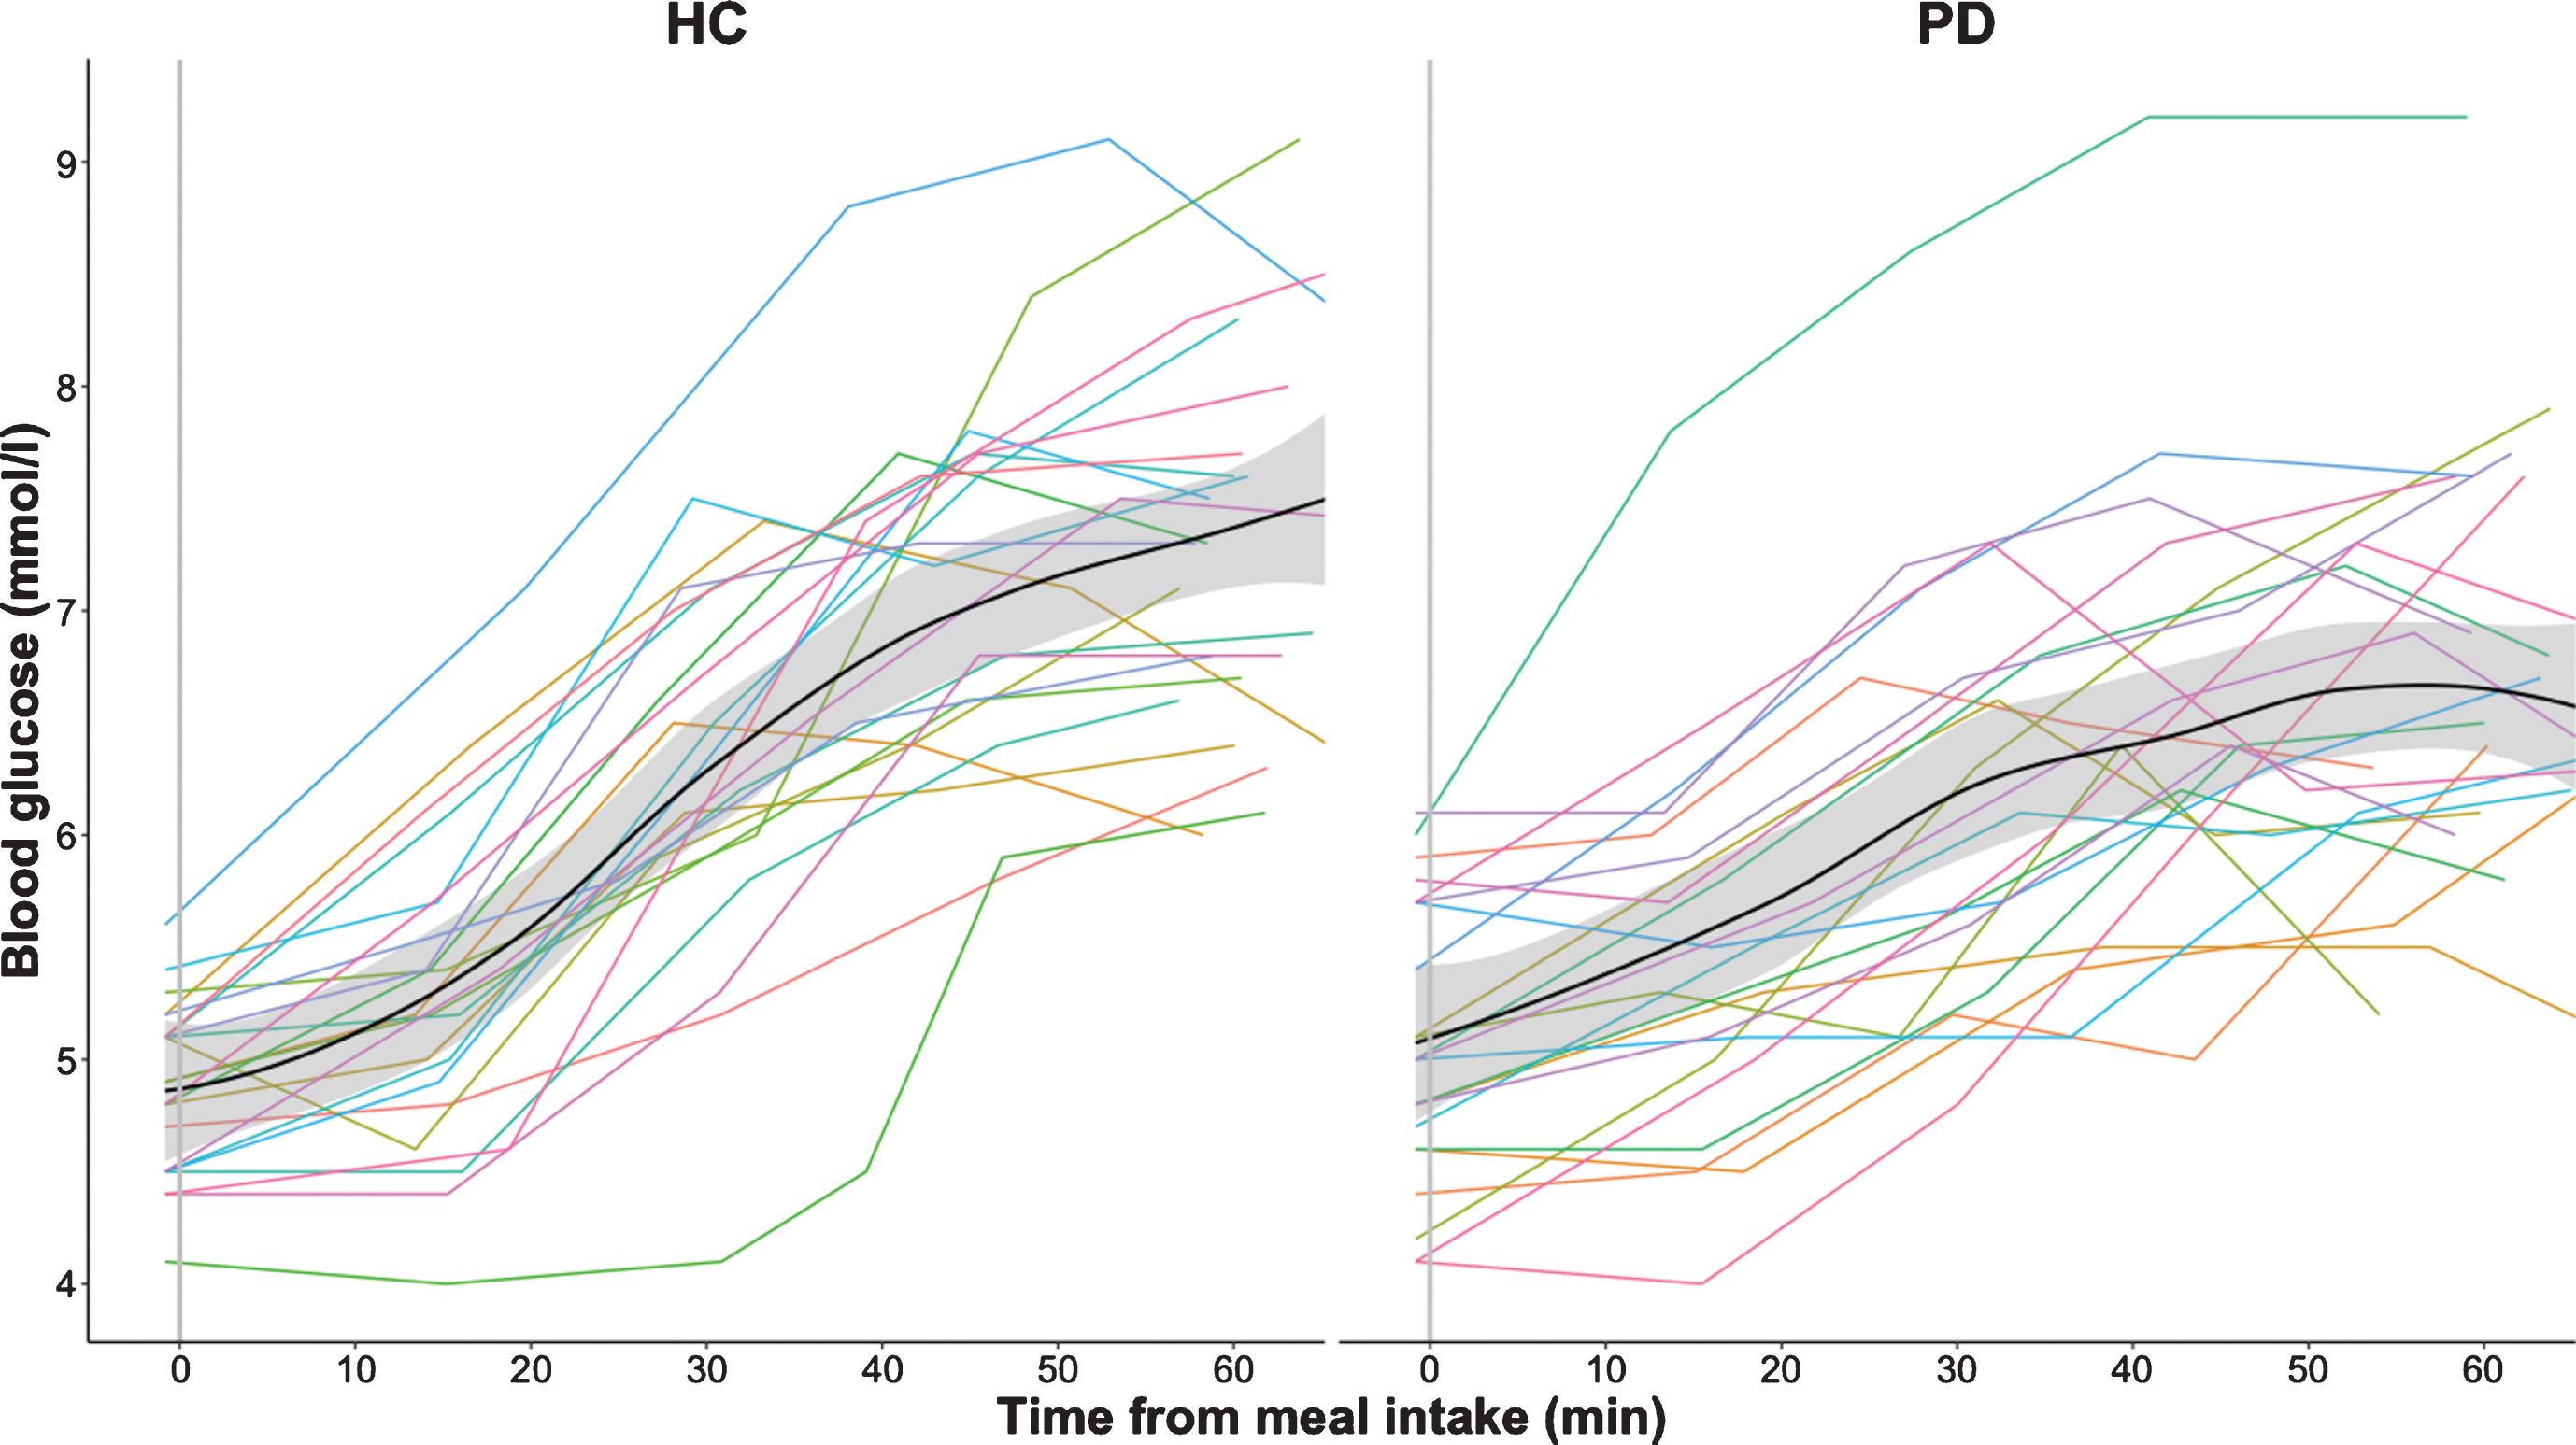
The postprandial increase in blood glucose level was also less prominent in the patient group compared to the healthy control group (p = 0.006, Table 1 and Fig. 2b). There was no significant between-group difference in baseline glucose levels or maximal blood glucose levels. The time to reach maximum blood glucose level did not differ between groups.
We found a significant positive correlation between blood flow at baseline and blood flow maximum when considering all participants (ρ= 0.55, p < 0.0001, Table 2), showing that a higher pre-ingestion blood flow at baseline is associated with a higher post-ingestion blood flow maximum.
Table 2
Correlations of clinical data in patients with PD and control subjects
| All subjects | Healthy controls | PD patients | ||||
| Variables | rho | p-value | rho | p-value | rho | p-value |
| BF time to maximum vs. | 0.583 | <0.0001** | 0.339 | 0.11 | 0.738 | <0.0001** |
| BG time to maximum | ||||||
| BF baseline vs. BF maximum | 0.546 | <0.0001** | 0.575 | 0.004* | 0.669 | <0.001** |
| BF baseline vs. BF increase | 0.075 | 0.62 | 0.212 | 0.33 | 0.168 | 0.44 |
| BF baseline vs. BG baseline | 0.11 | 0.47 | 0.093 | 0.67 | 0.084 | 0.71 |
| BF maximum vs. BG maximum | 0.237 | 0.11 | 0.221 | 0.31 | 0.034 | 0.88 |
| BF increase vs. BG increase | 0.234 | 0.12 | 0.054 | 0.81 | –0.006 | 0.98 |
| Age vs. BF baseline | 0.252 | 0.09 | 0.203 | 0.35 | 0.291 | 0.18 |
| Age vs. BF maximum | 0.088 | 0.56 | 0.004 | 0.99 | 0.349 | 0.1 |
| Age vs. BF increase | –0.102 | 0.5 | –0.187 | 0.39 | 0.176 | 0.42 |
| Age vs. BG baseline | 0.459 | 0.001** | 0.298 | 0.17 | 0.526 | 0.01* |
| Age vs. BG maximum | 0.216 | 0.15 | 0.34 | 0.11 | 0.211 | 0.33 |
| Age vs. BG increase | –0.025 | 0.87 | 0.314 | 0.15 | –0.174 | 0.43 |
| NMS-Quest score vs. BF baseline | 0.134 | 0.38 | –0.134 | 0.54 | 0.052 | 0.81 |
| NMS-Quest score vs. BF maximum | –0.214 | 0.15 | –0.31 | 0.15 | 0.219 | 0.32 |
| NMS-Quest score vs. BF increase | –0.355 | 0.015* | –0.348 | 0.1 | 0.263 | 0.23 |
| NMS-Quest score vs. BF time to maximum | 0.002 | 0.99 | –0.314 | 0.14 | 0.068 | 0.76 |
| GSRS score vs. BF baseline | 0.111 | 0.47 | –0.006 | 0.98 | 0.23 | 0.29 |
| GSRS score vs. BF maximum | –0.047 | 0.76 | –0.154 | 0.48 | 0.154 | 0.48 |
| GSRS score vs. BF increase | –0.09 | 0.55 | –0.161 | 0.46 | 0.053 | 0.81 |
| GSRS score vs. BF time to maximum | –0.148 | 0.33 | –0.421 | 0.046* | 0.051 | 0.82 |
| LEDD vs. BF baseline | 0.135 | 0.54 | ||||
| LEDD vs. BF maximum | 0.075 | 0.74 | ||||
| LEDD vs. BF increase | –0.01 | 0.96 | ||||
| LEDD vs. BF time to maximum | 0.28 | 0.2 | ||||
| LEDD vs. BG increase | –0.079 | 0.72 | ||||
| Disease length vs. BF baseline | –0.143 | 0.51 | ||||
| Disease length vs. BF maximum | –0.197 | 0.37 | ||||
| Disease length vs. BF increase | –0.173 | 0.43 | ||||
| Disease length vs. BF time to maximum | 0.205 | 0.35 | ||||
Correlation are calculated by Spearman’s rank correlation coefficient (ρ= rho) based on absolute blood flow (BF) and blood glucose (BG) values. NMS-Quest, Non-Motor Symptoms Questionnaire; GSRS, Gastrointestinal Symptom Rating Scale; LEDD, Levodopa equivalent daily dose. Based on Bonferroni correction significant p-values are marked by “**”, while trend towards significance are expressed by “*”.
No significant correlation was found between blood flow values and blood glucose values (Table 2). This indicates that the absolute increase in blood flow did not scale with the absolute increase in blood glucose. Likewise, the attenuation of the postprandial increase in mesenteric blood flow observed in PD patients did not scale with the attenuation of the postprandial increase in blood glucose levels.
However, there was a significant positive correlation between the time to reach the maximum of postprandial blood flow and the time to reach the maximum of postprandial blood glucose when considering all subjects (ρ= 0.58, p≤0.0001). The longer the time to reach maximum blood flow, the longer was the time to reach maximum postprandial blood glucose level (Supplementary Figure 1). This positive correlation was also found in the PD group alone (ρ= 0.74, p < 0.0001), but not in healthy controls.
Finally, the SMA blood flow values in PD patients, including baseline, postprandial increase and maximum as well as time to reach maximal blood flow, correlated neither with subjective reports of non-motor symptoms or upper gastrointestinal complaints, nor with levodopa equivalent daily dose or disease duration. Neither did postprandial blood glucose increase correlate with levodopa equivalent daily dose in PD patients.
DISCUSSION
This study provides first-time evidence for an impaired functional regulation of gastrointestinal perfusion in PD in response to food intake. Using dynamic phase-contrast MRI, we found that patients with PD show a postprandial increase in SMA, confirming the findings of previous work [24]. While baseline blood flow in the SMA was comparable in both groups, the postprandial maximum blood flow as well as the absolute and relative increase in splanchnic arterial blood flow was attenuated in patients with PD relative to age- and sex-matched healthy controls with comparable body mass index. The PD group also showed a noticeable inter-individual variation in postprandial intestinal blood flow increase. In some PD patients the blood flow increase was comparable to healthy controls. This might be related to the recently proposed hypothesis about brain-first and body-first subtypes of PD [36].
The mechanisms behind the impaired functional regulation of gastrointestinal perfusion in PD in response to food intake remain to be clarified. Several candidate mechanisms need to be considered, including impaired glucose absorption, changes in motility as well as impaired neural control of gastrointestinal perfusion. Previous studies have shown that only the ingestion of glucose but not water, saline or lactulose solutions triggers a blood flow increase in SMA in healthy individuals [37–40]. Interestingly, intraarterial injection of glucose does not alter microvascular intestinal blood flow [41], suggesting that the endoluminal exposure to glucose is necessary for gastrointestinal blood flow increase. In our study, patients with PD also showed a less prominent postprandial increase in blood glucose level compared to the healthy control group. It is therefore possible that a reduced absorption of glucose in PD attenuates the postprandial blood flow increase. This hypothesis is supported by a study in elderly subjects with and without critical illness measuring glucose absorption from the duodenum after glucose infusion by a postpyloric catheter. That study reported a strong association between SMA flow and total glucose absorption across all subjects [42]. Current results on the intestinal barrier in PD suggest an increase in barrier permeability of the colon, but not of the small intestine, where most of the nutrients and minerals from food are absorbed [43, 44]. In our study, the temporal dynamics of the postprandial blood flow and blood glucose increase did not differ between the PD patients and the healthy control group, but we found a relation regarding the temporal dynamics of both measures in the patient group. The time to reach the maximum of postprandial blood flow correlated positively with the time to reach the maximum of postprandial blood glucose, supporting the notion that an impaired glucose absorption might have played a role in the attenuated postprandial increase in both blood flow and glucose observed in PD. But the fact that no association between increase in blood flow and blood glucose was found in our study, implicates that other mechanisms beside glucose absorption, like changes in motility and neural mechanisms in the gastrointestinal tract may also contribute to the postprandial blood flow increase. These mechanisms may be affected in PD and thereby explain the attenuated postprandial increase in both blood flow and glucose observed in our study. However, the exact mechanisms underlying these new observations of impaired postprandial increase in mesenteric blood flow and in serum blood glucose remain unclear and require further studies.
Impaired gastrointestinal motility may affect the postprandial blood flow increase in PD, influencing the rise time in blood flow and glucose. Previous studies showed no difference in gastric emptying time and in gastric transit time, but significantly delayed small intestinal and colonic transit times in PD patients compared to healthy control subjects [45, 46]. As SMA supplies the gastrointestinal tract from lower part of the duodenum to left colic flexure, increased small intestinal and colonic transit times in PD could be a contributory mechanism to the attenuated postprandial blood flow and glucose response seen in PD patients in our study. However, the time from food intake to postprandial maximum of both SMA blood flow and blood glucose was not increased in PD patients relative to controls in our study. To exclude a relationship to gastrointestinal motility, one would need to measure the temporal dynamics of gastric emptying time and small intestinal transit time after food intake and correlate them to the attenuated postprandial blood flow and glucose response.
Alternatively, the observed changes in this study may be caused by deficient neural innervation of the gastrointestinal system. Impaired neuroendocrine control of the gastrointestinal system may underpin the reduced vascular response of the SMA to food intake in PD patients. This may involve disease-related changes in postprandial secretion of enteric signaling molecules, including serotonin or other hormones and neurotransmitters [47]. Future studies need also to address whether gastrointestinal hormones are affected by PD and whether they correlate to the attenuated postprandial blood flow and glucose response. The intrinsic innervation of the gut by the enteric nervous system (ENS) explains the considerable degree of autonomy regarding the neural control of gastrointestinal functions. Yet extrinsic neural inputs, originating from the central nervous system, also have relevant influence in the gastrointestinal tract [9, 48–52]. The extrinsic innervation depends both on preganglionic parasympathetic outputs, originating in the dorsal motor nucleus of the vagus nerve (DMV) and in the sacral parasympathetic nucleus, but also on sympathetic outputs originating in the intermediolateral cell column and the sympathetic ganglia [48–52]. Both the ENS and the DMV in the brainstem are affected by α-synucleinopathy early in most cases of PD [6–8, 25–28], which is why degeneration of these has been suggested as the most likely cause for gastrointestinal dysfunction in PD [10, 12, 50]. Along with the ENS and DMV, also the sacral parasympathetic nucleus, intermediolateral cell column, and sympathetic ganglia are affected by α-synucleinopathy in PD [48, 50, 52–54]. It is difficult to determine whether the dysregulation of postprandial blood flow found in this study is due to disease related changes of the ENS, DMV, sacral parasympathetic nuclei, intermediolateral cell column or sympathetic ganglia, or a combination of them. In fact, the role of the ENS and the extrinsic innervation originating from the central nervous system in postprandial intestinal hyperemia is not clear. Several studies suggest that extrinsic sympathetic and parasympathetic innervation may not play a significant role in regulation of postprandial hyperemia [16, 17, 55–57]. However, it was shown in conscious dogs that postprandial celiac hyperemia, but not postprandial mesenteric hyperemia, is mediated by a vagal reflex [58, 59]. A variety of studies have implicated the ENS in regulation of postprandial intestinal hyperemia [15, 60–62], while others cast doubt on the potential role of local intestinal nerves in postprandial regulation of intestinal blood flow [15, 16, 56]. Based on this, the neurovascular regulation of postprandial intestinal hyperemia remains unclear, but most likely involves an interaction of several mediators and mechanisms [15–17].
The clinical significance of our findings remains to be clarified. The functional abnormality in regulation in mesenteric blood flow response in PD may be suited as diagnostic biomarker of gastroenteric dysfunction at the vascular level. Whether the demonstration of an attenuated postprandial SMA blood flow response may be helpful in prodromal PD or as progression marker in PD needs to be addressed in longitudinal studies. The attenuated postprandial blood flow response in PD patients did not correlate with the self-reported non-motor dysfunction or subjective complaints related to upper gastrointestinal tract dysfunction. This negative finding does however not exclude more subtle links between the reduced postprandial blood flow response and gastrointestinal dysfunction, which remain to be studied in more detail in future studies. In line with our finding, a previous study showed that correlations between subjective constipation symptoms assessed by questionnaires and colonic transit time were only moderate, and that objective colonic dysfunction was considerably more prevalent than subjective reports of constipation [46].
Limitations
The current study has several limitations. We only studied PD patients in the “ON-medication” state, as we expected PD patients to be stressed and having more difficulties to ingest the standardized meal in lying position and to lie quiet in the MRI-scanner, if they would have been in “OFF-medication” state. Therefore, it remains unclear how much dopaminergic medication modifies the postprandial modulation of blood flow in the SMA. Studies in animals have revealed contradictory effects of dopamine on intestinal blood flow, some evidence points to a vasoconstrictive effect of dopamine at least at higher dosages [63]. Because our findings were obtained in the “ON-medication” state, it is unclear whether dopamine replacement therapy increases or diminishes the attenuated postprandial blood flow rise observed in PD. The lack of correlation between the medication of PD patients and postprandial blood flow increase suggests that that the mechanisms responsible for postprandial hyperemia is not necessarily related to the motor-dopaminergic dysfunction.
Dopamine-replacement therapy might in addition have an effect on glucose metabolism. PD patients in “OFF-medication” state show higher blood glucose levels during a 75 g Oral Glucose Tolerance Test (75 g OGTT) compared to healthy controls [64]. In contrast, PD patients in our study were in “ON-medication” state and showed a lower postprandial increase in blood glucose level. Interestingly, a study reported that pharmacological systemic dopamine depletion reduces peripheral insulin–mediated blood glucose uptake in healthy subjects [65]. Hence the postprandial blood glucose responses may depend on the medication state. However, older studies have reported contradictory results on change in blood glucose and plasma insulin levels after L-dopa administration in healthy subjects and PD patients [66–68]. Another study showed that levodopa-treated PD patients have a significantly lower frequency of diabetes than untreated patients [69]. In our study we found no correlation between LEDD and blood glucose increase. However, a high level of LEDD was associated with lower blood glucose response in “OFF-medication” state PD patients during 75 g OGTT [64]. In summary, future studies need to systematically assess whether and how dopamine replacement therapy contributes to the attenuated postprandial blood flow increase in the SMA and affects the glucose metabolism.
In some participants, postprandial blood flow and serum glucose first peaked towards the end of the time window covered by our measurements. A longer time window would have given the possibility to follow the parameters returning to baseline and to calculate the area under the curve (AUC). Future studies should therefore consider using a longer observation time than in the present study.
We did not perform a detailed assessment of clinical state at the day of examination apart from NMS-Quest and GSRS, as PD patients in this study were not assessed by the Unified Parkinson’s Disease Rating Scale (UPDRS) estimating overall disease severity. In the current study, severity of PD was reflected by disease duration and LEDD, but correlation analysis between UPDRS and blood flow measurements might have helped weigh the effect of disease severity. The relationship to PD patients’ motor impairment as reflected by the UPDRS III, should be examined in future studies.
In the current study, participants responded only to the first nine items of the GSRS about reflux, abdominal pain and indigestion, but not to the last 6 items, which assess diarrhea and constipation. Since SMA supplies the gastrointestinal tract from lower part of the duodenum to left colic flexure, a total score of all 15 GSRS items would have been more representative, and correlation analysis with subjective complaints related to lower gastrointestinal tract dysfunction would have been of interest. Future studies should investigate whether the frequently occurring constipation in PD is related to the attenuated postprandial blood flow response in the SMA.
It would also have been relevant to contrast the current findings in PD with the postprandial blood flow response of SMA in other neurodegenerative diseases, for instance atypical parkinsonian syndromes known to affect the autonomic system, such as Multiple system atrophy. This would have clarified whether our findings are specific to PD and facilitated the pathophysiological interpretation of the results.
CONCLUSIONS
Using PC-MRI, we provide first-time evidence that patients with PD have an attenuated postprandial blood flow response in the SMA and reach lower maximal blood flow levels in the SMA relative to healthy control participants. Our findings indicate an impaired functional regulation of gastrointestinal perfusion in response to food intake in PD and calls for further research into the entero-vascular dysfunction in PD. Future lines of research should identify the underlying pathophysiological mechanisms and explore its clinical significance.
CONFLICT OF INTEREST
Hartwig R. Siebner has received honoraria as speaker from Sanofi Genzyme, Denmark and Novartis, Denmark, as consultant from Sanofi Genzyme, Denmark and as editor-in-chief (Neuroimage Clinical) and senior editor (NeuroImage) from Elsevier Publishers, Amsterdam, The Netherlands. He has received royalties as book editor from Springer Publishers, Stuttgart, Germany and from Gyldendal Publishers, Copenhagen, Denmark.
Flemming Bendtsen has received honoraria as a consultant for Ferring Pharmaceuticals, Denmark.
Annemette Løkkegaard has received honoraria as speaker from AbbVie, United States.
The other authors declare no conflict of interest.
ACKNOWLEDGMENTS
We wish to thank the radiographers Allan Bo Petersen and Jane Næsby for their big help and flexibility in order to realize this study.
This study did not receive any extramural funding and was exclusively financed by the Danish Research Centre for Magnetic Resonance. Hartwig R. Siebner holds a 5-year professorship in precision medicine at the Faculty of Health Sciences and Medicine, University of Copenhagen which is sponsored by the Lundbeck Foundation (Grant Nr. R186-2015-2138). Christopher F. Madelung is completing a PhD, which is sponsored by the Independent Research Fund Denmark (Grant Nr. 7016-00226B).
SUPPLEMENTARY MATERIAL
[1] The supplementary material is available in the electronic version of this article: https://dx.doi.org/10.3233/JPD-202341.
REFERENCES
[1] | Raza C , Anjum R , Shakeel NUA ((2019) ) Parkinson’s disease: Mechanisms, translational models and management strategies. Life Sci 226: , 77–90. |
[2] | Halliday G , Lees A , Stern M ((2011) ) Milestones in Parkinson’s disease–clinical and pathologic features. Mov Disord 26: , 1015–1021. |
[3] | Schapira AHV , Chaudhuri KR , Jenner P ((2017) ) Non-motor features of Parkinson disease. Nat Rev Neurosci 18: , 435–450. |
[4] | Dickson DW , Fujishiro H , Orr C , DelleDonne A , Josephs KA , Frigerio R , Burnett M , Parisi JE , Klos KJ , Ahlskog JE ((2009) ) Neuropathology of non-motor features of Parkinson disease. Parkinsonism Relat Disord 15: (Suppl 3), 1–5. |
[5] | Poewe W ((2008) ) Non-motor symptoms in Parkinson’s disease. Eur J Neurol 15: (Suppl 1), 14–20. |
[6] | Del Tredici K , Rub U , De Vos RA , Bohl JR , Braak H ((2002) ) Where does Parkinson disease pathology begin in the brain? J Neuropathol Exp Neurol 61: , 413–426. |
[7] | Braak H , Del Tredici K , Rub U , de Vos RA , Jansen Steur EN , Braak E ((2003) ) Staging of brain pathology related to sporadic Parkinson’s disease. Neurobiol Aging 24: , 197–211. |
[8] | Braak H , Ghebremedhin E , Rub U , Bratzke H , Del Tredici K ((2004) ) Stages in the development of Parkinson’s disease-related pathology. Cell Tissue Res 318: , 121–134. |
[9] | Travagli RA , Anselmi L ((2016) ) Vagal neurocircuitry and its influence on gastric motility. Nat Rev Gastroenterol Hepatol 13: , 389–401. |
[10] | Jost WH ((2010) ) Gastrointestinal dysfunction in Parkinson’s disease. J Neurol Sci 289: , 69–73. |
[11] | Cersosimo MG , Benarroch EE ((2012) ) Pathological correlates of gastrointestinal dysfunction in Parkinson’s disease. Neurobiol Dis 46: , 559–564. |
[12] | Fasano A , Visanji NP , Liu LW , Lang AE , Pfeiffer RF ((2015) ) Gastrointestinal dysfunction in Parkinson’s disease. Lancet Neurol 14: , 625–639. |
[13] | Pfeiffer RF ((2018) ) Gastrointestinal dysfunction in Parkinson’s disease. Curr Treat Options Neurol 20: , 54. |
[14] | Borghammer P , Knudsen K , Brooks DJ ((2016) ) Imaging systemic dysfunction in Parkinson’s disease. Curr Neurol Neurosci Rep 16: , 51. |
[15] | Gallavan RH Jr , Chou CC ((1985) ) Possible mechanisms for the initiation and maintenance of postprandial intestinal hyperemia. Am J Physiol 249: , G301–308. |
[16] | Chou CC , Coatney RW ((1994) ) Nutrient-induced changes in intestinal blood flow in the dog. Br Vet J 150: , 423–437. |
[17] | Matheson PJ , Wilson MA , Garrison RN ((2000) ) Regulation of intestinal blood flow. J Surg Res 93: , 182–196. |
[18] | Someya N , Endo MY , Fukuba Y , Hayashi N ((2008) ) Blood flow responses in celiac and superior mesenteric arteries in the initial phase of digestion. Am J Physiol Regul Integr Comp Physiol 294: , R1790–1796. |
[19] | Chou CC , Hsieh CP , Yu YM , Kvietys P , Yu LC , Pittman R , Dabney JM ((1976) ) Localization of mesenteric hyperemia during digestion in dogs. Am J Physiol 230: , 583–589. |
[20] | Chou CC , Kvietys P , Post J , Sit SP ((1978) ) Constituents of chyme responsible for postprandial intestinal hyperemia. Am J Physiol 235: , H677–682. |
[21] | Siregar H , Chou CC ((1982) ) Relative contribution of fat, protein, carbohydrate, and ethanol to intestinal hyperemia. Am J Physiol 242: , G27–31. |
[22] | Parker DR , Carlisle K , Cowan FJ , Corrall RJ , Read AE ((1995) ) Postprandial mesenteric blood flow in humans: Relationship to endogenous gastrointestinal hormone secretion and energy content of food. Eur J Gastroenterol Hepatol 7: , 435–440. |
[23] | Sidery MB , Macdonald IA ((1994) ) The effect of meal size on the cardiovascular responses to food ingestion. Br J Nutr 71: , 835–848. |
[24] | Trahair LG , Kimber TE , Flabouris K , Horowitz M , Jones KL ((2016) ) Gastric emptying, postprandial blood pressure, glycaemia and splanchnic flow in Parkinson’s disease. World J Gastroenterol 22: , 4860–4867. |
[25] | Wakabayashi K , Takahashi H , Takeda S , Ohama E , Ikuta F ((1988) ) Parkinson’s disease: The presence of Lewy bodies in Auerbach’s and Meissner’s plexuses. Acta Neuropathol 76: , 217–221. |
[26] | Braak H , de Vos RA , Bohl J , Del Tredici K ((2006) ) Gastric alpha-synuclein immunoreactive inclusions in Meissner’s and Auerbach’s plexuses in cases staged for Parkinson’s disease-related brain pathology. Neurosci Lett 396: , 67–72. |
[27] | Hilton D , Stephens M , Kirk L , Edwards P , Potter R , Zajicek J , Broughton E , Hagan H , Carroll C ((2014) ) Accumulation of alpha-synuclein in the bowel of patients in the pre-clinical phase of Parkinson’s disease. Acta Neuropathol 127: , 235–241. |
[28] | Stokholm MG , Danielsen EH , Hamilton-Dutoit SJ , Borghammer P ((2016) ) Pathological alpha-synuclein in gastrointestinal tissues from prodromal Parkinson disease patients. Ann Neurol 79: , 940–949. |
[29] | Postuma RB , Berg D , Stern M , Poewe W , Olanow CW , Oertel W , Obeso J , Marek K , Litvan I , Lang AE , Halliday G , Goetz CG , Gasser T , Dubois B , Chan P , Bloem BR , Adler CH , Deuschl G ((2015) ) MDS clinical diagnostic criteria for Parkinson’s disease. Mov Disord 30: , 1591–1601. |
[30] | Tomlinson CL , Stowe R , Patel S , Rick C , Gray R , Clarke CE ((2010) ) Systematic review of levodopa dose equivalency reporting in Parkinson’s disease. Mov Disord 25: , 2649–2653. |
[31] | Chaudhuri KR , Martinez-Martin P , Schapira AH , Stocchi F , Sethi K , Odin P , Brown RG , Koller W , Barone P , MacPhee G , Kelly L , Rabey M , MacMahon D , Thomas S , Ondo W , Rye D , Forbes A , Tluk S , Dhawan V , Bowron A , Williams AJ , Olanow CW ((2006) ) International multicenter pilot study of the first comprehensive self-completed nonmotor symptoms questionnaire for Parkinson’s disease: The NMSQuest study. Mov Disord 21: , 916–923. |
[32] | Bostantjopoulou S , Katsarou Z , Karakasis C , Peitsidou E , Milioni D , Rossopoulos N ((2013) ) Evaluation of non-motor symptoms in Parkinson’s Disease: An underestimated necessity. Hippokratia 17: , 214–219. |
[33] | Dimenas E , Glise H , Hallerback B , Hernqvist H , Svedlund J , Wiklund I ((1995) ) Well-being and gastrointestinal symptoms among patients referred to endoscopy owing to suspected duodenal ulcer. Scand J Gastroenterol 30: , 1046–1052. |
[34] | Kulich KR , Madisch A , Pacini F , Pique JM , Regula J , Van Rensburg CJ , Ujszaszy L , Carlsson J , Halling K , Wiklund IK ((2008) ) Reliability and validity of the Gastrointestinal Symptom Rating Scale (GSRS) and Quality of Life in Reflux and Dyspepsia (QOLRAD) questionnaire in dyspepsia: A six-country study. Health Qual Life Outcomes 6: , 12. |
[35] | Hoehn MM , Yahr MD ((1967) ) Parkinsonism: Onset, progression and mortality. Neurology 17: , 427–442. |
[36] | Horsager J , Andersen KB , Knudsen K , Skjærbæk C , Fedorova TD , Okkels N , Schaeffer E , Bonkat SK , Geday J , Otto M , Sommerauer M , Danielsen EH , Bech E , Kraft J , Munk OL , Hansen SD , Pavese N , Göder R , Brooks DJ , Berg D , Borghammer P ((2020) ) Brain-first versus body-first Parkinson’s disease: A multimodal imaging case-control study. Brain 143: , 3077–3088. |
[37] | Qamar MI , Read AE ((1988) ) Effects of ingestion of carbohydrate, fat, protein, and water on the mesenteric blood flow in man. Scand J Gastroenterol 23: , 26–30. |
[38] | Moneta GL , Taylor DC , Helton WS , Mulholland MW , Strandness DE Jr. ((1988) ) Duplex ultrasound measurement of postprandial intestinal blood flow: Effect of meal composition. Gastroenterology 95: , 1294–1301. |
[39] | Sieber C , Beglinger C , Jaeger K , Hildebrand P , Stalder GA ((1991) ) Regulation of postprandial mesenteric blood flow in humans: Evidence for a cholinergic nervous reflex. Gut 32: , 361–366. |
[40] | Qamar MI , Read AE , Mountford R ((1986) ) Increased superior mesenteric artery blood flow after glucose but not lactulose ingestion. Q J Med 60: , 893–896. |
[41] | Chou CC , Burns TD , Hsieh CP , Dabney JM ((1972) ) Mechanisms of local vasodilation with hypertonic glucose in the jejunum. Surgery 71: , 380–387. |
[42] | Sim JA , Horowitz M , Summers MJ , Trahair LG , Goud RS , Zaknic AV , Hausken T , Fraser JD , Chapman MJ , Jones KL , Deane AM ((2013) ) Mesenteric blood flow, glucose absorption and blood pressure responses to small intestinal glucose in critically ill patients older than 65 years. Intensive Care Med 39: , 258–266. |
[43] | Forsyth CB , Shannon KM , Kordower JH , Voigt RM , Shaikh M , Jaglin JA , Estes JD , Dodiya HB , Keshavarzian A ((2011) ) Increased intestinal permeability correlates with sigmoid mucosa alpha-synuclein staining and endotoxin exposure markers in early Parkinson’s disease. PLoS One 6: , e28032. |
[44] | van ISCD , Derkinderen P ((2019) ) The intestinal barrier in Parkinson’s disease: Current state of knowledge. J Parkinsons Dis 9: , S323–s329. |
[45] | Knudsen K , Haase AM , Fedorova TD , Bekker AC , Ostergaard K , Krogh K , Borghammer P ((2017) ) Gastrointestinal transit time in Parkinson’s disease using a magnetic tracking system. J Parkinsons Dis 7: , 471–479. |
[46] | Knudsen K , Fedorova TD , Bekker AC , Iversen P , Ostergaard K , Krogh K , Borghammer P ((2017) ) Objective colonic dysfunction is far more prevalent than subjective constipation in Parkinson’s disease: A colon transit and volume study. J Parkinsons Dis 7: , 359–367. |
[47] | Mittal R , Debs LH , Patel AP , Nguyen D , Patel K , O’Connor G , Grati M , Mittal J , Yan D , Eshraghi AA , Deo SK , Daunert S , Liu XZ ((2017) ) Neurotransmitters: The critical modulators regulating gut-brain axis. J Cell Physiol 232: , 2359–2372. |
[48] | Cersosimo MG , Benarroch EE ((2008) ) Neural control of the gastrointestinal tract: Implications for Parkinson disease. Mov Disord 23: , 1065–1075. |
[49] | Browning KN , Travagli RA ((2014) ) Central nervous system control of gastrointestinal motility and secretion and modulation of gastrointestinal functions. Compr Physiol 4: , 1339–1368. |
[50] | Orimo S , Ghebremedhin E , Gelpi E ((2018) ) Peripheral and central autonomic nervous system: Does the sympathetic or parasympathetic nervous system bear the brunt of the pathology during the course of sporadic PD? Cell Tissue Res 373: , 267–286. |
[51] | Natale G , Pasquali L , Ruggieri S , Paparelli A , Fornai F ((2008) ) Parkinson’s disease and the gut: A well known clinical association in need of an effective cure and explanation. Neurogastroenterol Motil 20: , 741–749. |
[52] | Cersosimo MG , Benarroch EE ((2012) ) Autonomic involvement in Parkinson’s disease: Pathology, pathophysiology, clinical features and possible peripheral biomarkers. J Neurol Sci 313: , 57–63. |
[53] | Beach TG , Adler CH , Sue LI , Vedders L , Lue L , White Iii CL , Akiyama H , Caviness JN , Shill HA , Sabbagh MN , Walker DG ((2010) ) Multi-organ distribution of phosphorylated alpha-synuclein histopathology in subjects with Lewy body disorders. Acta Neuropathol 119: , 689–702. |
[54] | Gelpi E , Navarro-Otano J , Tolosa E , Gaig C , Compta Y , Rey MJ , Martí MJ , Hernández I , Valldeoriola F , Reñé R , Ribalta T ((2014) ) Multiple organ involvement by alpha-synuclein pathology in Lewy body disorders. Mov Disord 29: , 1010–1018. |
[55] | Kvietys PR , Wilborn WH , Granger DN ((1981) ) Effect of atropine on bile-oleic acid-induced alterations in dog jejunal hemodynamics, oxygenation, and net transmucosal water movement. Gastroenterology 80: , 31–38. |
[56] | Nyhof RA , Chou CC ((1983) ) Evidence against local neural mechanism for intestinal postprandial hyperemia. Am J Physiol 245: , H437–446. |
[57] | Nyhof RA , Ingold-Wilcox D , Chou CC ((1985) ) Effect of atropine on digested food-induced intestinal hyperemia. Am J Physiol 249: , G685–690. |
[58] | Vatner SF , Franklin D , Van Citters RL ((1970) ) Mesenteric vasoactivity associated with eating and digestion in the conscious dog. Am J Physiol 219: , 170–174. |
[59] | Takagi T , Naruse S , Shionoya S ((1988) ) Postprandial celiac and superior mesenteric blood flows in conscious dogs. Am J Physiol 255: , G522–528. |
[60] | Kato M , Naruse S , Takagi T , Shionoya S ((1989) ) Postprandial gastric blood flow in conscious dogs. Am J Physiol 257: , G111–117. |
[61] | Biber B , Lundgren O , Svanvik J ((1971) ) Studies on the intestinal vasodilatation observed after mechanical stimulation of the mucosa of the gut. Acta Physiol Scand 82: , 177–190. |
[62] | Biber B , Fara J , Lundgren O ((1974) ) A pharmacological study of intestinal vasodilator mechanisms in the cat. Acta Physiol Scand 90: , 673–683. |
[63] | Pawlik W , Mailman D , Shanbour LL , Jacobson ED ((1976) ) Dopamine effects on the intestinal circulation. Am Heart J 91: , 325–331. |
[64] | Marques A , Dutheil F , Durand E , Rieu I , Mulliez A , Fantini ML , Boirie Y , Durif F ((2018) ) Glucose dysregulation in Parkinson’s disease: Too much glucose or not enough insulin? Parkinsonism Relat Disord 55: , 122–127. |
[65] | Ter Horst KW , Lammers NM , Trinko R , Opland DM , Figee M , Ackermans MT , Booij J , van den Munckhof P , Schuurman PR , Fliers E , Denys D , DiLeone RJ , la Fleur SE , Serlie MJ ((2018) ) Striatal dopamine regulates systemic glucose metabolism in humans and mice. Sci Transl Med 10: , eaar3752. |
[66] | Barbarine A , De Marinis L , Troncone L ((1978) ) Growth hormone response to propranolol and L–dopa in obese subjects. Metabolism 27: , 275–278. |
[67] | Vizner B , Reiner Z , Sekso M ((1983) ) Effect of l-dopa on growth hormone, glucose, insulin, and cortisol response in obese subjects. Exp Clin Endocrinol 81: , 41–48. |
[68] | Boyd AE , 3rd, Lebovitz HE , Pfeiffer JB ((1970) ) Stimulation of human-growth-hormone secretion by L-dopa. N Engl J Med 283: , 1425–1429. |
[69] | Scigliano G , Ronchetti G , Girotti F , Musicco M ((2009) ) Sympathetic modulation by levodopa reduces vascular risk factors in Parkinson disease. Parkinsonism Relat Disord 15: , 138–143. |


