
Substantia Nigra Volume Dissociates Bradykinesia and Rigidity from Tremor in Parkinson’s Disease: A 7 Tesla Imaging Study
Abstract
Background:
In postmortem analysis of late stage Parkinson’s disease (PD) neuronal loss in the substantial nigra (SN) correlates with the antemortem severity of bradykinesia and rigidity, but not tremor.
Objective:
To investigate the relationship between midbrain nuclei volume as an in vivo biomarker for surviving neurons in mild-to-moderate patients using 7.0 Tesla MRI.
Methods:
We performed ultra-high resolution quantitative susceptibility mapping (QSM) on the midbrain in 32 PD participants with less than 10 years duration and 8 healthy controls. Following blinded manual segmentation, the individual volumes of the SN, subthalamic nucleus, and red nucleus were measured. We then determined the associations between the midbrain nuclei and clinical metrics (age, disease duration, MDS-UPDRS motor score, and subscores for bradykinesia/rigidity, tremor, and postural instability/gait difficulty).
Results:
We found that smaller SN correlated with longer disease duration (r = –0.49, p = 0.004), more severe MDS-UPDRS motor score (r = –0.42, p = 0.016), and more severe bradykinesia-rigidity subscore (r = –0.47, p = 0.007), but not tremor or postural instability/gait difficulty subscores. In a hemi-body analysis, bradykinesia-rigidity severity only correlated with SN contralateral to the less-affected hemi-body, and not contralateral to the more-affected hemi-body, possibly reflecting the greatest change in dopamine neuron loss early in disease. Multivariate generalized estimating equation model confirmed that bradykinesia-rigidity severity, age, and disease duration, but not tremor severity, predicted SN volume.
Conclusions:
In mild-to-moderate PD, SN volume relates to motor manifestations in a motor domain-specific and laterality-dependent manner. Non-invasive in vivo 7.0 Tesla QSM may serve as a biomarker in longitudinal studies of SN atrophy and in studies of people at risk for developing PD.
INTRODUCTION
The hallmark pathological feature of Parkinson’s disease (PD) is Lewy body formation in the substantia nigra (SN) with progressive loss of dopaminergic neurons. Early clinicopathological studies correlated the number of surviving dopamine neurons at autopsy with PD clinical symptoms prior to death, including disease duration [1, 2] and severity of bradykinesia and rigidity [3–6]; however, these studies found no relationship between surviving dopamine neurons and tremor severity. These autopsy studies led to the hypothesis that unlike bradykinesia and rigidity, tremor is not primarily driven by dopaminergic neuronal loss. This dichotomy resonates with clinical studies as well; while dopamine replacement dramatically improves bradykinesia and rigidity, many PD patients experience dopamine-refractory tremor [7].
However, the autopsy studies underlying these hypotheses are limited to the latest stages of disease, typically 15 to 20 years after symptom onset when patients are older and more likely to have developed severe bradykinesia and rigidity [1, 8]. Therefore, it is unknown if these clinicopathological relationships exist in early PD. One alternative is to study brain atrophy via magnetic resonance imaging (MRI) in earlier patients with milder symptoms. However, it is difficult to connect MRI signal with surviving dopaminergic neurons in SN that diminish with PD progression. Conventional MRI has difficulties in resolving the boundaries between the SN and surrounding tissue, including the subthalamic nucleus (STN), prohibiting accurate volumetric measurements [9].
Iron as a cofactor for dopamine generation is omnipresent in functional neurons and is removed after neuronal death, making iron a candidate biomarker for surviving neurons in SN [10, 11]. As iron is highly paramagnetic, SN can be detected on MRI methods that are sensitive to tissue magnetic susceptibility. Ultra-high field MRI suits well for this task, because two features of MRI that improve resolution scale approximately linearly with field strength: (1) the signal-to-noise ratio [12] and (2) the sensitivity to magnetic susceptibility [13, 14]. Many nuclei in the upper brainstem and midbrain [STN, red nucleus (RN), and portions of the SN] contain substantial iron [10] and are well visualized by susceptibility-based contrasts such as T2*-weighted imaging, R2* quantification, and quantitative susceptibility mapping (QSM) [15–21]. The higher signal-to-noise ratio combined with the enhanced iron-based contrast enables the probing of microscopic anatomy with high resolution volumetric MRI at 7.0 Tesla (7T) [22]. In particular, QSM, known to be superior to R2* for mapping SN iron [23–27], shows better interrater reliability for SN volumetric tracing [28], and produces superb depictions of iron-containing structures at 7T [29, 30].
Recent 7T MRI work has shown the promise for resolving midbrain nuclei in movement disorders, demonstrating disease-associated alterations in SN volume, signal characteristics, and morphology relative to healthy controls [31–33]. While several studies demonstrate a distorted SN with atrophied nigrosomes in PD [9, 34–37], one T2*-weighted imaging study at 7T found SN volume increased in PD [38]. However, SN volume measured on R2* or T2*-weighted imaging suffers from blooming artifacts that are highly dependent on imaging parameters and object orientation [39]. QSM can be used to minimize these blooming artifacts [39–42] and is therefore an ideal MRI technique for SN volumetric quantification.
There is considerable interest in using MRI methods to visualize and quantify midbrain nuclei as a surrogate to dopamine neuron cell death in PD clinical trials [43, 44]; however, the relationship of the SN, STN, and RN to specific measures of bradykinesia, rigidity, and tremor is not clear. Therefore, this study aimed to (1) measure the volumes of midbrain nuclei in patients with PD with QSM using ultra-high field MRI (2) quantify QSM and R2* values for each of the midbrain nuclei and, (3) determine if there is a selective relationship between midbrain nuclei volumes, QSM, or R2* and distinct motor manifestations in mild-to-moderate PD patients.
METHODS AND MATERIALS
Participants and assessments
We recruited 32 participants with idiopathic PD from the Stanford Movement Disorders Clinic and the surrounding community. Inclusion criteria were as follows: (1) age between 45 and 90 years, (2) diagnosis of PD by a board-certified neurologist with specialty training in movement disorders based on Parkinson’s UK Brain Bank criteria [45], (3) a diagnosis of PD for less than 10 years, (4) a ≥ 30% improvement in Movement Disorders Society Unified Parkinson’s disease Rating Scale, part III motor exam (MDS-UPDRS-III) [46] when taking dopaminergic medications [47], and (5) no history of other significant neurological disease, major psychiatric illness, substance abuse, or head trauma with loss of consciousness more than 5 minutes. We also recruited 8 healthy control older adults, who showed no signs of parkinsonism on comprehensive neurological exam. All participants provided written informed consent to participate in the study following protocols approved by the Stanford Institutional Review Board.
Each participant underwent a clinical evaluation that included a history, physical examination, and neurological examination by a Movement Disorders trained physician, who was blinded to the MRI data. To identify specific motor manifestations related to different midbrain nuclei volumes, three motor subscores were calculated according to published criteria [48]: the Bradykinesia-Rigidity Subscore (MDS-UPDRS items 3.3, 3.4, 3.5, 3.6, 3.7, and 3.8), the Tremor Subscore (MDS-UPDRS items 2.10, 3.15, 3.16, 3.17, and 3.18), and the Postural Instability/Gait Difficulty (PIGD) Subscore (MDS-UPDRS items 2.12, 2.13, 3.10, 3.11, and 3.12). MDS-UPDRS part II was unavailable from three participants, who were thus excluded from the PIGD and Tremor Subscore analysis since both of these Subscores require at least one item from part II.
PD typically begins with unilateral limb symptoms and progresses asymmetrically. Therefore, we calculated the hemi-body Subscores from the right and left appendicular items of the MDS-UPDRS-III. For each participant, a More-Affected side was determined based on the higher overall hemi-body Subscore. The More-Affected and Less-Affected hemi-body Bradykinesia-Rigidity and Tremor Subscores were then calculated. Because the PIGD Subscore contains only axial items, this was not included the hemi-body analysis.
MRI acquisition and processing
Scans were acquired using a GE 7T Discovery 950 whole-body MRI scanner (GE Healthcare, Chicago, Illinois) with a 32-channel receive head coil contained within a quadrature transmit coil (Nova Medical Inc., Wilmington, Massachusetts). Each scanning session began with a 3-plane localizer scan, high-order shimming, and two short gradient echo sequences to derive a complex coil sensitivity profile. An axial three dimensional multi-echo gradient echo scan was acquired using a susceptibility weighted angiography (SWAN) sequence centered on the midbrain covering approximately the mid-pons to the mid-caudate, field of view of 240×168×57.6 mm, acquisition matrix of 400×280×96 (reconstructed to 512×358×94), acquisition resolution of 0.6×0.6×0.6 mm (reconstructed to 0.47×0.47×0.6 mm), echo times of 8/14/20/26/32 ms, repetition time = 32.5 ms, flip angle = 12°, receive bandwidth of +/- 62.5 kHz, acquisition time of 10 minutes 16 seconds. Additionally, a whole-brain coronal magnetization-prepared fluid-attenuated inversion recovery (MP-FLAIR) scan was obtained, field of view of 179×179×173 mm, acquisition matrix = 224×224×216 (reconstructed to 256×256×216), acquisition resolution of 0.8×0.8×0.8 mm (reconstructed to 0.7×0.7×0.8 mm), echo time = 110 ms, repetition time = 8000 ms, inversion time = 2135 ms, bandwidth = 62.5 Hz/pixel, acquisition time of 5 minutes 24 seconds [49].
The magnitude images from the multi-echo gradient echo acquisition were averaged across echo times as an online reconstruction. Additionally, the raw data from this acquisition was reconstructed offline for each receiver coil, then combined into complex images while preserving signal phase using the complex coil sensitivity profiles [50]. Subject-specific binary masks were creating using ITK-SNAP (http://www.itksnap.org) [51], and QSM were generated from the complex images using morphology-enabled dipole inversion [52]. R2* maps were generated by log transformation followed by linear fitting. The Functional Magnetic Resonance Imaging of the Brain Software Library (FSL, version 5.0, fsl.fmrib.ox.ac.uk) [53] linear registration tool was used to coregister the magnitude images from the QSM acquisitions with the FLAIR images from each participant, interpolating both to an isotropic voxel size of 0.3 mm. Images were both automatically and visually checked in a blinded manner for adequate quality throughout the stages of preprocessing.
Segmentation of midbrain nuclei
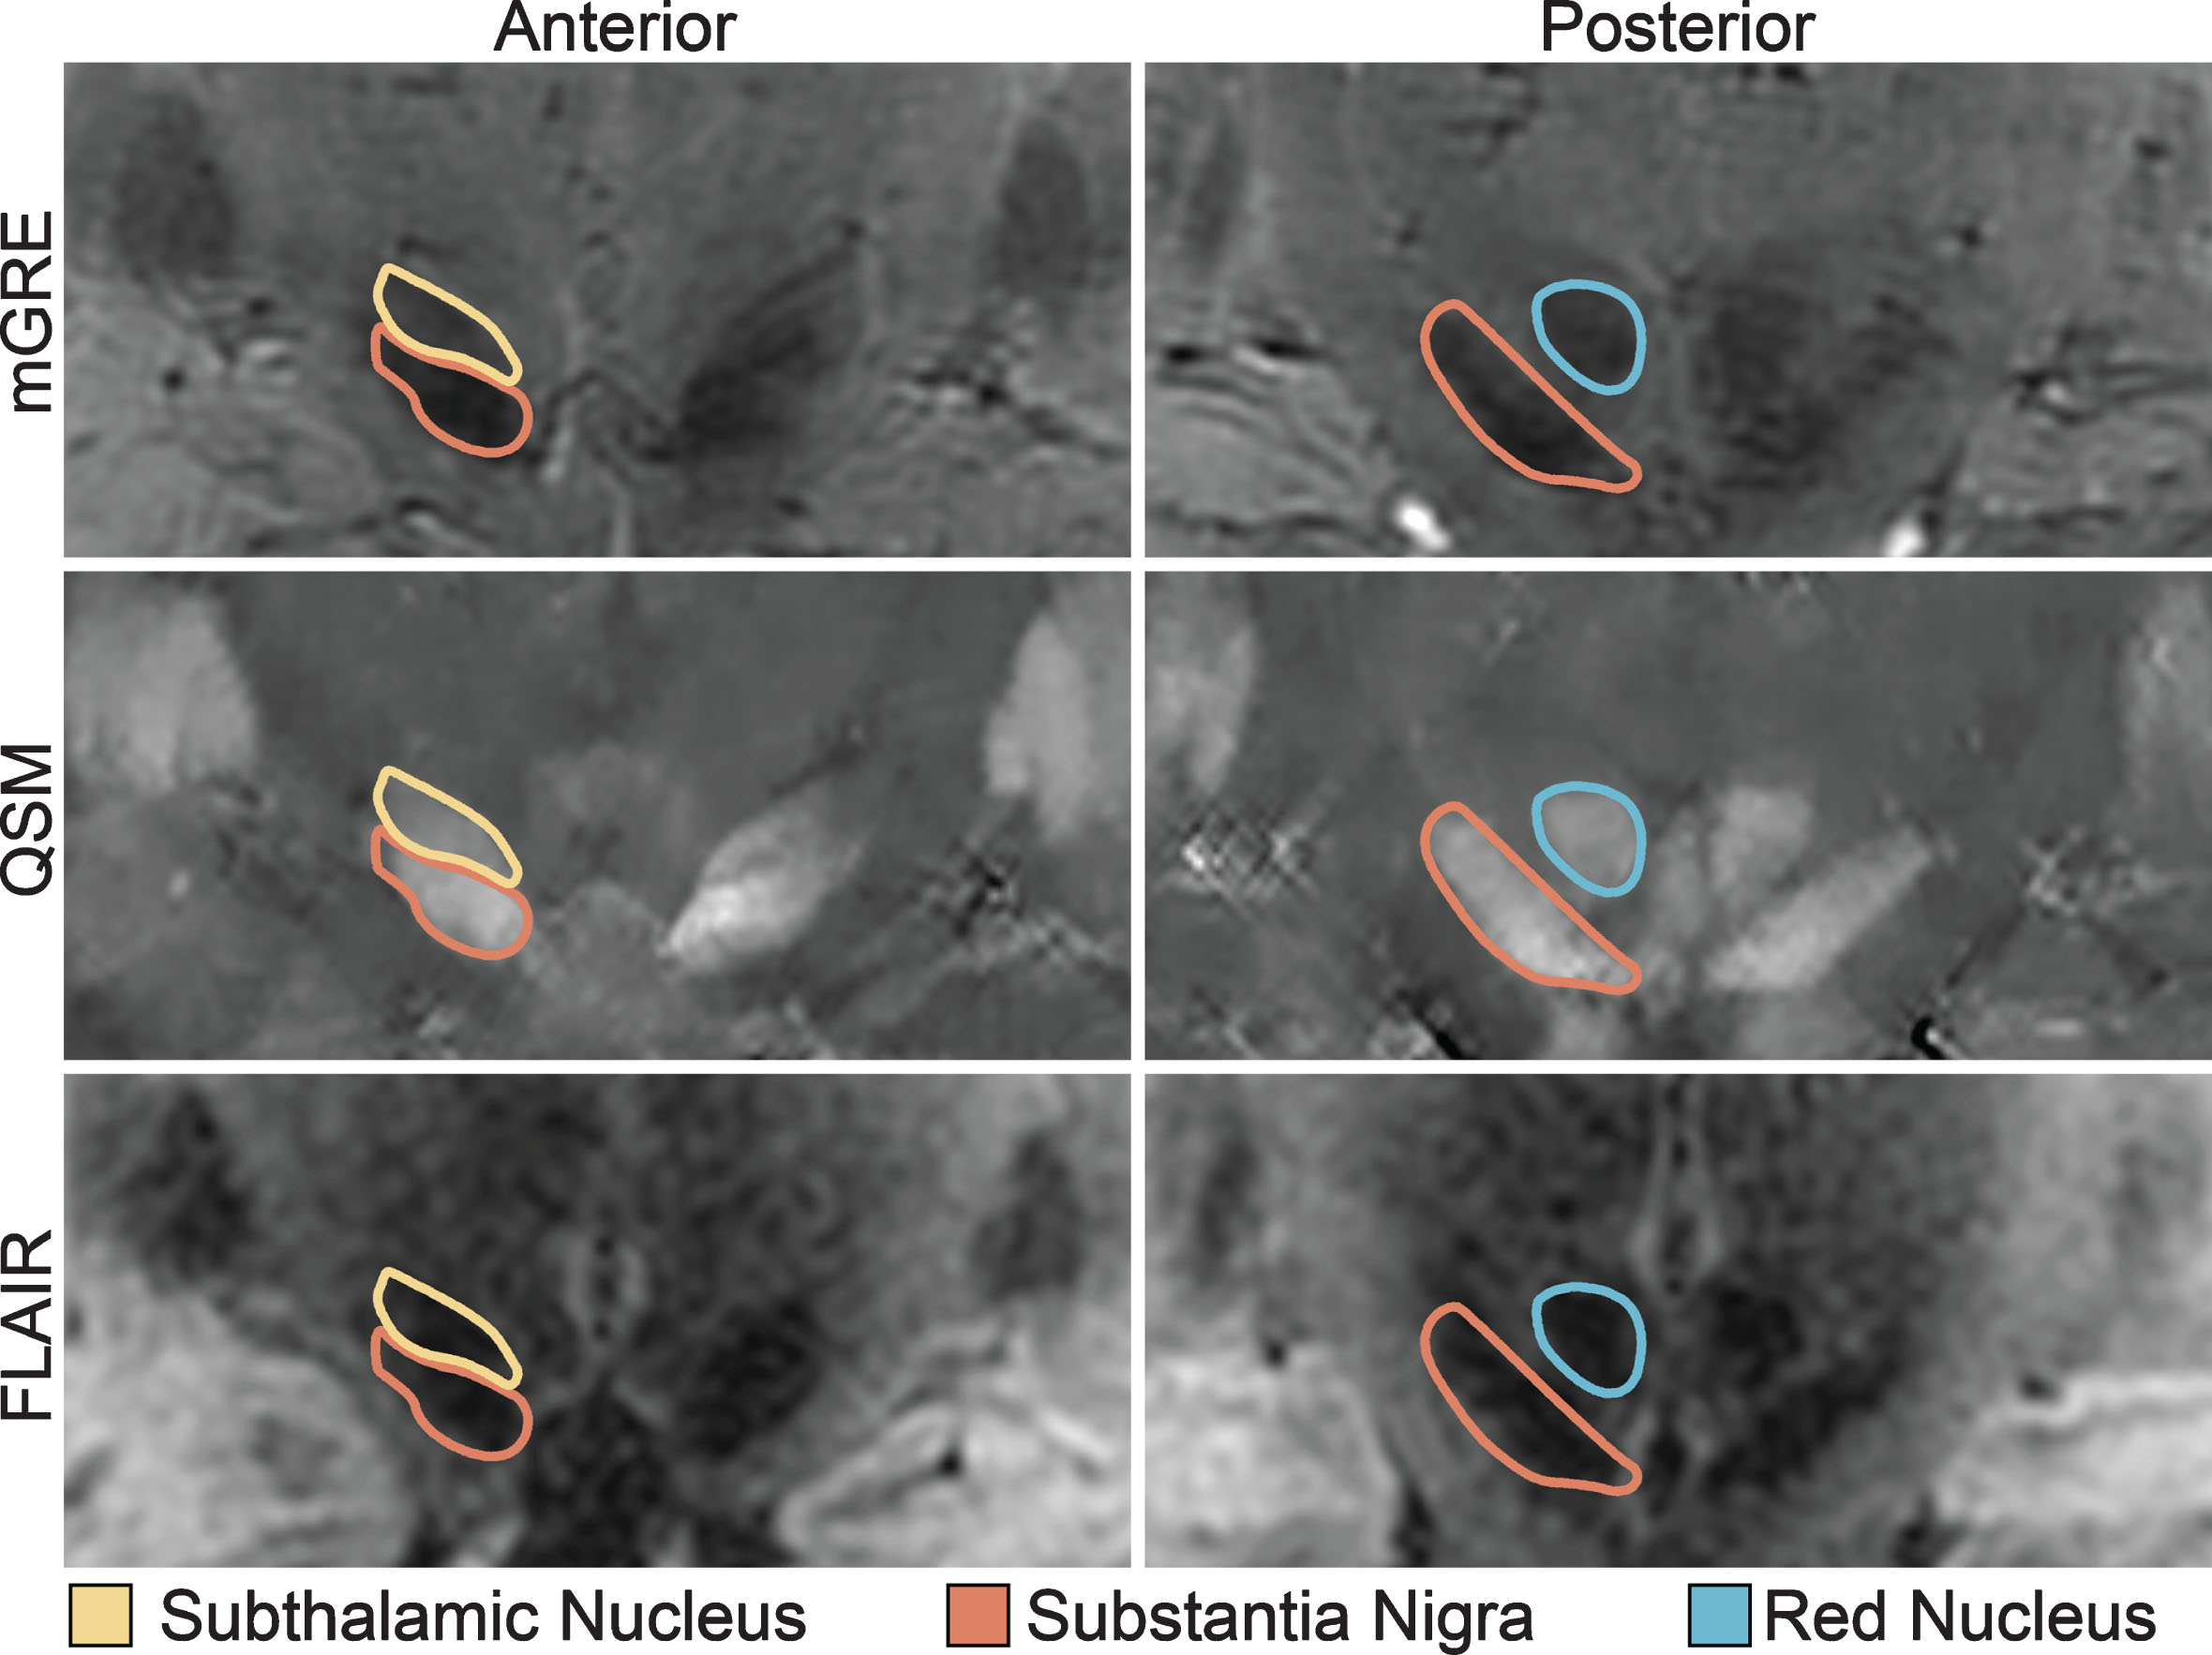
Segmentation was performed by a single rater, who was blinded to all clinical data. The SN, STN, and RN were manually segmented in 3 dimensions on the coregistered QSM and MP-FLAIR images using ITK-SNAP. The primary segmentation was performed in the coronal plane (Fig. 1). All three structures were typically bright in the QSM images (because of their iron content) facilitating direct visualization, and dark in the MP-FLAIR images. The RN was identified as an approximately spherical structure in the posterior midbrain. The SN was identified posteriorly as an obliquely oriented linear structure inferolateral to the RN and elliptical in the coronal plane. The STN was itself also identified as being elliptical in shape, immediately adjacent and superior to the SN in the coronal plane, but generally separable in the QSM images from the SN by differences in intensity and by comparison with the corresponding MP-FLAIR images. For coronal slices in which SN-STN boundary was unclear, the nearest coronal slice in which it was clear was used as a guide. After segmenting in the coronal plane, segmentations were adjusted in the axial plane to ensure smoothness and contiguity.
Fig.1
Midbrain Nuclei Segmentation. Coronal images of the subthalamic nucleus, substantia nigra, and red nucleus on multi-echo gradient echo (mGRE), quantitative susceptibility maps (QSM), and fluid-attenuated inversion recovery (FLAIR) images. Note the clear separation of the substantia nigra from the subthalamic nucleus on the anterior images.
After the initial segmentation was performed, two additional blinded raters experienced in brain segmentation checked the segmentation and provided additional suggestions for editing, which was then judged as adequate by a final consensus. Finally, to validate reproducibility of our segmentation technique, a second rater, who was also blinded to all clinical data, performed a separate segmentation on a subset of 12 participants with an inter-rater reliability of 0.973 for the SN, 0.970 for the STN, and 0.839 for the RN using the Intraclass Correlation Coefficient, two-way mixed for absolute agreement.
We calculated the volume of each right and left STN, SN, and RN separately in mm3. We then extracted the mean QSM and R2* values for each of the nuclei volumes. QSM values were normalized by subtracting from the mean susceptibility within a 3rd ventricular cerebrospinal fluid region of interest.
Statistical analysis
Analyses were conducted in two stages, focused principally on the PD cohort. In the first stage we conducted a series of bivariate analyses using Spearman rho correlation coefficients to broadly assess the relationship between each of the midbrain nuclei and clinical metrics (age, disease duration, MDS-UPDRS-III total, and subscores for bradykinesia/rigidity, tremor, and PIGD). Scatterplots were generated for significant correlations. For analyses of global measures of disease, such as duration, we averaged the right and left sides for each of the three nuclei. Because PD pathology is asymmetric, we analyzed lateralized measures (the bradykinesia/rigidity subscore and the tremor subscore on the less and the more affected side) using the contralateral nuclei.
In the second stage of analysis we conducted three independent multivariate analyses (one for each nucleus) to determine which clinical metrics significantly predict midbrain nuclei volume when all metrics are considered in the same statistical model. For this second analysis we included the right and left nuclei separately; therefore, a generalized estimating equation model was used to account for correlated right and left nuclei volumes within an individual. We performed three models, one for each nucleus (SN, STN, and RN), and each with a normal distribution, identity link function, and exchangeable correlation structure specified. This equation modeled nuclear volume as the sum of age, disease duration, bradykinesia-rigidity severity, and tremor severity.
Prior research has identified imaging differences between the side of the brain contralateral to more or less affected limbs of patients with PD [54, 55]. Therefore, we performed an exploratory analysis separating midbrain nuclei contralateral to the More-Affected versus Less-Affected sides. Paired t-tests were used for within midbrain nuclei analysis and Spearman rho correlation coefficients were calculated to assess the relationships between each of the midbrain nuclei and clinical metrics.
Between PD and healthy control group differences in SN, STN, and RN volumes were determined with independent t-tests. For all analyses, two-tailed p values were used; those values of p≤0.05 were defined as significant. All statistical analyses were conducted using SAS Enterprise Guide, version 7.11.
RESULTS
Participants
PD participants (Table 1) mean (±standard deviation) disease duration was 4.1 (±2.1) years and motor severity ranged from mild to moderate with a mean MDS-UPDRS-III Off dopaminergic medications of 33.1 (±12.3). Off dopaminergic medications, six participants were Hoehn and Yahr stage I (unilateral involvement only), 22 were stage II (bilateral involvement), and four were≥stage III (bilateral involvement with impairment of balance).
Table 1
PD Demographics
| More-Affected Side | Less-Affected Side | |||||
| Mean (±SD) | Range | Mean (±SD) | Range | Mean (±SD) | Range | |
| N | 32 | |||||
| Age, years | 65.3 (±7.4) | 52–79 | ||||
| Male:Female | 15 : 17 | |||||
| Duration, years | 4.0 (±2.1) | 1–8 | ||||
| Hoehn and Yahr | 2.2 (±0.7) | 1–4 | ||||
| MDS-UPDRS-III | 32.8 (±12.0) | 6–62 | 14.0 (±4.1) | 8–22 | 8.1 (±4.8) | 0–18 |
| Bradykinesia-Rigidity | 18.5 (±7.7) | 5–34 | 10.9 (±3.5) | 6–18 | 6.8 (±4.2) | 0–15 |
| Subscore | ||||||
| Tremor Subscore | 7.5 (±5.0) | 0–16 | 5.0 (±3.4) | 0–11 | 3.2 (±2.4) | 0–8 |
| PIGD Subscore | 3.6 (±3.2) | 0–15 | – | – | – | – |
All motor scores are reported for the Off medication state. MDS-UPDRS-III, Movement disorders Society United Parkinson’s disease Rating Scale part 3 motor exam; PIGD, postural instability/gait difficulty; SD, standard deviation.
PD participants represent a mixture of motor subtypes. Only one participant had a Tremor Subscore of zero, but 11 had Tremor Subscores of less than five and nine had Tremor Subscores of greater than 10. Using a Tremor/PIGD Subscore ratio of≤0.90 [48], nine participants were classified as PIGD dominant. When considering appendicular motor severity, 15 participants were more affected on the right side and 17 were more affected on the left side.
Relationship of midbrain nuclei to PD motor severity
Direct correlation analysis in the PD participants demonstrated that a smaller SN volume correlated with longer disease duration (r = –0.42, p = 0.004) and higher (more severe) MDS-UPDRS-III (r = –0.42, p = 0.016) (Figs. 2 and 3, Table 2), with a trend relationship with older age (r = –0.31, p = 0.08). There was no association between STN or RN volumes and disease duration, MDS-UPDRS-III, or age.
Fig.2
Disease Duration versus Midbrain Nuclei Volumes. Longer duration of Parkinson’s disease diagnosis was only associated with smaller volume of the substantia nigra, not the subthalamic nucleus or the red nucleus. r, Spearman’s rho correlation coefficient.
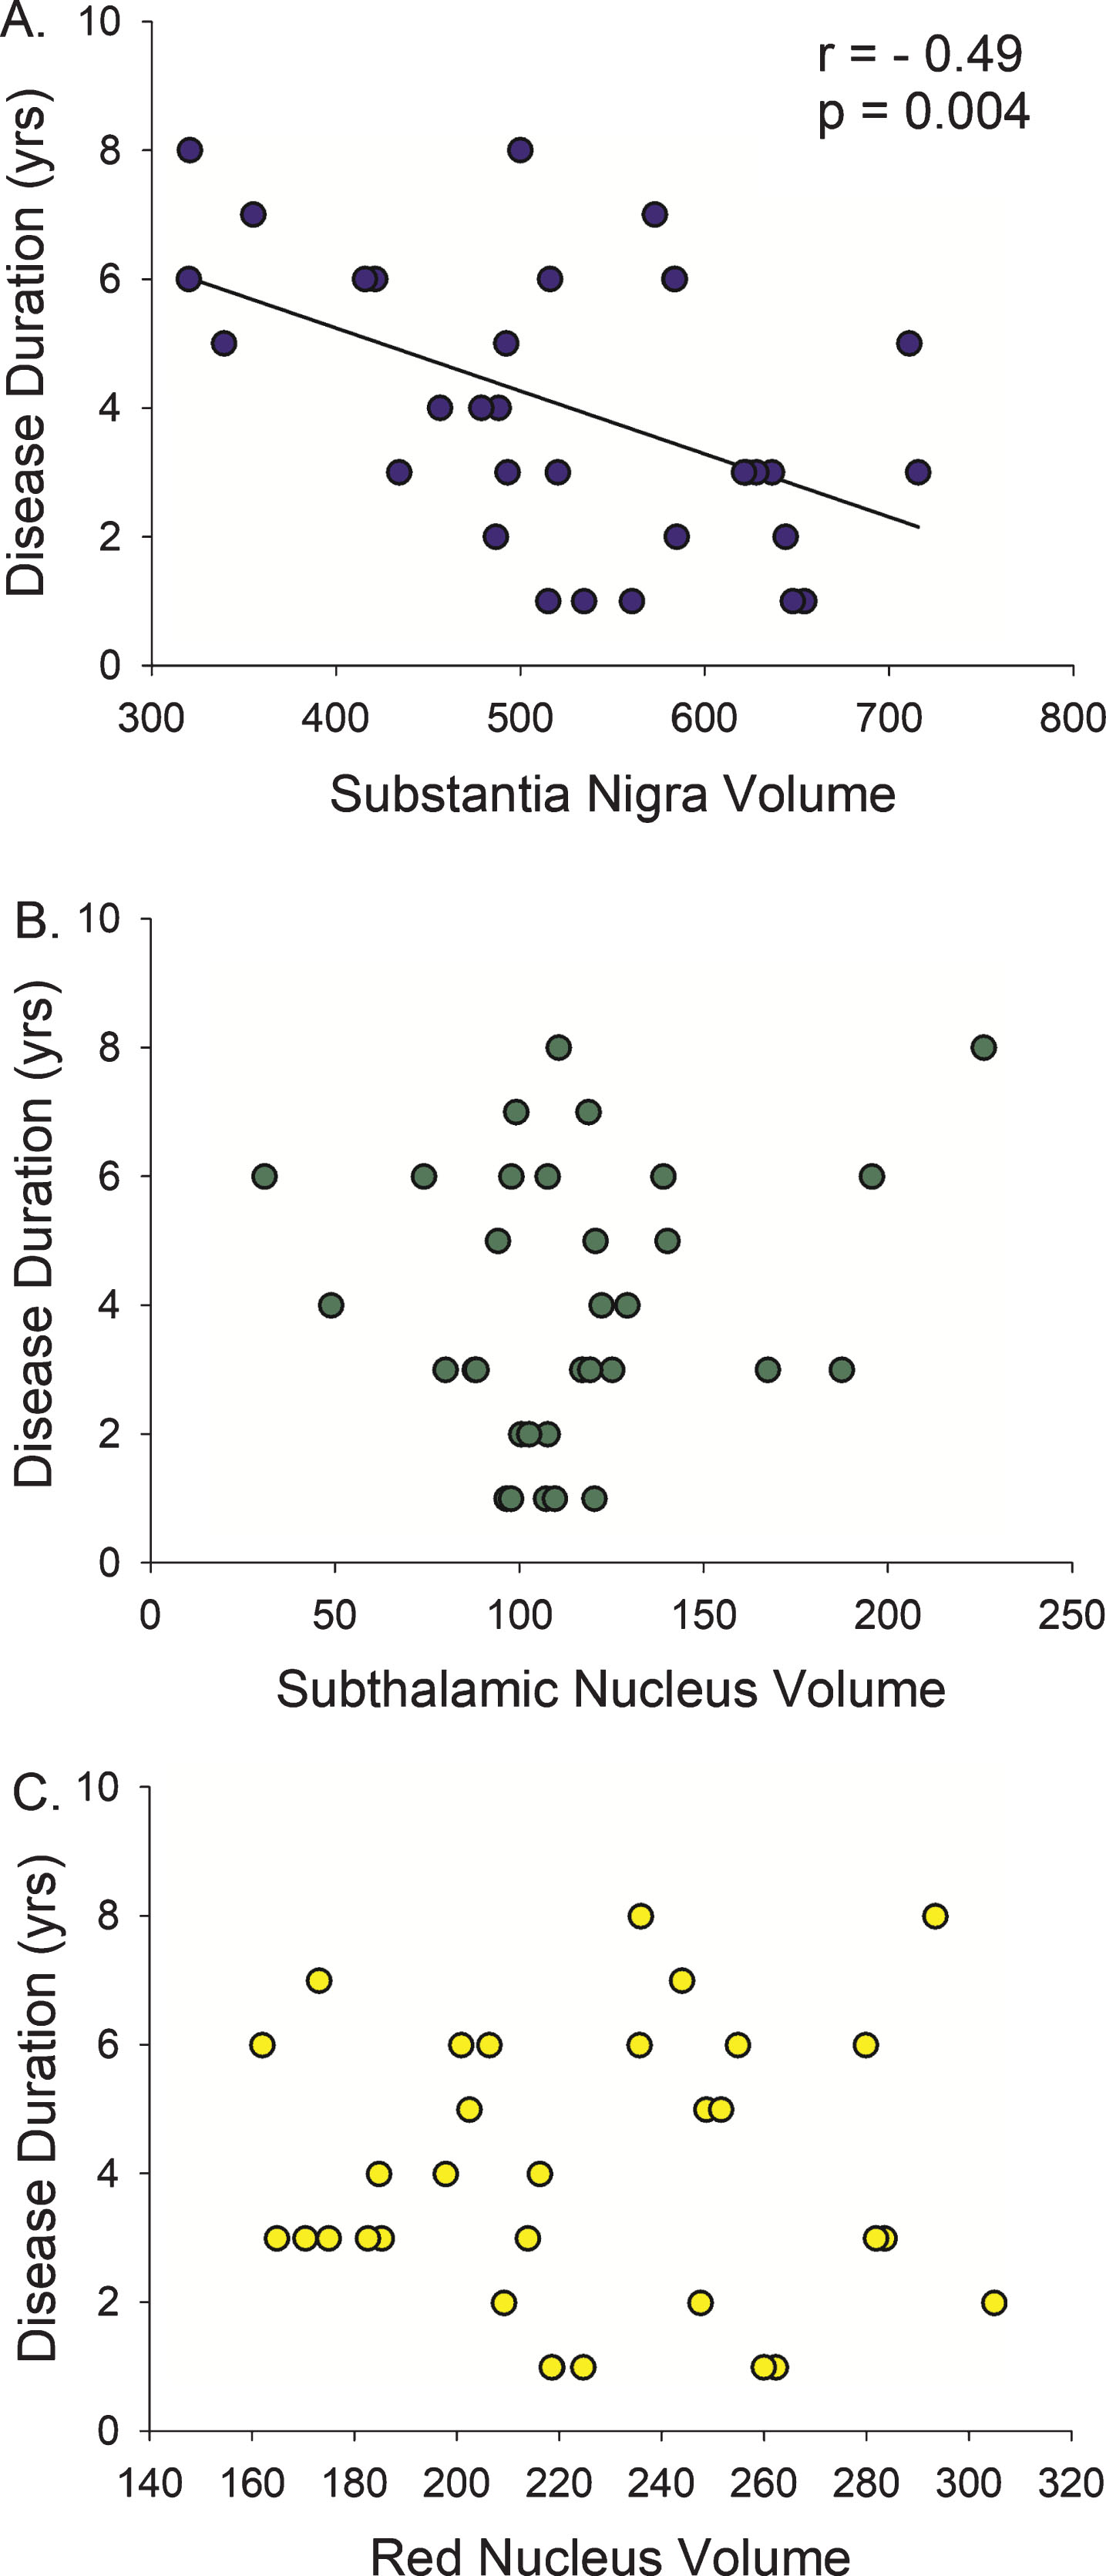
Fig.3
Motor Severity versus Midbrain Nuclei Volumes. (A) Smaller substantia nigra volumes are associated with worsening of the total Motor Score (MDS-UPDRS III) in Parkinson’s disease. (B) However, when the total motor score is broken down by symptom group, only the Bradykinesia-Rigidity Subscore explained this relationship. There was no association with (C) postural instability/gait difficulty (PIGD) or (D) Tremor severity. r, Spearman’s rho correlation coefficient.
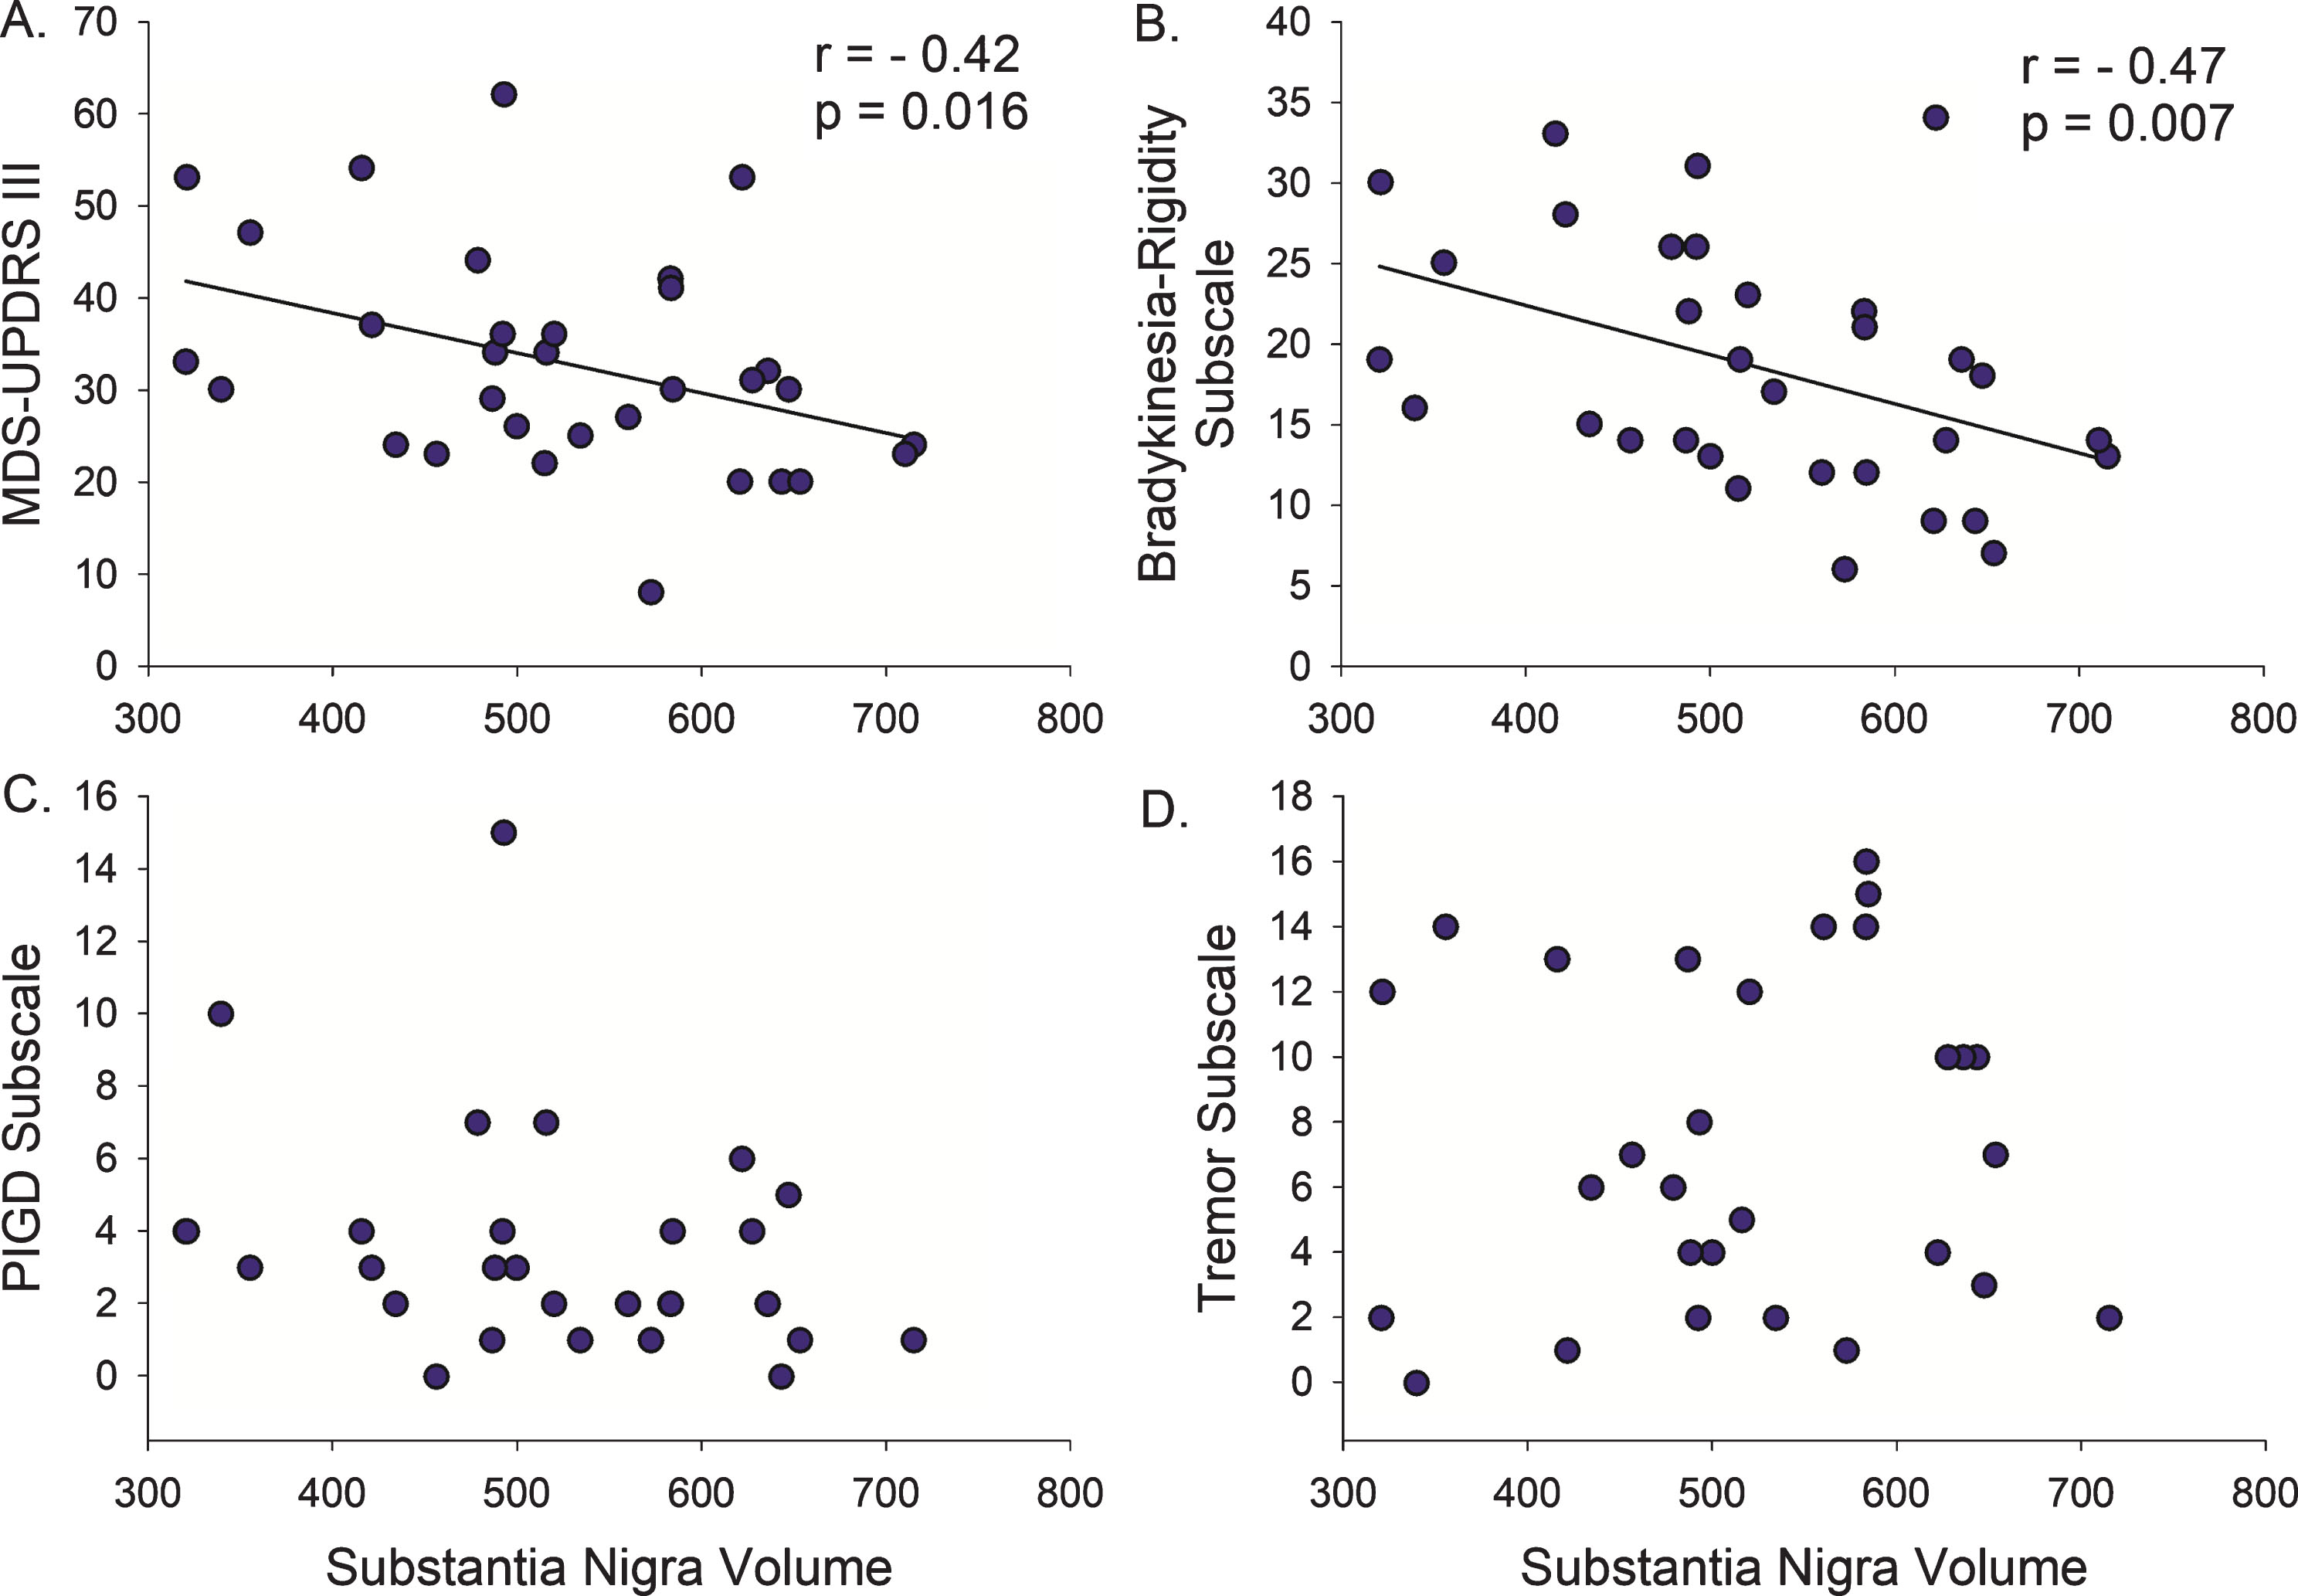
Table 2
Correlations between midbrain nuclei volumes and Parkinson’s disease motor severity
| Substantia Nigra r (p) | Subthalamic Nucleus r (p) | Red Nucleus r (p) | |
| Duration | –0.49 (0.004) | 0.14 (0.435) | –0.07 (0.722) |
| Age | –0.31 (0.082) | 0.20 (0.276) | 0.10 (0.593) |
| MDS-UPDRS-III total | –0.42 (0.016) | 0.29 (0.104) | 0.25 (0.162) |
| Bradykinesia-Rigidity total | –0.47 (0.007) | 0.17 (0.339) | 0.16 (0.373) |
| Tremor total | 0.11 (0.579) | 0.21 (0.282) | 0.30 (0.116) |
| PIGD | –0.31 (0.103) | 0.32 (0.092) | 0.22 (0.261) |
| MDS-UPDRS-III Less-Affected | –0.37 (0.038) | 0.33 (0.068) | 0.31 (0.082) |
| Bradykinesia-Rigidity Less-Affected | –0.41 (0.019) | 0.29 (0.107) | 0.24 (0.191) |
| Tremor Less-Affected | –0.09 (0.635) | 0.28 (0.125) | 0.35 (0.053) |
| MDS-UPDRS-III More-Affected | –0.22 (0.225) | 0.16 (0.370) | 0.24 (0.195) |
| Bradykinesia-Rigidity More-Affected | –0.35 (0.053) | 0.04 (0.850) | 0.17 (0.363) |
| Tremor More-Affected | 0.06 (0.765) | 0.14 (0.448) | 0.16 (0.398) |
r, Spearmans’s rho correlation coefficient; MDS-UPDRS-III, Movement disorders Society United Parkinson’s disease Rating Scale part 3 motor exam; PIGD, postural instability/gait difficulty.
Next, we examined the association between midbrain nuclei volumes and motor subscores for bradykinesia/rigidity, PIGD, and tremor. Smaller SN volume correlated with higher (more severe) Bradykinesia-Rigidity Subscore (r = –0.47, p = 0.007, Fig. 3), but not Tremor or PIGD Subscores (Table 2). There was no relationship between STN or RN volumes and Bradykinesia-Rigidity, Tremor, or PIGD Subscores.
We next performed three separate multivariate analyses (one for each of the midbrain nuclei) using a generalized estimating equation model to determine the relationships between midbrain nuclei volumes and clinical metrics when considered in the same statistical model, thereby controlling for the possible confounding effects of age and disease duration (Table 3). The Bradykinesia-Rigidity Subscore, disease duration, and age all predicted SN volume in the same model (p < 0.0001). There were no significant results for STN or RN volumes.
Table 3
Results of the multivariate generalized estimating equation model
| Nuclei Clinical Metric | Change in Nuclei Volumes (Beta Coefficient) | 95% Confidence Interval | ||
| lower | upper | p value | ||
| Substantia Nigra | ||||
| Bradykinesia-Rigidity Subscore | –6.15 | –9.81 | –2.48 | 0.001 |
| Tremor Subscale | 0.72 | –7.33 | 8.76 | 0.86 |
| Duration | –24.87 | –35.74 | –14.00 | <0.0001 |
| Age | –4.16 | –6.73 | –1.58 | 0.0002 |
| Subthalamic Nucleus | ||||
| Bradykinesia-Rigidity Subscore | –0.64 | –2.69 | 1.40 | 0.54 |
| Tremor Subscale | 2.94 | –1.18 | 7.07 | 0.16 |
| Duration | 3.42 | –2.41 | 9.26 | 0.25 |
| Age | 1.70 | –0.13 | 3.45 | 0.07 |
| Red Nucleus | ||||
| Bradykinesia-Rigidity Subscore | –0.85 | –2.96 | 1.27 | 0.43 |
| Tremor Subscale | –0.04 | –4.00 | 3.92 | 0.98 |
| Duration | 0.16 | –6.65 | 6.97 | 0.96 |
| Age | 0.79 | –1.49 | 3.07 | 0.50 |
Four PD participants were≥Hoehn and Yahr stage III. They were older (mean±SD 73.8±5.5 versus 64.1±6.9, p = 0.012), had lower MoCA (20.3±4.6 versus 26.8±2.7, p = 0.001), and trended toward worse MDS-UPDRS-III (42.5±14.7 versus 31.5±11.3, p = 0.083) compared to the 28 participants with a Hoehn and Yahr stage I-II. Because their older age, more severe cognitive impairment, and early gait and balance problems could be indicative of an alternative pathology, such as progressive supranuclear palsy or co-morbid Alzheimer’s disease pathology, we removed them and repeated the analysis. All relationships between midbrain nuclei and clinical metrics remained similar in significance and magnitude after these participants were excluded.
Assessment of more- and less-affected midbrain nuclei
We next explored the relationship between the More- and Less-Affected hemi-body motor subscores and contralateral midbrain nuclei volumes. The SN contralateral to the More-Affected hemi-body was smaller than that contralateral to the Less-Affected hemi-body (p = 0.012). There were no significant volumetric differences between the More- and Less-Affected sides of the STN or RN.
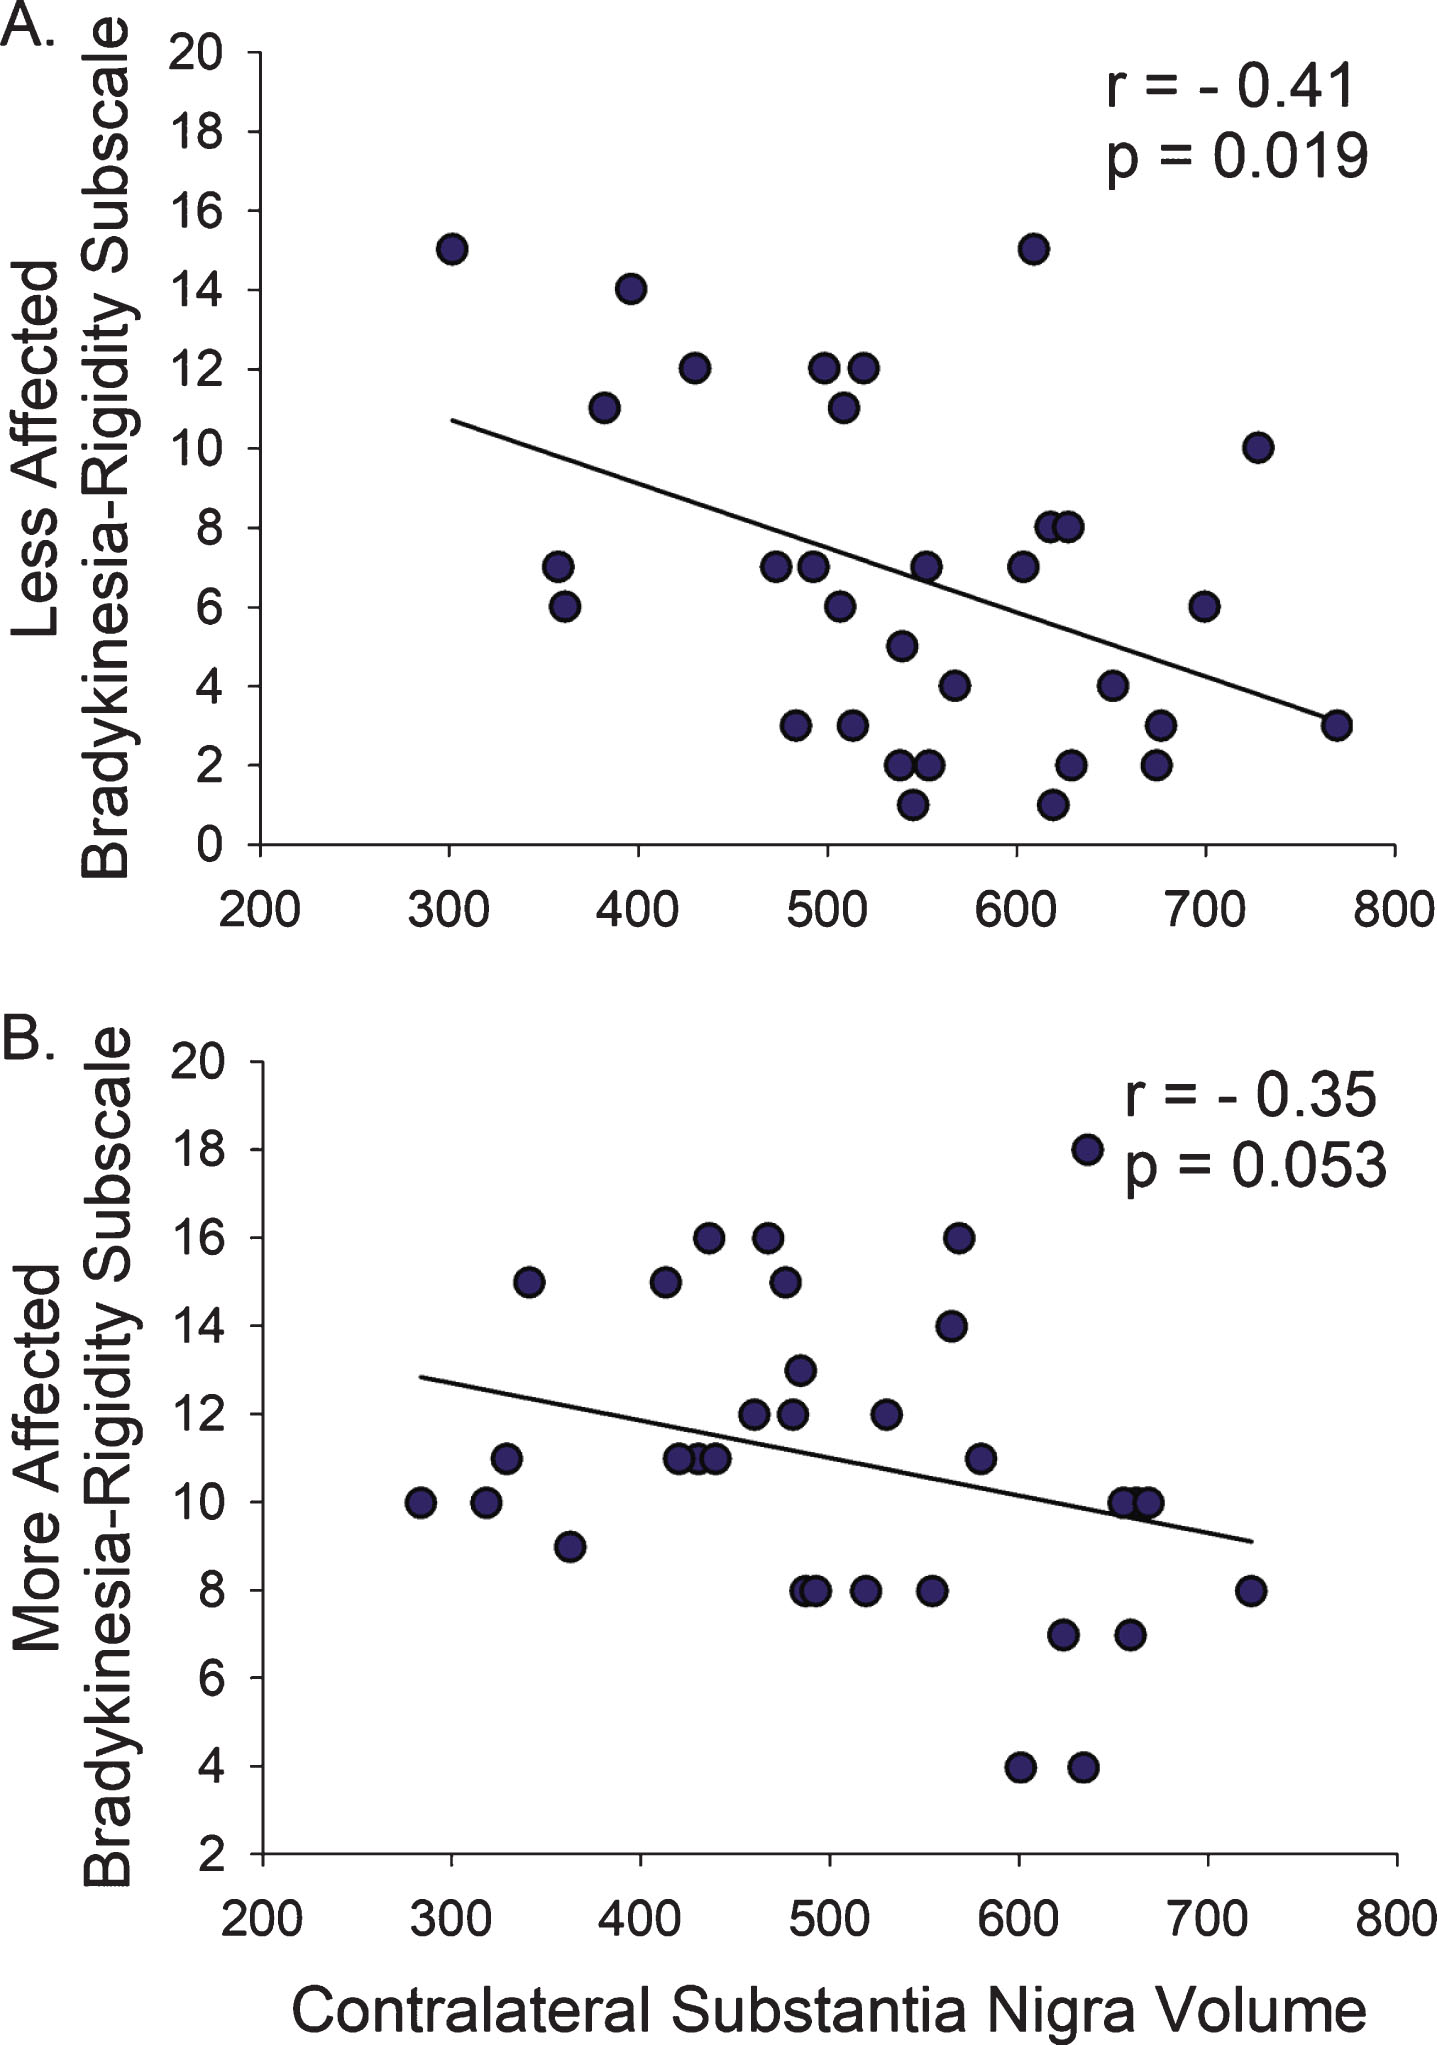
Smaller SN volume contralateral to the Less-Affected hemi-body correlated with higher total MDS-UPDRS-III (r = –0.37, p = 0.038), but the SN contralateral to the More-Affected hemibody did not (p = 0.225). Similarly, smaller SN volumes contralateral to the Less-Affected hemi-body correlated with higher Bradykinesia-Rigidity Subscore (r = –0.41, p = 0.019), but the SN contralateral to the More-Affected hemibody only trended towards significance (r = –0.35, p = 0.053; Fig. 4, Table 2). There were no associations between hemi-body Tremor Subscores and contralateral SN volumes.
Fig.4
Bradykinesia and Rigidity on the Less- and More-Affected Sides. (A) The relationship between Bradykinesia-Rigidity Subscale and SN volume was more pronounced on the Less-Affected side compared to (B) the More-Affected side. r, Spearman’s rho correlation coefficient.
Relationship of QSM and R2* to PD motor severity
Recent studies have reported using the QSM and R2* map as quantitative techniques to detect PD associated midbrain nuclei changes [23, 31, 56]. We found lower SN R2*, higher SN QSM and higher STN QSM each trended toward an association with older age in PD participants (r = 0.33, p = 0.089; r = 0.38, p = 0.054; r = 0.35, p = 0.078, respectively), but neither QSM nor R2* in the SN, STN, or RN was associated with disease duration, total MDS-UPDRS-III, Bradykinesia-Rigidity, Tremor or PIGD Subscores.
Comparison between PD and healthy controls
The 32 PD and 8 healthy controls were matched for age (65.3±7.4 and 64.8±6.9, respectively; p = 0.847) and gender (male:female, 15:17 and 4:4, respectively; p = 0.874). There were no between group differences in SN, STN, or RN volumes. In the healthy control group, smaller SN volume, but not STN volume or RN volume, was significantly associated with older age (r = –0.85, p = 0.007, Supplementary Figure 1).
DISCUSSION
We used ultra-high field 7T MRI to segment individual midbrain nuclei in vivo and determine the differential association between nuclei volumes and severity of specific PD motor manifestations. Our results extend the clinicopathological relationships described postmortem to mild-to-moderate PD patients in vivo. Specifically, our data establish that SN volumes tightly correlate with disease duration and motor severity early in disease, which suggests midbrain MRI quantification using QSM could be an objective biomarker for disease severity in clinical trials. Our data also confirm that the relationship between SN volume and motor severity is specific to bradykinesia and rigidity, but not tremor or PIGD. Further, SN volumes decrease with age in both PD patients and healthy control participants. Therefore, ultra-high field MRI, particularly QSM, of the midbrain nuclei might be useful for studying the effect of aging on PD.
Substantia nigra volume is associated with bradykinesia-rigidity
Lewy body formation in the SN with subsequent loss of dopaminergic neurons is the pathologic hallmark of PD. Meticulous autopsy studies in the 1970s, 80s, and 90s uncovered a differential pattern of SN neuronal cell loss between PD patients who were akinetic-rigid dominant versus tremor dominant [4]. Specifically, these studies showed a negative correlation between SN pars compacta neuronal cell counts, disease duration [1, 2] and the severity of bradykinesia and rigidity, but not tremor [3, 5, 6]. These autopsy studies are further supported by the clinical syndrome manifest by patients with dopamine-receptor blocking drug-induced secondary parkinsonism, which most commonly results in bradykinesia and rigidity, but much less commonly asymmetric rest tremor [57]. Animal studies also support the autopsy finding that nigrostriatal dopaminergic deficiency is the underlying cause for bradykinesia and rigidity, but not tremor. For instance, in monkeys, lesions of the midbrain mainly produce rigidity and only rarely spontaneous sustained tremor [58, 59]. Similarly, MPTP treated macaque monkeys mainly exhibit an akinetic-rigid syndrome [60].
However, autopsy studies have critical limitations because they typically include older patients with more severe motor manifestations and longer disease duration and thus limit a comprehensive study of these relationships in early disease. In Ma et al., the average age was 78±6 years with an average duration of 9.5±4.2 years [1]. The average duration in Bernheimer et al was similarly 9.3±0.9 years, with several patients having over 20 years of symptoms [5]. In these late stages of disease, even patients who present primarily with tremor will typically have since developed pronounced bradykinesia. Furthermore, the few PD patients with short disease duration (less than 5 years) prior to autopsy are usually older patients, who are more likely to present with an akinetic-rigid syndrome [8]. Therefore, thorough assessment of SN neuronal loss in earlier patients with milder disease is only possible with in vivo techniques, such as ultra-high field MRI. We used QSM at 7T to determine SN volume as a proxy for assessing neuronal loss [61–64] and establish that SN volumes are indeed related to milder bradykinesia-rigidity in the first 10 years of disease.
Substantia nigra volume is not associated with tremor or PIGD
The pathophysiology of PD tremor remains unclear. Autopsy studies have also shown that patients with tremor dominant PD have less severe neuronal cell loss in the SN pars compacta, compared to the akinetic-rigid patients [3, 4], and that the severity of neuronal loss is not related to the severity of the tremor [4, 6]. It is generally thought that loss of SN dopaminergic neurons is necessary, but not sufficient, for the development of PD tremor [59, 65]. Indeed, our study is the first to confirm in vivo that in mild to moderate PD grey matter loss within the SN is not associated with tremor severity. This finding has implications for using MRI quantification of midbrain nuclei as a biomarker in PD clinical trials.
We also did not find SN volume to be associated with PIGD severity. This is not surprising given that both dopamine replacement and STN deep brain stimulation generally fail to ameliorate these symptoms sufficiently [66, 67]. While the underlying pathophysiology specific to PIGD is unknown, several mechanisms have been proposed including cholinergic projections from the pedunculopontine nucleus and cortical pathology [68, 69]. Our findings are in line with autopsy studies which show that PIGD patients have similar midbrain pathology as non-PIGD [70]. However, the severity of PIGD in our cohort was limited due to our focus on less severe patients. Using a tremor/PIGD Subscore ratio only nine participants were classified as PIGD dominant, and four were Hoehn and Yahr stage III-IV. Therefore it is possible that midbrain volumes, QSM or R2* quantification could be associated with gait and balance severity in more advanced patients [56].
Volumetrics of more and less affected nuclei
The motor symptoms of PD typically present asymmetrically and continue to progress asymmetrically early in the disease. Few pathological studies have compared the more versus the less affected brain nuclei, because motor symptoms and brain pathology become severe bilaterally later in the disease. Using in vivo imaging in early disease duration patients we were able to confirm that the SN contralateral to the more affected hemi-body is smaller, possibly resulting from more severe atrophy. In addition, our data suggest that nuclei volumes contralateral to the less affected side have a stronger relationship with motor severity. This is consistent with functional imaging studies showing that in the first 6 years of disease the dopamine uptake in the putamen contralateral to the less affected hemi-body has fastest rate of decline [55, 71]. Further, cross-sectional pathological studies show that in the SN pars compacta there is a 50 to 90% loss of dopamine neurons in the first 1 to 4 years after diagnosis with only marginal additional loss thereafter [2]. Our findings suggest that quantification of midbrain nuclei volumes using 7T QSM could detect very early changes in SN volume, which could be applied to people with genetic risks for PD to determine the rate of pre-clinical SN atrophy.
Substantia nigra volume is associated with age
Despite the clear SN volume association with PD duration and severity, we did not find SN volumes to be smaller in PD compared to the healthy adults. Further, in both PD and healthy control participants, smaller SN volume was associated with older age. This suggests SN volume alone is not sufficient to be a diagnostic biomarker for PD and that participant age should always be considered when interpreting MRI-based measures of midbrain structures.
Methodologic considerations
Our study uniquely leveraged QSM to identify the boundaries of individual midbrain nuclei and thus measure the volumes of these iron-containing regions. Specifically, the SN has proven to be a challenging nucleus to delineate due to the border with STN [72, 73]. Ultra-high field 7T MRI has shown excellent T2*-weighted contrasts for depicting deep gray nuclei, due to the superior iron sensitivity at high field [9, 74]. However, T2*-weighted contrasts suffer from blooming artifacts and hence are probematic for volume quantification [39]. These blooming artifacts are particularly severe in the midbrain region wherein iron-containing nuclei are situated in close apposition and adjacent to air-tissue interfaces. A major advantage of QSM is the attenuation of these blooming artifacts through deconvolution [39, 42, 75, 76], which has been very useful in local tissue charaterization of diseases including hemorrhages [77], inflammation of multiple sclerosis lesions [78, 79], and iron within the SN pars compacta in PD [23, 25]. QSM results in high contrast between these iron-rich nuclei and iron-sparse tissue [20, 56]. The combination of 7T MRI and QSM offers superior contrast for midbrain nuclei, which enhanced the accuracy of the segmentation performed in this study.
This study primarily focused on using QSM to determine midbrain nuclei volumes, in contrast to prior PD studies that focused on the utility of QSM and R2* values to aid in differential diagnosis [23, 31, 80–82]. Prior 7T studies have also focused on visual descriptions of nuclei [83], nuclei shape analysis, and nuclei QSM values [31], but were not able to determine the nuclei volumes. Because iron quantity may be variable in SN neurons in PD [11], it is difficult to evaluate the number of surviving neurons using QSM and R2* values directly. By contrast, we leveraged QSM to delineate the boundary between SN and STN, allowing for accurate determination of these midbrain nuclei volumes that are associated with PD progression.
Another consideration of our technique is the use of manual segmentation, which can be prone to human error and bias. To minimize this potential limitation we maintained a blind between the segmentation team, who performed all pre-processing and segmentation of de-identified scans, and the clinical analysis team, who compiled all clinical metrics and statistical analysis. Furthermore, 12 scans were independently segmented by two raters, with high inter-rater agreement. This is consistent with a studies comparing R2* and QSM ultra-high field 7T MRI in PD patients, which found using QSM images resulted in the highest interrater agreement in determining SN volumes [28]. Finally, while multiple statistical tests were performed in this study without explicit correction, our future work will replicate these findings and further delve into etiology and implications.
Future directions
A primary limitation of postmortem studies is the inability to perform longitudinal assessment of regional brain atrophy in individual patients. Conventional MRI studies using cortical volumetric analysis have provided significant insight into longitudinal changes in regional atrophy associated with different subtypes of dementia [84–86]. We have shown that our in vivo technique with ultra-high field MRI can be used for similar studies of midbrain nuclei in PD. In addition, quantification of midbrain atrophy could provide important insight into the development of PD non-motor symptoms. For instance, dopamine neuron loss has been suspected to drive the development of certain cognitive impairments, such as executive dysfunction. Indeed, longitudinal 7T MRI studies of midbrain atrophy could provide significant insight into the clinical correlates of pre-motor and early SN dopamine loss in PD patients.
CONFLICTS OF INTEREST
Dr. Poston has received consulting fees from Allergan and Curasen, and research grants from Sanofi. Dr. Wang has share ownership in Medimagemetric LLC to disclose. Dr. Rutt receives research funding from GE Healthcare. Dr. Kerchner is a full-time employee of F. Hoffman-La Roche, Ltd. Dr. Zeineh receives research funding from GE Healthcare. The other authors have nothing to disclose.
ACKNOWLEDGMENTS
We would like to acknowledge Dr. Jaimie Henderson for his assistance in our initial stages of developing 7T midbrain imaging protocols. We would like to thank Dr. Jong Yoon for his insightful discussions and David Everling for his assistance with the 7T scan acquisition.
This research was supported by grants from the Seiger Family Foundation (KLP), the National Institutes of Health (NS075097-KLP; AG047366-KLP; P41EB015891-BR and MMZ; S10RR026351-BR and MMZ; NS072370, NS090464, NS095562-YW), the Michael J. Fox Foundation for Parkinson’s Research (KLP and GAK), the Center for Biomedical Imaging at Stanford (GAK), the Caltech Summer Undergraduate Research Fellowship program (LFS), and GE Healthcare (BR and MMZ).
SUPPLEMENTARY MATERIAL
[1] The supplementary material is available in the electronic version of this article: https://dx.doi.org/10.3233/JPD-191890.
REFERENCES
[1] | Ma SY , Roytta M , Rinne JO , Collan Y , Rinne UK ((1997) ) Correlation between neuromorphometry in the substantia nigra and clinical features in Parkinson’s disease using disector counts. J Neurol Sci 151: , 83–87. |
[2] | Kordower JH , Olanow CW , Dodiya HB , Chu Y , Beach TG , Adler CH , Halliday GM , Bartus RT ((2013) ) Disease duration and the integrity of the nigrostriatal system in Parkinson’s disease. Brain 136: , 2419–2431. |
[3] | Paulus W , Jellinger K ((1991) ) The neuropathologic basis of different clinical subgroups of Parkinson’s disease. J Neuropathol Exp Neurol 50: , 743–755. |
[4] | Jellinger KA ((1999) ) Post mortem studies in Parkinson’s disease–is it possible to detect brain areas for specific symptoms? J Neural Transm Suppl 56: , 1–29. |
[5] | Bernheimer H , Birkmayer W , Hornykiewicz O , Jellinger K , Seitelberger F ((1973) ) Brain dopamine and the syndromes of Parkinson and Huntington. Clinical, morphological and neurochemical correlations. J Neurol Sci 20: , 415–455. |
[6] | Rinne JO ((1991) ) Nigral degeneration in Parkinson’s disease in relation to clinical features. Acta Neurol Scand Suppl 136: , 87–90. |
[7] | Marjama-Lyons J , Koller W ((2000) ) Tremor-predominant Parkinson’s disease. Approaches to treatment. Drugs Aging 16: , 273–278. |
[8] | Diederich NJ , Moore CG , Leurgans SE , Chmura TA , Goetz CG ((2003) ) Parkinson disease with old-age onset: A comparative study with subjects with middle-age onset. Arch Neurol 60: , 529–533. |
[9] | Cosottini M , Frosini D , Pesaresi I , Costagli M , Biagi L , Ceravolo R , Bonuccelli U , Tosetti M ((2014) ) MR imaging of the substantia nigra at 7 T enables diagnosis of Parkinson disease. Radiology 271: , 831–838. |
[10] | Morris CM , Candy JM , Oakley AE , Bloxham CA , Edwardson JA ((1992) ) Histochemical distribution of non-haem iron in the human brain. Acta Anat (Basel) 144: , 235–257. |
[11] | Oakley AE , Collingwood JF , Dobson J , Love G , Perrott HR , Edwardson JA , Elstner M , Morris CM ((2007) ) Individual dopaminergic neurons show raised iron levels in Parkinson disease. Neurology 68: , 1820–1825. |
[12] | Pohmann R , Speck O , Scheffler K ((2016) ) Signal-to-noise ratio and MR tissue parameters in human brain imaging at 3, 7, and 9.4 tesla using current receive coil arrays. Magn Reson Med 75: , 801–809. |
[13] | Yao B , Li TQ , Gelderen P , Shmueli K , de Zwart JA , Duyn JH ((2009) ) Susceptibility contrast in high field MRI of human brain as a function of tissue iron content. Neuroimage 44: , 1259–1266. |
[14] | Balchandani P , Naidich TP ((2015) ) Ultra-high-field MR neuroimaging. AJNR Am J Neuroradiol 36: , 1204–1215. |
[15] | Abosch A , Yacoub E , Ugurbil K , Harel N ((2010) ) An assessment of current brain targets for deep brain stimulation surgery with susceptibility-weighted imaging at 7 Tesla. Neurosurgery 67: , 1745–1756; discussion 1756. |
[16] | Eapen M , Zald DH , Gatenby JC , Ding Z , Gore JC ((2011) ) Using high-resolution MR imaging at 7T to evaluate the anatomy of the midbrain dopaminergic system. AJNR Am J Neuroradiol 32: , 688–694. |
[17] | Kerl HU , Gerigk L , Pechlivanis I , Al-Zghloul M , Groden C , Nolte IS ((2012) ) The subthalamic nucleus at 7.0 Tesla: Evaluation of sequence and orientation for deep-brain stimulation. Acta Neurochir (Wien) 154: , 2051–2062. |
[18] | Deistung A , Schafer A , Schweser F , Biedermann U , Gullmar D , Trampel R , Turner R , Reichenbach JR ((2013) ) High-resolution MR imaging of the human brainstem in vivo at 7 Tesla. Front Hum Neurosci 7: , 710. |
[19] | Du GW , Lewis MM , Sica C , He L , Connor JR , Kong L , Mailman RB , Huang XM ((2018) ) Distinct progression pattern of susceptibility MRI in the substantia nigra of Parkinson’s patients. Mov Disord 33: , 1423–1431. |
[20] | Liu T , Eskreis-Winkler S , Schweitzer AD , Chen W , Kaplitt MG , Tsiouris AJ , Wang Y ((2013) ) Improved subthalamic nucleus depiction with quantitative susceptibility mapping. Radiology 269: , 216–223. |
[21] | Wang Y , Spincemaille P , Liu Z , Dimov A , Deh K , Li J , Zhang Y , Yao Y , Gillen KM , Wilman AH , Gupta A , Tsiouris AJ , Kovanlikaya I , Chiang GC , Weinsaft JW , Tanenbaum L , Chen W , Zhu W , Chang S , Lou M , Kopell BH , Kaplitt MG , Devos D , Hirai T , Huang X , Korogi Y , Shtilbans A , Jahng GH , Pelletier D , Gauthier SA , Pitt D , Bush AI , Brittenham GM , Prince MR ((2017) ) Clinical quantitative susceptibility mapping (QSM): Biometal imaging and its emerging roles in patient care. J Magn Reson Imaging 46: , 951–971. |
[22] | Plantinga BR , Temel Y , Roebroeck A , Uludag K , Ivanov D , Kuijf ML , Ter Haar Romenij BM ((2014) ) Ultra-high field magnetic resonance imaging of the basal ganglia and related structures. Front Hum Neurosci 8: , 876. |
[23] | Barbosa JH , Santos AC , Tumas V , Liu M , Zheng W , Haacke EM , Salmon CE ((2015) ) Quantifying brain iron deposition in patients with Parkinson’s disease using quantitative susceptibility mapping, R2 and R2. Magn Reson Imaging 33: , 559–565. |
[24] | Murakami Y , Kakeda S , Watanabe K , Ueda I , Ogasawara A , Moriya J , Ide S , Futatsuya K , Sato T , Okada K , Uozumi T , Tsuji S , Liu T , Wang Y , Korogi Y ((2015) ) Usefulness of quantitative susceptibility mapping for the diagnosis of Parkinson disease. AJNR Am J Neuroradiol 36: , 1102–1108. |
[25] | Du G , Liu T , Lewis MM , Kong L , Wang Y , Connor J , Mailman RB , Huang X ((2016) ) Quantitative susceptibility mapping of the midbrain in Parkinson’s disease. Mov Disord 31: , 317–324. |
[26] | He N , Ling H , Ding B , Huang J , Zhang Y , Zhang Z , Liu C , Chen K , Yan F ((2015) ) Region-specific disturbed iron distribution in early idiopathic Parkinson’s disease measured by quantitative susceptibility mapping. Hum Brain Mapp 36: , 4407–4420. |
[27] | Lewis MM , Du GW , Baccon J , Snyder AM , Murie B , Cooper F , Stetter C , Kong L , Sica C , Mailman RB , Connor JR , Huang XM ((2018) ) Susceptibility MRI captures nigral pathology in patients with Parkinsonian syndromes. Mov Disord 33: , 1432–1439. |
[28] | Alkemade A , de Hollander G , Keuken MC , Schäfer A , Ott DVM , Schwarz J , Weise D , Kotz SA , Forstmann BU ((2017) ) Comparison of T2*-weighted and QSM contrasts in Parkinson’s disease to visualize the STN with MRI. PLoS One 12: , e0176130. |
[29] | Deistung A , Schafer A , Schweser F , Biedermann U , Turner R , Reichenbach JR ((2013) ) Toward in vivo histology: A comparison of quantitative susceptibility mapping (QSM) with magnitude-, phase-, and R2*-imaging at ultra-high magnetic field strength. Neuroimage 65: , 299–314. |
[30] | Schafer A , Forstmann BU , Neumann J , Wharton S , Mietke A , Bowtell R , Turner R ((2012) ) Direct visualization of the subthalamic nucleus and its iron distribution using high-resolution susceptibility mapping. Hum Brain Mapp 33: , 2831–2842. |
[31] | Lotfipour AK , Wharton S , Schwarz ST , Gontu V , Schafer A , Peters AM , Bowtell RW , Auer DP , Gowland PA , Bajaj NP ((2012) ) High resolution magnetic susceptibility mapping of the substantia nigra in Parkinson’s disease. J Magn Reson Imaging 35: , 48–55. |
[32] | Lehericy S , Bardinet E , Poupon C , Vidailhet M , Francois C ((2014) ) 7 Tesla magnetic resonance imaging: A closer look at substantia nigra anatomy in Parkinson’s disease. Mov Disord 29: , 1574–1581. |
[33] | Milchenko M , Norris SA , Poston KL , Campbell MC , Ushe M , Perlmutter JS , Snyder AZ ((2018) ) 7T MRI subthalamic nucleus atlas for use with 3T MRI. SPIE 5: , 12. |
[34] | Blazejewska AI , Schwarz ST , Pitiot A , Stephenson MC , Lowe J , Bajaj N , Bowtell RW , Auer DP , Gowland PA ((2013) ) Visualization of nigrosome 1 and its loss in PD: Pathoanatomical correlation and in vivo 7 T MRI. Neurology 81: , 534–540. |
[35] | Cho ZH , Oh SH , Kim JM , Park SY , Kwon DH , Jeong HJ , Kim YB , Chi JG , Park CW , Huston J 3rd , Lee KH , Jeon BS ((2011) ) Direct visualization of Parkinson’s disease by in vivo human brain imaging using 7.0T magnetic resonance imaging. Mov Disord 26: , 713–718. |
[36] | Kim JM , Jeong HJ , Bae YJ , Park SY , Kim E , Kang SY , Oh ES , Kim KJ , Jeon B , Kim SE , Cho ZH , Kim YB ((2016) ) Loss of substantia nigra hyperintensity on 7 Tesla MRI of Parkinson’s disease, multiple system atrophy, and progressive supranuclear palsy. Parkinsonism Relat Disord 26: , 47–54. |
[37] | Cosottini M , Frosini D , Pesaresi I , Donatelli G , Cecchi P , Costagli M , Biagi L , Ceravolo R , Bonuccelli U , Tosetti M ((2015) ) Comparison of 3T and 7T susceptibility-weighted angiography of the substantia nigra in diagnosing Parkinson disease. AJNR Am J Neuroradiol 36: , 461–466. |
[38] | Kwon DH , Kim JM , Oh SH , Jeong HJ , Park SY , Oh ES , Chi JG , Kim YB , Jeon BS , Cho ZH ((2012) ) Seven-Tesla magnetic resonance images of the substantia nigra in Parkinson disease. Ann Neurol 71: , 267–277. |
[39] | Li J , Chang S , Liu T , Wang Q , Cui D , Chen X , Jin M , Wang B , Pei M , Wisnieff C , Spincemaille P , Zhang M , Wang Y ((2012) ) Reducing the object orientation dependence of susceptibility effects in gradient echo MRI through quantitative susceptibility mapping. Magn Reson Med 68: , 1563–1569. |
[40] | de Rochefort L , Liu T , Kressler B , Liu J , Spincemaille P , Lebon V , Wu J , Wang Y ((2010) ) Quantitative susceptibility map reconstruction from MR phase data using bayesian regularization: Validation and application to brain imaging. Magn Reson Med 63: , 194–206. |
[41] | Kressler B , de Rochefort L , Liu T , Spincemaille P , Jiang Q , Wang Y ((2010) ) Nonlinear regularization for per voxel estimation of magnetic susceptibility distributions from MRI field maps. IEEE Trans Med Imaging 29: , 273–281. |
[42] | Wang Y , Liu T ((2015) ) Quantitative susceptibility mapping (QSM) Decoding MRI data for a tissue magnetic biomarker. Magn Reson Med 73: , 82–101. |
[43] | Helmich RC , Vaillancourt DE , Brooks DJ ((2018) ) The future of brain imaging in Parkinson’s disease. J Parkinsons Dis 8: , S47–S51. |
[44] | Ryman SG , Poston KL ((2019) ) MRI biomarkers of motor and non-motor symptoms in Parkinson’s disease. Parkinsonism Relat Disord, doi: 10.1016/j.parkreldis.2019.10.002. |
[45] | Litvan I , Bhatia KP , Burn DJ , Goetz CG , Lang AE , McKeith I , Quinn N , Sethi KD , Shults C , Wenning GK ((2003) ) SIC Task Force appraisal of clinical diagnostic criteria for parkinsonian disorders. Mov Disord 18: , 467–486. |
[46] | Goetz CG , Tilley BC , Shaftman SR , Stebbins GT , Fahn S , Martinez-Martin P , Poewe W , Sampaio C , Stern MB , Dodel R , Dubois B , Holloway R , Jankovic J , Kulisevsky J , Lang AE , Lees A , Leurgans S , LeWitt PA , Nyenhuis D , Olanow CW , Rascol O , Schrag A , Teresi JA , van Hilten JJ , LaPelle N ((2008) ) Movement Disorder Society-sponsored revision of the Unified Parkinson’s Disease Rating Scale (MDS-UPDRS): Scale presentation and clinimetric testing results. Mov Disord 23: , 2129–2170. |
[47] | Poston KL , YorkWilliams S , Zhang K , Cai W , Everling D , Tayim FM , Llanes S , Menon V ((2016) ) Compensatory neural mechanisms in cognitively unimpaired Parkinson disease. Ann Neurol 79: , 448–463. |
[48] | Stebbins GT , Goetz CG , Burn DJ , Jankovic J , Khoo TK , Tilley BC ((2013) ) How to identify tremor dominant and postural instability/gait difficulty groups with the movement disorder society unified Parkinson’s disease rating scale: Comparison with the unified Parkinson’s disease rating scale. Mov Disord 28: , 668–670. |
[49] | Saranathan M , Tourdias T , Kerr AB , Bernstein JD , Kerchner GA , Han MH , Rutt BK ((2014) ) Optimization of magnetization-prepared 3-dimensional fluid attenuated inversion recovery imaging for lesion detection at 7 T. Invest Radiol 49: , 290–298. |
[50] | Roemer PB , Edelstein WA , Hayes CE , Souza SP , Mueller OM ((1990) ) The NMR phased array. Magn Reson Med 16: , 192–225. |
[51] | Yushkevich PA , Piven J , Hazlett HC , Smith RG , Ho S , Gee JC , Gerig G ((2006) ) User-guided 3D active contour segmentation of anatomical structures: Significantly improved efficiency and reliability. Neuroimage 31: , 1116–1128. |
[52] | Liu T , Liu J , de Rochefort L , Spincemaille P , Khalidov I , Ledoux JR , Wang Y ((2011) ) Morphology enabled dipole inversion (MEDI) from a single-angle acquisition: Comparison with COSMOS in human brain imaging. Magn Reson Med 66: , 777–783. |
[53] | Smith SM , Jenkinson M , Woolrich MW , Beckmann CF , Behrens TE , Johansen-Berg H , Bannister PR , De Luca M , Drobnjak I , Flitney DE , Niazy RK , Saunders J , Vickers J , Zhang Y , De Stefano N , Brady JM , Matthews PM ((2004) ) Advances in functional and structural MR image analysis and implementation as FSL. Neuroimage 23 Suppl 1: , S208–219. |
[54] | Tang CC , Poston KL , Dhawan V , Eidelberg D ((2010) ) Abnormalities in metabolic network activity precede the onset of motor symptoms in Parkinson’s disease. J Neurosci 30: , 1049–1056. |
[55] | Filippi L , Manni C , Pierantozzi M , Brusa L , Danieli R , Stanzione P , Schillaci O ((2005) ) 123I-FP-CIT semi-quantitative SPECT detects preclinical bilateral dopaminergic deficit in early Parkinson’s disease with unilateral symptoms. Nucl Med Commun 26: , 421–426. |
[56] | Guan X , Xuan M , Gu Q , Huang P , Liu C , Wang N , Xu X , Luo W , Zhang M ((2017) ) Regionally progressive accumulation of iron in Parkinson’s disease as measured by quantitative susceptibility mapping. NMR Biomed 30: , e3489. |
[57] | Bondon-Guitton E , Perez-Lloret S , Bagheri H , Brefel C , Rascol O , Montastruc JL ((2011) ) Drug-induced parkinsonism: A review of 17 years’ experience in a regional pharmacovigilance center in France. Mov Disord 26: , 2226–2231. |
[58] | Poirier LJ ((1971) ) The development of animal models for studies in Parkinson’s disease. Contemp Neurol Ser 8: , 83–117. |
[59] | Zaidel A , Arkadir D , Israel Z , Bergman H ((2009) ) Akineto-rigid vs. tremor syndromes in Parkinsonism. Curr Opin Neurol 22: , 387–393. |
[60] | Rivlin-Etzion M , Elias S , Heimer G , Bergman H ((2010) ) Computational physiology of the basal ganglia in Parkinson’s disease. Prog Brain Res 183: , 259–273. |
[61] | Yablonskiy DA , Luo J , Sukstanskii AL , Iyer A , Cross AH ((2012) ) Biophysical mechanisms of MRI signal frequency contrast in multiple sclerosis. Proc Natl Acad Sci U S A 109: , 14212–14217. |
[62] | Yablonskiy DA , Sukstanskii AL ((2017) ) Effects of biological tissue structural anisotropy and anisotropy of magnetic susceptibility on the gradient echo MRI signal phase: Theoretical background. NMR Biomed 30: , e3655. |
[63] | Bian W , Kerr AB , Tranvinh E , Parivash S , Zahneisen B , Han MH , Lock CB , Goubran M , Zhu K , Rutt BK , Zeineh MM ((2019) ) MR susceptibility contrast imaging using a 2D simultaneous multi-slice gradient-echo sequence at 7T. PLoS One 14: , e0219705. |
[64] | Schweser F , Deistung A , Reichenbach JR ((2016) ) Foundations of MRI phase imaging and processing for Quantitative Susceptibility Mapping (QSM). Z Med Phys 26: , 6–34. |
[65] | Fishman PS ((2008) ) Paradoxical aspects of parkinsonian tremor. Mov Disord 23: , 168–173. |
[66] | St George RJ , Nutt JG , Burchiel KJ , Horak FB ((2010) ) A meta-regression of the long-term effects of deep brain stimulation on balance and gait in PD. Neurology 75: , 1292–1299. |
[67] | Vu TC , Nutt JG , Holford NH ((2012) ) Progression of motor and nonmotor features of Parkinson’s disease and their response to treatment. Br J Clin Pharmacol 74: , 267–283. |
[68] | Wen P , Li M , Xiao H , Ding R , Chen H , Chang J , Zhou M , Yang Y , Wang J , Zheng W , Zhang W ((2015) ) Low-frequency stimulation of the pedunculopontine nucleus affects gait and the neurotransmitter level in the ventrolateral thalamic nucleus in 6-OHDA Parkinsonian rats. Neurosci Lett 600: , 62–68. |
[69] | Lau B , Welter ML , Belaid H , Fernandez Vidal S , Bardinet E , Grabli D , Karachi C ((2015) ) The integrative role of the pedunculopontine nucleus in human gait. Brain 138: , 1284–1296. |
[70] | Selikhova M , Williams DR , Kempster PA , Holton JL , Revesz T , Lees AJ ((2009) ) A clinico-pathological study of subtypes in Parkinson’s disease. Brain 132: , 2947–2957. |
[71] | Marek K , Innis R , van Dyck C , Fussell B , Early M , Eberly S , Oakes D , Seibyl J ((2001) ) [123I]beta-CIT SPECT imaging assessment of the rate of Parkinson’s disease progression. Neurology 57: , 2089–2094. |
[72] | Oikawa H , Sasaki M , Tamakawa Y , Ehara S , Tohyama K ((2002) ) The substantia nigra in Parkinson disease: Proton density-weighted spin-echo and fast short inversion time inversion-recovery MR findings. AJNR Am J Neuroradiol 23: , 1747–1756. |
[73] | Peran P , Cherubini A , Assogna F , Piras F , Quattrocchi C , Peppe A , Celsis P , Rascol O , Demonet JF , Stefani A , Pierantozzi M , Pontieri FE , Caltagirone C , Spalletta G , Sabatini U ((2010) ) Magnetic resonance imaging markers of Parkinson’s disease nigrostriatal signature. Brain 133: , 3423–3433. |
[74] | Cho ZH , Min HK , Oh SH , Han JY , Park CW , Chi JG , Kim YB , Paek SH , Lozano AM , Lee KH ((2010) ) Direct visualization of deep brain stimulation targets in Parkinson disease with the use of 7-tesla magnetic resonance imaging. J Neurosurg 113: , 639–647. |
[75] | Liu J , Liu T , de Rochefort L , Ledoux J , Khalidov I , Chen W , Tsiouris AJ , Wisnieff C , Spincemaille P , Prince MR ((2012) ) Morphology enabled dipole inversion for quantitative susceptibility mapping using structural consistency between the magnitude image and the susceptibility map. Neuroimage 59: , 2560–2568. |
[76] | Liu T , Wisnieff C , Lou M , Chen W , Spincemaille P , Wang Y ((2013) ) Nonlinear formulation of the magnetic field to source relationship for robust quantitative susceptibility mapping. Magn Reson Med 69: , 467–476. |
[77] | Chen W , Zhu W , Kovanlikaya I , Kovanlikaya A , Liu T , Wang S , Salustri C , Wang Y ((2014) ) Intracranial calcifications and hemorrhages: Characterization with quantitative susceptibility mapping. Radiology 270: , 496–505. |
[78] | Chen W , Gauthier SA , Gupta A , Comunale J , Liu T , Wang S , Pei M , Pitt D , Wang Y ((2014) ) Quantitative susceptibility mapping of multiple sclerosis lesions at various ages. Radiology 271: , 183–192. |
[79] | Wisnieff C , Ramanan S , Olesik J , Gauthier S , Wang Y , Pitt D ((2015) ) Quantitative susceptibility mapping (QSM) of white matter multiple sclerosis lesions: Interpreting positive susceptibility and the presence of iron. Magn Reson Med 74: , 564–570. |
[80] | Sjostrom H , Granberg T , Westman E , Svenningsson P ((2017) ) Quantitative susceptibility mapping differentiates between parkinsonian disorders. Parkinsonism Relat Disord 44: , 51–57. |
[81] | Takahashi H , Watanabe Y , Tanaka H , Mihara M , Mochizuki H , Takahashi K , Yamamoto K , Liu T , Wang Y , Tomiyama N ((2018) ) Comprehensive MRI quantification of the substantia nigra pars compacta in Parkinson’s disease. Eur J Radiol 109: , 48–56. |
[82] | Li G , Zhai G , Zhao X , An H , Spincemaille P , Gillen KM , Ku Y , Wang Y , Huang D , Li J ((2018) ) 3D texture analyses within the substantia nigra of Parkinson’s disease patients on quantitative susceptibility maps and R2(*) maps. Neuroimage 188: , 465–472. |
[83] | Schwarz ST , Afzal M , Morgan PS , Bajaj N , Gowland PA , Auer DP ((2014) ) The ‘swallow tail’ appearance of the healthy nigrosome - a new accurate test of Parkinson’s disease: A case-control and retrospective cross-sectional MRI study at 3T. PLoS One 9: , e93814. |
[84] | Kumfor F , Landin-Romero R , Devenney E , Hutchings R , Grasso R , Hodges JR , Piguet O ((2016) ) On the right side? A longitudinal study of left- versus right-lateralized semantic dementia. Brain 139: , 986–998. |
[85] | Su L , Blamire AM , Watson R , He J , Aribisala B , O’Brien JT ((2016) ) Cortical and subcortical changes in Alzheimer’s disease: A longitudinal and quantitative MRI study. Curr Alzheimer Res 13: , 534–544. |
[86] | Whitwell JL , Shiung MM , Przybelski SA , Weigand SD , Knopman DS , Boeve BF , Petersen RC , Jack CR Jr ((2008) ) MRI patterns of atrophy associated with progression to AD in amnestic mild cognitive impairment. Neurology 70: , 512–520. |


