
Neurophysiological Biomarkers of Parkinson’s Disease
Abstract
Background:
There is a need for reliable and robust Parkinson’s disease biomarkers that reflect severity and are sensitive to disease modifying investigational therapeutics.
Objective:
To demonstrate the utility of EEG as a reliable, quantitative biomarker with potential as a pharmacodynamic endpoint for use in clinical assessments of neuroprotective therapeutics for Parkison’s disease.
Methods:
A multi modal study was performed including aquisition of resting state EEG data and dopamine transporter PET imaging from Parkinson’s disease patients off medication and compared against age-matched controls.
Results:
Qualitative and test/retest analysis of the EEG data demonstrated the reliability of the methods. Source localization using low resolution brain electromagnetic tomography identified significant differences in Parkinson’s patients versus control subjects in the anterior cingulate and temporal lobe, areas with established association to Parkinson’s disease pathology. Changes in cortico-cortical and cortico-thalamic coupling were observed as excessive EEG beta coherence in Parkinson’s disease patients, and correlated with UPDRS scores and dopamine transporter activity, supporting the potential for cortical EEG coherence to serve as a reliable measure of disease severity. Using machine learning approaches, an EEG discriminant function analysis classifier was identified that parallels the loss of dopamine synapses as measured by dopamine transporter PET.
Conclusion:
Our results support the utility of EEG in characterizing alterations in neurophysiological oscillatory activity associated with Parkinson’s disease and highlight potential as a reliable method for monitoring disease progression and as a pharmacodynamic endpoint for Parkinson’s disease modification therapy.
INTRODUCTION
Parkinson’s disease (PD) is the second most prevalent neurodegenerative disease in the United States, and varies widely in phenotype, clinical course, and efficacy of various treatments [1]. The accuracy of clinical examinations is limited, particularly with early stages of PD [2]. This restricts the application of potential neuroprotective disease-modifying treatments early in the disorder when they may have the greatest chance of success. The evaluation of novel therapies for PD and Parkinson’s disease dementia (PDD) would be more efficient if sensitive and precise biomarkers could be identified for early diagnoses and response assessment of early disease progression.
The primary PD neuropathology seen at autopsy is that of alpha-synuclein aggregates, which promote the loss of dopaminergic and other neurons [3]. However, unlike beta-amyloid or tau aggregates, the non-invasive measurement of brain alpha-synuclein aggregate pathology is currently not possible with PET imaging. Although nigro-striatal dopaminergic synaptic endings can be quantified via SPECT and PET imaging [4], these techniques are not ideal for widespread and repeated application due to limited access, high expense, and cumulative annual radiation dose. Volumetric and neuromelanin MRI techniques to quantify substantia nigra (SN) cell loss are emerging but are not yet validated or economically accessible on a large scale [5, 6].
Nigro-striatal circuits are known to regulate thalamo-cortical activity, which underlies the behavior of cortical electrical rhythms. EEG may therefore potentially serve as a convenient, inexpensive, non-invasive and widely accessible physiological biomarker for detecting early PD pathology. Cortical electroencephalography (EEG) has been proposed to distinguish among PD sub-types [7], track PD progression [8], and allow evaluation of treatment responses to symptomatic pharmacological treatment as well as deep brain stimulation (DBS) [8]. EEG-based biomarkers may allow longitudinal tracking of underlying PD pathophysiology [8] and have recently been shown to correlate with post mortem levels of phosphorylated a-synuclein, but not with other pathological lesions such as aggregated forms of tau or beta-amyloid [9].
Synchronization and functional connectivity within and between cortical regions is instrumental in motor organization and is impacted by nigro-striatal-thalamic circuits [10]. EEG recorded at the scalp can assess the synchronization of oscillatory frequencies from within and between cortical regions, revealing network changes that reflect abnormal connectivity. EEG coherence and phase synchrony are common mathematical methods for quantifying functional connectivity between brain regions. Functional connectivity indicates that two or more regions assessed by coherence have similar signal content and therefore are most likely connected [11]. Notably, PD patients exhibit higher levels of EEG beta (13–30 Hz) coherence than healthy control subjects (HCs) and Alzheimer’s disease patients, recorded both at the scalp surface and the basal ganglia [12]. Excessive beta coherence and correlation with clinical observations is believed to reflect the impairment of dopaminergic tone [8]. Importantly, both DBS and L-Dopa have been shown to significantly reduce excessive EEG beta coherence in PD, and this effect is directly linked to clinical improvements as measured by UPDRS scores [8].
PD patients with implants that allow concurrent recording from the thalamus and scalp exhibit excessively high thalamocortical coherence at 7 Hz (theta), suggesting tight anatomical and functional connectivity between the thalamus and the cortex [13]. Such excessively high regional beta and theta coherences have not been observed in Alzheimer’s or other dementias. Thus, unique EEG biomarker signatures may exist that faithfully reflect neuropathology specific to PD.
The primary aim of the present study was to explore quantitative EEG metrics of a well-characterized population of PD patients in comparison to age-matched HCs and to correlate EEG biomarkers with other modalities. This report focuses on the EEG analyses and several comparisons of the EEG results with those obtained from clinical assessments and dopamine transporter (DAT) imaging using [11C]PE2I to assess the density of striatal dopaminergic nerve terminals. For comparison with DAT PET, we chose two metrics, coherence and a machine learning based classifier.
MATERIALS AND METHODS
Participants
Participants were recruited at the Weill Cornell Parkinson’s Disease and Movement Disorders Institute. All procedures were approved by the institutional review board (IRB) of Weill Cornell Medical College. All participants provided written informed consent. The study prespecified the accrual of 20 patients and 20 controls who would complete all of the imaging procedures. EEG was the first visit after the clinical and laboratory screening. Attrition at later stages of the study required recruitment of more than 20 subjects in each group. The sample size reported represents all participants who had analyzable EEG. Key inclusion criteria for both the control group and PD patients were ages 40 to 90 years old and no history of significant neurological disease such as epilepsy, traumatic brain injury, or other disorder expected to affect EEG recordings. For PD, the study design included a multi-stage screening process based on the following criteria [14]: disease onset at 30 years old or later, Hoehn and Yahr stage 1–3 and stable anti-Parkinsonian medications. The second stage, MRI, was required to prove that no other macroscopic disease or insult could account for the movement disorder in the patient group or confound the results in the control group. Specifically, potential participants were excluded if they had any signs of vascular disease, including microvascular disease in any brain region. The final stage of screening was a dopamine transporter (DAT) positron emission tomography (PET) scan using [11C]PE2I as DAT ligand [15, 16]. Potential participants in the patient group were required to have asymmetric reduced striatal DAT binding typical of PD and HCs were required to show normal levels and patterns of DAT. None of the patients enrolled showed signs of dementia. A total of 21 patients with PD and 25 HCs were included in the study (Table 1). No tremors of the head were observed, and patients showed no signs of drowsiness or sleepiness during the EEG procedures.
Table 1
Participant Data
| Group | Modality | N | Agea | % Female | Hoehn and Yahra | Total UPDRSa |
| PD | EEG | 21 | 62.7±7.32 | 33 | 2.07±0.39 | 31.00±10.37 |
| DAT PET | 18 | 63±10 | 28 | |||
| HC | EEG | 25 | 54.6±10.5 | 36 | N/A | 0.83±1.27 |
| DAT PET | 24 | 55±10 | 37 |
aMean±SD.
Clinical characterization
All subjects underwent a standard medical examination. In addition, all were evaluated at the time of screening visit using the Unified Parkinson’s Disease Rating Scale (UPDRS) by a movement disorders neurologist [17]. For participants with PD, this rating was performed on their baseline medication in order to accommodate patients by reducing the number of study visits off medication, and therefore to maximize tolerance for completion of the multi-visit study protocol. The Hoehn and Yahr staging scale [17] was also performed.
Study procedures
EEG data were acquired with all patients after all anti-Parkinsonian medications had been withheld for at least 12 hours. The B-Alert® X24 wireless EEG system by Advanced Brain Monitoring (Carlsbad, CA) was used for all EEG data acquisition. The channel montage is in accordance with the international 10–20 system. The B-Alert X24 collects data at a sampling rate of 256 Hz, with a common mode rejection ratio of 105 dB.
All tests were conducted at the Citigroup Biomedical Imaging Center. Resting state EEG was acquired in a quiet, windowless room and participants were instructed to remain awake and relaxed, while seated upright facing a laptop computer. The acquisitions were administered in the following protocol: 5 minutes eyes closed, removal of the EEG system, application of a second B-Alert X24 system, and a repeat of eyes closed resting state acquisition for test/retest analysis.
EEG analysis methods
Test/Retest reliability
Intra-class correlation coefficients (ICC) were computed to assess test-retest reliability of EEG data across the first and second EEG acquisitions as previously described [18].
Coherence
The coherence analysis was performed using the magnitude-square coherence (mscohere function in MATLAB) which uses Welch’s overlapped averaged periodogram method (we used 2-s windows with 50% overlap). The coherence value of signals x and y, Cxy(f), is defined as a function of the spectral densities of signal x, Pxx(f), and y, Pyy(f), and the cross spectral density of x and y, Pxy(f):
Classification with discriminant function analysis (DFA)
The variables extracted from the EEG data—absolute and relative 1–40 Hz power spectral density (PSD) and wavelet coefficients—were grouped together into a feature vector comprising 3060 variables. The most discriminative variables were selected by utilizing the step-wise discriminant analysis procedure in the SPSS software package (IBM, Armonk, NY). The selected variables were utilized to build the classifier that discriminated between the PD patients and HCs using linear discriminant function analysis (lDFA) [20].
sLORETA
NeuroGuide software platform (Applied Neuroscience, Largo, FL) was used to localize the cortical sources of the EEG activity using standardized low resolution electromagnetic tomography (sLORETA) analysis. Comprehensive individual sLORETA reports were constructed for each of the PD subjects and controls, and group comparisons were run to examine differences between the PD cohort and the HCs.
DAT imaging and analysis
The radioligand, Carbon-11 ([11C]) labeled PE2I (N-(3-iodoprop-2E-enyl)-2β-carbomethoxy-3β-(4-methyl-phenyl)nortropane) [15, 16, 21] ([11C]-PE2I) was used to assess the state of striatal dopaminergic innervations and prepared as previously described [22]. The dose averaged 381.1±59.6 MBq (10.3±1.6 mCi). All [11C]PE2I DAT PET measures were corrected for motion and moved to an unbiased reference template generated by using one MR image from each participant. A modified version of the Automatic Anatomical Labeling atlas consisting of a more finely parcellated striatal region was applied. BPND [19] were estimated at the voxel and region levels using the Logan reference graphical method [23]. BPND was computed for all striatal sub-regions in the striatum atlas using the cerebellum as the reference region and with t* = 40 minutes. The striatal atlas divided each of the left and right striatum into the following regions: anterior caudate, posterior caudate, anterior putamen, posterior putamen, and nucleus accumbens. The two-sample t-test, with Benjamini-Hochberg multiple comparisons correction, was used to compare PD and HC cohorts statistically.
RESULTS
Test/retest reliability
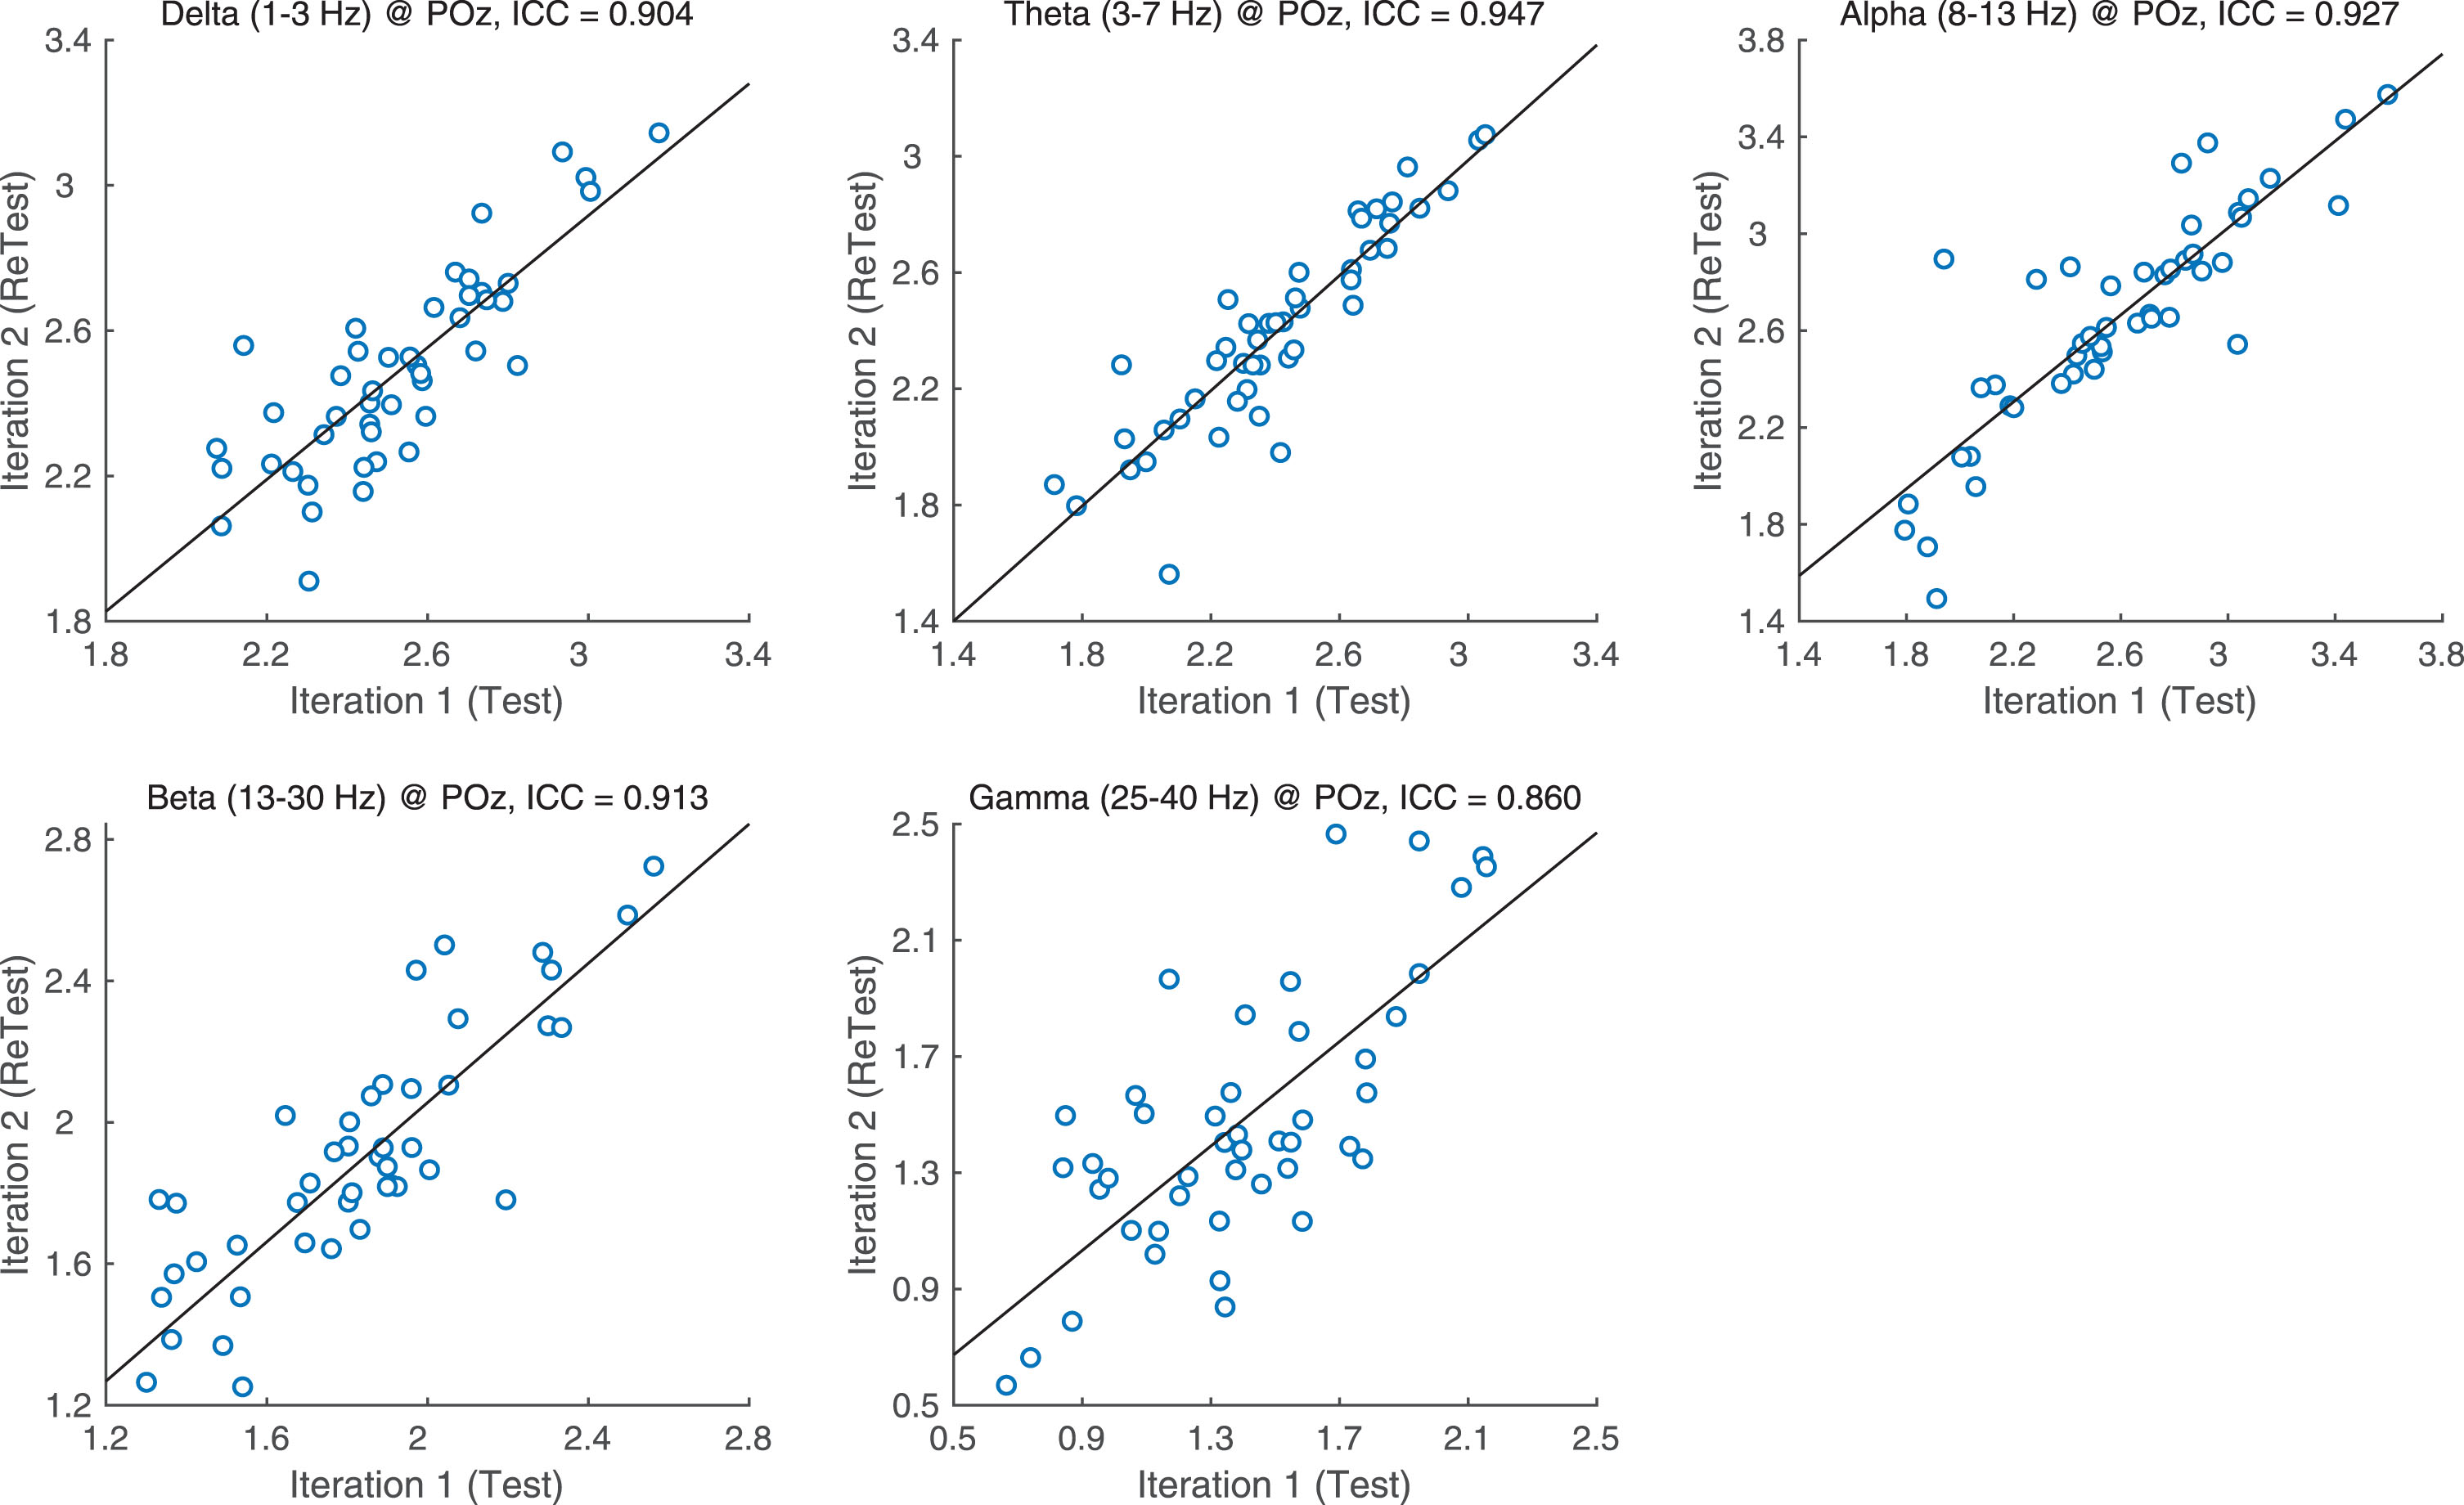
ICCs for each PSD band and region were assessed for test-retest reliability (Fig. 1) ICC values indicate high reliability with delta, theta, alpha and beta band ICCs all higher than 0.9. Gamma was only slightly lower at ICC = 0.861.
Fig.1
ICC values per band.
EEG coherence
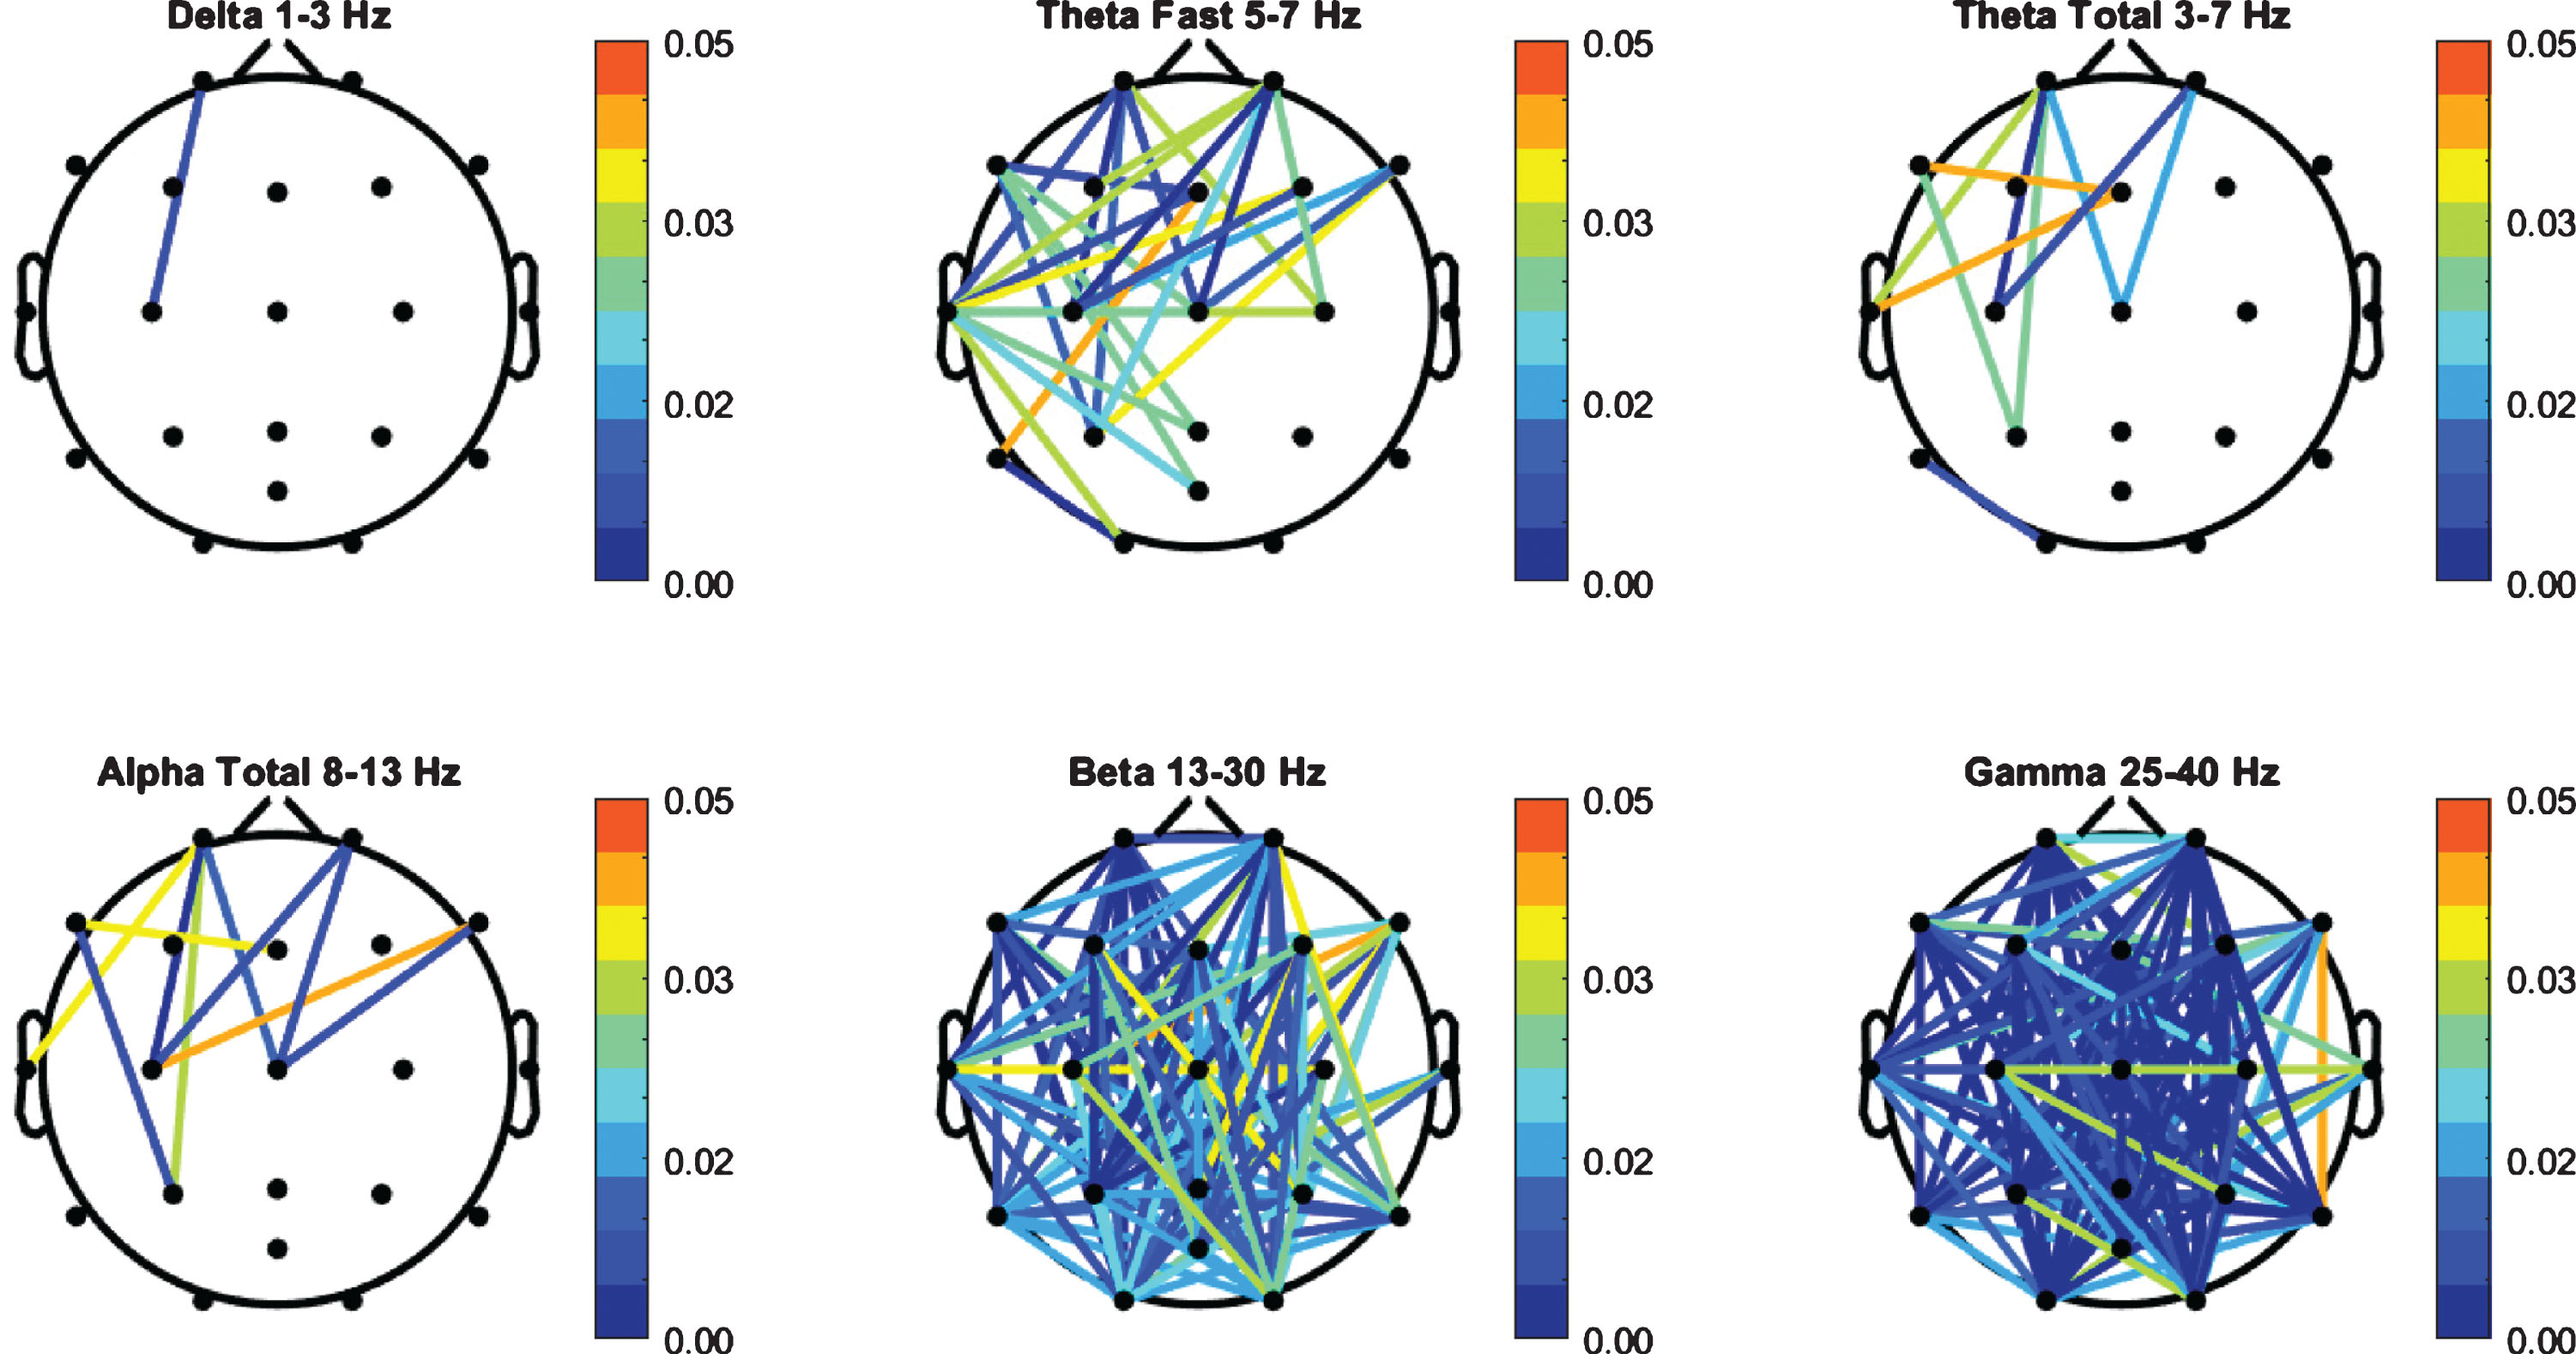
Coherence values for the PD cohort were compared to the HC group and independent t-test was performed (Fig. 2). The PD group exhibited a significant increase in beta and gamma bands. A total of 106 channel pairs out of 141 in beta, and 124 pairs out of 141 in gamma showed significant difference (p < 0.05) between the HC group and the PD patients. There were 29 significant channel pairs in fast theta between PD and HC and all other bands had 10 significant pairs or less.
Fig.2
FFT Coherence group independent t-test (p-values) between PD and HC cohorts.
Discriminate function analysis results
Nine variables were selected to build the classifier that best discriminated between the PD patients and HCs. Selected variables were primarily in theta, beta and gamma bands and included left and central frontal regions in theta and beta, bilateral temporal regions in theta, alpha and gamma, central and right occiptal regions in beta and gamma and a central channel in theta. The developed DFA classifies each epoch (i.e., second) of EEG data as normal or PD. Participants with more than half of epochs classified as PD were assigned to the Parkinson’s disease class. Only two (one HC and one PD) of the 42 total subjects included in the analysis were misclassified when compared with the gold standard of clinical diagnosis, resulting in a 95.65% specificity, 94.74% sensitivity, 94.74% positive predictive value, 95.65% negative predictive value, and an overall accuracy of 95.24%.
[11C]PE2I DAT PET results
[11C]PE2I DAT PET was administered to a subset of subjects (Table 1). Test-retest reliability of BPND values produced ICC estimates of 0.905±0.054. BPND estimates between HC and PD groups were statistically significant, after correction, in all striatal sub-regions (Table 2) with the most statistically significant differences observed in the anterior and posterior putamen (p < 1E–10). In several regions, selection of the appropriate threshold on BPND resulted in perfect group classification (100% sensitivity, 100% specificity).
Table 2
Mean, standard deviation, and statistical comparison of binding potential values in striatal regions
| Region | HCa | PDa | Adjusted p-value |
| Anterior Putamen R | 4.37±1.16 | 1.86±0.22 | 7.07E-12 |
| Anterior Putamen L | 4.53±1.16 | 1.84±0.27 | 1.33E-10 |
| Posterior Putamen R | 3.84±1.08 | 2.95±0.68 | 1.28E-10 |
| Posterior Putamen L | 4.31±1.09 | 3.12±0.77 | 2.97E-11 |
| Anterior Caudate R | 4.29±0.95 | 2.92±0.60 | 6.90E-04 |
| Anterior Caudate L | 4.39±0.76 | 2.86±0.77 | 9.55E-04 |
| Posterior Caudate R | 5.10±0.90 | 2.58±0.56 | 6.65E-06 |
| Posterior Caudate L | 4.91±0.95 | 2.55±0.70 | 2.47E-07 |
aMean±SD.
EEG coherence and PD classifier correlations with [11C]PE2I DAT PET
To explore relationships between the PD classifier and [11C]PE2I DAT PET, the percent of epochs classified as PD was compared with the BPND in striatal sub-regions. The percent of epochs classified as PD correlated with all striatal sub-regions (Table 3) with the most statistically significant differences observed in the left posterior putamen (p = 2.97E-11, r =–0.829).
Table 3
Correlations between EEG metrics and BPND in striatal sub-regions. EEG metrics include the percent of epochs classified as PD and the number of significant pairs of channels with p < 0.01, r > 0.4
| % of epochs | # significant pairs of coherence channels p < 0.01, r > 0.4 | |||
| Region | p-value | r | beta | gamma |
| Anterior Putamen R | 2.68E-09 | –0.787 | 49 | 93 |
| Anterior Putamen L | 4.82E-09 | –0.779 | 72 | 102 |
| Posterior Putamen R | 5.11E-10 | –0.807 | 46 | 91 |
| Posterior Putamen L | 2.97E-11 | –0.829 | 71 | 105 |
| Anterior Caudate R | 8.03E-07 | –0.698 | 90 | 110 |
| Anterior Caudate L | 1.74E-06 | –0.697 | 48 | 79 |
| Posterior Caudate R | 2.98E-07 | –0.724 | 79 | 105 |
| Posterior Caudate L | 1.86E-07 | –0.715 | 57 | 100 |
| Nucleus Accumbens R | 1.35E-07 | –0.729 | 83 | 104 |
| Nucleus Accumbens L | 1.59E-07 | –0.727 | 75 | 102 |
Table 4
Correlations between EEG metrics and clinical measures. EEG metrics include the percent of epochs classified as PD and the number of significant coherence pairs of channels with p < 0.01, r > 0.4
| Clinical measure | % of epochs | # significant pairs of channels p < 0.01, r > 0.4 | ||
| p-value | r | beta | gamma | |
| HYStage | 6.36E-13 | 0.854 | 46 | 80 |
| UPDRS Part II (ADL) | 4.145E-10 | 0.792 | 49 | 77 |
| UPDRS total | 1.097E-08 | 0.755 | 86 | 107 |
| UPDRS Part III (Motor) | 4.217E-06 | 0.650 | 30 | 58 |
| UPDRS Part IV (complications of therapy) | 0.000762 | 0.499 | – | – |
HY, Hoehn and Yahr; ADL, activities of daily living.
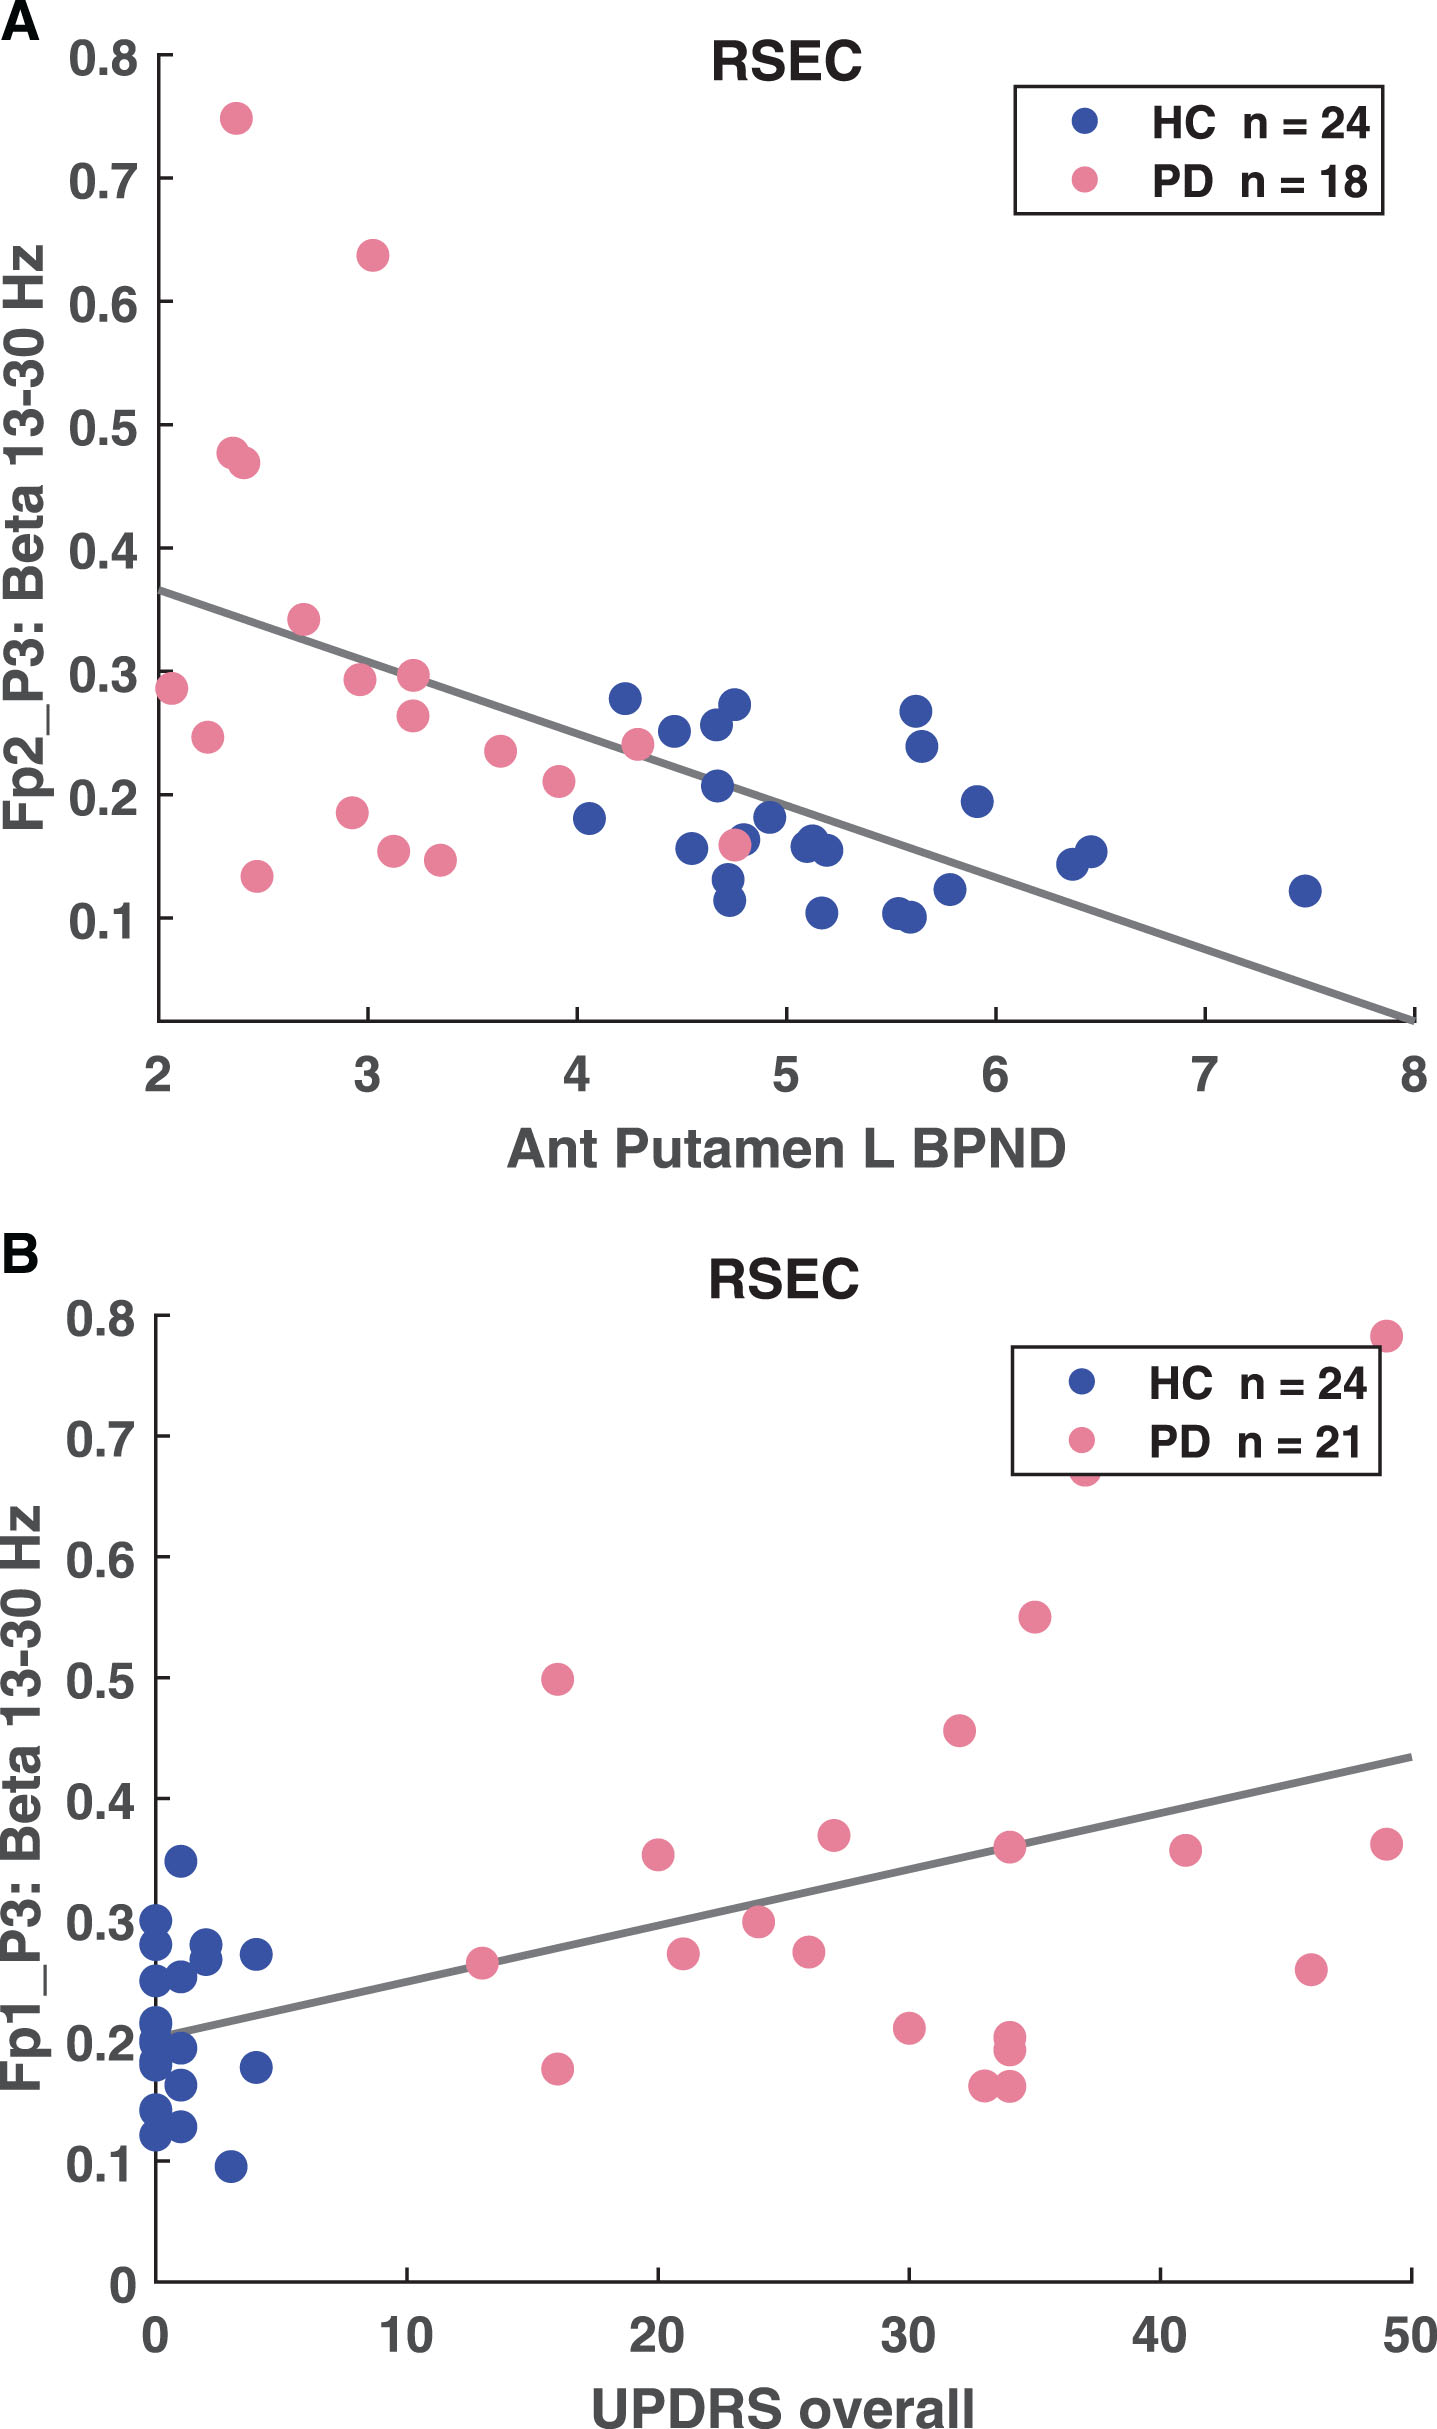
The beta coherence variables were also correlated with BPND in all striatal sub-regions. The total number of possible pairs of long-range channels, indicative of functional connectivity between brain regions, is 141. Pairs of long-range channels that were enhanced in the PD cohort compared to HC correlated with BPND in all striatal sub-regions with criteria of p < 0.01, r > 0.4. The number of pairs that were significantly correlated ranges from 46 pairs (right posterior putamen) to 90 pairs (right anterior caudate) in the beta band and from 79 pairs (left anterior caudate) to 110 pairs (right anterior caudate) in gamma. For example, the BPND in the left posterior putamen was correlated with Fp2-P3 coherence (Fig. 3A, p = 1.53E–04, r =–0.552).
Fig.3
A) Correlation between anterior putamen left BPND and FP2-P3 high beta coherence (p = 1.53E–.04, r =–0.552). B) Correlation between UPDRS overall and FP2-P3 high beta coherence (p = 6.96E–05, r = 0.557).
EEG coherence and PD classifier correlations with clinical measures
The percent of epochs classified as PD was compared with all clinical measures – Hoehn and Yahr staging, and UPDRS including total; Part II: activities of daily living (ADL); Part III: motor examination; and Part IV: complications of therapy. The percent of epochs classified as PD correlated with all clinical measures (Table 3) with the most statistically significant correlations observed in Hoehn and Yahr stage (p = 6.36036E–13, r = 0.854). The beta and gamma coherence also correlated with all clinical measures except UPDRS Part IV. The highest number of pairs correlated with total UPDRS score, with 86 beta and 107 gamma correlated coherence pairs. For example, total UPDRS score was correlated with Fp1-P3 coherence (p = 6.96E–.05, r = 0.557)
sLORETA analysis
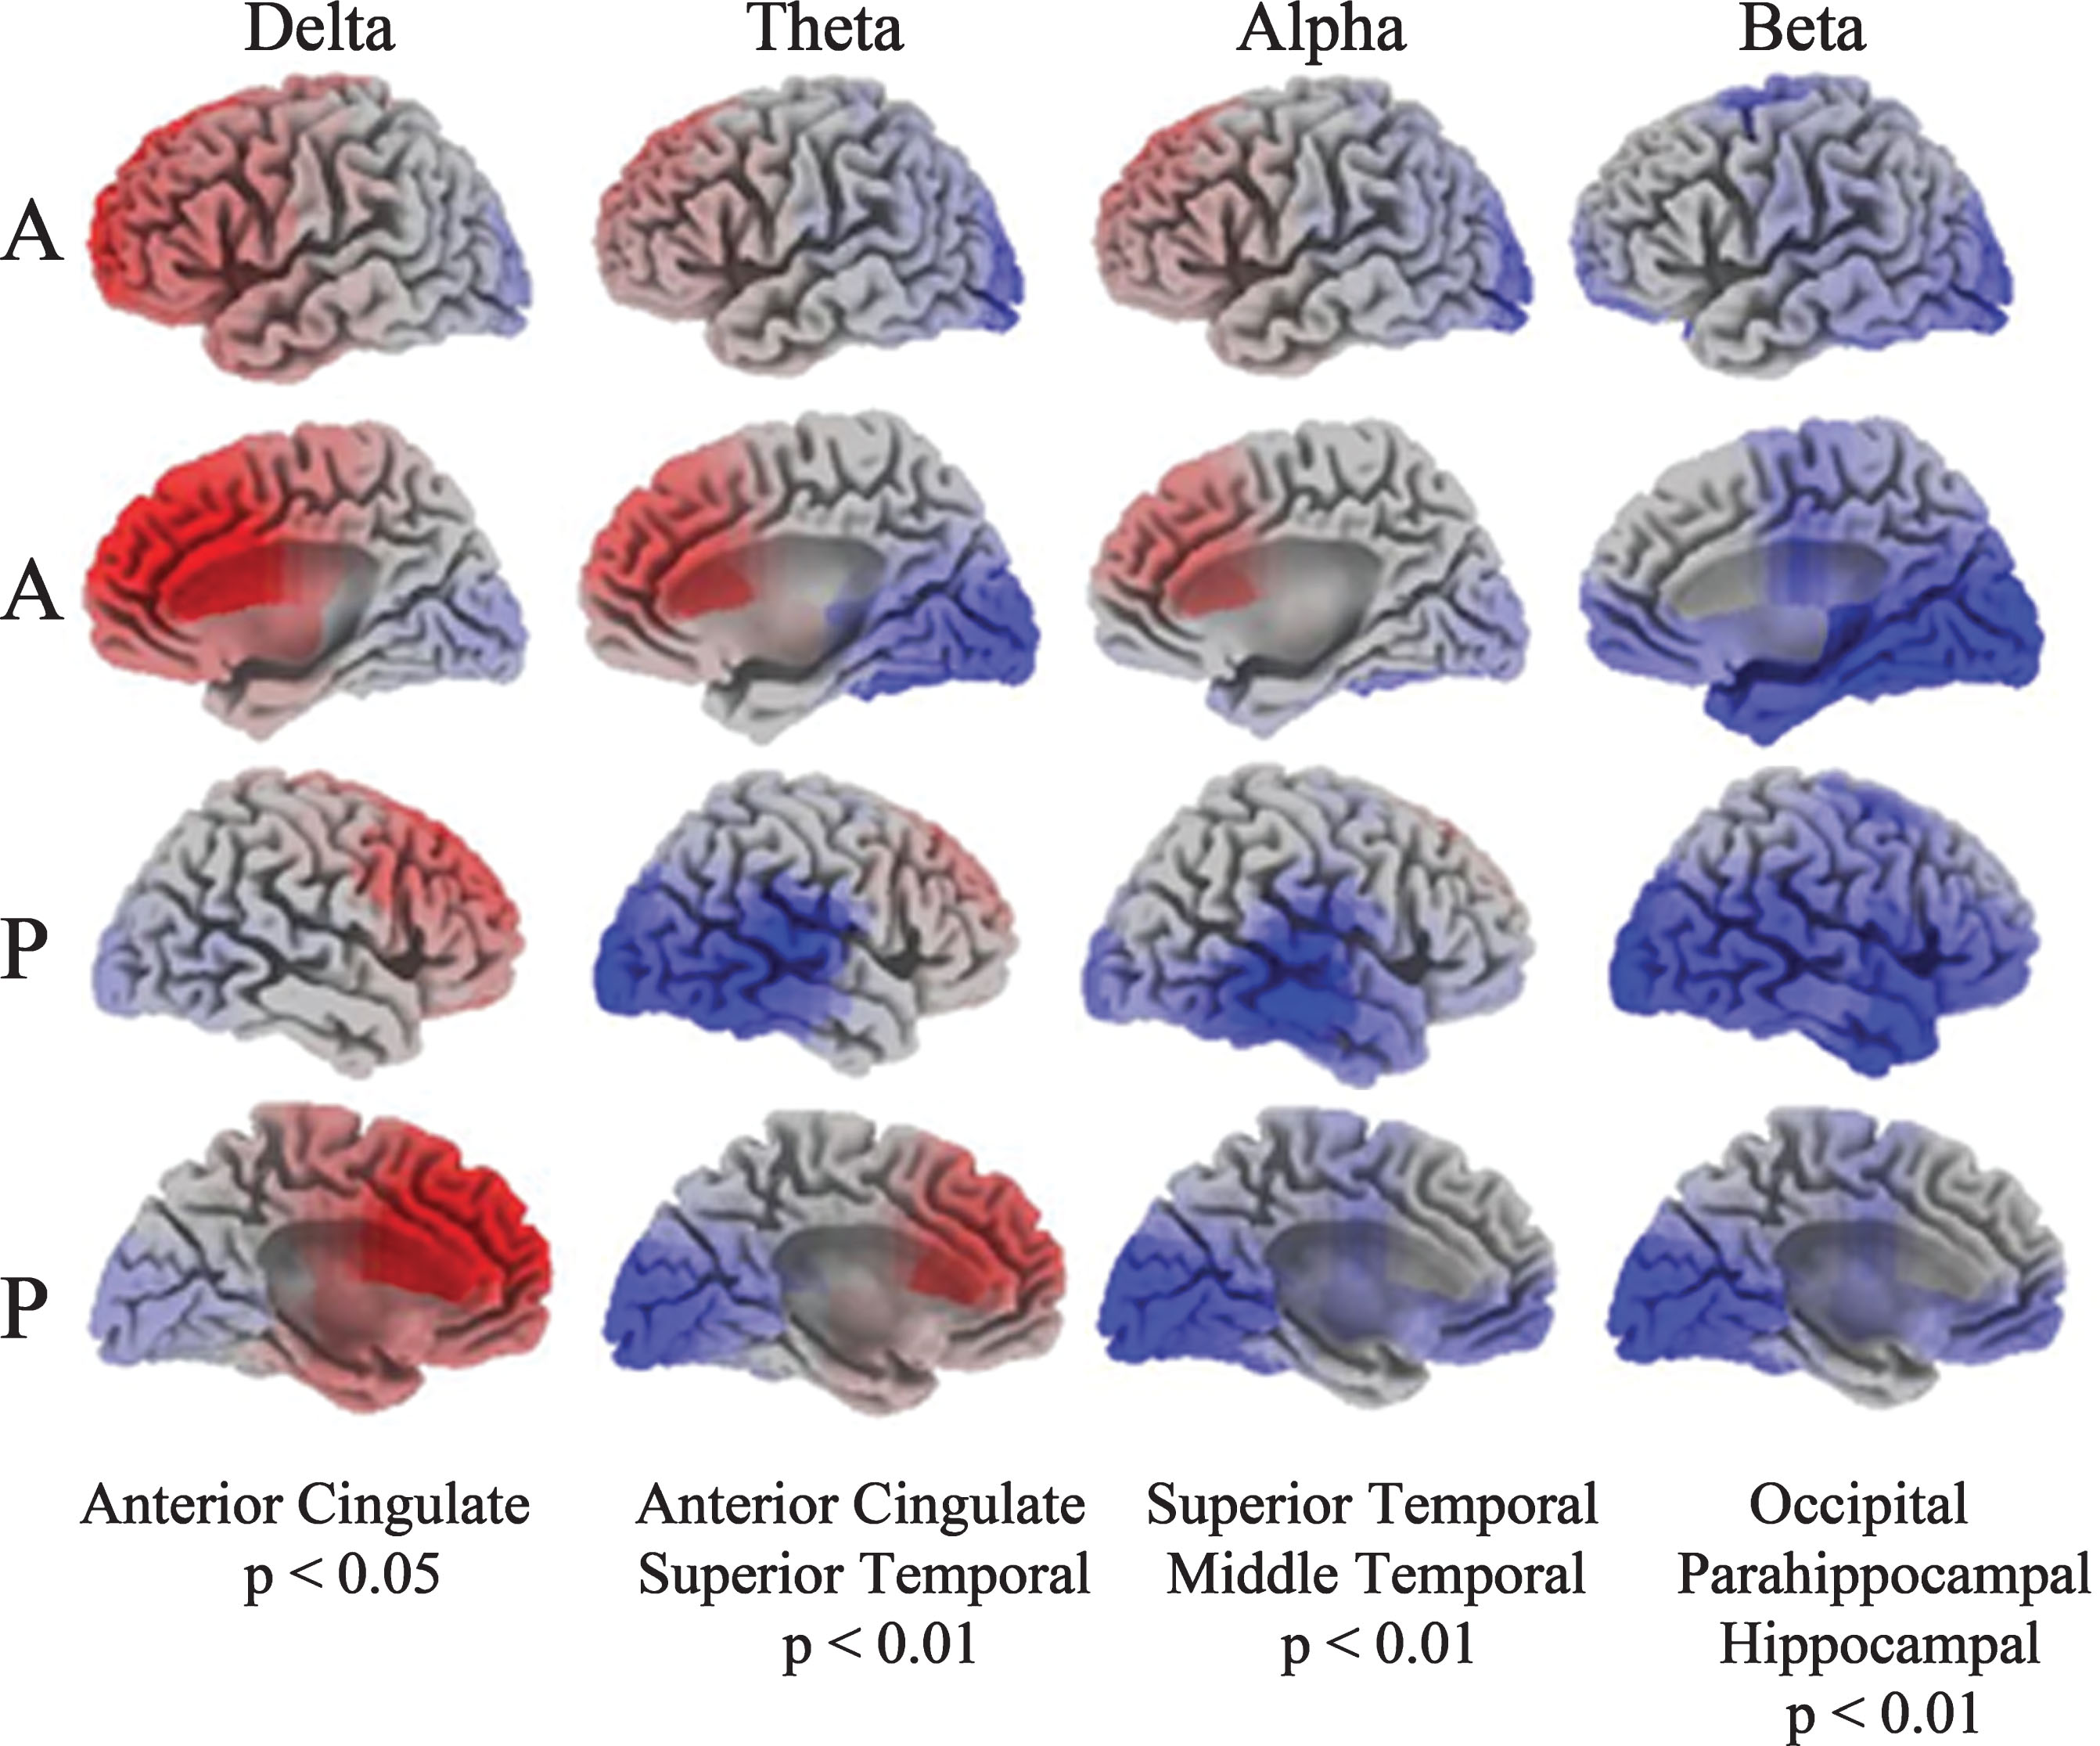
PD patients exhibit significant increased activity (red shading) in the anterior cingulate in delta and decreased activity (blue shading) in the temporal lobe in theta and alpha compared to the HC group (Fig. 4). The most significant deviations are the anterior cingulate, showing increased activity in delta, and in the superior/middle temporal gyrus representing decreased activity in alpha. Reduced beta activity among the PD patients was localized to the parahippocampal gyrus and the hippocampus.
Fig.4
Current density images in Talairach space obtained by sLORETA in PD versus HC cohorts (A: anterior, P: posterior). EEG activity differences are denoted by red (increased activity) or blue (decreased activity).
DISCUSSION
EEG analytics reliably characterized alterations in neurophysiological oscillatory activity associated with PD, and specific changes in the cortico-cortical and cortico-thalamic coupling were observable in the surface EEG recording during resting state. Abnormally high levels of beta (13–30 Hz) and gamma (25–40 Hz) frequency synchronization were observed across multiple cortico-cortical regions in the PD patients. The high levels of beta and gamma coherence were significantly positively correlated with UPDRS scores and [11C]PE2I DAT PET, confirming that excessive high coherence is associated with higher disease severity and underlying pathophysiology [8]. To our knowledge, this is the first report of correlations of increased beta coherence with impaired dopaminergic tone. Given that both dopaminergic tone as measured by DAT levels [24] and other reported EEG abnormalities [9] have been suggested to reflect pathological alpha-synuclein levels in the SN and other brain regions, these unique EEG signatures have the potential to be linked to the fundamental neuropathology of PD. DBS and L-Dopa have demonstrated the ability to reduce the excessive EEG beta coherence, an effect which can be related to clinical improvements, as measured by reduction in UPDRS scores [8]. The patterns and test-retest results suggest that these unique phenotypic biomarkers, beta and gamma coherence, are sensitive and reliable. Moreover, the reported reversal of these abnormalities with treatment supports the use of EEG coherence measures as potential markers of treatment efficacy, which could be extended to disease-modifying therapies.
The application of DFA and other machine learning classifiers using selected EEG features as inputs is useful in identifying specific EEG feature sets that best discriminate between populations and characterize the effects of various interventions. The overall accuracy of the DFA in discriminating the PD and control groups in this study is compelling. Only two of the 42 total subjects (one HC and one PD) included in the analysis were misclassified, resulting in 95.24% specificity and 94.74% sensitivity. The classifier utilized only 14 EEG-based features to achieve this classification, and the model was stable under cross-validation. The percent of epochs classified as PD was significantly negatively correlated with DAT PET, confirming that the DFA is associated with disease severity.
Patients with PD exhibited significantly increased sources of slow activity in the anterior cingulate, cingulate gyrus, and medial frontal gyrus in the eyes closed task as assessed by LORETA. The anterior cingulate is a critically important component of the neural network controlling attention, orienting, and vigilance [25]. Additionally, alterations in dopamine metabolism within the anterior cingulate have been linked with cognitive decline in PD [26]. Attention deficits are often detected in the early stages of PD, and have been suggested as a component of the fluctuations in cognition that are one of the hallmarks of PD [27–29]. Excessive slow EEG sources in the cingulate and medial frontal region may be associated with attention deficits and cognitive decline in PD, however substantial evidence has more recently highlighted the role of the cingulate in multiple symptoms, not just global measures of cognition. Changes in the cingulate cortex include reduced cortical thickness [30], altered regional cerebral blood flow associated with cognition impairment [31], reduced fractional anisotropy [32] and reduced dopamine-2 receptor binding in both cognitively intact and impaired PD populations [33]. An association was revealed between increased phosphorylation of alpha-synuclein and the abnormal EEG signatures of cognitive decline (delta and alpha) as well as beta bands in the cingulate cortex, further suggesting that EEG may provide an in vivo approximation of underlying Parkinson’s pathology [9]. A close association has been established between phosphorylation and aggregation of alpha-synuclein into oligomers, a PD pathology that plays a key role in neuronal toxicity. Extensive diffuse deposition of alpha-synuclein oligomers are significantly more abundant in the cingulate cortex in patients compared to controls (1.6-fold increase) [34]. There is also evidence at the genetic level that the cingulate cortex is an important region in PD. Perez-Rodriguez et al. [35] found somatic copy number variant gains (gene duplicates or triplicates) of SNCA, the gene encoding alpha-synuclein, in the cingulate cortex. These post-zygotic mutations were >2% higher in neurons in the cingulate cortex of patients diagnosed with alpha-synucleinopathies than healthy controls. Taken together the data suggest the cingulate cortex is a key region of alpha- synucleinopathy neuropathology and EEG holds promise as a sensitive measure of resulting functional changes.
In summary, our results support the utility of EEG in characterizing alterations in neurophysiological oscillatory activity associated with PD in comparison to age-matched HCs. Several EEG metrics identified in the PD cohort are supported by prior research in other groups examining distinct cohorts, supporting the notion that reliable EEG-based biomarkers can be easily acquired from PD patients off medication. Specific changes in the cortico-cortical and cortico-thalamic coupling were observable in the surface EEG recording during resting state and are associated with the loss of dopaminergic neurons in PD. These metrics have been shown previously to be resolved in a predictable manner when patients were successfully treated with either L-Dopa or DBS. Moreover, using machine learning approaches, we have identified an EEG DFA classifier that parallels the loss of dopamine synapses as seen by DAT PET and could potentially be used as a more pragmatic pharmacodynamic biomarker for disease modification therapy in PD.
CONFLICT OF INTEREST
The authors have no conflicts of interest relevant to this article to declare.
ACKNOWLEDGMENT
This work was supported by Biogen.
REFERENCES
[1] | Kowal SL , Dall TM , Chakrabarti R , Storm MV , Jain A ((2013) ) The current and projected economic burden of Parkinson’s disease in the United States. Mov Disord 28: , 311–318. |
[2] | Adler CH , Beach TG , Hentz JG , Shill HA , Caviness JN , Driver-Dunckley E , Sabbagh MN , Sue LI , Jacobson SA , Belden CM ((2014) ) Low clinical diagnostic accuracy of early vs advanced Parkinson disease Clinicopathologic study. Neurology 83: , 406–412. |
[3] | Gratwicke J , Jahanshahi M , Foltynie T ((2015) ) Parkinson’s disease dementia: A neural networks perspective. Brain 138(Pt 6): , 1454–1476. |
[4] | Brücke T , Djamshidian S , Bencsits G , Pirker W , Asenbaum S , Podreka I ((2000) ) SPECT and PET imaging of the dopaminergic system in Parkinson’s disease.IV2-IV. J Neurol 247: , 7. |
[5] | Fabbri M , Reimao S , Carvalho M , Nunes RG , Abreu D , Guedes LC , Bouca R , Lobo PP , Godinho C , Coelho M , Goncalves NC , Rosa MM , Antonini A , Ferreira JJ ((2017) ) Substantia nigra neuromelanin as an imaging biomarker of disease progression in Parkinson’s disease. J Parkinsons Dis 7: , 491–501. |
[6] | Filoteo JV , Reed JD , Litvan I , Harrington DL ((2014) ) Volumetric correlates of cognitive functioning in nondemented patients with Parkinson’s disease. Mov Disord 29: , 360–367. |
[7] | Babiloni C , De Pandis MF , Vecchio F , Buffo P , Sorpresi F , Frisoni GB , Rossini PM ((2011) ) Cortical sources of resting state electroencephalographic rhythms in Parkinson’s disease related dementia and Alzheimer’s disease. Clin Neurophysiol 122: , 2355–2364. |
[8] | Silberstein P , Pogosyan A , Kuhn AA , Hotton G , Tisch S , Kupsch A , Dowsey-Limousin P , Hariz MI , Brown P ((2005) ) Cortico-cortical coupling in Parkinson’s disease and its modulation by therapy. Brain 128: , 1277–1291. |
[9] | Caviness JN , Lue LF , Hentz JG , Schmitz CT , Adler CH , Shill HA , Sabbagh MN , Beach TG , Walker DG ((2016) ) Cortical phosphorylated alpha-Synuclein levels correlate with brain wave spectra in Parkinson’s disease. Mov Disord 31: , 1012–1019. |
[10] | Pfurtscheller G , Pichler-Zalaudek K , Ortmayr B , Diez J , Reisecker F ((1998) ) Postmovement beta synchronization in patients with Parkinson’s disease. J Clin Neurophysiol 15: , 243–250. |
[11] | Bowyer SM ((2016) ) Coherence a measure of the brain networks: Past and present. Neuropsychiatr Electrophysiol 2: , 1. |
[12] | Fonseca LC , Tedrus GM , Carvas PN , Machado EC ((2013) ) Comparison of quantitative EEG between patients with Alzheimer’s disease and those with Parkinson’s disease dementia. Clin Neurophysiol 124: , 1970–1974. |
[13] | Sarnthein J , Jeanmonod D ((2007) ) High thalamocortical theta coherence in patients with Parkinson’s disease. J Neurosci 27: , 124–131. |
[14] | Hughes AJ , Daniel SE , Kilford L , Lees AJ ((1992) ) Accuracy of clinical diagnosis of idiopathic Parkinson’s disease: A clinico-pathological study of 100 cases. J Neurol Neurosurg Psychiatry 55: , 181–184. |
[15] | Hall H , Halldin C , Guilloteau D , Chalon S , Emond P , Besnard J , Farde L , Sedvall G ((1999) ) Visualization of the dopamine transporter in the human brain postmortem with the new selective ligand [125I]PE2I. Neuroimage 9: , 108–116. |
[16] | Halldin C , Erixon-Lindroth N , Pauli S , Chou YH , Okubo Y , Karlsson P , Lundkvist C , Olsson H , Guilloteau D , Emond P , Farde L ((2003) ) [(11)C]PE2I: A highly selective radioligand for PET examination of the dopamine transporter in monkey and human brain. Eur J Nucl Med Mol Imaging 30: , 1220–1230. |
[17] | Goetz CG , Poewe W , Rascol O , Sampaio C , Stebbins GT , Counsell C , Giladi N , Holloway RG , Moore CG , Wenning GK ((2004) ) Movement Disorder Society Task Force report on the Hoehn and Yahr staging scale: Status and recommendations the Movement Disorder Society Task Force on rating scales for Parkinson’s disease. Mov Disord 19: , 1020–1028. |
[18] | McGraw KOW , SP ((1996) ) Forming inferences about some intraclass correlation coefficients. Psychol Methods 1: , 30–46. |
[19] | Innis RB , Cunningham VJ , Delforge J , Fujita M , Gjedde A , Gunn RN , Holden J , Houle S , Huang SC , Ichise M , Iida H , Ito H , Kimura Y , Koeppe RA , Knudsen GM , Knuuti J , Lammertsma AA , Laruelle M , Logan J , Maguire RP , Mintun MA , Morris ED , Parsey R , Price JC , Slifstein M , Sossi V , Suhara T , Votaw JR , Wong DF , Carson RE ((2007) ) Consensus nomenclature for in vivo imaging of reversibly binding radioligands. J Cereb Blood Flow Metab 27: , 1533–1539. |
[20] | Berka C , Levendowski DJ , Lumicao MN , Yau A , Davis G , Zivkovic VT , Olmstead RE , Tremoulet PD , Craven PL ((2007) ) EEG correlates of task engagement and mental workload in vigilance, learning, and memory tasks. Aviat Space Environ Med 78: , B231–244. |
[21] | Maoz A , Hicks MJ , Vallabhjosula S , Synan M , Kothari PJ , Dyke JP , Ballon DJ , Kaminsky SM , De BP , Rosenberg JB , Martinez D , Koob GF , Janda KD , Crystal RG ((2013) ) Adenovirus capsid-based anti-cocaine vaccine prevents cocaine from binding to the nonhuman primate CNS dopamine transporter. Neuropsychopharmacology 38: , 2170–2178. |
[22] | Ito H , Takahashi H , Arakawa R , Takano H , Suhara T ((2008) ) Normal database of dopaminergic neurotransmission system in human brain measured by positron emission tomography. Neuroimage 39: , 555–565. |
[23] | Logan J , Fowler JS , Volkow ND , Wang GJ , Ding YS , Alexoff DL ((1996) ) Distribution volume ratios without blood sampling from graphical analysis of PET data. J Cereb Blood Flow Metab 16: , 834–840. |
[24] | Kovacs GG , Milenkovic IJ , Preusser M , Budka H ((2008) ) Nigral burden of alpha-synuclein correlates with striatal dopamine deficit. Mov Disord 23: , 1608–1612. |
[25] | Huang C , Wahlund L-O , Svensson L , Winblad B , Julin P ((2002) ) Cingulate cortex hypoperfusion predicts Alzheimer’s disease in mild cognitive impairment. BMC Neurol 2: , 1. |
[26] | Gallagher CL , Bell B , Palotti M , Oh J , Christian BT , Okonkwo O , Sojkova J , Buyan-Dent L , Nickles RJ , Harding SJ ((2015) ) Anterior cingulate dopamine turnover and behavior change in Parkinson’s disease. Brain Imaging Behav 9: , 821–827. |
[27] | Poliakoff E , O’Boyle DJ , Moore AP , McGlone FP , Cody FW , Spence C ((2003) ) Orienting of attention and Parkinson’s disease: Tactile inhibition of return and response inhibition. Brain 126: , 2081–2092. |
[28] | Aarsland D , Bronnick K , Ehrt U , De Deyn PP , Tekin S , Emre M , Cummings JL ((2007) ) Neuropsychiatric symptoms in patients with Parkinson’s disease and dementia: Frequency, profile and associated care giver stress. J Neurol Neurosurg Psychiatry 78: , 36–42. |
[29] | Bronnick K , Ehrt U , Emre M , De Deyn PP , Wesnes K , Tekin S , Aarsland D ((2006) ) Attentional deficits affect activities of daily living in dementia-associated with Parkinson’s disease. J Neurol Neurosurg Psychiatry 77: , 1136–1142. |
[30] | Hwang KS , Beyer MK , Green AE , Chung C , Thompson PM , Janvin C , Larsen JP , Aarsland D , Apostolova LG ((2013) ) Mapping cortical atrophy in Parkinson’s disease patients with dementia. J Parkinsons Dis 3: , 69–76. |
[31] | Wakamori T , Agari T , Yasuhara T , Kameda M , Kondo A , Shinko A , Sasada S , Sasaki T , Furuta T , Date I ((2014) ) Cognitive functions in Parkinson’s disease: Relation to disease severity and hallucination. Parkinsonism Relat Disord 20: , 415–420. |
[32] | Almuqbel M , Melzer TR , Myall DJ , MacAskill MR , Pitcher TL , Livingston L , Wood K-L , Keenan RJ , Dalrymple-Alford JC , Anderson TJ ((2016) ) Metabolite ratios in the posterior cingulate cortex do not track cognitive decline in Parkinson’s disease in a clinical setting. Parkinsonism Relat Disord 22: , 54–61. |
[33] | Christopher L , Duff-Canning S , Koshimori Y , Segura B , Boileau I , Chen R , Lang AE , Houle S , Rusjan P , Strafella AP ((2015) ) Salience network and parahippocampal dopamine dysfunction in memory-impaired Parkinson disease. Ann Neurol 77: , 269–280. |
[34] | Roberts RF , Wade-Martins R , Alegre-Abarrategui J ((2015) ) Direct visualization of alpha-synuclein oligomers reveals previously undetected pathology in Parkinson’s disease brain. Brain 138: , 1642–1657. |
[35] | Perez-Rodriguez D , Kalyva M , Leija-Salazar M , Lashley T , Tarabichi M , Chelban V , Gentleman S , Schottlaender L , Franklin H , Vasmatzis G , Houlden H , Schapira AHV , Warner TT , Holton JL , Jaunmuktane Z , Proukakis C ((2019) ) Investigation of somatic CNVs in brains of synucleinopathy cases using targeted SNCA analysis and single cell sequencing. Acta Neuropathol Commun 7: , 219. |


