
Comparison of an Online-Only Parkinson’s Disease Research Cohort to Cohorts Assessed In Person
Abstract
Background:
Online tools for data collection could be of value in patient-oriented research. The Fox Insight (FI) study collects data online from individuals with self-reported Parkinson’s disease (PD). Comparing the FI cohort to other cohorts assessed through more traditional (in-person) observational research studies would inform the representativeness and utility of FI data.
Objective:
To compare self-reported demographic characteristics, symptoms, medical history, and PD medication use of the FI PD cohort to other recent observational research study cohorts assessed with in-person visits.
Methods:
The FI PD cohort (n = 12,654) was compared to 3 other cohorts, selected based on data accessibility and breadth of assessments: Parkinson’s Progression Markers Initiative (PPMI; PD n = 422), Parkinson’s Disease Biomarker Program (PDBP; n = 700), and PD participants in the LRRK2 consortium without LRRK2 mutations (n = 508). Demographics, motor and non-motor assessments, and medications were compared across cohorts. Where available, identical items on surveys and assessments were compared; otherwise, expert opinion was used to determine comparable definitions for a given variable.
Results:
The proportion of females was significantly higher in FI (45.56%) compared to PPMI (34.36%) and PDBP (35.71%). The FI cohort had greater educational attainment as compared to all other cohorts. Overall, prevalence of difficulties with motor experiences of daily living and non-motor symptoms in the FI cohort was similar to other cohorts, with only a few significant differences that were generally small in magnitude. Missing data were rare for the FI cohort, except on a few variables.
Discussion:
Patterns of responses to patient-reported assessments obtained online on the PD cohort of the FI study were similar to PD cohorts assessed in-person.
INTRODUCTION
Fewer than two-thirds of individuals with Parkinson’s disease (PD) in the USA have seen a neurologist [1]. Although study groups and multicenter research networks allow for the study of large numbers of PD patients at academic medical centers [2, 3], it is nonetheless estimated that only a small proportion of the PD population are represented in PD research. Thus, online tools that collect data from large numbers of PD patients, many of whom may not have access to research centers, could be of great value in self-reported patient-oriented research on PD.
While advances in technology, and availability and use of the internet and mobile devices make large online-only PD research cohorts feasible [4], several factors are essential to consider regarding the utility of the data obtained on such “digital cohorts”. First, determining the accuracy of patient-reported diagnosis is critical. Among non-neurologic populations, diagnostic accuracy of self-reported diabetes was high as confirmed by patients’ primary care providers [5]. Data on the accuracy of self-reported PD diagnosis are limited, and range from good agreement in a clinical trials population [6] to poor agreement in a study comparing self-reported medical history and history in the electronic medical record [7]. Second, the validity of unsupervised online-completion of scales that have been validated for in-person assessment should also be evaluated.
Data from the Patients Like Me (PLM) website provide an illustrative example in regard to these considerations. PLM is a for-profit website that collects data from a large number of individuals with self-reported medical conditions [8]. While initially designed with the purpose of creating a network for amyotrophic lateral sclerosis patients, it has evolved into a research tool; PLM data have been shown to have utility in the validation and administration of online surveys for multiple sclerosis (MS) [9] and may be useful to detect adverse events [10]. However, among their group with self-identified MS, there were small but significant differences in several patient and disease characteristics compared to a clinic-based in-person evaluated cohort at a tertiary care center [11]. The PLM group had younger age, greater education, were less likely to be male and white. They had a younger age at symptom onset, shorter disease duration, and were more likely to have relapsing-remitting disease. The PLM website also collects data from PD patients [12]. Data from 6,074 patients with self-reported PD on the PLM website were compared to data from the Parkinson’s Disease Data Organizing Center (PD-DOC) dataset which is a compilation of data from several clinical trials conducted in the USA from 2006–2011. The PLM group were younger than the PD-DOC group and reported increased symptom severity in the medication OFF state [12]. While informative, the published PD PLM dataset is not specifically designed as a research study and collects data on only a subset of non-motor symptoms as assessed by only a few items on the Unified Parkinson’s Disease Rating Scale [13].
The Fox Insight (FI) study has recruited an online longitudinal cohort of individuals with self-reported PD, providing demographic and health-related information through the online platform foxinsight.org [4]. One of its main goals is to obtain comprehensive longitudinal data on a large number of individuals with PD, and to act as a platform through which surveys can be administered to large numbers of PD patients. Understanding how the characteristics of the FI cohort compare to more traditionally-assessed cohorts would be useful towards determining some of the key factors discussed above. The primary objectives of this analysis were to provide a baseline description of the PD cohort in Fox Insight, and to compare self-reported demographic and medical history, disease characteristics, PD medication use, and motor and non-motor symptoms of the FI cohort to other recent observational research study cohorts assessed with in-person visits. This can inform future combined analyses of these populations. A secondary objective was to examine data completeness. Our hypothesis is that the FI cohort has similar characteristics and symptom prevalence as compared to demographically comparable individuals with PD assessed in-person, and that data completeness would be comparable to in-person assessments.
METHODS
Three comparison cohorts were selected based on accessibility of data and comparability of assessments. They were the Parkinson’s Progression Markers Initiative (PPMI), Parkinson’s Disease Biomarkers Project (PDBP), and the idiopathic PD (non-mutation carrier) arm of the cross-sectional LRRK2 consortium cohort (iPDLC). Only the PD subjects from these cohorts were examined. Where inclusion/exclusion criteria for a given cohort accounted for key differences in factors that influence PD expression (such as disease duration), analyses to stratify based on said differences were undertaken (see analysis section below).
Sample
The minimum requirements for inclusion of subjects in this analysis were available data on subject age, gender, and year of PD diagnosis. Additional criteria for inclusion of data from subjects from each cohort are specified below.
Fox Insight
Details of the Fox Insight Study are available online [4]. Briefly, any individual aged 18 or older, with or without PD, who is able to provide online informed consent, is eligible to enroll in FI. Recruitment occurs through a variety of approaches including in-person referral (at educational/research events and clinician referrals) and online strategies (ads on social network platforms, email invitations, electronic newsletters) [14]. Within the Fox Insight database, subjects were included for this analysis if they met the following criteria: had (i) participated in Fox Insight starting March 7, 2017 (the date on which new questionnaires and platform updates were launched), (ii) self-reported a diagnosis of PD, and (iii) completed a baseline visit as of February 19, 2019. A completed baseline visit was defined as completion of questions on age at survey, gender, year of PD diagnosis, and completion of > 80% of items on the Movement Disorders Society-Unified Parkinson’s Disease Rating scale (MDS-UPDRS) II or Non-Motor Symptom Questionnaire (NMS-QUEST). Eight participants whose diagnosis date was listed as the same as their date of birth and 2,271 participants with an incomplete baseline visit were excluded from analysis. Similar data inclusion/exclusion criteria were applied across all cohorts, to ensure a minimum amount of data were available on all included subjects. The final sample for the Fox Insight PD cohort was n = 12,654.
PPMI cohort
Details regarding the PPMI study have been published [15, 16] and are available at ppmi-info.org. Briefly, PPMI recruited 423 individuals with PD diagnosed within 2 years of enrollment, not on dopaminergic therapy, Hoehn and Yahr ≤2, and with abnormal dopamine transporter (DAT) SPECT scan. PPMI data used in this analysis were downloaded on November 9, 2018. Individuals in PPMI who completed less than 80% of items on the MDS-UPDRS II at baseline were excluded (n = 1). The final sample for the PPMI cohort was n = 422.
iPDLC cohort
The cross-sectional LRRK2 consortium cohort consists of PD participants with or without a LRRK2 mutation recruited from family, community or clinic-based studies that were being conducted at consortium-participating centers [17]. In family-based studies individuals were invited to participate based on a family history of PD. For this analysis, only subjects in the non-mutation arm (idiopathic PD LRRK2 Consortium subjects, iPDLC), recruited from consortium centers in 7 countries (USA, Israel, Tunisia, Germany, Spain, Norway, and Canada), were included in this analysis. Participants in 8 research studies contributed to this analysis: five studies were family-based, and three were clinic-based. There were no restrictions on age or disease duration for inclusion in the LRRK2 cohort consortium. Data used in this analysis were downloaded on September 12, 2016. Seventeen individuals were excluded from the analysis as they did not complete > 80% of items on the UPDRS II at baseline. The final sample for the iPDLC cohort was n = 508.
PDBP cohort
The National Institute of Neurological Disorders and Stroke (NINDS) PDBP cohort included in this analysis is comprised of PD participants recruited at 10 academic centers in the United States across 11 research projects (Supplementary Table 1). All projects are observational studies that share 2 inclusion criteria for their PD cohorts: diagnosis of PD based on UK PD Society Brain Bank criteria, and the ability to provide written informed consent or have an informed consent proxy. Otherwise, each project has its own inclusion/exclusion criteria, including age, PD disease duration, and PD severity [18, 19]. For this analysis, all subjects who had PD listed as their primary diagnosis on the PDBP Neurological Examination form and who had completed a study visit at the time of PDBP data download (April 1, 2019) were included in this analysis. No individuals were excluded as all participants completed > 80% of items on the MDS-UPDRS II at baseline. The final sample for the PDBP cohort was n = 700.
This study was performed in accordance with the Declaration of Helsinki. The Fox Insight study is approved by the New England Institutional Review Board, and online consent is obtained from each participant at enrollment.
Assessments
Data from baseline visits for participants in each cohort were compared. For the PPMI, PDBP and iPDLC groups, these visits consisted of assessments gathered on a single day during an in-person visit. At the time of data download, the baseline visit for the FI cohort could be completed over a 3-month period. However, the vast majority of participants completed all assessments over a single day (Supplementary Table 2).
The FI study administers questions on demographics, non-motor symptoms, quality of life, activities of daily living function, medical history, and medications. Study assessments administered in the comparator cohorts are detailed in Supplementary Tables 3–5. In instances where identical standardized questionnaires were administered in FI and any given comparator cohort, responses to each question were compared directly. Otherwise, expert opinion (of the authors) was used to determine responses on different questionnaires that reflect presence/absence of a given symptom and the prevalence of the symptom was then compared across cohorts. A brief description follows, and details are provided in Supplementary Tables 3–5.
Demographics
Age at survey, disease duration, race, ethnicity, and education were compared.
MDS-UPDRS II [20]
This assesses motor aspects of experiences of daily living. Responses were dichotomized into 0 vs > 0 and compared across cohorts that collected this scale (FI, PDBP, PPMI).
Comorbid vascular risk factors
Only the FI cohort collects medical conditions as categorical variables. The other cohorts either do not collect medical history (iPDLC, PDBP) or collect it as free-text (PPMI). Therefore, for practicality, it was determined that only a brief list of medical conditions could be compared across any of the cohorts for this analysis, and vascular risk factors were selected given their putative relevance to several key outcomes in PD (e.g., motor impairment, cognitive decline). FI collects data on vascular risk factors by asking participants for the presence/absence of each. As for the PPMI cohort, during the PPMI screening visit, all medical conditions reported by the patient are recorded in the medical conditions log. Self-reported vascular risk factors were ascertained from the log.
Health-related quality of life (QOL)
Parkinson’s Disease Quesitonnaire-8 (PDQ) scores from FI were compared to a score derived from the Parkinson’s Disease Questionnaire-39 administered in PDBP. Responses by the PDBP cohort on the items on the PDQ39 that are also present on the PDQ8 (questions 7, 12, 17, 25, 27, 31, 35, 37) were used to derive a PDQ8 score as described [21]. No other comparator cohort had a quality of life assessment at the time of data download.
Non-motor symptoms
Fox Insight assesses non-motor symptoms via the NMS-QUEST [22, 23]. Responses on these items were compared to responses on questions collected in other cohorts that query similar domains. These include, in PPMI, the MDS-UPDRS part I, Geriatric Depression Scale—15 item (GDS-15) [24], the REM sleep behavior Disorder Questionnaire (RBDSQ) [25], single question for RBD (RBDQ1), Epworth sleepiness scale (ESS) [26], Scales for Outcomes in Parkinson’s-Autonomic (SCOPA-AUT) [27], in PDBP the MDS-UPDRS part 1, and in the iPDLC the UPDRS, Mayo sleep questionnaire [28], GDS-15, ESS, and the SCOPA-AUT.
PD medications (Supplementary Table 5)
Fox Insight asks participants to select any medication they are prescribed from a list of generic and trade name PD medications. PPMI collects data on use of levodopa, agonist, or “other” PD medication. Responses on that case report form (CRF) were used to compare to use of dopaminergic medication in FI. In PPMI, medication use is also collected on a free-text medication log.
Use of supplements
FI participants are asked if they are taking any of the following supplements or vitamins (more than one can be selected): coenzyme Q10, vitamin E, vitamin C, vitamin D, creatine. Use of vitamins E, C and D was extracted from the PPMI medication log.
Analysis
The FI cohort was compared to each of the 3 comparator cohorts separately (comparator cohorts were not compared to each other). For continuous variables, the mean, standard deviation, as well as minimum and maximum values are provided. For categorical variables, the percentage of participants who provided positive endorsements out of the total number of participants who provided a response are shown (i.e., not answered (NA) or prefer not to answer (PNA) responses were excluded from the denominator). In Supplementary Tables 6–10, information regarding the percentage of NA or PNA responses (out of the total size of the cohort) is provided for each variable.
Univariate comparisons were performed across all measures. For categorical measures, chi-square tests were performed and Cramer’s V effect sizes for significant post-hoc comparisons between FI and the other cohorts (small: 0.1, medium: 0.3, and large: 0.5) are reported. For continuous measures, one-way ANOVAs were performed and Cohen’s d effect sizes for significant post-hoc comparisons between FI and the other cohorts (small: 0.2, medium: 0.5, and large: 0.8) are reported. A Bonferroni adjusted alpha level of 0.000095 was used to account for the multiple comparisons being performed.
In order to account for differences in disease duration between the FI and PPMI cohort (resulting from the inclusion criteria of the PPMI cohort as stated above), only the subgroup of FI participants with ≤2 years disease duration, from here on referred to as the “early FI cohort”, were compared to the PPMI cohort.
RESULTS
The final sample for each cohort was FI n = 12,654 (early FI = 4,072), PPMI n = 422, PDBP n = 700, iPDLC n = 508.
Among the FI cohort, the physician who diagnosed PD (as reported by the participant) was a general neurologist in 5264 (41.6%) cases, a neurologist specializing in movement disorders in 5338 (42.18%), and a primary care physician in 562 (4.44%). Multiple sources of diagnosis was selected in 1307 (10.33%) cases.
Demographic and disease characteristics
Demographic characteristics of each cohort are shown in Table 1. The FI, PDBP, and iPDLC cohort had similar mean ages of 65-66 years. The PPMI cohort was significantly younger than the early FI cohort (64.31 vs 61.62 years). The proportion of females was significantly higher in FI (45.56%) compared to PDBP (35.71%) and in early FI (46.93%) compared to PPMI (34.36%). The proportion of non-whites was low across all cohorts though significantly greater in PPMI (7.58%) compared to early FI (2.89%) and in FI (3.15%) compared to iPDLC (0). The FI cohort had significantly greater educational attainment as compared to all other cohorts. As for PD disease duration, it was comparable in FI (5.21 years) and iPDLC (4.69 years), and longer in PDBP (6.42 years) compared to FI. History of PD in a 1st degree relative was significantly more often reported in early FI compared to PPMI (22.28% vs 13.06%).
Table 1
Baseline demographic characteristics of the Fox Insight cohort and comparator cohorts. Percentages are based on number endorsing divided by specified sample in parenthesis. Blank cells indicate data were not collected in a given cohort
| Item | Fox Insight | Early Fox Insight | PPMI | PDBP | iPDLC | Sig. diff | Post-hoc effect sizes |
| Age (mean (SD)) | 65.77 (9.49) | 64.31 (10) | 61.62 (9.68) | 65.2 (9.09) | 66.67 (10.62) | * | Early FI vs. PPMI: 0.27 |
| Range (years) | (18.1–98.8) | (25.2–93.4) | (33.5–84.88) | (34.75–87.5) | (26–89) | ||
| Sex | * | FI vs. PDBP: 0.043 | |||||
| Male | 54.44% (6889/12654) | 53.07% (2161/4072) | 65.64% (277/422) | 64.29% (450/700) | 60.43% (307/508) | Early FI vs. PPMI: 0.072 | |
| Female | 45.56% (5765/12654) | 46.93% (1911/4072) | 34.36% (145/422) | 35.71% (250/700) | 39.57% (201/508) | ||
| BMI (kg/m2) | 26.79 (6.54) | 27.21 (5.95) | 27.15 (4.63) | ||||
| Range | (8.87–231.93) | (8.87–165.31) | (16.66–43.76) | ||||
| Race | * | FI vs. iPDLC: 0.034 | |||||
| White | 96.85% (12183/12579) | 97.11% (3933/4050) | 92.42% (390/422) | 96.85% (677/699) | 100% (508/508) | Early FI vs. PPMI: 0.075 | |
| NonWhite | 3.15% (396/12579) | 2.89% (117/4050) | 7.58% (32/422) | 3.15% (22/699) | 0% (0/508) | ||
| Ethnicity | |||||||
| Hispanic | 3.81% (469/12317) | 3.28% (131/3997) | 2.13% (9/422) | 1.92% (13/678) | 2.5% (1/40) | ||
| NonHispanic | 96.19% (11848/12317) | 96.72% (3866/3997) | 97.87% (413/422) | 98.08% (665/678) | 97.5% (39/40) | ||
| Education | * | FI vs. iPDLC: 0.102 | |||||
| Less than 9 years | 0.98% (123/12606) | 0.86% (35/4054) | 1.66% (7/422) | 0.29% (2/700) | 2.82% (14/497) | FI vs. PDBP: 0.053 | |
| 9–12 years | 8.83% (1113/12606) | 8.53% (346/4054) | 16.11% (68/422) | 15.71% (110/700) | 19.92% (99/497) | Early FI vs. PPMI: 0.078 | |
| 13–16 years | 55.39% (6982/12606) | 56.83% (2304/4054) | 49.76% (210/422) | 52.86% (370/700) | 32.39% (161/497) | ||
| More than 16 years | 34.81% (4388/12606) | 33.77% (1369/4054) | 32.46% (137/422) | 31.14% (218/700) | 44.87% (223/497) | ||
| PD Duration (mean years) | 5.21 (5.21) | 0.94 (0.6) | 0.55 (0.54) | 6.42 (5.48) | 4.69 (4.91) | * | FI vs. PDBP: 0.232 |
| Range | (0–62.5) | (0–2) | (0.03–2.99) | (0–38.33) | (0–35) | Early FI vs. PPMI: 0.656 | |
| 0–2 years | 30.73% (3888/12654) | 95.50% (3888/4072) | 96.68% (408/422) | 23.29% (163/700) | 31.89% (162/508) | * | FI vs. PDBP: 0.035 |
| 2–5 years | 30.29% (3833/12654) | 4.52% (184/4072) | 3.32% (14/422) | 25.43% (178/700) | 27.95% (142/508) | ||
| 5–10 years | 24.02% (3039/12654) | 29% (203/700) | 25.79% (131/508) | ||||
| 10+ years | 14.97% (1894/12654) | 22.29% (156/700) | 14.37% (73/508) | * | FI vs. PDBP: 0.044 | ||
| Family History (1st Degree) | 22.32% (2371/10621) | 22.28% (722/3241) | 13.06% (55/421) | 17.82% (103/578) | 16.67% (81/486) | * | Early FI vs. PPMI: 0.07 |
Self-reported vascular risk factors
Self-reported vascular risk factors are shown in Table 2. The proportion reporting hypertension was higher in the early FI cohort compared to PPMI cohort (43.3% and 27.49%, respectively). The same was true for high cholesterol (47.28% in early FI, 21.8% in PPMI). The prevalence of coronary artery disease was comparable. Diabetes was twice as often reported in the early FI cohort as compared to PPMI cohort, and stroke was nearly 5 times more often reported, though these differences did not reach statistical significance.
Table 2
Vascular risk factors present in FI1 and PPMI. Percentages are based on number endorsing divided by specified sample in parenthesis
| Item | Fox Insight | Early Fox Insight | PPMI | Sig. diff | Post-hoc effect sizes |
| Hypertension | 40.89% (5157/12613) | 43.3% (1758/4060) | 27.49% (116/422) | * | Early FI vs PPMI: 0.092 |
| High Cholesterol1 | 45.08% (962/2134) | 47.28% (252/533) | 21.8% (92/422) | * | Early FI vs PPMI: 0.262 |
| Coronary Artery Disease | 5.95% (625/10498) | 5.6% (198/3534) | 5.21% (22/422) | ||
| Peripheral Arterial Disease1 | 2.2% (47/2134) | 2.63% (14/533) | 0% (0/422) | ||
| Atrial Fibrillation | 4.84% (508/10498) | 4.5% (159/3534) | 2.13% (9/422) | ||
| Stroke or TIA | 5% (630/12602) | 4.98% (202/4056) | 0.47% (2/422) | ||
| Diabetes | 9.25% (1167/12618) | 10.71% (435/4063) | 5.21% (22/422) |
1Note, only a subset of Fox Insight participants received questions regarding high cholesterol and peripheral arterial disease.
Motor experiences of daily living
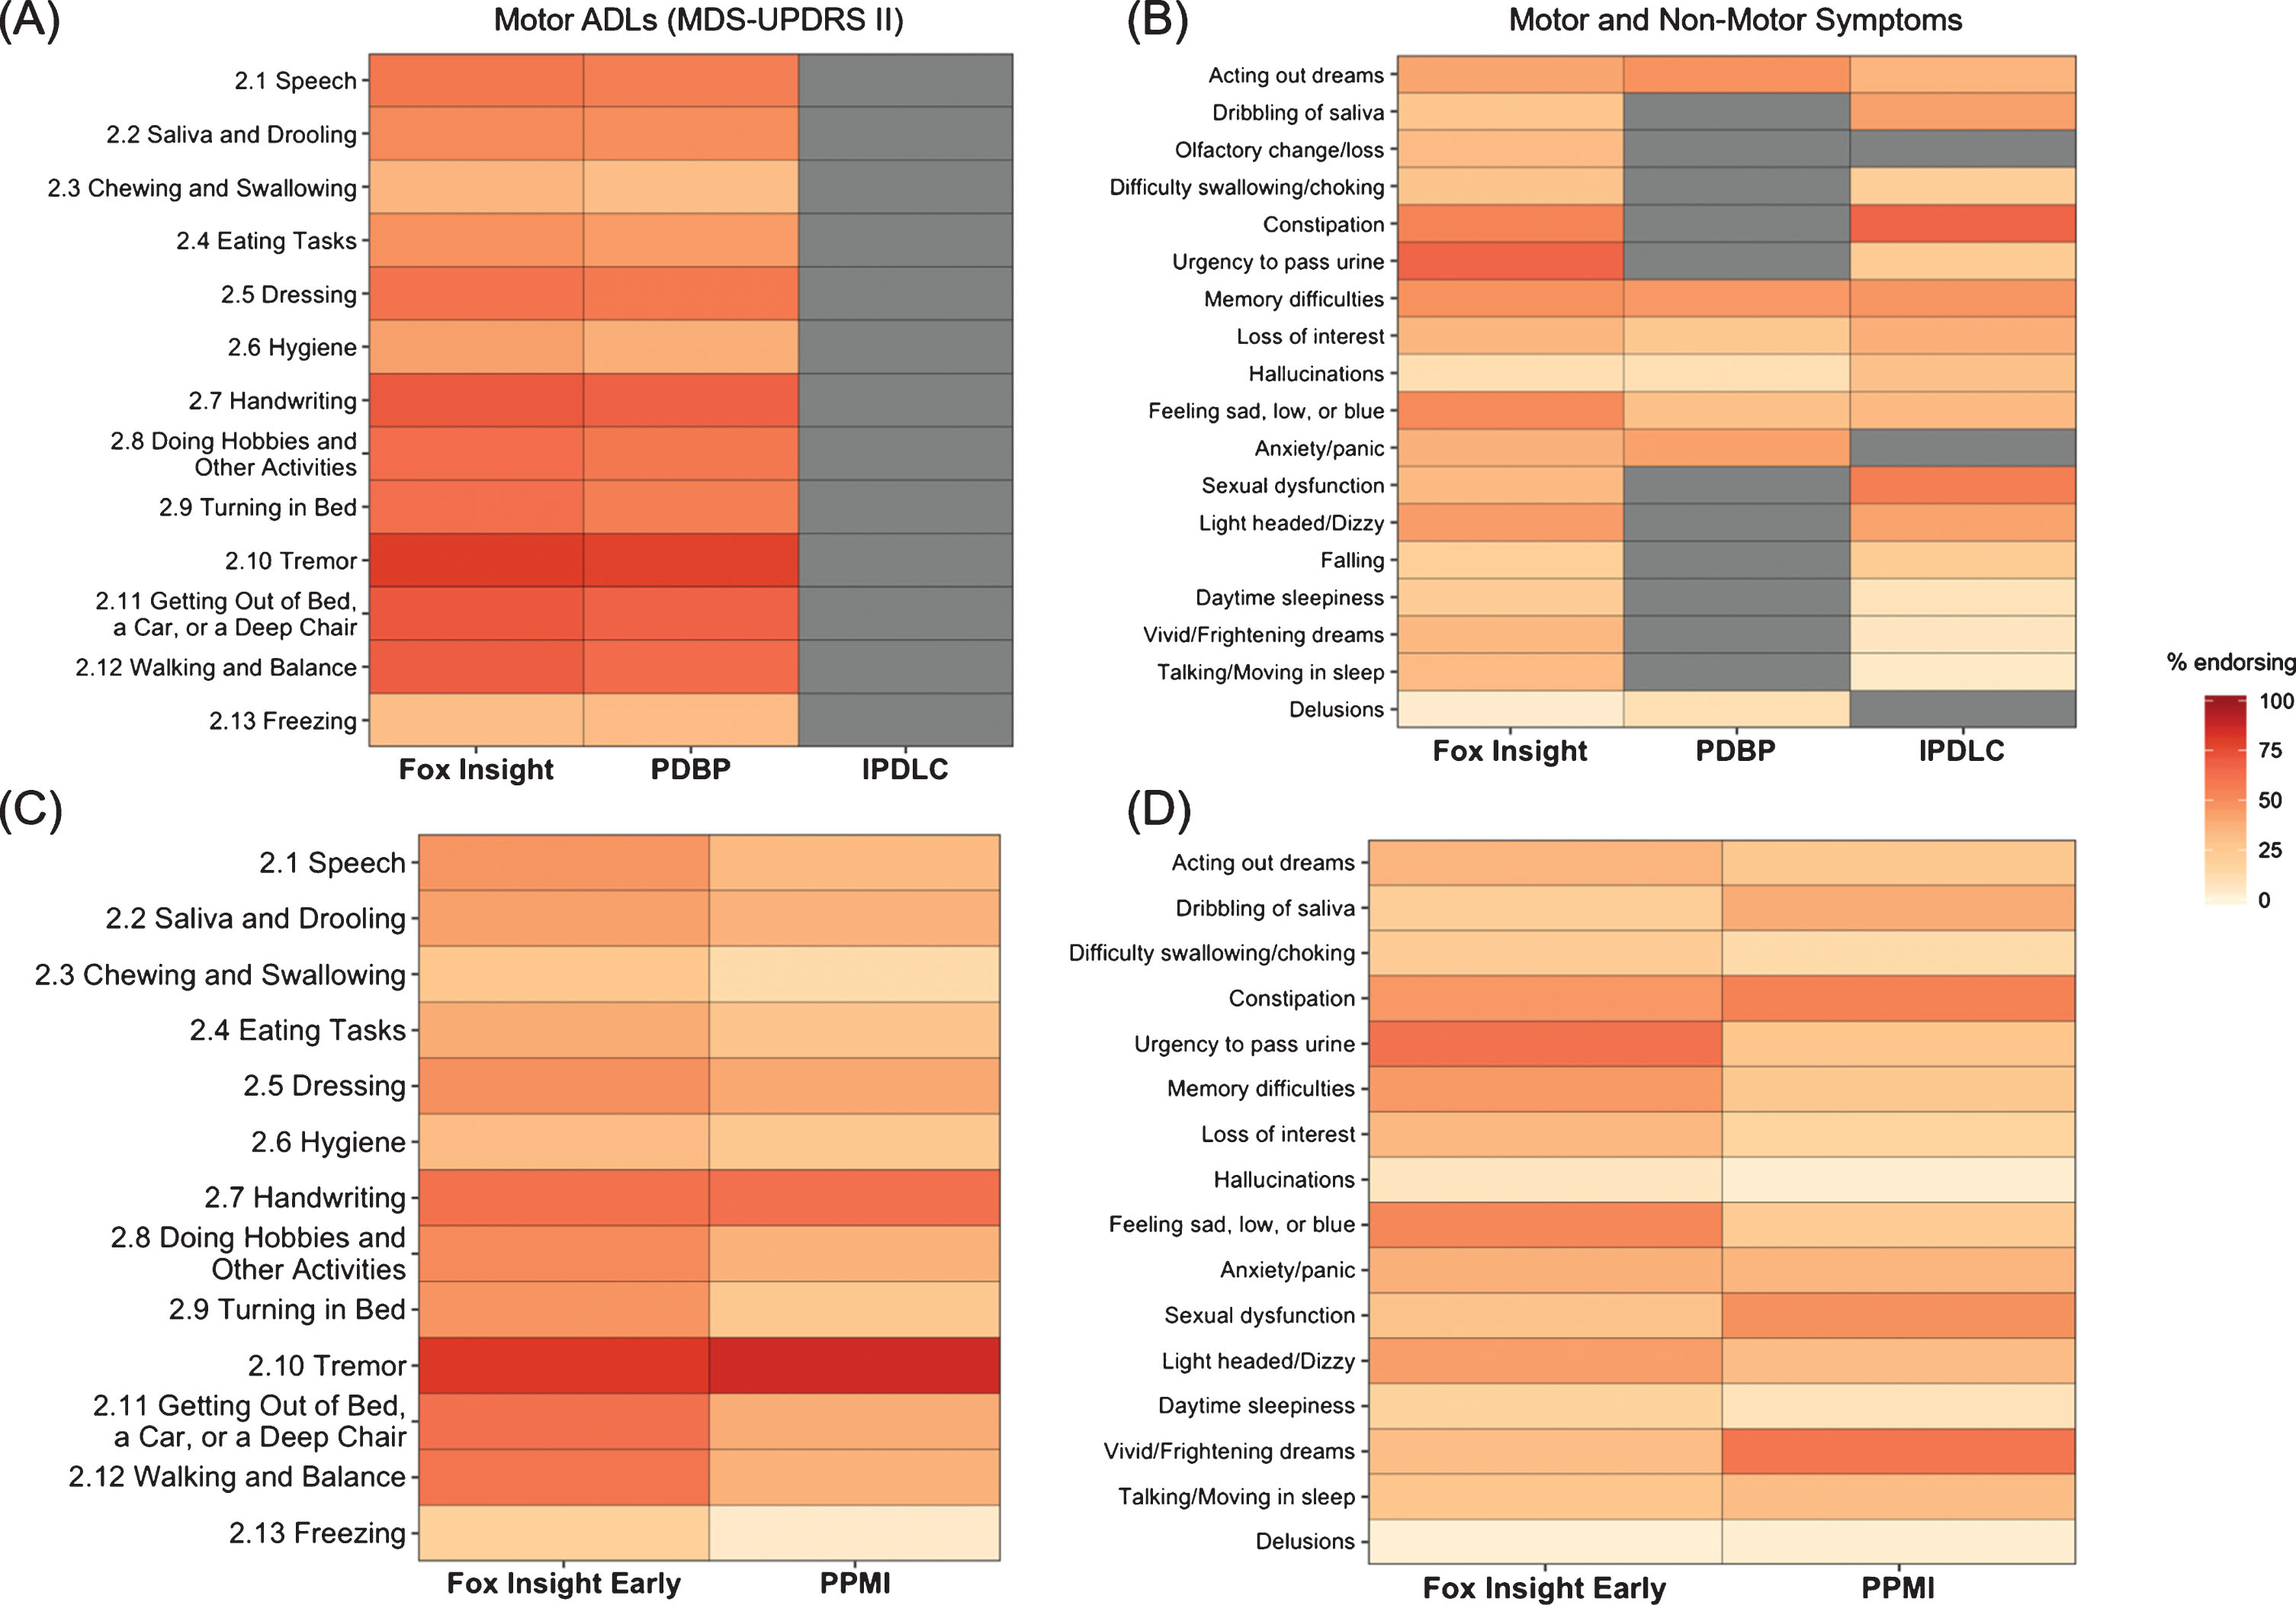
Regarding motor experiences of daily living, the proportion reporting > 0 on each item of the MDS-UPDRS II are shown in Table 3 and depicted in Fig. 1. There were no significant differences in the FI and PDBP cohort on any item. Certain motor symptoms were more frequent in the early FI cohort when compared to the PPMI cohort, specifically difficulty turning in bed (47.22% vs 25.59%), getting out of bed/car/chair (61.71% vs 38.63%), walking and balance (59.45%, 36.73%), and freezing of gait (19.28% vs 4.74%). Falling was reported by similar proportions of the FI and PDBP cohort (20.25% vs 23.27% respectively).
Table 3
Motor experiences of daily living as assessed with the MDS-UPDRS II. MDS-UPDRS II = Movement Disorders Society Unified Parkinson’s Disease Rating Scale part II
| Item | Fox Insight | Early Fox Insight | PPMI | PDBP | Sig. diff | Post-hoc effect sizes |
| MDS-UPDRS II Total | 12.11 (8.26) (0–52) | 9.15 (6.76) (0–46) | 5.9 (4.19) (0–22) | 11.59 (8.43) (0–46) | * | Early FI vs. PPMI: 0.496 |
| 2.1 Speech | 58.48% (7400/12654) | 46.88% (1909/4072) | 33.89% (143/422) | 55.86% (391/700) | * | Early FI vs. PPMI: 0.075 |
| 2.2 Saliva and Drooling | 51.36% (6499/12654) | 42.98% (1750/4072) | 36.49% (154/422) | 49.43% (346/700) | ||
| 2.3 Chewing and Swallowing | 35.43% (4483/12654) | 26.94% (1097/4072) | 13.03% (55/422) | 31.43% (220/700) | * | Early FI vs. PPMI: 0.092 |
| 2.4 Eating Tasks | 48.01% (6075/12654) | 39% (1588/4072) | 28.2% (119/422) | 44.86% (314/700) | * | Early FI vs. PPMI: 0.063 |
| 2.5 Dressing | 60.76% (7689/12654) | 48.5% (1975/4072) | 40.52% (171/422) | 58.29% (408/700) | ||
| 2.6 Hygiene | 43.24% (5471/12654) | 32.93% (1341/4072) | 25.59% (108/422) | 38% (266/700) | ||
| 2.7 Handwriting | 70.82% (8961/12654) | 61.47% (2503/4072) | 61.85% (261/422) | 68% (476/700) | ||
| 2.8 Doing Hobbies and | 62.93% (7963/12654) | 50.98% (2076/4072) | 36.73% (155/422) | 58.43% (409/700) | * | Early FI vs. PPMI: 0.082 |
| Other Activities | ||||||
| 2.9 Turning in Bed | 62.67% (7930/12654) | 47.22% (1923/4072) | 25.59% (108/422) | 55.65% (389/699) | * | Early FI vs. PPMI: 0.126 |
| 2.10 Tremor | 79.71% (10086/12654) | 81.34% (3312/4072) | 86.02% (363/422) | 78.57% (550/700) | ||
| 2.11 Getting Out of Bed, | 71.13% (9001/12654) | 61.71% (2513/4072) | 38.63% (163/422) | 67.71% (474/700) | * | Early FI vs. PPMI: 0.136 |
| a Car, or a Deep Chair | ||||||
| 2.12 Walking and Balance | 69.57% (8804/12654) | 59.45% (2421/4072) | 36.73% (155/422) | 64.09% (448/699) | * | Early FI vs. PPMI: 0.133 |
| 2.13 Freezing | 31.28% (3958/12654) | 19.28% (785/4072) | 4.74% (20/422) | 32.71% (229/700) | * | Early FI vs. PPMI: 0.11 |
Fig.1
Heat map depicting percentage of participants in the FI cohort compared to the PPMI, PDBP, and iPDLC cohorts with (A) score of > 0 on MDS-UPDRS II items and (B) non-motor symptoms. (C) Comparison in score of > 0 on MDS-UPDRS II items between the early FI cohort and PPMI. (D) Comparison of non-motor symptoms in early FI cohort compared to PPMI cohort. Grey cells indicate not collected. FI, Fox Insight; iPDLC, idiopathic PD LRRK2 Consortium subjects; MDS-UPRDS, Movement Disorders Unified Parkinson’s Disease Rating Scale; PD PDBP, Parkinson’s Disease Biomarker Program; PPMI, Parkinson’s Progression Markers Initiative.
Health-related quality of life
Comparing PDQ8 scores from FI to the derived PDQ score from the PDQ39 administered in PDBP, scores were higher (worse) in FI compared to PDBP.
Non-motor symptoms
Several non-motor symptoms tended to be reported by a higher proportion of FI participants, though the magnitude of differences were small for most (Table 4, Fig. 1). Differences in possible RBD among cohorts varied according to what measure/definition was used. Possible RBD was significantly more prevalent in the early FI cohort (indicated by a positive response to the RBDQ1) compared to the PPMI cohort (indicated by a score on the RBDSQ > 5), 35.53% vs 25.78% respectively. On the other hand, when items on the NMS-QUEST in the early FI cohort were compared to individual items on the RBDSQ in PPMI, a smaller proportion of FI participants reported vivid dreams than in PPMI (31.25% vs 59%), while a similar proportion of participants reported talking / moving in sleep (27.31% vs 32.07%). The iPDLC cohort reported significantly fewer vivid dreams (6.92% vs 33.93%) and talking/moving in sleep (5.53% vs 32.71%) compared to the FI cohort.
Table 4
Quality of life and non-motor symptoms
| Item | Fox Insight | Early Fox Insight | PPMI | PDBP | iPDLC | Sig. diff | Post-hoc effect sizes |
| PDQ8 Total Score | 21.38 (16.79) (0–100) | 17.36 (15.45) (0–93.75) | 16.6 (13.7) (0–65.62) | * | FI vs. PDBP: 0.287 | ||
| Acting out dreams | 41.54% (5052/12163) | 35.53% (1411/3971) | 25.78% (108/419) | 48.01% (325/677) | 35.85% (19/53) | * | FI vs. PPMI: 0.057 |
| Early FI vs. PPMI: 0.058 | |||||||
| Dribbling of saliva | 27.53% (3419/12421) | 21.21% (851/4013) | 38.76% (138/356) | 43.16% (82/190) | * | FI vs. iPDLC: 0.042 | |
| Early FI vs. PPMI: 0.114 | |||||||
| Olfactory change/loss | 32.65% (4055/12421) | 28.71% (1152/4013) | |||||
| Difficulty swallowing/choking | 28.26% (3510/12421) | 22.48% (902/4013) | 13.03% (55/422) | 21.26% (108/508) | * | Early FI vs. PPMI: 0.066 | |
| Nausea/Vomiting | 21.1% (2621/12421) | 22.65% (909/4013) | |||||
| Constipation | 53.84% (6688/12421) | 46.15% (1852/4013) | 54.5% (230/422) | 67.19% (129/192) | |||
| Fecal Incontinence | 12.26% (1523/12421) | 10.84% (435/4013) | |||||
| Incomplete Bowel Emptying | 43.73% (5432/12421) | 39.57% (1588/4013) | |||||
| Urgency to pass urine | 67.16% (8342/12421) | 61.08% (2451/4013) | 27.49% (116/422) | 23.56% (45/191) | * | FI vs. iPDLC: 0.112 | |
| Early FI vs. PPMI: 0.199 | |||||||
| Unexplained pain | 36.28% (4506/12421) | 34.81% (1397/4013) | |||||
| Change in weight | 11.56% (1436/12421) | 10.57% (424/4013) | |||||
| Memory difficulties | 48.06% (5969/12421) | 45.5% (1826/4013) | 25.36% (107/422) | 45.64% (319/699) | 46.85% (238/508) | * | Early FI vs. PPMI: 0.118 |
| Loss of interest | 35.26% (4380/12421) | 34.14% (1370/4013) | 16.82% (71/422) | 25.32% (177/699) | 37.7% (190/504) | * | FI vs. PDBP: 0.046 |
| Early FI vs. PPMI: 0.107 | |||||||
| Hallucinations | 11.08% (1376/12421) | 7.48% (300/4013) | 3.08% (13/422) | 10.59% (74/699) | 29.53% (150/508) | * | FI vs. iPDLC: 0.111 |
| Difficulty concentrating or focusing | 46.54% (5781/12421) | 43.43% (1743/4013) | |||||
| Feeling sad, low or blue | 50.9% (6322/12421) | 52.28% (2098/4013) | 23.7% (100/422) | 30.19% (211/699) | 33.6% (170/506) | * | FI vs. iPDLC: 0.067 |
| FI vs. PDBP: 0.093 | |||||||
| Early FI vs. PPMI: 0.167 | |||||||
| Anxiety/panic | 36.91% (4584/12421) | 37.2% (1493/4013) | 35.78% (151/422) | 42.63% (298/699) | |||
| Change in libido | 35.74% (4439/12421) | 35.14% (1410/4013) | |||||
| Sexual dysfunction | 33.37% (4145/12421) | 28.71% (1152/4013) | 48.33% (202/418) | 55.93% (99/177) | * | FI vs. iPDLC: 0.055 | |
| Early FI vs. PPMI: 0.124 | |||||||
| Light headed/Dizzy | 44.26% (5498/12421) | 43.58% (1749/4013) | 32.3% (115/356) | 42.33% (80/189) | * | Early FI vs. PPMI: 0.061 | |
| Falling | 20.25% (2515/12421) | 14.25% (572/4013) | 23.27% (114/490) | ||||
| Daytime sleepiness | 22.59% (2806/12421) | 17.94% (720/4013) | 9.03% (38/421) | 8.89% (4/45) | * | Early FI vs. PPMI: 0.068 | |
| Vivid/Frightening dreams | 33.93% (4214/12421) | 31.25% (1254/4013) | 59% (249/422) | 6.92% (35/506) | * | FI vs. iPDLC: 0.111 | |
| Early FI vs. PPMI: 0.171 | |||||||
| Talking/Moving in sleep | 32.71% (4063/12421) | 27.31% (1096/4013) | 32.07% (135/421) | 5.53% (28/506) | * | FI vs. iPDLC: 0.113 | |
| Unpleasant sensations in legs | 47.16% (5858/12421) | 42.74% (1715/4013) | |||||
| Swelling of legs | 19.39% (2409/12421) | 15.47% (621/4013) | |||||
| Excessive sweating | 24.54% (3048/12421) | 20.68% (830/4013) | |||||
| Double vision | 17.3% (2149/12421) | 13.16% (528/4013) | |||||
| Delusions | 3.53% (439/12421) | 2.27% (91/4013) | 3.08% (13/422) | 10.59% (74/699) | * | FI vs. PDBP: 0.081 |
PD medications (Table 5)
Use of levodopa was comparable in the FI (77.55%) and PDBP cohort (78.64%). Dopamine agonist use was significantly more common in the PDBP (49.07%) cohort compared to FI (32.08%), as was use of other PD medications (64.71% vs 33.71% respectively). All PD medications were significantly more commonly reported in early FI compared to PPMI, as expected based on PPMI inclusion criteria.
Table 5
Dopaminergic medications and supplement use. NA = not answered (missing)
| Item | Fox Insight | PPMI | PDBP | Sig. diff | Post-hoc effect sizes |
| Levodopa | 77.55% (9792/12626) | 0% (0/422) | 78.64% (508/646) | ||
| Dopamine agonist | 32.08% (4051/12626) | 0% (0/422) | 49.07% (317/646) | * | FI vs. PDBP: 0.077 |
| Other PD med | 33.71% (4256/12626) | 0% (0/422) | 64.71% (418/646) | * | FI vs. PDBP: 0.139 |
| Vitamin | 66.67% (8415/12622) | 16.82% (71/422) | 38.54% (249/646) | * | FI vs. PDBP: 0.127 |
| Qoenzyme q10 | 19% (2398/12622) | 15.17% (64/422) | 6.81% (44/646) | * | FI vs. PDBP: 0.067 |
| Stratified by disease duration | |||||
| Levodopa | |||||
| 0–2 years | 59.71% (2316/3879) | 0% (0/408) | 56.03% (79/141) | * | FI vs. PPMI: 0.351 |
| 2–5 years | 77.72% (2969/3820) | 0% (0/14) | 75% (123/164) | * | FI vs. PPMI: 0.11 |
| 5–10 years | 90.15% (2737/3036) | 82.89% (155/187) | |||
| 10+ years | 93.6% (1770/1891) | 98.05% (151/154) | |||
| Dopamine agonist | |||||
| 0–2 years | 20.01% (776/3879) | 0% (0/408) | 29.79% (42/141) | * | FI vs. PPMI: 0.151 |
| 2–5 years | 30.21% (1154/3820) | 0% (0/14) | 43.9% (72/164) | ||
| 5–10 years | 42.36% (1286/3036) | 60.96% (114/187) | * | FI vs. PDBP: 0.084 | |
| 10+ years | 44.16% (835/1891) | 57.79% (89/154) | |||
| Other PD med | |||||
| 0–2 years | 20.98% (814/3879) | 0% (0/408) | 46.81% (66/141) | * | FI vs. PPMI: 0.155 |
| FI vs. PDBP: 0.112 | |||||
| 2–5 years | 34.4% (1314/3820) | 0% (0/14) | 58.54% (96/164) | * | FI vs. PDBP: 0.097 |
| 5–10 years | 42.69% (1296/3036) | 74.33% (139/187) | * | FI vs. PDBP: 0.146 | |
| 10+ years | 44% (832/1891) | 75.97% (117/154) | * | FI vs. PDBP: 0.166 | |
| Vitamin | |||||
| 0–2 years | 67.83% (2633/3882) | 16.91% (69/408) | 37.59% (53/141) | * | FI vs. PPMI: 0.308 |
| FI vs. PDBP: 0.116 | |||||
| 2–5 years | 66.45% (2541/3824) | 14.29% (2/14) | 42.68% (70/164) | * | FI vs. PDBP: 0.096 |
| 5–10 years | 66.94% (2031/3034) | 41.71% (78/187) | * | FI vs. PDBP: 0.121 | |
| 10+ years | 64.29% (1210/1882) | 31.17% (48/154) | * | FI vs. PDBP: 0.177 | |
| Coenzyme q10 | |||||
| 0–2 years | 20.94% (813/3882) | 14.22% (58/408) | 6.38% (9/141) | * | FI vs. PDBP: 0.062 |
| 2–5 years | 19.87% (760/3824) | 42.86% (6/14) | 9.15% (15/164) | ||
| 5–10 years | 17.24% (523/3034) | 6.95% (13/187) | |||
| 10+ years | 16.05% (302/1882) | 4.55% (7/154) |
Missing data
Inclusion criteria for this analysis required > 80% completion of the MDS-UPDRS II in FI, PDBP, and PPMI, and > 80% completion of UPDRS II in iPDLC; numbers excluded due to incomplete MDS-UPDRS or UPDRDS are described in the “Sample” section above. Otherwise, while for the most part missing data were not noted to be common in the FI cohort as compared to other cohorts (Supplementary Tables 6–10, Fig. 1), family history was significantly more likely to be missing in early FI (20.41%) compared to PPMI (0.24%) and in FI (16.07%) compared to iPDLC (4.33%) (Supplementary Table 6). Due to changes in the FI medical history questionnaire and schedule of activities (see Assessments section above), data on several vascular risk factors were missing from the early FI cohort (Supplementary Table 7). On the other hand, ethnicity data were more frequently missing in PDBP and iPDLC as compared to FI. The iPDLC cohort had significantly more missing data on education compared to FI (Supplementary Table 6). Comparisons in prevalence of non-motor symptoms between the FI cohort and iPDLC cohort were limited due to substantial missing data in the iPDLC cohort, especially for the items daytime sleepiness, drooling, possible RBD, constipation, urinary urgency, and difficulty having sex (Supplementary Tables 8-9).
DISCUSSION
In this analysis, we compare the Fox Insight cohort, a large online-only self-reported PD sample, to observational research cohorts assessed with in-person visits. In general, we found that the FI cohort is comparable to the other cohorts. Some differences exist, albeit small for the most part, which likely represent a combination of differences in inclusion/exclusion criteria for the in-person cohorts, differences in assessments, and the recruitment and data collection method. We consider our results in relation to potential threats to the quality of online-only studies: patient characteristics, self-reported medical conditions and medications, symptoms profile, missing data, and values out of expected range.
Patient characteristics
PD research studies are lacking in gender, ethnic, and racial diversity, with a significant over-representation of males and whites, even when accounting for the known demographic distribution of PD [29, 30]. Females are disproportionately under-represented in PD research [31]. One putative advantage of online cohorts is allowing patients who may not otherwise enroll in research, due to geographic reasons, transportation limitations, or other reasons, to participate. The FI cohort did have substantially more females with PD participating as compared to other cohorts, suggesting that the FI cohort has the potential to reduce barriers to research participation. However, ethnic and racial diversity remains limited. Recruitment strategies aimed at increasing diversity in FI are underway [14].
Self-reported medical conditions and medications
Self-reported medical history, and especially cardiovascular history, is particularly prone to inaccurate reporting [32]. This is important to consider when interpreting the higher prevalence of vascular risk factors in the FI cohort compared to the PPMI cohort. Future work to validate and improve upon this in FI is also needed. On the other hand, it is possible that the FI cohort allows for participation of individuals with medical comorbidities that might otherwise be excluded from other, in-person observational studies. While self-reported use of medications is accurate for other chronic diseases [33, 34], there are few data on the accuracy of self-reported PD medications as ascertained by survey. Given that, particular attention is needed in interpreting FI data on self-reported medications. It is reassuring that levodopa use was similar in FI and PDBP, but significantly greater use of dopamine agonists and other PD medications could indicate either differences in prescribing trends, or rather an under-reporting of use of non-levodopa agents in FI.
Symptoms reported by the study population
In terms of non-motor symptoms, the FI cohort demonstrates a high prevalence of many non-motor symptoms including constipation, urinary urgency, sexual dysfunction, memory problems, light-headedness, and depressive symptoms. The higher prevalence of some motor and non-motor symptoms we saw in the FI cohort compared to the other cohorts may be indicative of the ability of an online platform to include a more severe phenotype and representative sample than is able to participate in in-person studies. Regarding the substantial differences in possible RBD/dream related phenomena, while we cannot rule out true cohort differences, the findings more likely reflect differences in the assessments used as well as the challenges of measuring RBD in PD [35].
Missing data
There are some items in FI that have high rates of missing entries, most notably family history, and efforts to optimize response to such critical data will be instituted. However, in general there was a high rate of questionnaire completion in FI compared to other cohorts. Despite some values being out of the expected range of normal (for example, BMI of 8.87), these were exceedingly rare. An advantage of the electronic data collection in FI is that it would allow real-time prompts to participants who enter unexpected values and this will be considered in the future to further minimize such entries.
A key consideration in regard to limitations of online-only data is the accuracy of self-reported PD, which we are currently not able to directly assess. Even with physician assessment, diagnostic accuracy for PD can be low early on in the course of parkinsonism, especially among older adults [36]. Data on self-reported diagnostic accuracy of PD are few. In a population-based study ascertaining PD self-report by semi-structured interview (by a lay interviewer), accuracy of self-reported was only 40% compared to death certificate and neuropathological diagnosis [37]. This misclassification is potentially compounded further due to errors in unsupervised self-report. The reported specialty of the diagnosing physician [38, 39] and similarities of responses in the FI cohort and comparator cohorts (prevalence of motor/non-motor symptoms, use of PD medications) provide a preliminary indication that the FI PD diagnosis may be largely accurate. However, this can only be confirmed with properly designed validation studies; a study to validate self-reported diagnosis in the FI PD cohort through telemedicine assessment by a neurologist is underway [40].
As for limitations of this study, expert consensus, rather than validated approaches, was used to identify and assign assessments across cohorts that were felt to measure similar domains due to different instruments being used across studies. As harmonization of study assessments occurs in future PD research studies, a repeat of this analysis, comparing FI cohort characteristics to other cohorts that used the same assessments, will be needed. Given the heterogeneity of PD, including within-subject fluctuations in symptoms, the cross-sectional nature of this analysis is also a limitation to what conclusions can be drawn. Another limitation of this study is that it did not address the key data quality issue related to the validity of questionnaires for online-only administration. Most of the questionnaires administered have not been specifically validated for unsupervised survey administration. It is possible that with in-person administration, instructions and clarifying questions modify the responses provided. However, a high degree of agreement between remote and in-person administered responses on key instruments such as the MDS-UPDRS has been found in a previous study [6].
The results of this analysis indicate that research utilizing data from an online-only self-reported PD cohort is feasible, and that a cohort assembled in this way has features that are broadly similar to cohorts recruited in person. Participants have a wide range of ages and disease durations. The patterns of FI cohort responses are similar in many respects to cohorts assessed in-person. Work is ongoing to further validate the FI cohort and platform, including, in particular, confirming self-reported diagnosis through direct assessment. Ongoing efforts also aim to increase recruitment of participants who traditionally do not have access to in-person research studies. By following a PD sample unprecedented in size and scope, the FI cohort can therefore serve to further our understanding of the frequency, severity, and progression of symptoms and quality of life in PD.
CONFLICT OF INTEREST
The authors have no conflict of interest to report.
Appendices
Appendix
Executive Steering Committee: Caroline M. Tanner, MD PhD1 (PI), Ethan Brown, MD1, Monica Korell1, Catherine Kopil, PhD2, Luba Smolensky2, Vanessa Arnedo2, Daisy Daeschler2, Lindsey Riley2, Connie Marras, MD PhD3, Lana Chahine, MD4, Roseanne D. Dobkin, PhD5, Ken Marek, MD6, David G. Standaert, MD, PhD7, Marissa Dean, MD7
Steering Committee: Study Core PI / Reps (below), Ninad Amondikar2, Stephen Gradinscak2, Ira Shoulson, MD8, Kevin Kwok, PharmD, Will McIntyre, Helen Rowbatham9, Madeleine Schloetter9, Paul Cannon PhD9
Study Cores:
Leadership Core: Caroline M. Tanner, MD PhD1 (Study PI), Ethan Brown1, MD, Monica Korell, MPH1
Epi Statistics Core: Chris Baglieri10 (Core PI), Amanda Christini10, Leonardo Guercio10, Mark
Hollenbeck10 Traci Schwieger11, Chelsea Caspell-Garcia11, Janel Barnes11 (2017 – 2018)
Bioinformatics Core: Arthur Toga, PhD12 (Core PI), Karen Crawford12, Scott Neu12
Data Capture / ePRO Core: Shawn Cimock13, Britt Winn13, Jesse Manning13
Psychometrics Core: Rochelle Tractenberg, PhD14, Futoshi Yumoto (2017 – 2018)
Study Collaborators: Regulatory Consultant: Emily Flagg
Affiliations:
1University of California, San Francisco & San Francisco Veterans Affairs Medical Care Plan, San Francisco, CA, USA
2The Michael J. Fox Foundation for Parkinson’s Research, New York, NY, USA 3Toronto Western Hospital, Toronto, Canada
4University of Pittsburgh, Pittsburgh, PA, USA
5Rutgers, The State University of New Jersey, Piscataway, NJ, USA
6Institute for Neurodegenerative Disorders, New Haven, CT, USA
7University of Alabama at Birmingham; Birmingham, AL, USA
8University of Rochester, Rochester, NY, USA
923and Me Inc., Mountain View, CA, USA
10Blackfynn, Philadelphia, PA, USA
11University of Iowa, Iowa City, IA, USA
12University of Southern California, Institute for Neuroimaging and Informatics, Los Angeles, CA, USA
13Mondo Robot, Boulder, CO, USA
14Georgetown University, Washington, DC, USA
ACKNOWLEDGMENTS
The Fox Insight Study is funded by The Michael J. Fox Foundation for Parkinson’s Research. We would like to thank the Parkinson’s community for participating in this study to make this research possible.
Thanks to William Macintyre and Siddhi Shrivastav for their contributions.
Data used in the preparation of this article were obtained from the Parkinson’s Progression Markers Initiative (PPMI) database (www.ppmi-info.org/data). For up-to-date information on the study, visit www.ppmi-info.org. PPMI – a public-private partnership – is funded by the Michael J. Fox Foundation for Parkinson’s Research funding partners Abbvie, Allergan, Avid Radiopharmaceuticals, Biogen, BioLegend, Bristol-Myers Squibb, Celgene, Denali, GE Healthcare, Genentech, GlaxoSmithKline, Golub Capital, Lilly, Lundbeck, Merck, Meso Scale Discovery, Pfizer, Piramal, Prevail, Roche, Sanofi Genzyme, Servier, Takeda, Teva, UCB, Verily, and Voyager Therapeutics.The full list of funding partners is found at www.ppmi-info.org/fundingpartners.
Data used in preparation of this manuscript were obtained from the PDBP Consortium, part of the NINDS at NIH.
SUPPLEMENTARY MATERIAL
[1] The supplementary material is available in the electronic version of this article: https://dx.doi.org/10.3233/JPD-191808.
REFERENCES
[1] | Willis AW , Schootman M , Evanoff BA , Perlmutter JS , Racette BA ((2011) ) Neurologist care in Parkinson disease: A utilization, outcomes, and survival study. Neurology 77: , 851–857. |
[2] | Parkinson Study Group, http://www.parkinson-study-group.org/, Accessed June 17, 2016. |
[3] | National Institute of Neurological Disorders and Stroke, http://www.neuronext.org/, Accessed June 17, 2016. |
[4] | SmolenskyL, AmondikarN, CrawfordK, NeuS, KopilC, DaeschlerM, RileyL, 23andMe Research Team, BrownE, TogaAW, TannerC, Fox Insight Collects Online, Longitudinal Patient-Reported Outcomes and Genetic Data on Parkinson’s Disease, https://www.medrxiv.org/content/10.1101/19002659v1, Accessed 8/2019. |
[5] | Pastorino S , Richards M , Hardy R , Abington J , Wills A , Kuh D , Pierce M , National Survey of Health and Development Scientific and Data Collection Teams ((2015) ) Validation of self-reported diagnosis of diabetes in the 1946 British birth cohort. Prim Care Diabetes 9: , 397–400. |
[6] | Tanner CM , Meng CC , Ravina B , Lang A , Kurlan R , Marek K , Oakes D , Seibyl J , Flagg E , Gauger L , Guest DD , Goetz CG , Kieburtz K , DiEuliis D , Fahn S , Elliott RA , Shoulson I ((2014) ) A practical approach to remote longitudinal follow-up of Parkinson’s disease: The FOUND study. Mov Disord 29: , 743–749. |
[7] | Smith B , Chu LK , Smith TC , Amoroso PJ , Boyko EJ , Hooper TI , Gackstetter GD , Ryan MA , Millennium Cohort Study Team ((2008) ) Challenges of self-reported medical conditions and electronic medical records among members of a large military cohort. BMC Med Res Methodol 8: , 37-2288-8-37. |
[8] | Patients Like Me, http://www.patientslikeme.com/, Accessed June 17, 2016. |
[9] | Wicks P , Vaughan TE , Massagli MP ((2012) ) The multiple sclerosis rating scale, revised (MSRS-R): Development, refinement, and psychometric validation using an online community. Health Qual Life Outcomes 10: , 70-7525-10-70. |
[10] | Brajovic S , Blaser DA , Zisk M , Caligtan C , Okun S , Hall M , Pamer CA ((2018) ) Validating a framework for coding patient-reported health information to the medical dictionary for regulatory activities terminology: An evaluative study. JMIR Med Inform 6: , e42. |
[11] | Bove R , Secor E , Healy BC , Musallam A , Vaughan T , Glanz BI , Greeke E , Weiner HL , Chitnis T , Wicks P , De Jager PL ((2013) ) Evaluation of an online platform for multiple sclerosis research: Patient description, validation of severity scale, and exploration of BMI effects on disease course. PLoS One 8: , e59707. |
[12] | Little M , Wicks P , Vaughan T , Pentland A ((2013) ) Quantifying short-term dynamics of Parkinson’s disease using self-reported symptom data from an Internet social network. J Med Internet Res 15: , e20. |
[13] | Fahn S , Elton R ((1987) ) The UPDRS Development Committee. Unified Pakinson Disease Rating Scale. In Recent Developments in PD, Anonymous Macmillan Healthcare Information, Florham Park, NJ, pp. 153–163. |
[14] | Dobkin R , Amondikar N , Caspell-Garcia C , Barnes J , Bataille L , Chahine L , Katz A , Kopil C , Marras C , Melnick A , Schwieger T , Siddiqi B , Smolensky L , Standaert D , Tanner C ((2019) ) Innovative recruitment strategies increase diversity of participation in the Fox Insight Longitudinal Cohort. Neurology, Program No. S16.009. |
[15] | Parkinson Progression Marker Initiative ((2011) ) The Parkinson Progression Marker Initiative (PPMI). Prog Neurobiol 95: , 629–635. |
[16] | Marek K , Chowdhury S , Siderowf A , Lasch S , Coffey CS , Caspell-Garcia C , Simuni T , Jennings D , Tanner CM , Trojanowski JQ , Shaw LM , Seibyl J , Schuff N , Singleton A , Kieburtz K , Toga AW , Mollenhauer B , Chahine LM , Weintraub D , Foroud T , Tosun-Turgut D , Poston K , Arnedo V , Frasier M , Sherer T , and the Parkinson’s Progression Markers Initiative. The Parkinson’s Progression Markers Initiative (PPMI) ((2018) ) Establishing a Parkinson’s disease biomarker cohort. Ann Clin Transl Neurol 5: , 1460–1477. |
[17] | Marras C , Alcalay RN , Caspell-Garcia C , Coffey C , Chan P , Duda JE , Facheris MF , Fernandez-Santiago R , Ruiz-Martinez J , Mestre T , Saunders-Pullman R , Pont-Sunyer C , Tolosa E , Waro B , LRRK2 Cohort Consortium ((2016) ) Motor and nonmotor heterogeneity of LRRK2-related and idiopathic Parkinson’s disease. Mov Disord 31: , 1192–1202. |
[18] | Rosenthal LS , Drake D , Alcalay RN , Babcock D , Bowman FD , Chen-Plotkin A , Dawson TM , Dewey RB Jr , German DC , Huang X , Landin B , McAuliffe M , Petyuk VA , Scherzer CR , Hillaire-Clarke CS , Sieber BA , Sutherland M , Tarn C , West A , Vaillancourt D , Zhang J , Gwinn K , PDBP consortium ((2016) ) The NINDS Parkinson’s disease biomarkers program. Mov Disord 31: , 915–923. |
[19] | National Institute for Neurological Disorders and Stroke (NINDS) Parkinson’s Disease Biomarkers Program (PDBP), pdbp.ninds.nih.gov/, Accessed 09/2013. |
[20] | Goetz CG , Tilley BC , Shaftman SR , Stebbins GT , Fahn S , Martinez-Martin P , Poewe W , Sampaio C , Stern MB , Dodel R , Dubois B , Holloway R , Jankovic J , Kulisevsky J , Lang AE , Lees A , Leurgans S , LeWitt PA , Nyenhuis D , Olanow CW , Rascol O , Schrag A , Teresi JA , van Hilten JJ , LaPelle N , Movement Disorder Society UPDRS Revision Task Force ((2008) ) Movement Disorder Society-sponsored revision of the Unified Parkinson’s Disease Rating Scale (MDS-UPDRS): Scale presentation and clinimetric testing results. Mov Disord 23: , 2129–2170. |
[21] | Jenkinson C , Fitzpatrick R , Peto V , Greenhall R , Hyman N ((1997) ) The PDQ-8: Development and validation of a short-form parkinson’s disease questionnaire. Psychol Health 12: , 805–814. |
[22] | Chaudhuri KR , Healy DG , Schapira AH , National Institute for Clinical Excellence ((2006) ) Non-motor symptoms of Parkinson’s disease: Diagnosis and management. Lancet Neurol 5: , 235–245. |
[23] | Romenets SR , Wolfson C , Galatas C , Pelletier A , Altman R , Wadup L , Postuma RB ((2012) ) Validation of the non-motor symptoms questionnaire (NMS-Quest). Parkinsonism Relat Disord 18: , 54–58. |
[24] | Weintraub D , Oehlberg KA , Katz IR , Stern MB ((2006) ) Test characteristics of the 15-item geriatric depression scale and Hamilton depression rating scale in Parkinson disease. Am J Geriatr Psychiatry 14: , 169–175. |
[25] | Stiasny-Kolster K , Mayer G , Schafer S , Moller JC , Heinzel-Gutenbrunner M , Oertel WH ((2007) ) The REM sleep behavior disorder screening questionnaire–a new diagnostic instrument. Mov Disord 22: , 2386–2393. |
[26] | Johns MW ((1991) ) A new method for measuring daytime sleepiness: The Epworth sleepiness scale. Sleep 14: , 540–545. |
[27] | Visser M , Marinus J , Stiggelbout AM , Van Hilten JJ ((2004) ) Assessment of autonomic dysfunction in Parkinson’s disease: The SCOPA-AUT. Mov Disord 19: , 1306–1312. |
[28] | Boeve BF , Molano JR , Ferman TJ , Smith GE , Lin SC , Bieniek K , Haidar W , Tippmann-Peikert M , Knopman DS , Graff-Radford NR , Lucas JA , Petersen RC , Silber MH ((2011) ) Validation of the Mayo Sleep Questionnaire to screen for REM sleep behavior disorder in an aging and dementia cohort. Sleep Med 12: , 445–453. |
[29] | Schneider MG , Swearingen CJ , Shulman LM , Ye J , Baumgarten M , Tilley BC ((2009) ) Minority enrollment in Parkinson’s disease clinical trials. Parkinsonism Relat Disord 15: , 258–262. |
[30] | Gilbert RM , Standaert DG ((2019) ) Bridging the gaps: More inclusive research needed to fully understand Parkinson’s disease. Mov Disord, doi: 10.1002/mds.27906 |
[31] | Tosserams A , Araujo R , Pringsheim T , Post B , Darweesh SKL , IntHout J , Bloem BR ((2018) ) Underrepresentation of women in Parkinson’s disease trials. Mov Disord 33: , 1825–1826. |
[32] | Dey AK , Alyass A , Muir RT , Black SE , Swartz RH , Murray BJ , Boulos MI ((2015) ) Validity of self-report of cardiovascular risk factors in a population at high risk for stroke. J Stroke Cerebrovasc Dis 24: , 2860–2865. |
[33] | Sediq R , van der Schans J , Dotinga A , Alingh RA , Wilffert B , Bos JH , Schuiling-Veninga CC , Hak E ((2018) ) Concordance assessment of self-reported medication use in the Netherlands three-generation Lifelines Cohort study with the pharmacy database iaDB.nl: The PharmLines initiative. Clin Epidemiol 10: , 981–989. |
[34] | Haukka J , Suvisaari J , Tuulio-Henriksson A , Lonnqvist J ((2007) ) High concordance between self-reported medication and official prescription database information. Eur J Clin Pharmacol 63: , 1069–1074. |
[35] | Halsband C , Zapf A , Sixel-Doring F , Trenkwalder C , Mollenhauer B ((2018) ) The REM Sleep Behavior Disorder Screening Questionnaire is not valid in de novo Parkinson’s disease. Mov Disord Clin Pract 5: , 171–176. |
[36] | Adler CH , Beach TG , Hentz JG , Shill HA , Caviness JN , Driver-Dunckley E , Sabbagh MN , Sue LI , Jacobson SA , Belden CM , Dugger BN ((2014) ) Low clinical diagnostic accuracy of early vs advanced Parkinson disease: Clinicopathologic study. Neurology 83: , 406–412. |
[37] | Foltynie T , Matthews FE , Ishihara L , Brayne C , MRC CFAS ((2006) ) The frequency and validity of self-reported diagnosis of Parkinson’s Disease in the UK elderly: MRC CFAS cohort. BMC Neurol 6: , 29-2377-6-29. |
[38] | Hughes AJ , Daniel SE , Ben-Shlomo Y , Lees AJ ((2002) ) The accuracy of diagnosis of parkinsonian syndromes in a specialist movement disorder service. Brain 125: , 861–870. |
[39] | Schrag A , Ben-Shlomo Y , Quinn N ((2002) ) How valid is the clinical diagnosis of Parkinson’s disease in the community? J Neurol Neurosurg Psychiatry 73: , 529–534. |
[40] | Schneider R , Myers T , Anthwal S , Kayson E , Omberg L , Tarolli C , Daeschler M , Macklin E , Dorsey E , Mangravite L , Schwarzschild M , Simuni T ((2019) ) Assessing tele-health outcomes in multiyear extensions of Parkinson’s disease trials (AT-HOME PD): Initiation of a long-term observational study. P081. Presented at XXIV World Congress on Parkinson‘s Disease and Related Disorders Montreal, Canada. 16–19 June. |


