
Senescence and Inflammatory Markers for Predicting Clinical Progression in Parkinson’s Disease: The ICICLE-PD Study
Abstract
Background:
Cognitive decline is a frequent complication of Parkinson’s disease (PD) and the identification of predictive biomarkers for it would help in its management.
Objective:
Our aim was to analyse whether senescence markers (telomere length, p16 and p21) or their change over time could help to better predict cognitive and motor progression of newly diagnosed PD patients. We also compared these senescence markers to previously analysed markers of inflammation for the same purpose.
Methods:
This study examined the association of blood-derived markers of cell senescence and inflammation with motor and cognitive function over time in an incident PD cohort (the ICICLE-PD study). Participants (154 newly diagnosed PD patients and 99 controls) underwent physical and cognitive assessments over 36 months of follow up. Mean leukocyte telomere length and the expression of senescence markers p21 and p16 were measured at two time points (baseline and 18 months). Additionally, we selected five inflammatory markers from existing baseline data.
Results:
We found that PD patients had shorter telomeres at baseline and 18 months compared to age-matched healthy controls which also correlated to dementia at 36 months. Baseline p16 levels were associated with faster rates of motor and cognitive decline over 36 months in PD cases, while a simple inflammatory summary score at baseline best predicted cognitive score over this same time period in PD patients.
Conclusion:
Our study suggests that both inflammatory and senescence markers (p16) are valuable predictors of clinical progression in PD patients.
INTRODUCTION
It is well established that the cumulative incidence of dementia associated with Parkinson’s disease (PD) is approaching 80% [1–3] and individuals with PD are five to six times more likely to develop cognitive impairment than age-matched controls [4]. Dementia limits the effective medical and surgical management of motor features of PD and is associated with increased mortality [5], reduced quality of life [6] and greater caregiver distress [7].
The causes for dementia in PD (PDD) are heterogeneous, complex and not fully understood. The development of biological markers that could identify those at highest risk of early cognitive decline would enhance our understanding of disease progression and give valuable insights into the underlying pathophysiological mechanisms.
Telomeres are protective structures at chromosomal ends. Telomere shortening and dysfunction cause cellular senescence [8]. Importantly, telomeres are susceptible to oxidative stress [9] and can be indicators of ongoing disease processes in the brain. We have previously shown that short leukocyte telomeres predict the development of cognitive decline and vascular dementia in stroke patients [10]. However, contradicting results exist regarding a possible correlation between telomere length in leukocytes and PD [11–13].
We hypothesised that accelerated telomere shortening in the early stages of PD may predict cognitive decline. This is based on the findings that in individuals without dementia, performance on specific subsets of cognitive tests correlates positively with leukocyte telomere length [14, 15], and cognitive decline over time is slower in subjects with longer telomeres [16, 17]. Studies assessing the association between blood telomere length and incident dementia yielded variable and contradicting results [18–20]. Similarly, for PD there are conflicting results on the association between telomere length and PD incidence [12, 13, 21, 22] or progression towards cognitive decline and dementia [23–26]. A recent meta-analysis concluded that there was no association between leukocyte telomere length and incidence of PD [11]. However, the relationship between telomere length or telomere attrition rates and the progression of motor and cognitive aspects of PD has not been extensively investigated.
Cellular senescence is a response to stress (including shortened or damaged telomeres) characterized by an irreversible cell cycle arrest, a pro-inflammatory secretory phenotype and a number of not entirely specific tumour-suppressor proteins, including the cyclin-dependent kinase inhibitors p21CIP1Waf1 and p16INK4A [27]. A meta-analysis of more than 300 genome wide association studies (GWAS) identified the p16INK4a gene to be linked to the highest number of age-associated pathologies, including several types of cardiovascular diseases, diabetes, glaucoma and AD [28]. Consequently, p16 and p21 have been investigated as cell senescence-associated biomarkers of ageing [29, 30]. Brain ageing, neurodegeneration and neuroinflammation are associated with cellular senescence of astrocytes, oligodendrocytes, microglia and neurons [31–34]. In mice as well as in humans, the neuronal accumulation of neurofibrillary tangles associated with cognitive decline and neuronal loss in Alzheimer’s disease causes a cellular senescence phenotype in the affected neurons [35]. In a tau-related mouse model, specific eradication of senescent cells improved cognition and decreased neurodegeneration [36]. In humans, the potential of both p16 and p21 expression as biomarkers of ageing and age-related diseases has previously been explored [37–39] although not yet in the context of PD.
A previous study on the Incidence of Cognitive Impairments in Cohorts with Longitudinal Evaluation-Parkinson’s Disease (ICICLE-PD) concluded that the serum inflammatory marker profile measured at the time of diagnosis is associated with subsequent rate of disease progression [40]. A pro-inflammatory cytokine profile was associated with more rapid motor decline as defined by changes in UPDRS-III score over 36 months of follow-up, as well as lower cognitive scores, whereas an anti-inflammatory profile was associated with stable motor function over time and better cognition [40]. Given the close inter-connection between oxidative stress, cell senescence and inflammation as the main drivers of the ageing process and contributors to age-related diseases [41, 42], our aim was to determine whether there is an association between markers of cell senescence and cognitive and motor function in PD patients over the first three years of their disease. For this purpose, we analysed telomere dynamics and senescence modulators in newly diagnosed patients and controls from the ICICLE-PD cohort and combined this with existing data on baseline inflammatory markers to explore the relevance of these factors as predictors of cognitive and motor impairment over a period of 36 months from baseline. We hypothesised that increased senescence and inflammation at baseline would predict faster cognitive decline during disease progression in the early stages of disease.
MATERIALS AND METHODS
Participants and clinical evaluation
Details of the recruitment protocol for the study have been published [6, 43, 44]. Participants were recruited as part of the ICICLE-PD study between June 2009 and December 2011. They included newly diagnosed PD patients (N = 154) from the community and outpatient clinics, as well as unrelated age and gender—matched control subjects (N = 99) from Newcastle upon Tyne and Gateshead, United Kingdom. All patients fulfilled Queen Square Brain Bank Criteria for idiopathic PD [45] and were diagnosed by a movement disorder specialist. Global assessment of cognitive function included the Mini-Mental State Examination (MMSE) [46] and Montreal Cognitive Assessment (MoCA) [47]. Exclusion criteria have been described previously [43]. The study received ethical approval from The Newcastle and North Tyneside Research Ethics Committee and written informed consent was received from all subjects.
Participants were evaluated at 18-month intervals. At each assessment, demographic, cognitive and clinical data were collected as well as blood samples. For the clinical assessment, a semi-structured interview collected information on areas such as symptom history, level of education and comorbid disease. Motor severity was assessed using the Movement Disorder Society Unified Parkinson’s Disease Rating Scale (MDS-UPDRS) Part III [48] and the Hoehn and Yahr (HY) scale [49]. Data on medication usage included levodopa equivalent daily dose (LEDD) at the time of recruitment [50]. Mild Cognitive Impairment (PD-MCI) was assessed using modified MDS Level 2 criteria [51], whereby PD-MCI was classified using 1.5 SDs below normative values [44].
Blood sample collection
For inflammatory markers, venous blood samples were collected in plain tubes, allowed to clot for 15 min at room temperature, and then centrifuged at 2000 rpm for 15 min. Serum was removed and stored in 200μL aliquots at –80°C until assays were performed. For the isolation of DNA, blood samples were collected using EDTA vacutainers (Becton Dickinson, BD Diagnostics, Oxford, UK). For the isolation of RNA, blood samples were collected in PAXgene Blood RNA Tubes (PreAnalytiX, Qiagen, UK). The collection tubes were stored at –80°C.
Nucleic acid isolation
DNA was extracted from peripheral blood using standard phenol/chloroform techniques. DNA sample concentration and quality was assessed by Quant-It™Picogreen® (ThermoFisher Scientific, USA) and stored at –80°C.
RNA isolation was performed using the PAXgene Blood RNA Kit (PreAnalytiX, Qiagen UK) according to the manufacturer’s instructions. The final elution volume was 50μl and the quantity and quality of the RNA was assessed by Nanodrop (ND-1000, Thermo Fisher Scientific, USA) followed by storage at –80°C.
Telomere length measurement
Telomere length (TL) was measured using a previously published quantitative PCR (qPCR) method with modifications [52]. Briefly, the relative abundance of telomeric template (T) versus a single copy gene (36B4) (S) was estimated by PCR on 10 ng of DNA, with 5ul SYBR®Green JumpStart Taq Ready Mix and 0.25μl of ROX reference dye (Sigma-Aldrich, UK) and the following primers: 300 nM TelA (5′-CGG TTT GTT TGG GTT TGG GTT TGG GTT TGG GTT TGG GTT-3′); 900 nM TelB (5′-GGC TTG CCT TAC CCT TAC CCT TAC CCT TAC CCT TAC CCT-3′) for the telomeric reaction and 200 nM 36B4F (5′-CAG CAA GTG GGA AGG TGT AAT CC 3′) and 400 nM 36B4R (5′-CCC ATT CTA TCA TCA ACG GGT ACA A-3′) for 36B4. All samples were assessed in triplicate and all PCRs were carried out on an Applied Biosystems 7900HT Fast Real Time PCR system with 384-well plate capacity. Telomere length measurements are expressed as T/S ratio. Three internal control DNA samples of known telomere length (10.4 kb, 3.9 kb, and 2 kb) were run within each plate to correct for plate-to-plate variation. As a further authentication of our telomere length measurements, we performed a revaluation of those samples that were in either the top or bottom 5% of the telomere length distribution as well as those samples that gave no valid data on the first run. The intra-assay coefficient of variation was 2.7% while the inter-assay coefficient of variation was 5.1%. DNA samples were available to perform telomere length measurements at baseline and at 18-month follow-up visit.
Expression of p16 and p21
The quantification of expression levels of p21 and p16 was performed by RT-qPCR analysis on an Applied Biosystems 7900HT Fast Real Time PCR system with 384-well plate capacity, with 500 ng of RNA converted into cDNA by means of the qScript cDNA synthesis kit (Quanta Biosciences, Beverley, MA, USA) on a 20μl reaction that included 1ul of qScript reverse transcriptase. The reaction comprised 5 min at 22°C, 30 min at 42°C and 5 min at 85°C. This was followed by qPCR on p16 and p21 with PGK1 as reference gene: the 15μl reactions included 2μl of cDNA, 7.5μl of Applied Biosystems Power SYBR™ Green PCR Master Mix (ThermoFisher Scientific, Waltham, MA, USA) and 300 nM for both forward and reverse primers for the respective reactions: p16-1 5′-GCCCAACGCACCGAATAGTT -3′ and p16-2 5′-CACGGGTCGGGTGAGAGT -3′; p21-F 5′-GCAGACCAGCATGACAGATTT -3′ and p21-R 5′-GGATTAGGG CTTCCTCTTGGA -3′; and PGK1-1 5′-TTAAAGGGAAGCGGGTCGTT -3′ and PGK1-2 5′-GCAGCCTTAATCCT CTGGTTGT -3′. For each sample, all three qPCR reactions (p21, p16 and PGK1) were performed in triplicate and on the same plate. The thermo-cycling programme included 10 min at 95°C and 45 cycles on 15s at 95°C and 30s at 60°C as well as a melting curve analysis. Each plate included an Internal Control cDNA sample to correct for plate-to-plate variations. The intra-assay % CV for the p16, p21 and PGK1 qPCR reactions were 0.60%, 0.65%, and 0.91%, respectively, while the inter-assay % CV for the p16, p21 and PGK1 qPCR reactions were 3.80%, 2.55%, and 3.82%, respectively. Values of expression levels for p16 and p21 were calculated by the formula 2–ΔΔCt on the differences on threshold cycle for p16 or p21 against PGK1 and for the samples against those obtained for the internal control. RNA samples were available to perform p21 and p16 gene expression measurements at baseline and at 18-month follow-up visit.
Inflammatory markers
Measurement of inflammation-related markers on serum samples from this cohort has been previously performed and reported [40]. Briefly, markers were measured on serum samples collected at baseline, using MesoScale Discovery (Rockville) electrochemiluminescent immunoassays, including the V-PLEX human pro-inflammatory panel 1 (IFN-γ, IL-1β, IL-2, IL-4, IL-6, IL-8, IL-10, IL-12p70, IL-13, and TNF-α), and V-PLEX human CRP. All samples were run in duplicate and as per the manufacturer’s protocol [40] which yields the following values for the inflammatory markers considered in our analysis: Inter- assay % CVs for CRP: 7.2%; TNF-alpha: 7.4%; IL–6:6.8%; IL–10:7.9% and IFN-gamma: 8.2%. Intra-assay % CVs for CRP: 2.2%; TNF-alpha: 2.4%; IL–6:3.9%; IL–10:3.1% and IFN-gamma: 3.8%. Lower Limit of Detection for CRP: 1.33 pg/ml; TNF-alpha: 0.04 pg/ml; IL–6:0.06 pg/ml; IL–10:0.04 pg/ml and IFN-gamma: 0.37 pg/ml. From this existing data set, five pro-inflammatory markers (TNF-alpha, IFN-gamma, CRP, IL-6 and IL-10) were selected because they had the strongest loadings on the pro-inflammatory component scores in our previous principal component analysis (PCA) in this ICICLE-PD dataset [40]. In this study we sought to validate the findings of Williams-Gray et al. [40] but through the use of a smaller number of parameters combined into a simple composite score, which does not require a PCA-based approach.
Statistical analyses
Statistical analyses were performed with SPSS 19.0 (SPSS, Chicago, IL). Data were examined for normality of distribution (Shapiro-Wilk test and Q-Q plots). Baseline characteristics are expressed as the median [Interquartile Range] or as percentages. The demographic characteristics of our participants were analysed by either an Independent samples Mann-Whitney U test (for continuous variables) or Pearson Chi-square test (for categorical variables). The percentage of participants for which data were unavailable (either because the clinical information was not acquired or because the suitable blood samples were not collected) appear in the column “Missing”. Because of their lack of normal distribution, data were analysed by Spearman’s rank correlation coefficient (for correlations between blood-related biomarkers of senescence and outcome measures, correlations were adjusted for age, gender and baseline LEDD) and Mann-Whitney U tests (for comparisons between Parkinson disease and control participants). Pearson-Chi squared tests were used to compare categorical data. Results were considered statistically significant at a p value of <0.05 and two-sided tests were applied.
Composite variables were calculated as detailed below:
- Telomere length change per month:
A more negative value of this variable indicates faster telomere shortening.
- p21 expression change per month:
A more positive value for this variable reflects a transition to a more senescent phenotype.
- p16 expression change per month:
A more positive value for this variable reflects a transition to a more senescent phenotype.
- Inflammatory score: it was generated from the sum of the Z-scores for the inflammatory parameters offering the most comprehensive dataset: CRP, TNF-alpha, IL-6, IL-10 and Interferon-gamma (IFN-gamma).
- Monthly change rate of cognitive and clinical PD scores:
For MMSE and MoCA, a more negative value represents a greater decline in cognition. Conversely, scores for clinical features (MDS-UPDRS-III and H&Y) increase with severity and therefore a larger positive value of the rate of change represents a more rapid worsening of their clinical condition. In order to be able to identify as many significant comparisons as possible while still maintaining a low false positive rate we have applied the Benjamini-Hochberg multiple comparisons correction with a 5% false discovery rate.
We used Linear Regression models to assess the relative value of our biomarker variables to predict the changes with time (36 months) in cognitive and motor parameters in our PD participants only. These analyses were adjusted for age, gender, BMI and baseline LEDD. We used baseline predictors of cognitive change and therefore did not account for increase in LEDD between baseline and 36 months in this analysis. A previous publication from our group had demonstrated that LEDD did significantly increase over time, however, it was not associated with change in cognitive scores [53].
RESULTS
Study demographics
The demographic characteristics of our study group at baseline (99 controls and 154 PD patients) are described in Table 1. The table shows the study groups were well matched for most of the demographic and clinical characteristics. The group of PD participants presented a significantly lower alcohol consumption, higher proportion of cases with previous history of stroke or ischaemic attack and, as anticipated, higher presence of MCI, lower MoCA scores and higher Geriatric Depression Scale (GDS) scores.
Table 1
Baseline clinical characteristics of the study cohort
| Parkinson’s Disease | Controls | ||||
| N = 154 | N = 99 | ||||
| Missing | Missing | p | |||
| Age (Years, Median [IQR]) | 67.02 [60.28,81.50] | – | 67.98 [63.34,82.15] | – | |
| Gender (% Women) | 35.06% | – | 45.45% | – | |
| Body Mass Index (Median [IQR]) | 26.50 [23.80,35.60] | 1.30% | 27.70 [24.70,34.50] | 2.02% | |
| Smoking (% Never smoked) | 55.19% | – | 50.51% | – | |
| Age when leaving education (Years, Median [IQR]) | 16.00 [15.00,25.00] | – | 17.00 [15.00,23.00] | – | |
| Number of units of alcohol consumed per week (Median [IQR]) | 3.50 [0.00,24.00] | – | 6.00 [1.00,60.00] | – | p = 0.019a |
| Ischemic heart disease (%) | 11.04% | – | 9.09% | – | |
| Type II diabetes (%) | 7.79% | – | 5.05% | – | |
| Hypertension (%) | 31.17% | – | 35.35% | – | |
| Hypercholesterolaemia (%) | 11.69% | – | 20.20% | – | |
| Stroke/Transient Ischaemic Attack (%) | 7.14% | – | 0.00% | – | p = 0.007b |
| Anti-inflammatory medication (%) | 33.33% | 12.34% | 33.33% | 6.06% | |
| Comorbidity (CIRS System Score, Median [IQR]) | 2.00 [1.00,5.00] | 12.34% | 3.00 [2.00,6.00] | 6.06% | |
| Mild Cognitive Impairment (%) | 43.26% | 8.44% | 22.22% | – | p < 0.001b |
| Mini-Mental State Examination Score (Median [IQR]) | 29.00 [28.00,30.00] | – | 29.00 [28.00,30.00] | – | p = 0.006a |
| Montreal Cognitive Assessment (Median [IQR]) | 26.00 [23.00,30.00] | 9.74% | 27.00 [26.00,30.00] | 2.02% | p < 0.001a |
| Geriatric Depression Scale (Median [IQR]) | 2.00 [1.00,8.00] | – | 1.00 [0.00,4.00] | – | p < 0.001a |
| National Adult Reading Test (Median [IQR]) | 117.00 [108.50,127.00] | 1.30% | 118.00 [111.00,126.00] | – | |
| Survival at 36months Follow-up (%) | 94.81% | – | 97.98% | – | |
| Disease Duration at Enrolment (Years, Median [IQR]) | 0.39 [0.21,1.32] | – | – | – | |
| MDS-UPDRS-III (Median [IQR]) | 26.00 [17.00,47.00] | – | – | – | |
| Hoehn and Yahr Score (HY) (Median [IQR]) | 2.00 [2.00,3.00] | – | – | – | |
| Parkinson’s disease medication (%) | 87.66% | – | – | – | |
| On Levodopa treatment (%) | 29.22% | – | – | – | |
| Levodopa equivalent daily dose (mg/l) (Median [IQR]) | 140.00 [100.00,450.00] | – | – | – | |
| Monoamine oxidase B inhibitors medication (%) | 47.40% | – | – | – | |
| Dopamine agonist medication (%) | 37.01% | – | – | – | |
aIndependent-Samples Mann-Whitney U Test; bPearson Chi-square test.
Biomarkers of senescence and PD
We measured three biomarkers of cell senescence: expression levels of p21 and p16 as well as telomere length, at baseline, and again at 18 months, which allowed for calculation of monthly rates of change (Table 2).
Table 2
Biomarkers: comparison of controls and PD patients
| Parkinson’s Disease | Controls | ||||
| N = 154 | N = 99 | ||||
| Median [IQR] | Missing | Median [IQR] | Missing | p | |
| Telomere length (TL) Baseline (T/S ratio) | 0.78 [0.63,0.91] | 20.78% | 1.03 [0.81,1.31] | 22.22% | p < 0.001a |
| TL change/month† | –0.020 [–0.028,–0.013] | 20.78% | –0.012 [–0.023,–0.006] | 22.22% | p = 0.002a |
| p21 Baseline (A.U.) | 1.16 [0.83,1.73] | 6.49% | 1.62 [1.01,2.43] | 6.06% | p < 0.001a |
| p21 change/month | 0.002 [–0.028,0.046] | 20.78% | –0.006 [–0.044,0.036] | 23.23% | |
| p16 Baseline (A.U.) | 1.24 [0.77,1.92] | 6.49% | 1.41 [0.94,1.97] | 5.05% | |
| p16 change/month | 0.005 [–0.031,0.045] | 20.78% | –0.001 [–0.032,0.043] | 23.23% | |
| CRP (ng/ml) | 1.63 [0.66,3.48] | 12.34% | 1.83 [0.73,3.59] | 6.06% | |
| TNF alpha (pg/ml) | 2.98 [2.45,3.62] | 12.34% | 1.67 [1.39,2.11] | 6.06% | p < 0.001a |
| IL-6 (pg/ml) | 0.64 [0.43,0.99] | 13.64% | 0.60 [0.42,0.81] | 6.06% | |
| IL-10 (pg/ml) | 0.24 [0.17,0.35] | 16.23% | 0.19 [0.13,0.27] | 12.12% | p = 0.002a |
| IFNg (pg/ml) | 5.92 [4.11,8.80] | 12.34% | 5.80 [4.32,9.03] | 6.06% | |
| Inflammatory score | 0.01 [–0.84,1.26] | 17.53% | –1.26 [–1.85,–0.17] | 12.12% | p < 0.001a |
aIndependent-Samples Mann-Whitney U test significant after Benjamini-Hochberg multiple test correction. †For this composite variable, larger value = lower telomere shortening rate, see text.
After applying Benjamini-Hochberg correction for multiple comparisons, PD participants had significantly shorter telomere length at baseline compared to controls (p < 0.001) as well as significantly faster shortening of their telomeres over the first 18 month period (p = 0.002) (Table 2, Fig. 1). PD participants displayed significantly lower levels of p21 expression than controls at baseline (p < 0.001), but there was no difference in change with time (Table 2, Supplementary Figure 1a). For p16 expression, the differences between PD and controls at baseline or the rate of change per month of p16 expression levels did not reach statistical significance (Table 2, Supplementary Figure 1b).
Fig.1
Telomere length at baseline and 18 months (A) and telomere shortening (given as change per months) over 18 months (B) in controls and Parkinson’s disease patients. Each category box plot includes the median (—), the range of data within the first and third quartiles (box), the range of data within the first and ninth deciles (whiskers) and the outliers falling outside of the latter (°). aStatistically significant using the Mann-Whitney U Test.

Inflammatory markers at baseline and PD
We considered five inflammatory markers, both individually and as a composite inflammatory score (Table 2). PD participants had significantly higher levels of TNF-alpha (p < 0.001) and IL-10 (p = 0.002) compared to controls. Overall, the baseline composite inflammatory score was markedly different between both groups, with a significant difference (p < 0.001) between PD and controls (Table 2).
Biomarkers of senescence and inflammation: MCI at baseline
We examined whether our potential biomarkers were associated with MCI status. For the PD group (Table 3), of the five inflammatory markers considered, levels of CRP and IL-6 were significantly raised (p-values 0.015 and 0.003, respectively) in PD-MCI cases compared to those without cognitive impairment, and the composite inflammatory score of PD-MCI participants at baseline was significantly higher (p = 0.006) (Table 3). We found p21 expression levels also higher in cognitively normal participants than in those with PD-MCI at baseline (p = 0.012). No significant difference was found for telomere length or p16 expression in relation to PD-MCI (Table 3). In the case of participants from the control group, the presence of MCI did not result in significantly different levels of any of the senescence or inflammatory biomarkers (data not shown).
Table 3
Biomarkers and MCI at baseline in PD participants
| Cognitively Normal | MCI at Baseline | ||||
| N = 80 | N = 61 | p | |||
| Median [IQR] | Missing | Median [IQR] | Missing | ||
| TL Baseline (T/S ratio) | 0.77 [0.58,0.90] | 21.25% | 0.79 [0.64,0.93] | 22.95% | |
| p21 Baseline (A.U.) | 1.34 [0.93,1.98] | 6.25% | 1.03 [0.74,1.49] | 4.92% | p = 0.012a |
| p16 Baseline (A.U.) | 1.14 [0.74,1.74] | 6.25% | 1.29 [0.77,1.80] | 4.92% | |
| CRP (ng/ml) | 1.10 [0.41,2.85] | 12.50% | 2.20 [0.82,5.26] | 14.75% | p = 0.015a |
| TNF alpha (pg/ml) | 2.74 [2.21,3.41] | 12.50% | 3.25 [2.51,3.78] | 14.75% | |
| IL-6 (pg/ml) | 0.58 [0.36,0.87] | 15.00% | 0.78 [0.58,1.34] | 14.75% | p = 0.003a |
| IL-10 (pg/ml) | 0.23 [0.17,0.35] | 17.50% | 0.26 [0.17,0.39] | 16.39% | |
| IFNg (pg/ml) | 5.78 [4.18,8.04] | 12.50% | 6.46 [4.88,11.23] | 14.75% | |
| Inflammatory score | –0.27 [–0.89,0.54] | 20.00% | 0.51 [–0.44,2.24] | 16.39% | p = 0.006a |
aIndependent-Samples Mann-Whitney U test significant after Benjamini-Hochberg multiple test correction. †For this composite variable, larger value = lower telomere shortening rate, see text.
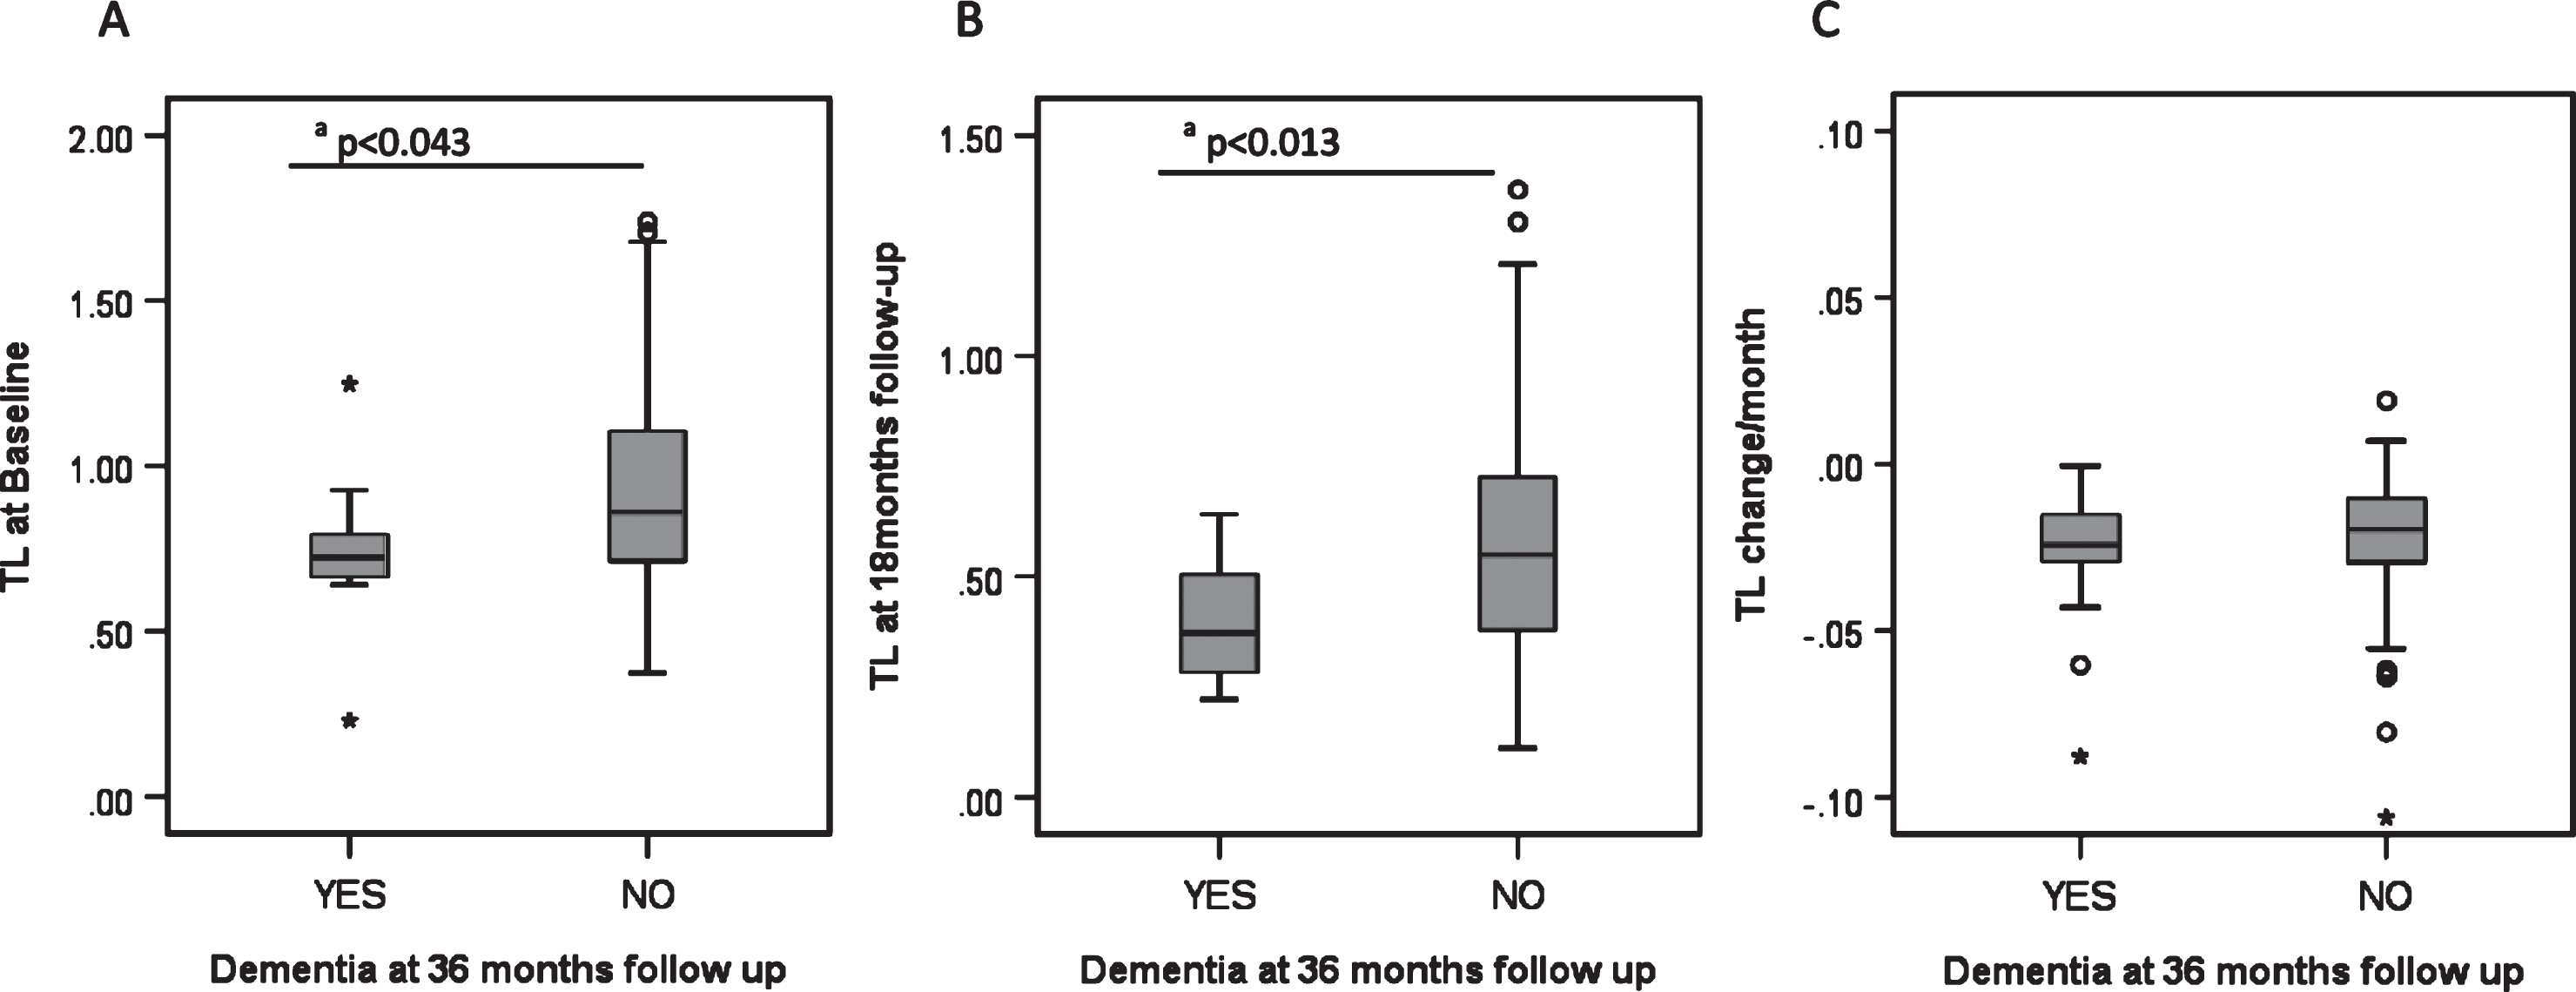
Biomarkers of senescence and inflammation: Dementia incidence at 36 months
Over the 36 month follow-up period, 15.5% (N = 11) of PD patients developed PDD. These participants had significantly shorter telomeres at baseline and 18 months than those who did not develop PDD (Fig. 2) but there were no significant differences for p21, p16 or inflammatory score at baseline or 18 months follow-up (data not shown).
Fig.2
Biomarkers and development of dementia in PD. A) Telomere length at baseline and its relationship to PD dementia at 36 months. B) Telomere length at 18 month follow-up and its relationship to PD dementia at 36 months. C) Telomere length shortening per month and its relationship to PD dementia at 36 months. Each category box plot includes the median (—), the range of data within the first and third quartiles (box), the range of data within the first and ninth deciles (whiskers) and the outliers falling outside the latter (° = Outlier, * = Extreme Outlier). aStatistically significant using the Mann-Whitney U Test.
Biomarkers of senescence and inflammation as predictors of cognitive and motor changes over time
We first examined the associations between senescence and inflammatory markers at baseline with cognition (MMSE and MoCA) and motor severity (MDS-UPDRS-III) at both baseline and 36 months by Spearmann’s Rank correlation analysis, and found correlations between senescence and inflammation markers and multiple clinical variables in PD patients (Supplementary Table 1). We analysed the predictive power of baseline biomarkers further by linear regression (Table 4). For the assessment of motor impairment, we regarded HY scores as a binary variable with a threshold of 3 (a score of 3 or above is indicative of postural instability). We considered both baseline, 36 months and the change between them and tested associations of baseline biomarkers of senescence and inflammation to these scores (data not shown). This was followed by a logistic regression model to determine whether our biomarkers at baseline would distinguish PD participants reaching HY stage 3 or above at the 36 month follow-up time and/or whether they discriminated between participants whose motor function improved or worsened over this period of time (Table 5). Neither TL nor p21 expression significantly predicted clinical scores or their change over 36 months (Tables 4 and 5). Paradoxically, higher p16 expression levels at baseline predicted slower motor progression (change of MDS-UPDRS-III score) over the next 36 months, independently of age and gender, baseline LEDD and BMI (beta = –0.218; p = 0.0149) (Table 4) and remained significant after adjusting for inflammatory score (beta = –0.226; p = 0.019, data not shown). In addition, higher p16 expression levels at baseline predicted slower cognitive decline (MoCA score change rate) over 36 months, independently of age, gender, baseline LEDD and BMI (beta = 0.311; p = 0.003) (Table 4). This association again remained significant after adjusting for inflammation (beta = 0.399; p < 0.001, data not shown).
Table 4
Linear regression modelling on biomarkers and disease progression in Parkinson’s disease participants*
| Baseline Biomarkers | TL (T/S ratio) | p21 expression (A.U.) | p16 expression (A.U.) | Inflammatory Score | |||||
| Beta | p value | Beta | p value | Beta | p value | Beta | p value | ||
| MDS-UPDRS-III | at 36 months | –0.068 | 0.477 | 0.021 | 0.811 | –0.175 | 0.051 | 0.174 | 0.079 |
| change rate over 36 months | –0.020 | 0.832 | 0.110 | 0.216 | –0.218 | 0.014 | –0.004 | 0.970 | |
| MMSE | at 36 months | 0.149 | 0.134 | –0.009 | 0.922 | 0.080 | 0.409 | –0.068 | 0.512 |
| change rate over 36 months | 0.043 | 0.682 | –0.031 | 0.751 | 0.120 | 0.231 | 0.116 | 0.287 | |
| MoCA | at 36 months | 0.106 | 0.262 | 0.008 | 0.934 | 0.080 | 0.389 | –0.205 | 0.037 |
| change rate over 36 months | 0.066 | 0.560 | –0.070 | 0.516 | 0.311 | 0.003 | 0.055 | 0.653 | |
*All models adjusted for age, gender, baseline LEDD and BMI.
Table 5
Logistic Regression modelling on biomarkers and motor impairment (HY 3 or above) at 36 months follow-up
| Baseline Biomarkers | TL (T/S ratio) | p21 expression (A.U.) | p16 expression (A.U.) | Inflammatory Score | ||||||
| O.R. | p value | O.R. | p value | O.R. | p value | O.R. | p value | |||
| Motor Impairment | at 36 monthsa | 0.217 | 0.273 | 1.000 | 0.698 | 0.988 | 0.831 | 1.006 | 0.939 | |
| Change over 36 monthsb | Motor Improvement | 0.383 | 0.534 | 0.415 | 0.171 | 0.995 | 0.805 | 1.086 | 0.367 | |
| Motor Impairment | 0.535 | 0.748 | 1.000 | 0.941 | 0.471 | 0.288 | 1.110 | 0.374 | ||
O.R., Odds Ratio; aBinary Logistic Regression. bMultinomial Logistic Regression. Reference category: No Change from Baseline to 36 months follow-up; Motor Improvement: from HY≥3 to HY < 3; Motor Impairment: from HY < 3 to HY≥3. All models adjusted for age, gender, baseline LEDD and BMI.
The baseline composite inflammatory score was only predictive of MoCA score (beta = –0.205, p = 0.037) at 36 months (Table 4), independently of age, gender, BMI and LEDD, but not for the rate of change for any clinical indicator over the follow-up period. None of our candidate baseline biomarkers of senescence and inflammation significantly predicted MMSE score (Table 4) or motor function (Table 5) either at 36 months or as rate of change over 36 months.
DISCUSSION
This study included newly diagnosed PD patients at a very early stage of disease, and an age matched control cohort, who were followed up every 18 months to 36 months, and where we had baseline measures of senescence and inflammation. We considered several markers that have been associated with ageing and cellular senescence including telomere length, p21 and p16 expression levels as well as markers of inflammation. Our aim was to test the hypothesis that increased senescence and inflammation at baseline would drive a faster cognitive and motor decline.
Senescence markers
We measured the association of three potential markers of cell senescence—telomere length, p16 and p21 expression in peripheral blood mononuclear cells (PBMCs) with PD status and progression. We found that telomere length at baseline discriminated well between PD patients and age-matched controls, in line with some previous cross-sectional studies [21–23, 25], but conflicting with others [12, 13, 24, 26]. A previous meta-analysis suggested no telomere length differences overall, although there were large discrepancies on size and gender distributions of the cohorts included as well as in the types of tissues sampled [11]. Nevertheless, we also showed a similar difference at 18 months follow-up, with faster rates of telomere shortening in PD participants. This is in contrast to a recent study [23] that did not find different telomere attrition rates between baseline and 36 months for controls and PD patients. While both PD cohorts were very similar in terms of HY and MDS-UDPRS-III scores at baseline, our cohort was slightly younger (about 3 years), with shorter disease duration at baseline and, importantly, larger. Importantly, we found shorter telomeres at baseline in those PD patients who went on to develop an early dementia. These patients showed no differences in p21 or p16 gene expression levels, or inflammatory score compared to those who did not develop dementia. Unfortunately, the small number of incident PDD cases in our study precluded a meaningful regression analysis of the predictive power of telomere length for PDD. However, the relationship between shorter telomeres in peripheral blood cells and incident dementia has been reported in the general population [19], in stroke [10], AD [54, 55], Down’s syndrome [56] and in the transition from MCI to dementia [57]. Consequently, our results suggest that short telomeres may have predictive potential for the development of PDD.
Our results for p21 and p16 were less in line with expectations. The known role of p21 and p16 in cell senescence suggested their relevance as biomarkers of ageing [37, 58]. However, there are few studies on their links to human neurodegeneration [59]. It has been shown previously that p16 in brain neurons and astrocytes increases with ageing and neurodegeneration in mice and that various other senescence markers increase in neurons of ageing mice [33, 36]. Importantly, eradication of senescent cells in a mouse model for PD resulted in better motor function, suggesting a therapeutic benefit [60]. In addition, regional PD-specific white matter alterations have been correlated with increased peripheral leukocyte apoptosis and systemic inflammation [61].
However, we found no significant differences between PD and controls for p16 expression at any time point and, contrary to expectations, a lower p21 expression level in PD patients at baseline compared to controls. Moreover, PD patients who presented with MCI at recruitment had lower p21 baseline expression levels than those who were cognitively normal. Similarly, low levels of p16 at baseline were robustly associated with faster disease progression. These observations add to existing evidence suggesting that the association of senescence of blood cells with neurodegenerative diseases might not be as simple as originally thought. In particular, our own previous immuno-phenotyping studies showed a reduction of ‘late senescent’ CD8+ T cells (identified as CD28loCD57hi) in PD cases versus controls [62]. Furthermore, in AD patients monocytic p21 protein levels were decreased compared to control individuals [59]. Hence it is possible that a more activated, less senescent immune system might contribute to neurodegeneration.
This study was limited in terms of available samples such that we were not able to measure protein levels in PBMCs. A previous small study of p21 protein levels in PBMCs did not find significant differences between PD patients and controls for either total p21 protein or its phosphorylated form p21(Thr145) [63]. However, the authors found that phosphorylated Ser15 p53 and Thr145- phosphorylated p21 proteins were significantly increased in blood samples from 10 AD cases compared to controls. Thus, it is possible that only phosphorylated p21 is increased during certain neurodegenerative diseases, while total p21 protein levels, and perhaps p21 gene expression levels, may be less informative. In addition, p16 (and by extension, p21) mRNA levels in total white blood cells might not be sensitive enough: alterations may only be detectable in separated T lymphocyte populations [64] but we did not have the appropriate samples to investigate this.
Inflammatory markers
We created a simple (baseline) inflammatory score as a summary variable reflecting the inflammatory status of our participants. This score was significantly higher in PD cases than in controls in agreement with previous results using a principal component analysis within the ICICLE-PD study extended cohort [40] and by others analysing individual markers [61, 65]. Furthermore, our inflammatory score in PD cases at baseline correlated negatively with both cognitive parameters (MMSE and MoCA) and positively with the motor function MDS-UPDRS-III scores at baseline. It was also a significant predictor of both motor (MDS-UPDRS-III) and cognitive (MoCA) function in PD cases at 36-months, in line with a previous study [40]. A very similar composite inflammatory score including TNF-alpha, IL-6 and CRP has already shown to be, after age, the main predictor of cognitive function for those aged over 75 years [52]. Given the wide disparity between studies on individual cytokines [66, 67], such composite variables may offer a more informative evaluation of disease progression in PD [65] and the anti-inflammatory effect of potential treatments [68].
In summary, our study demonstrates that telomere lengths at baseline and 18 months were lower in PD patients compared to age-matched healthy controls with shorter telomere length at baseline and at 18 months also associated with development of dementia within 36 months. A baseline inflammatory score consisting of five different cytokines gave the best prediction for cognitive scores of PD cases 3 years later, while lower p16 gene expression predicted a more rapid disease progression over the same period in relation to both cognitive and motor scores. Thus, both inflammatory and senescence markers (telomere length and p16) warrant further investigation as potential predictors of disease progression in PD.
CONFLICT OF INTEREST
The authors have declared that there are no competing interests and nothing to disclose.
ACKNOWLEDGMENTS
This study was supported by a Newcastle upon Tyne Hospital Trust (Brain Research Unit PD0612) grant to GS. ICICLE-PD is funded by Parkinson’s UK (grant no J-0802, G-1301) and supported by the National Institute for Health Research (NIHR) New-castle Biomedical Research Centre in Ageing and Chronic Disease and the Biomedical Research Unit in Lewy Body Dementia based at Newcastle upon Tyne Hospitals NHS Foundation Trust and Newcastle University (CM-R) and the National Institute for Health Research (NIHR) Cambridge Biomedical Research Centre (146281). This work was also supported by grants from the Academy of Medical Sciences, UK, the Rosetrees Trust, and the Stevenage Biosciences Catalyst. CHWG is supported by a RCUK/UKRI Research Innovation Fellowship awarded by the Medical Research Council (MR/R007446) and by the Cambridge Centre for Parkinson-Plus. RAB is an NIHR Senior Investigator (NF-SI-0616-10011) and is supported by the WT/MRC Stem Cell Institute (203151/Z/16/Z). The views expressed are those of the authors and not necessarily those of the NIHR or the Department of Health and Social Care. The ICICLE-PD study group would like to thank all participants and their carers for their contribution towards the study.
SUPPLEMENTARY MATERIAL
[1] The supplementary material is available in the electronic version of this article: https://dx.doi.org/10.3233/JPD-191724.
REFERENCES
[1] | Aarsland D , Andersen K , Larsen JP , Lolk A , Kragh-Sorensen P ((2003) ) Prevalence and characteristics of dementia in Parkinson disease: An 8-year prospective study. Arch Neurol 60: , 387–392. |
[2] | Galvin JE , Pollack J , Morris JC ((2006) ) Clinical phenotype of Parkinson disease dementia. Neurology 67: , 1605–1611. |
[3] | Williams-Gray CH , Mason SL , Evans JR , Foltynie T , Brayne C , Robbins TW , Barker RA ((2013) ) The CamPaIGN study of Parkinson’s disease: 10-year outlook in an incident population-based cohort. J Neurol Neurosurg Psychiatry 84: , 1258–64. |
[4] | Hobson P , Meara J ((2004) ) Risk and incidence of dementia in a cohort of older subjects with Parkinson’s disease in the United Kingdom. Mov Disord 19: , 1043–1049. |
[5] | Levy G , Tang MX , Louis ED , Cote LJ , Alfaro B , Mejia H , Stern Y , Marder K ((2002) ) The association of incident dementia with mortality in PD. Neurology 59: , 1708–1713. |
[6] | Lawson RA , Yarnall AJ , Duncan GW , Breen DP , Khoo TK , Williams-Gray CH , Barker RA , Collerton D , Taylor JP , Burn DJ ((2016) ) Cognitive decline and quality of life in incident Parkinson’s disease: The role of attention. Parkinsonism Relat Disord 27: , 47–53. |
[7] | Lawson RA , Yarnall AJ , Johnston F , Duncan GW , Khoo TK , Collerton D , Taylor JP , Burn DJ , ICICLE-PD study group ((2017) ) Cognitive impairment in Parkinson’s disease: Impact on quality of life of carers. Int J Geriatr Psychiatry 32: , 1362–1370. |
[8] | Zhu Y , Liu X , Ding X , Wang F , Geng X ((2019) ) Telomere and its role in the aging pathways: Telomere shortening, cell senescence and mitochondria dysfunction. Biogerontology 20: , 1–16. |
[9] | von Zglinicki T ((2002) ) Oxidative stress shortens telomeres. Trends Biochem Sci 27: , 339–344. |
[10] | Martin-Ruiz C , Dickinson HO , Keys B , Rowan E , Kenny RA , Von Zglinicki T ((2006) ) Telomere length predicts poststroke mortality, dementia, and cognitive decline. Ann Neurol 60: , 174–180. |
[11] | Forero DA , Gonzalez-Giraldo Y , Lopez-Quintero C , Castro-Vega LJ , Barreto GE , Perry G ((2016) ) Telomere length in Parkinson’s disease: A meta-analysis. Exp Gerontol 75: , 53–55. |
[12] | Schurks M , Buring J , Dushkes R , Gaziano JM , Zee RY , Kurth T ((2014) ) Telomere length and Parkinson’s disease in men: A nested case-control study. Eur J Neurol 21: , 93–99. |
[13] | Wang H , Chen H , Gao X , McGrath M , Deer D , De Vivo I , Schwarzschild MA , Ascherio A ((2008) ) Telomere length and risk of Parkinson’s disease. Mov Disord 23: , 302–305. |
[14] | Ma SL , Lau ES , Suen EW , Lam LC , Leung PC , Woo J , Tang NL ((2013) ) Telomere length and cognitive function in southern Chinese community-dwelling male elders. Age Ageing 42: , 450–455. |
[15] | Valdes AM , Deary IJ , Gardner J , Kimura M , Lu X , Spector TD , Aviv A , Cherkas LF ((2010) ) Leukocyte telomere length is associated with cognitive performance in healthy women. Neurobiol Aging 31: , 986–992. |
[16] | Yaffe K , Lindquist K , Kluse M , Cawthon R , Harris T , Hsueh WC , Simonsick EM , Kuller L , Li R , Ayonayon HN , Rubin SM , Cummings SR ((2011) ) Telomere length and cognitive function in community-dwelling elders: Findings from the Health ABC Study. Neurobiol Aging 32: , 2055–2060. |
[17] | Devore EE , Prescott J , De Vivo I , Grodstein F ((2011) ) Relative telomere length and cognitive decline in the Nurses’ Health Study. Neurosci Lett 492: , 15–18. |
[18] | Harris SE , Martin-Ruiz C , von Zglinicki T , Starr JM , Deary IJ ((2012) ) Telomere length and aging biomarkers in 70-year-olds: The Lothian Birth Cohort 1936. Neurobiol Aging 33: , 1486.e3–8. |
[19] | Honig LS , Kang MS , Schupf N , Lee JH , Mayeux R ((2012) ) Association of shorter leukocyte telomere repeat length with dementia and mortality. Arch Neurol 69: , 1332–1339. |
[20] | Mather KA , Jorm AF , Anstey KJ , Milburn PJ , Easteal S , Christensen H ((2010) ) Cognitive performance and leukocyte telomere length in two narrow age-range cohorts: A population study. BMC Geriatr 10: , 62. |
[21] | Maeda T , Guan JZ , Koyanagi M , Higuchi Y , Makino N ((2012) ) Aging-associated alteration of telomere length and subtelomeric status in female patients with Parkinson’s disease. J Neurogenet 26: , 245–251. |
[22] | Watfa G , Dragonas C , Brosche T , Dittrich R , Sieber CC , Alecu C , Benetos A , Nzietchueng R ((2011) ) Study of telomere length and different markers of oxidative stress in patients with Parkinson’s disease. J Nutr Health Aging 15: , 277–281. |
[23] | Degerman S , Domellof M , Landfors M , Linder J , Lundin M , Haraldsson S , Elgh E , Roos G , Forsgren L ((2014) ) Long leukocyte telomere length at diagnosis is a risk factor for dementia progression in idiopathic parkinsonism. PLoS One 9: , e113387. |
[24] | Eerola J , Kananen L , Manninen K , Hellstrom O , Tienari PJ , Hovatta I ((2010) ) No evidence for shorter leukocyte telomere length in Parkinson’s disease patients. J Gerontol A Biol Sci Med Sci 65: , 1181–1184. |
[25] | Guan JZ , Maeda T , Sugano M , Oyama J , Higuchi Y , Suzuki T , Makino N ((2008) ) A percentage analysis of the telomere length in Parkinson’s disease patients. J Gerontol A Biol Sci Med Sci 63: , 467–473. |
[26] | Hudson G , Faini D , Stutt A , Eccles M , Robinson L , Burn DJ , Chinnery PF ((2011) ) No evidence of substantia nigra telomere shortening in Parkinson’s disease. Neurobiol Aging 32: , 2107.e3–2107.e5. |
[27] | Ben-Porath I , Weinberg RA ((2005) ) The signals and pathways activating cellular senescence. Int J Biochem Cell Biol 37: , 961–976. |
[28] | Jeck WR , Siebold AP , Sharpless NE ((2012) ) Review: A meta-analysis of GWAS and age-associated diseases. Aging Cell 11: , 727–731. |
[29] | Baker DJ , Childs BG , Durik M , Wijers ME , Sieben CJ , Zhong J , Saltness RA , Jeganathan KB , Verzosa GC , Pezeshki A , Khazaie K , Miller JD , van Deursen JM ((2016) ) Naturally occurring p16(Ink4a)-positive cells shorten healthy lifespan. Nature 530: , 184–189. |
[30] | Sturmlechner I , Durik M , Sieben CJ , Baker DJ , van Deursen JM ((2017) ) Cellular senescence in renal ageing and disease. Nat Rev Nephrol 13: , 77–89. |
[31] | Chinta SJ , Woods G , Rane A , Demaria M , Campisi J , Andersen JK ((2015) ) Cellular senescence and the aging brain. Exp Gerontol 68: , 3–7. |
[32] | Frank-Cannon TC , Alto LT , McAlpine FE , Tansey MG ((2009) ) Does neuroinflammation fan the flame in neurodegenerative diseases? Mol Neurodegener 4: , 47. |
[33] | Jurk D , Wang C , Miwa S , Maddick M , Korolchuk V , Tsolou A , Gonos ES , Thrasivoulou C , Saffrey MJ , Cameron K , von Zglinicki T ((2012) ) Postmitotic neurons develop a p21-dependent senescence-like phenotype driven by a DNA damage response. Aging Cell 11: , 996–1004. |
[34] | Sugama S ((2009) ) Stress-induced microglial activation may facilitate the progression of neurodegenerative disorders. Med Hypotheses 73: , 1031–1034. |
[35] | Musi N , Valentine JM , Sickora KR , Baeuerle E , Thompson CS , Shen Q , Orr ME ((2018) ) Tau protein aggregation is associated with cellular senescence in the brain. Aging Cell 17: , e12840. |
[36] | Bussian TJ , Aziz A , Meyer CF , Swenson BL , van Deursen JM , Baker DJ ((2018) ) Clearance of senescent glial cells prevents tau-dependent pathology and cognitive decline. Nature 562: , 578–582. |
[37] | Krishnamurthy J , Torrice C , Ramsey MR , Kovalev GI , Al-Regaiey K , Su L , Sharpless NE ((2004) ) Ink4a/Arf expression is a biomarker of aging. J Clin Invest 114: , 1299–1307. |
[38] | Pustavoitau A , Barodka V , Sharpless NE , Torrice C , Nyhan D , Berkowitz DE , Shah AS , Bandeen Roche KJ , Walston JD ((2016) ) Role of senescence marker p16 INK4a measured in peripheral blood T-lymphocytes in predicting length of hospital stay after coronary artery bypass surgery in older adults. Exp Gerontol 74: , 29–36. |
[39] | Rutten EP , Gopal P , Wouters EF , Franssen FM , Hageman GJ , Vanfleteren LE , Spruit MA , Reynaert NL ((2016) ) Various mechanistic pathways representing the aging process are altered in COPD. Chest 149: , 53–61. |
[40] | Williams-Gray CH , Wijeyekoon R , Yarnall AJ , Lawson RA , Breen DP , Evans JR , Cummins GA , Duncan GW , Khoo TK , Burn DJ , Barker RA , ICICLE-PD StudyGroup ((2016) ) Serum immune markers and disease progression in an incident Parkinson’s disease cohort (ICICLE-PD). Mov Disord 31: , 995–1003. |
[41] | Vinatier C , Dominguez E , Guicheux J , Carames B ((2018) ) Role of the inflammation-autophagy-senescence integrative network in osteoarthritis. Front Physiol 9: , 706. |
[42] | Zhang J , Rane G , Dai X , Shanmugam MK , Arfuso F , Samy RP , Lai MK , Kappei D , Kumar AP , Sethi G ((2016) ) Ageing and the telomere connection: An intimate relationship with inflammation. Ageing Res Rev 25: , 55–69. |
[43] | Khoo TK , Yarnall AJ , Duncan GW , Coleman S , O’Brien JT , Brooks DJ , Barker RA , Burn DJ ((2013) ) The spectrum of nonmotor symptoms in early Parkinson disease. Neurology 80: , 276–281. |
[44] | Yarnall AJ , Breen DP , Duncan GW , Khoo TK , Coleman SY , Firbank MJ , Nombela C , Winder-Rhodes S , Evans JR , Rowe JB , Mollenhauer B , Kruse N , Hudson G , Chinnery PF , O’Brien JT , Robbins TW , Wesnes K , Brooks DJ , Barker RA , Burn DJ , ICICLE-PD Study Group ((2014) ) Characterizing mild cognitive impairment in incident Parkinson disease: The ICICLE-PD study. Neurology 82: , 308–316. |
[45] | Hughes AJ , Daniel SE , Kilford L , Lees AJ ((1992) ) Accuracy of clinical diagnosis of idiopathic Parkinson’s disease: A clinico-pathological study of 100 cases. J Neurol Neurosurg Psychiatry 55: , 181–184. |
[46] | Folstein MF , Folstein SE , McHugh PR ((1975) ) “Mini-mental state”. A practical method for grading the cognitive state of patients for the clinician. J Psychiatr Res 12: , 189–198. |
[47] | Nasreddine ZS , Phillips NA , Bedirian V , Charbonneau S , Whitehead V , Collin I , Cummings JL , Chertkow H ((2005) ) The Montreal Cognitive Assessment, MoCA: A brief screening tool for mild cognitive impairment. J Am Geriatr Soc 53: , 695–699. |
[48] | Goetz CG , Tilley BC , Shaftman SR , Stebbins GT , Fahn S , Martinez-Martin P , Poewe W , Sampaio C , Stern MB , Dodel R , Dubois B , Holloway R , Jankovic J , Kulisevsky J , Lang AE , Lees A , Leurgans S , LeWitt PA , Nyenhuis D , Olanow CW , Rascol O , Schrag A , Teresi JA , van Hilten JJ , LaPelle N ((2008) ) Movement Disorder Society-sponsored revision of the Unified Parkinson’s Disease Rating Scale (MDS-UPDRS): Scale presentation and clinimetric testing results. Mov Disord 23: , 2129–2170. |
[49] | Hoehn MM , Yahr MD ((1967) ) Parkinsonism: Onset, progression and mortality. Neurology 17: , 427–442. |
[50] | Tomlinson CL , Stowe R , Patel S , Rick C , Gray R , Clarke CE ((2010) ) Systematic review of levodopa dose equivalency reporting in Parkinson’s disease. Mov Disord 25: , 2649–2653. |
[51] | Litvan I , Goldman JG , Troster AI , Schmand BA , Weintraub D , Petersen RC , Mollenhauer B , Adler CH , Marder K , Williams-Gray CH , Aarsland D , Kulisevsky J , Rodriguez-Oroz MC , Burn DJ , Barker RA , Emre M ((2012) ) Diagnostic criteria for mild cognitive impairment in Parkinson’s disease: Movement Disorder Society Task Force guidelines. Mov Disord 27: , 349–356. |
[52] | Arai Y , Martin-Ruiz CM , Takayama M , Abe Y , Takebayashi T , Koyasu S , Suematsu M , Hirose N , von Zglinicki T ((2015) ) Inflammation, but not telomere length, predicts successful ageing at extreme old age: A longitudinal study of semi-supercentenarians. EBioMedicine 2: , 1549–1558. |
[53] | Stuart S , Lawson RA , Yarnall AJ , Nell J , Alcock L , Duncan GW , Khoo TK , Barker RA , Rochester L , Burn DJ ; ICICLE-PD study group ((2019) ) Pro-saccades predict cognitive decline in Parkinson’s disease: ICICLE-PD. Mov Disord, doi: 10.1002/mds.27813 |
[54] | Forero DA , Gonzalez-Giraldo Y , Lopez-Quintero C , Castro-Vega LJ , Barreto GE , Perry G ((2016) ) Meta-analysis of telomere length in Alzheimer’s disease. J Gerontol A Biol Sci Med Sci 71: , 1069–1073. |
[55] | Hinterberger M , Fischer P , Huber K , Krugluger W , Zehetmayer S ((2017) ) Leukocyte telomere length is linked to vascular risk factors not to Alzheimer’s disease in the VITA study. J Neural Transm (Vienna) 124: , 809–819. |
[56] | Jenkins EC , Marchi EJ , Velinov MT , Ye L , Krinsky-McHale SJ , Zigman WB , Schupf N , Silverman WP ((2017) ) Longitudinal telomere shortening and early Alzheimer’s disease progression in adults with down syndrome. Am J Med Genet B Neuropsychiatr Genet 174: , 772–778. |
[57] | Zekry D , Herrmann FR , Irminger-Finger I , Ortolan L , Genet C , Vitale AM , Michel JP , Gold G , Krause KH ((2010) ) Telomere length is not predictive of dementia or MCI conversion in the oldest old. Neurobiol Aging 31: , 719–720. |
[58] | Kritsilis M , S VR , Koutsoudaki PN , Evangelou K , Gorgoulis VG , Papadopoulos D ((2018) ) Ageing, cellular senescence and neurodegenerative disease. Int J Mol Sci 19: , 2937. |
[59] | Hochstrasser T , Marksteiner J , Defrancesco M , Deisenhammer EA , Kemmler G , Humpel C ((2011) ) Two blood monocytic biomarkers (CCL15 and p21) combined with the Mini-Mental State Examination discriminate Alzheimer’s disease patients from healthy subjects. Dement Geriatr Cogn Dis Extra 1: , 297–309. |
[60] | Chinta SJ , Woods G , Demaria M , Rane A , Zou Y , McQuade A , Rajagopalan S , Limbad C , Madden DT , Campisi J , Andersen JK ((2018) ) Cellular senescence is induced by the environmental neurotoxin paraquat and contributes to neuropathology linked to Parkinson’s disease. Cell Rep 22: , 930–940. |
[61] | Chiang PL , Chen HL , Lu CH , Chen PC , Chen MH , Yang IH , Tsai NW , Lin WC ((2017) ) White matter damage and systemic inflammation in Parkinson’s disease. BMC Neurosci 18: , 48. |
[62] | Williams-Gray CH , Wijeyekoon RS , Scott KM , Hayat S , Barker RA , Jones JL ((2018) ) Abnormalities of age-related T cell senescence in Parkinson’s disease. J Neuroinflammation 15: , 166. |
[63] | Tan M , Wang S , Song J , Jia J ((2012) ) Combination of p53(ser15) and p21/p21(thr145) in peripheral blood lymphocytes as potential Alzheimer’s disease biomarkers. Neurosci Lett 516: , 226–231. |
[64] | Liu Y , Sanoff HK , Cho H , Burd CE , Torrice C , Ibrahim JG , Thomas NE , Sharpless NE ((2009) ) Expression of p16(INK4a) in peripheral blood T-cells is a biomarker of human aging. Aging Cell 8: , 439–448. |
[65] | Eidson LN , Kannarkat GT , Barnum CJ , Chang J , Chung J , Caspell-Garcia C , Taylor P , Mollenhauer B , Schlossmacher MG , Ereshefsky L , Yen M , Kopil C , Frasier M , Marek K , Hertzberg VS , Tansey MG ((2017) ) Candidate inflammatory biomarkers display unique relationships with alpha-synuclein and correlate with measures of disease severity in subjects with Parkinson’s disease. J Neuroinflammation 14: , 164. |
[66] | Brosseron F , Krauthausen M , Kummer M , Heneka MT ((2014) ) Body fluid cytokine levels in mild cognitive impairment and Alzheimer’s disease: A comparative overview. Mol Neurobiol 50: , 534–544. |
[67] | Qin XY , Zhang SP , Cao C , Loh YP , Cheng Y ((2016) ) Aberrations in peripheral inflammatory cytokine levels in Parkinson disease: A systematic review and meta-analysis. JAMA Neurol 73: , 1316–1324. |
[68] | Rocha NP , Assis F , Scalzo PL , Vieira ELM , Barbosa IG , de Souza MS , Christo PP , Reis HJ , Teixeira AL ((2018) ) Reduced activated T lymphocytes (CD4+CD25+) and plasma levels of cytokines in Parkinson’s disease. Mol Neurobiol 55: , 1488–1497. |


