
Overall and Disease Related Mortality in Parkinson’s Disease – a Longitudinal Cohort Study
Abstract
Background:
Earlier research showed that Parkinson’s disease is related to increased overall mortality, but it remains unclear which patient level factors are predictive of increased mortality in Parkinson’s disease.
Objective:
To jointly evaluate potential risk factors for overall and Parkinson’s disease (PD) related mortality, we collected detailed information from a cohort of newly diagnosed PD patients which was consequently followed for over a decade.
Methods:
A total of 133 consecutive patients with newly diagnosed PD were followed for at least 13 years. Survival analysis of observed mortality was used to evaluate risk factors for overall mortality, whereas survival analysis of mortality as corrected for the general population was used to evaluate risk factors for PD-related mortality.
Results:
Overall mortality increased with age, male sex, higher levodopa equivalent dose, and presence of mild cognitive impairment. PD-related mortality increased with earlier onset of Parkinson’s disease, higher levodopa equivalent dose, and mild cognitive impairment.
Conclusions:
Our findings provide confirmation and extension of risk factors for overall mortality and generate new insights into PD-related mortality.
INTRODUCTION
Parkinson’s disease (PD) is the second most common neurodegenerative disease with an estimated annual incidence of 160 per 100,000 for those over 65 years of age [1] and a lifetime risk of 2.0% and 1.3% for men and women respectively [2]. PD’s main features are bradykinesia in combination with either rest tremor, rigidity, or both, and responsiveness to dopaminergic therapy [3]. Furthermore, PD is associated with an increased mortality ratio of approximately 1.5 when compared to the general population, as shown by a recent systematic review including a meta-analyses of 9 incidence cohorts [4]. However, synthesis of results on factors related to overall mortality in this same meta-analysis was hampered by heterogeneity in study methods, prompting the authors to state that new high quality research on mortality in PD is needed. Furthermore, to the knowledge of the authors, no earlier studies focused on factors affecting mortality related to Parkinson’s disease, as opposed to overall or all-cause mortality. We therefore aim to evaluate both overall and PD-related mortality in a well-defined sample of newly diagnosed PD patients with complete mortality follow-up exceeding 13 years.
METHODS
Subjects
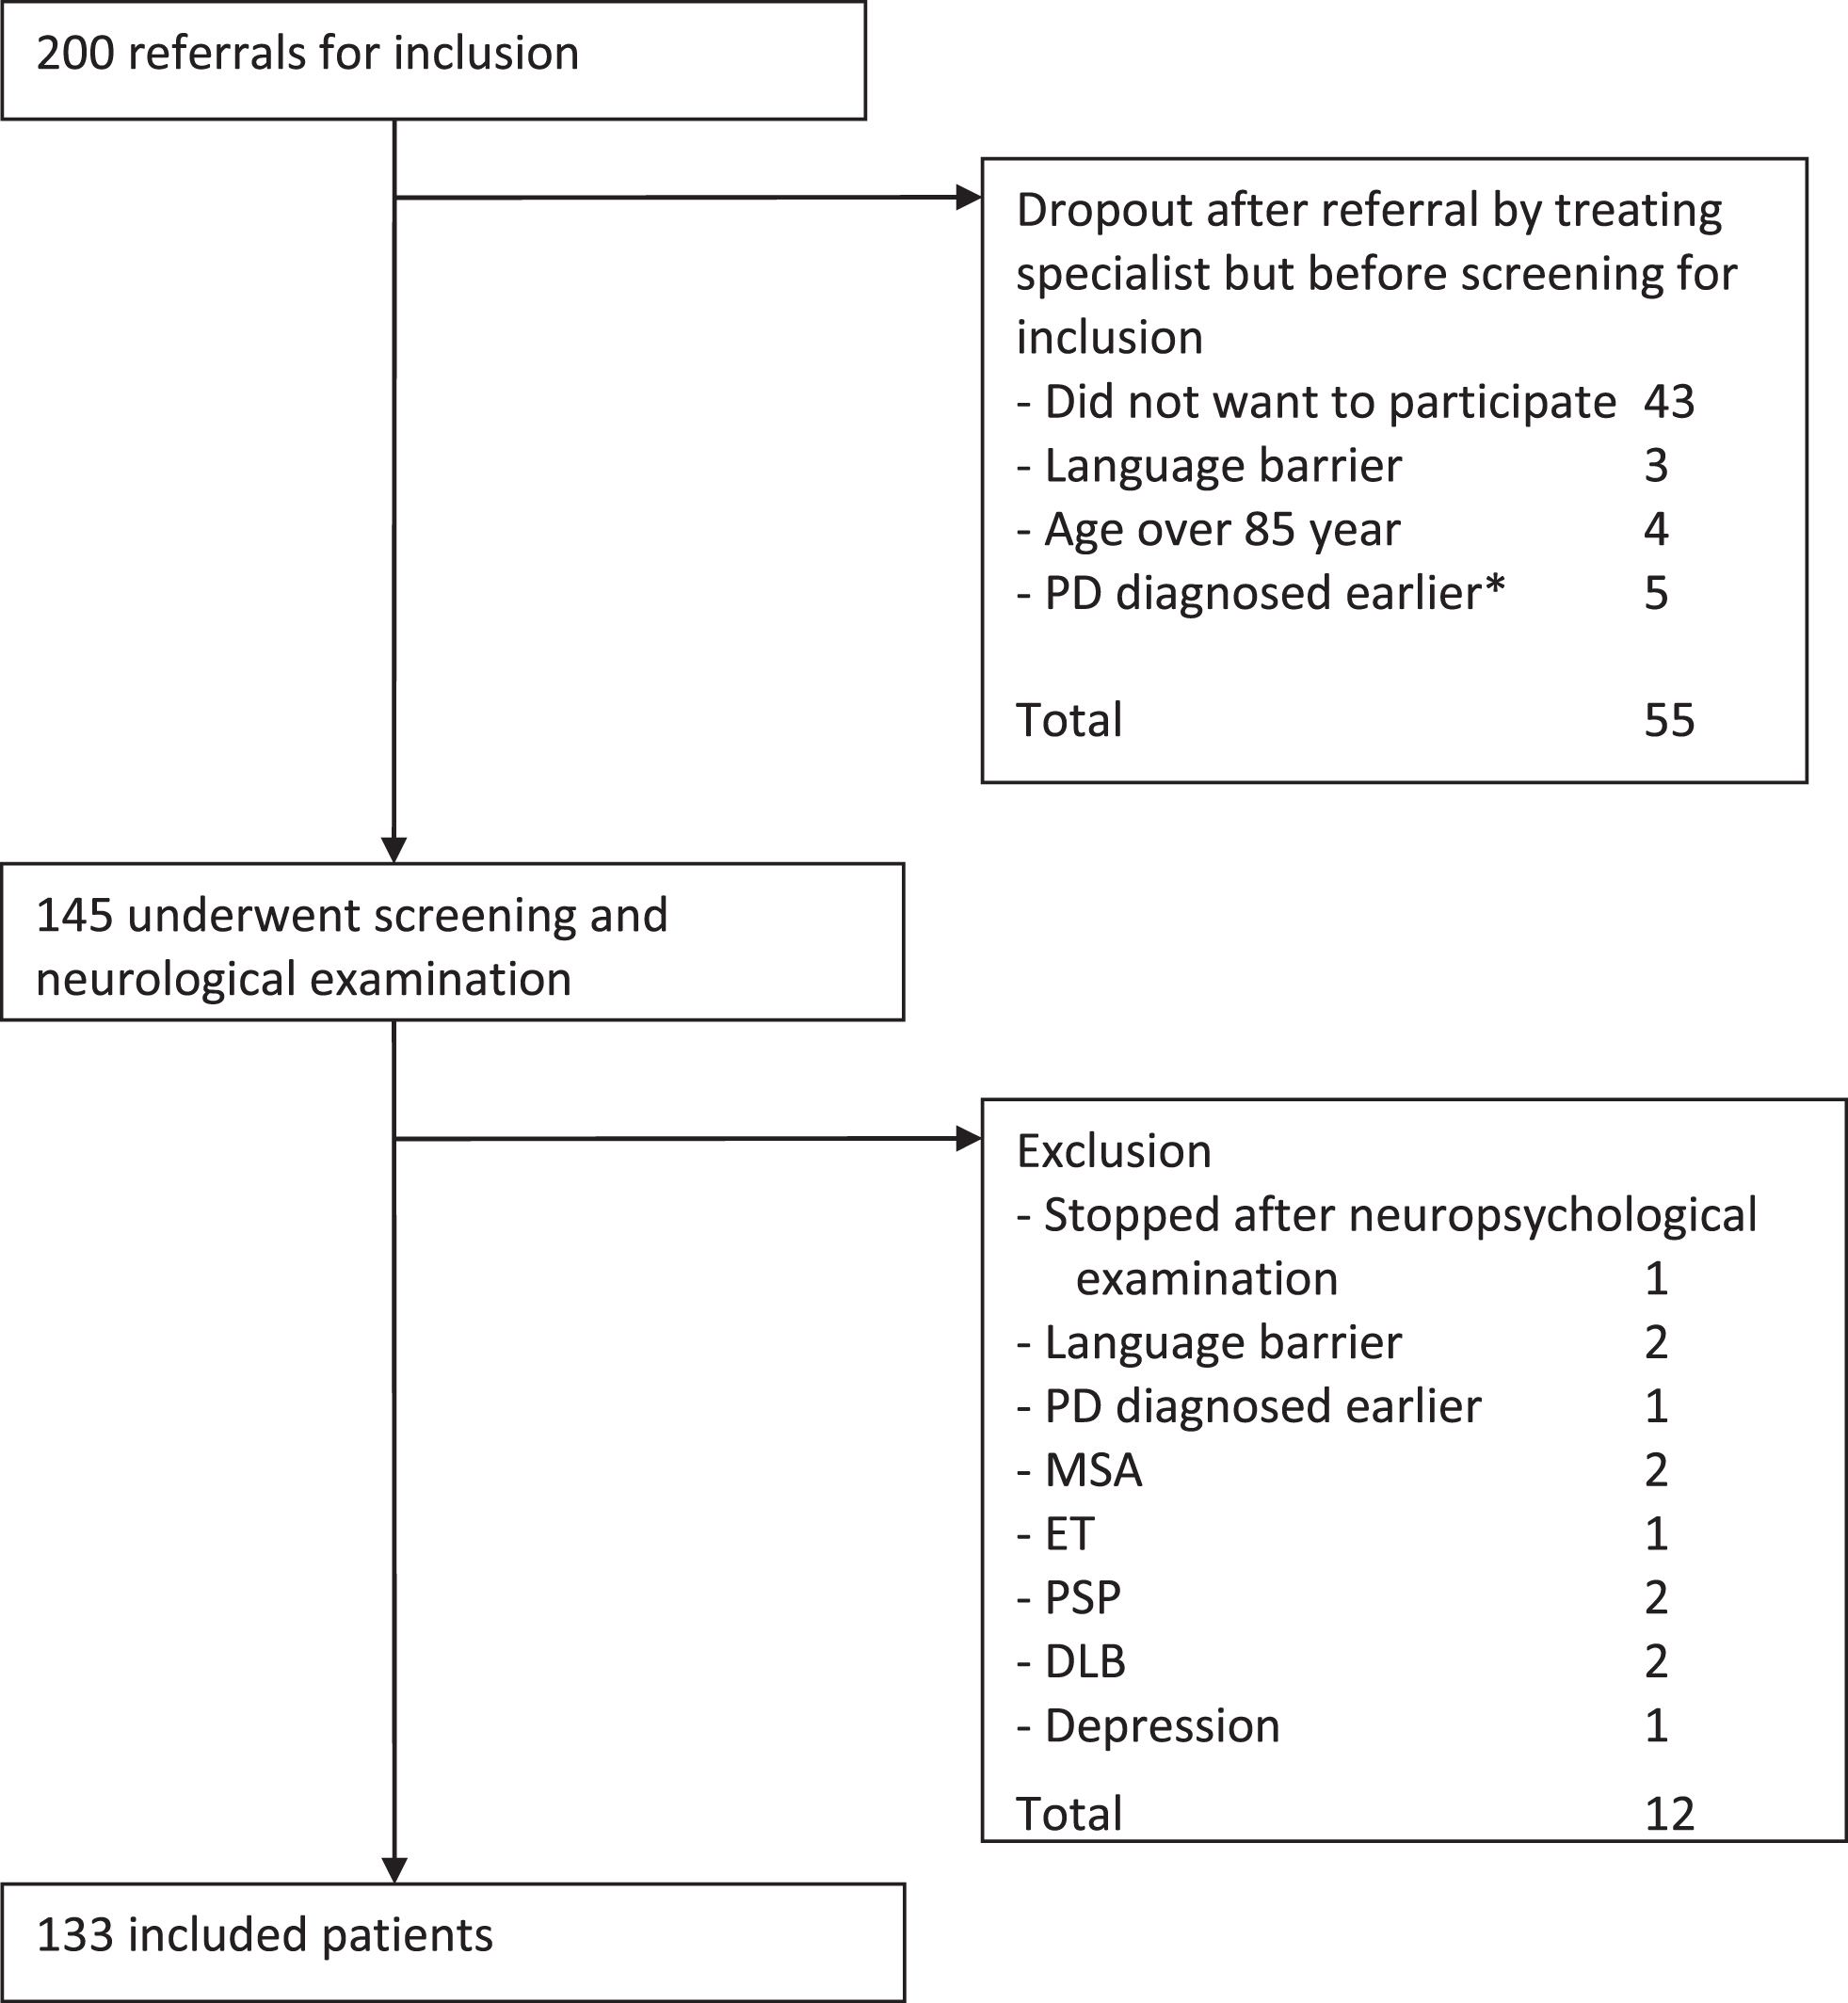
Patients were recruited from six neurology outpatient clinics in the Netherlands between July 2002 and April 2005. Exclusion criteria were age of 85 years or older, insufficient command of the Dutch language, global cognitive decline, and the presence of somatic illness with a life expectancy of less than 1 year. Patients could be referred for inclusion by their treating neurologist after a (new) PD diagnosis. Neurological examination by a movement disorders specialist was part of the screening procedure before inclusion in order to check PD diagnosis according to standard criteria [5]. The cohort is described in more detail elsewhere [6]. Figure 1 shows the inclusion process. The final study population consisted of 133 consecutive patients with newly diagnosed PD.
Fig.1
Inclusion process. *) That is, PD turned out to be diagnosed before initiation of the cohort. Abbreviations: MSA (multiple system atrophy), ET (essential tremor), PSP (progressive supranuclear palsy), DLB (dementia with Lewy bodies).
Procedure
Baseline measures included age, sex, Unified Parkinson’s Disease Rating Scale motor examination (UPDRS-III) [7] in best state, Mini Mental State Examination (MMSE) [8], daily antiparkinson medication use in levodopa equivalent dose (LED) [9], and Level II PD-MCI (with operationalization as described in Broeders et al.) [10, 11]. The UPDRS-III was divided into part A and B according to Levy [12], with levodopa responsive items under part A and non-levodopa responsive items under part B. PD diagnosis was checked by a neurologist specialized in movement disorders at 3 and 5-year follow-up. Mortality status was derived to the exact date from a centralized database on May 11th 2018. Therefore, for each patient, either the date of mortality was retrieved, or the patient was registered to be alive at May 11th 2018, except for a single patient who was censored after 13 years of follow-up due to emigration.
Standard protocol approvals, registrations, and patient consents
Written informed consent was obtained from all participants. The institutional review boards of the participating hospitals approved the study.
Statistical methods
Missing data
Multiple imputation was used to account for missing data as implemented in the mice package [13] in R statistical software [14]. Twenty imputations were created within the original studies using predictive mean matching for numeric variables and logistic regression for dichotomous variables. The imputation models included the baseline measures, event status at end of study (i.e. alive/deceased), and the Nelson Aalen estimate of the cumulative baseline hazard [15]. All analyses were performed on the imputed data and pooled using Rubin’s rules [16], unless stated otherwise.
Overall mortality
A Cox proportional hazards model was used to evaluate the effect of baseline variables on all-cause mortality. The implementations in the survival package [17, 18] and rms package [19] for R software were used for this purpose. Time was measured in years from baseline up to time of death or censoring (i.e. end of follow-up). Covariates included age, sex, UPDRS-III Levy A and B, LED, and PD-MCI. Possibly non-linear contributions of the covariates were evaluated using restricted cubic splines with four knots. A global test for non-linear contributions was performed by likelihood ratio testing of a model including all non-linear contributions versus a model containing none. Proportionality was assessed using Scaled Schoenfeld residuals. Model performance was measured by means of the C-statistic and corrected for optimism by means of bootstrapping with 10 imputations within each of 2000 bootstrap samples.
PD-related mortality
Life tables for the Dutch population were available from the Dutch Central Bureau for Statistics (CBS) by age, sex, and year [20]. The individual observed all-cause mortality data were transformed to a new scale accounting for the expected mortality in the general population based on age, sex, and year of baseline assessment. This approach is described in detail elsewhere [21, 22], is implemented in the relsurv package [23] for R software, and allows for use of standard survival approaches on the transformed data. Therefore, the same approach as for all-cause mortality was followed, but using transformed survival data after correction for non-PD-related mortality (i.e. expected mortality in the general population).
Data Availability Statement
For the purposes of replicating procedures and results, necessary data not available in the article will be shared with other investigators on request.
RESULTS
Baseline characteristics and descriptive statistics of overall survival
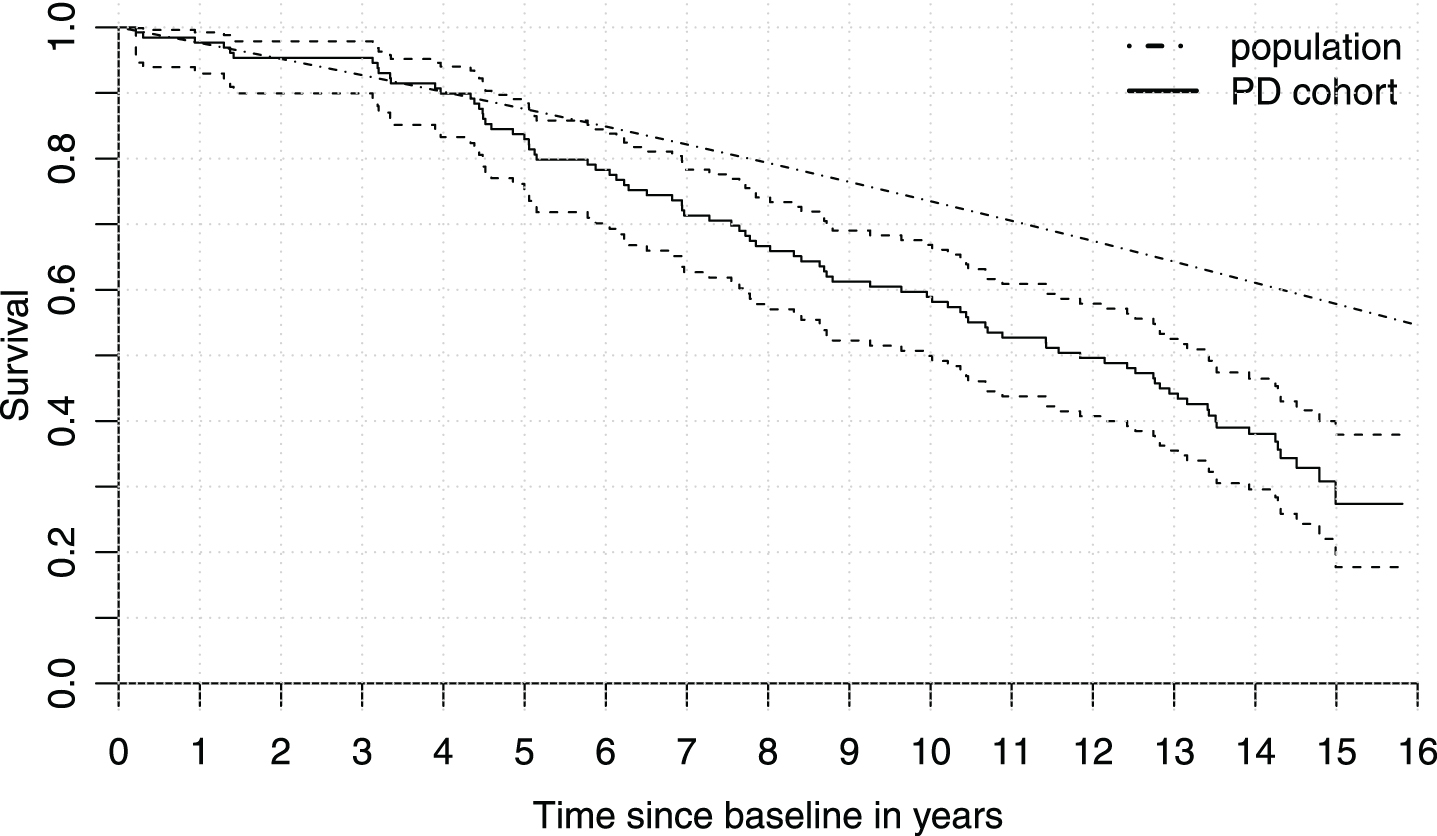
Four patients turned out to have disease other than PD on follow-up, leaving 129 for analyses. Median time between first PD diagnosis and baseline measurement was 3.3 months (IQR 2.3–6.1 months and range (0.7 to 12.5 months). Missing data occurred for LED (1 case), MMSE (2 cases), and PD-MCI status (9 cases). The majority of patients was male (72/129 or 56%). Median age at baseline was 68.2 years (IQR 58.6–74.1), median UPDRS-III at baseline was 16 points (IQR 11–22), and 36.4% of patients had PD-MCI at baseline. LED was zero for 46 patients and the median for the remaining patients was 220 mg (IQR 150–300 mg). Therefore, the majority of patients was already on levodopa treatment, as started by their treating neurologist, before their baseline measurement. The minimum duration of follow-up conditional on survival was 13.0 years. The average and total duration of follow-up over all patients were 10.3 and 1327 years respectively. Eighty-five subjects died during follow-up. Median survival time was 11.8 years with a 95% confidence interval of 10.0 to 13.4. Figure 2 shows the Kaplan-Meier curve for the cohort, together with expected survival in the general population. The observed survival in PD was clearly lower than expected for the general population.
Fig.2
Survival in Parkinson’s disease versus the general population. Kaplan-Meier curve for the cohort (solid) with 95% confidence interval (dashed) versus the expected survival in the general population for the cohort’s distribution of age and sex (dashed/dotted). The population curve is assumed known and therefore does not have a confidence interval.
Overall mortality modeling results
Results of survival analyses for overall and PD-related mortality are shown in Table 1. Overall mortality increased significantly with increasing age, male sex, higher LED, and presence of PD-MCI at baseline. The global test for non-linear contributions was non-significant (p-value 0.08). Schoenfeld residual indicated some possible deviation from the assumption of proportional hazards (i.e. constant hazard ratios over time) for sex, UPDRS-III Levy B and PD-MCI as shown in Fig. 3. However, these deviations were considered insufficient to warrant a more complex model. As a check, a model stratified on sex was also fitted, which rendered very similar results with all estimates less than half a standard error from the reported model (Table 2). The observed and bootstrap corrected C-statistic were 0.79 and 0.77 respectively, indicating good discriminative performance. Since LED relates to motor symptom severity as measured by the UPDRS-III, its presence in the model might mask the effect of motor symptom severity. A post-hoc analysis was conducted to evaluate whether this was the case. Removing LED from the model revealed a significantly increased risk of mortality for higher UPDRS-III Levy B score (HR 1.14, 1.01–1.29 95% CI, p-value 0.04). The estimates of other coefficients and their significance level were very similar to the full model, including the estimated coefficient for UPDRS-III Levy A score.
Table 1
Multivariable Cox model evaluating the hazard of mortality (n = 129)
| β | SE | 95% CI | HR (eβ) | z-statistic | p | |
| Overall mortality | ||||||
| Age (per year) | 0.10 | 0.02 | (0.07; 0.14) | 1.11 | 6.11 | <0.005 |
| Sex (male) | 0.78 | 0.25 | (0.30; 1.27) | 2.19 | 3.17 | 0.002 |
| UPDRS-III A (per point) | –0.01 | 0.02 | (–0.05; 0.03) | 0.99 | 0.41 | 0.681 |
| UPDRS-III B (per point) | 0.09 | 0.07 | (–0.05; 0.22) | 1.09 | 1.30 | 0.193 |
| LED (per 100 mg) | 0.18 | 0.09 | (0.00; 0.35) | 1.19 | 2.01 | 0.045 |
| MMSE (per point) | 0.12 | 0.08 | (–0.04; 0.27) | 1.13 | 1.52 | 0.130 |
| PD-MCI (present) | 0.63 | 0.27 | (0.10; 1.17) | 1.88 | 2.31 | 0.021 |
| PD-related mortality | ||||||
| Age (per year) | –0.07 | 0.02 | (–0.11; –0.04) | 0.93 | 2.65 | <0.005 |
| Sex (male) | 0.15 | 0.24 | (–0.33;0.62) | 1.16 | 2.36 | 0.55 |
| UPDRS-III Levy A (per point) | –0.01 | 0.02 | (–0.05; 0.04) | 0.99 | 0.96 | 0.75 |
| UPDRS-III Levy B (per point) | 0.05 | 0.07 | (0.08; 0.19) | 1.06 | 1.69 | 0.44 |
| LED (per 100 mg) | 0.19 | 0.09 | (0.01; 0.37) | 1.21 | 1.19 | 0.04 |
| MMSE (per point) | 0.11 | 0.08 | (–0.04; 0.27) | 1.12 | 1.91 | 0.15 |
| PD-MCI (present) | 0.62 | 0.27 | (0.09; 1.16) | 1.86 | 3.10 | 0.02 |
The reference categories were female and no cognitive impairment. For continuous variables, hazard ratios are expressed per unit difference on their scale of measurement (e.g., years for age and UPDRS-III points). Abbreviations: HR = hazard ratio; SE = standard error of β, 95% CI = 95% confidence interval for β.
Fig.3
Evaluation of proportional hazards assumption. The graphs show scaled Schoenfeld residuals (circles) on which a smooth curve (solid) and 95% confidence interval (dashed) were estimated, together with the Cox model coefficients presented in Table 1 for male sex, UPDRS-III Levy B, and PD-MCI (dashed/dotted, constant over time). These three variables showed some deviation from the assumption of a constant hazard ratio over time. The estimated effect of sex seems to decline late in follow-up, a short-term effect of UPDRS-III Levy B may have been missed, and the effect of PD-MCI at baseline seems to decline gradually over time. None of these deviations were deemed strong enough to necessitate a more complex model, but strong enough to report.
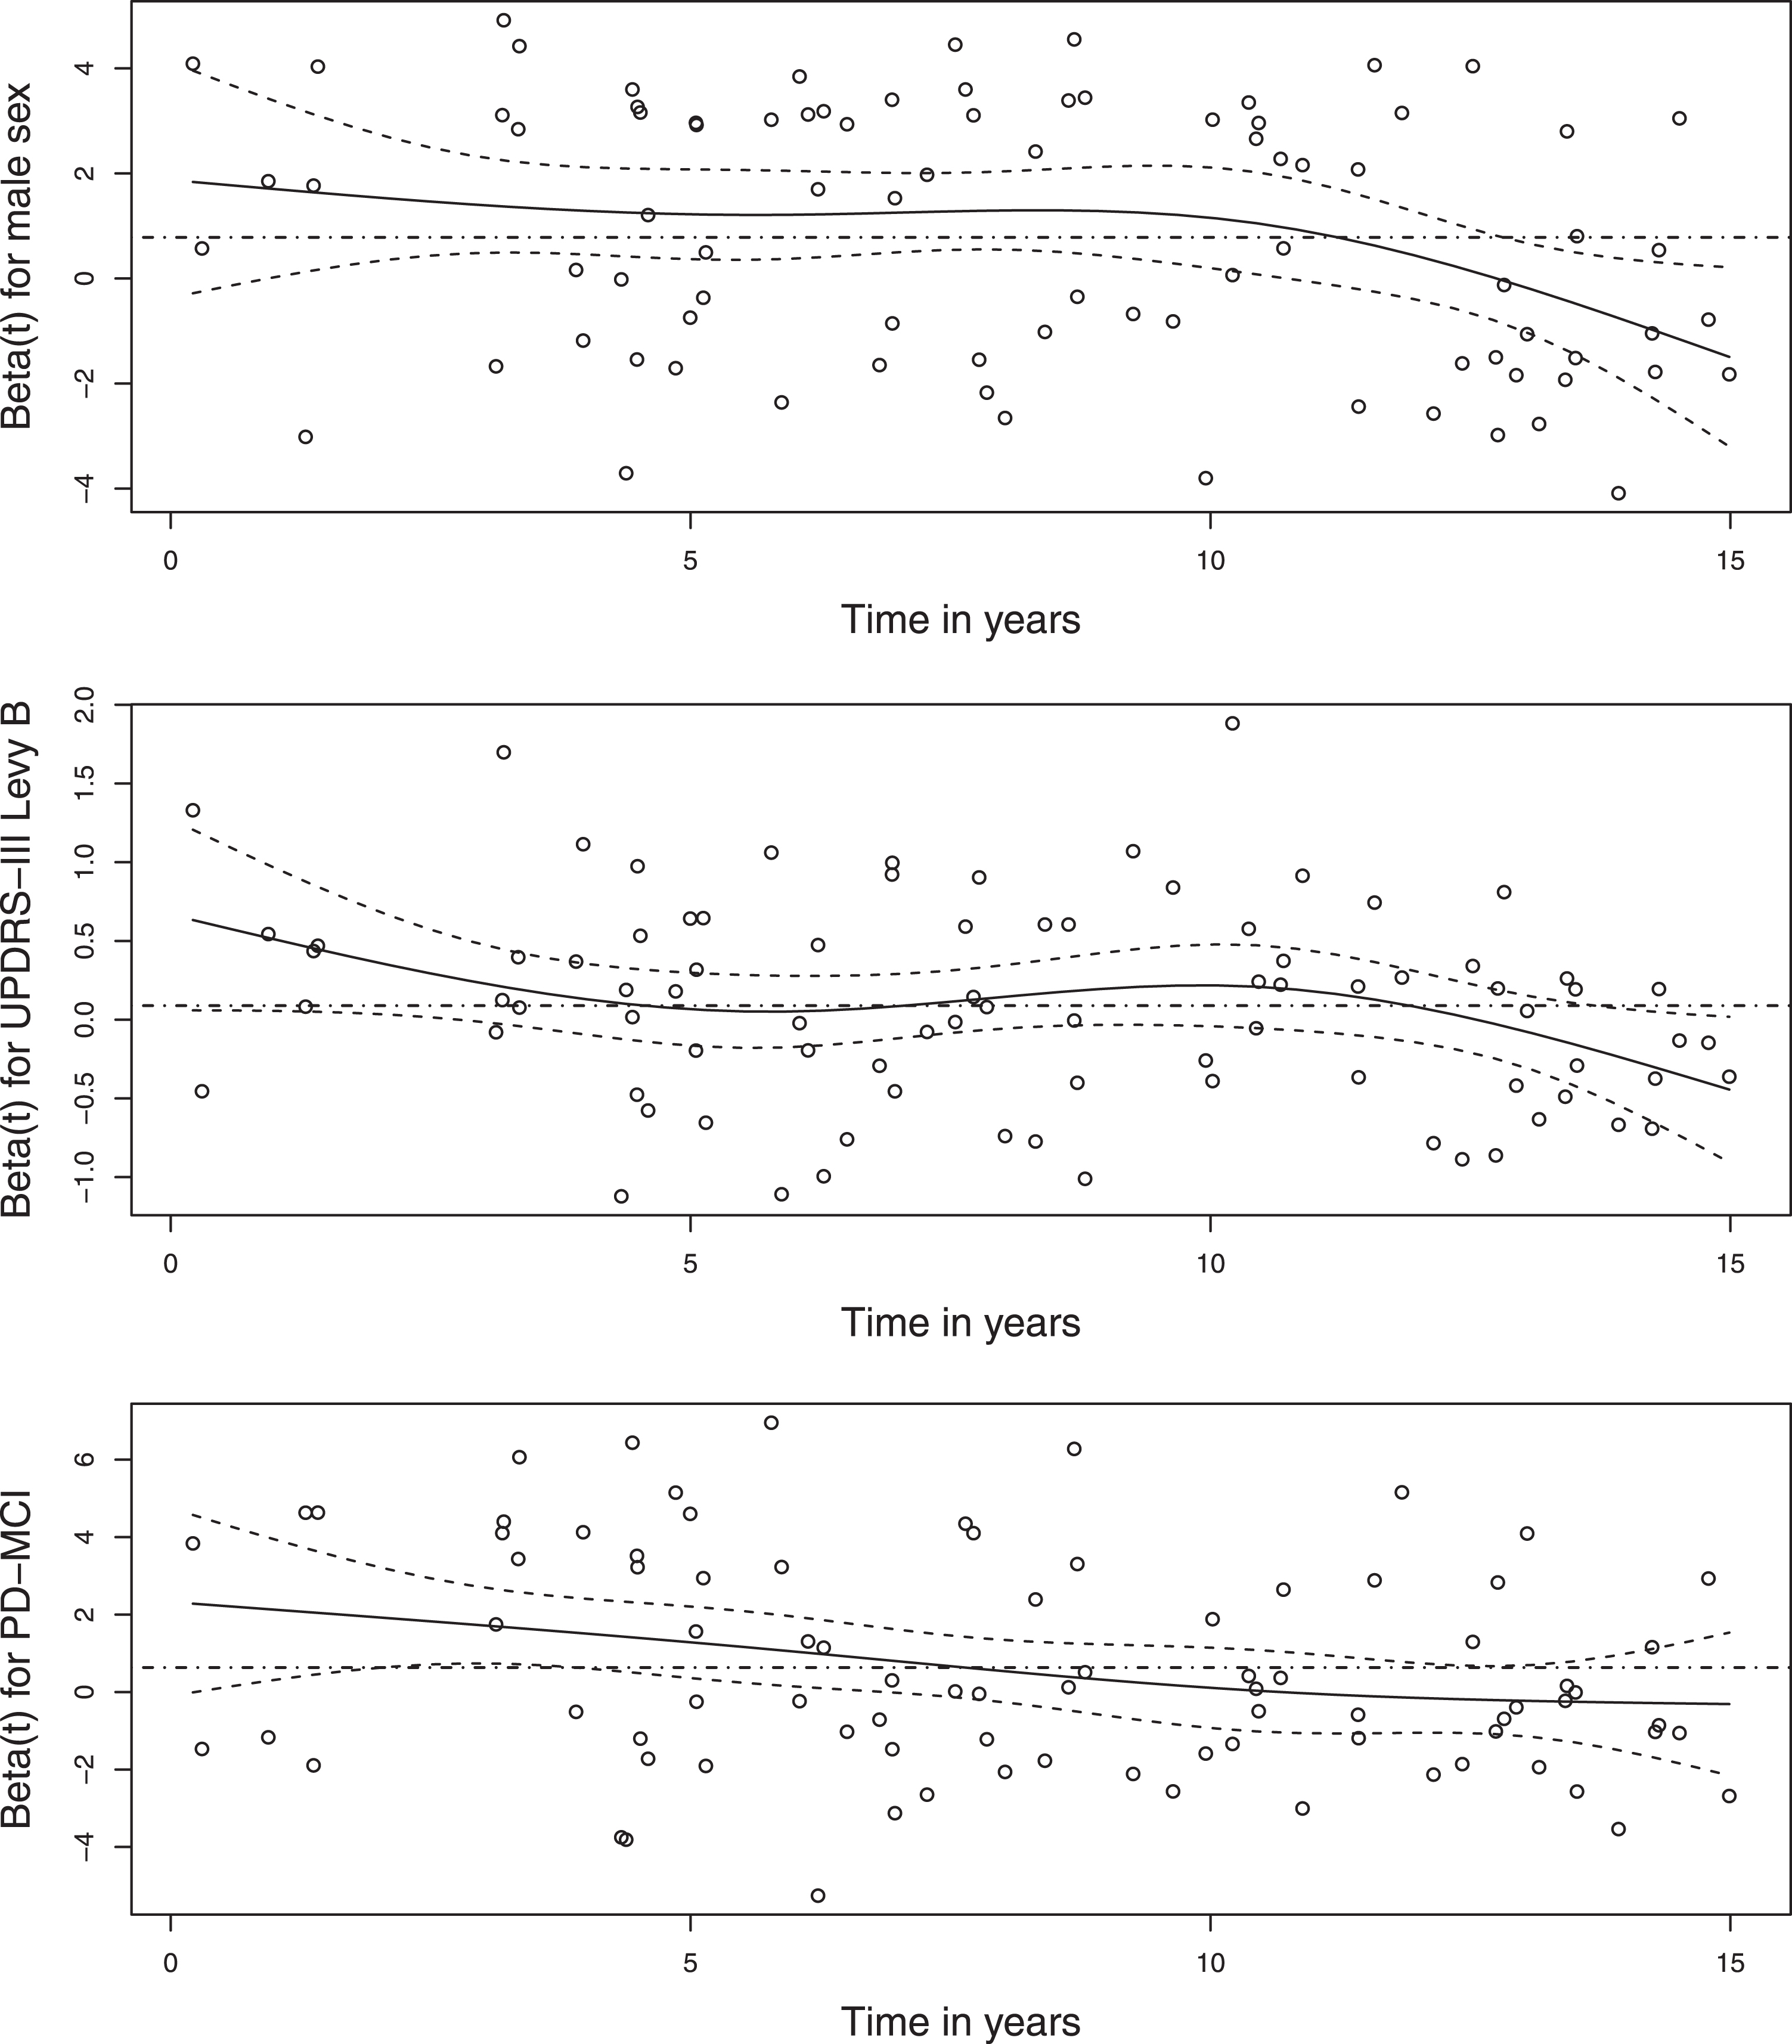
Table 2
Multivariable Cox model evaluating the hazard of mortality (n = 129) and stratified on sex
| β | SE | 95% CI | HR (eβ) | z-statistic | p | |
| Overall mortality | ||||||
| Age (per year) | 0.10 | 0.02 | (0.07; 0.14) | 1.11 | 5.97 | <0.005 |
| UPDRS-III A (per point) | –0.02 | 0.02 | (–0.06; 0.03) | 0.98 | 0.77 | 0.440 |
| UPDRS-III B (per point) | 0.10 | 0.07 | (–0.04; 0.24) | 1.11 | 1.43 | 0.152 |
| LED (per 100 mg) | 0.18 | 0.09 | (0.01; 0.35) | 1.20 | 2.08 | 0.038 |
| MMSE (per point) | 0.10 | 0.08 | (–0.04; 0.25) | 1.11 | 1.38 | 0.168 |
| PD-MCI (present) | 0.57 | 0.27 | (0.04; 1.09) | 1.76 | 2.10 | 0.036 |
The reference category was no cognitive impairment. For continuous variables, hazard ratios are expressed per unit difference on their scale of measurement (e.g., years for age and UPDRS-III points). Abbreviations: HR = hazard ratio; SE = standard error of β, 95% CI = 95% confidence interval for β.
PD-related mortality modeling results
Regarding PD-related mortality, earlier onset of PD, higher LED at baseline, and PD-MCI significantly increased the hazard. The likelihood ratio test for non-linear contributions was non-significant (p-value 0.16) and there were no indications of non-proportional hazards. The observed and bootstrap corrected C-statistic were 0.68 and 0.64 respectively, indicating that PD-related survival is harder to predict than overall survival based on the characteristics under observation.
DISCUSSION
Overall mortality was associated with a higher age at PD onset, male sex, higher LED at baseline, and presence of mild cognitive impairment (level II PD-MCI) at baseline. Furthermore, mortality in the PD cohorts was clearly higher than expected based on population data, where significantly increased hazard of PD-related mortality was associated with early onset of PD, higher LED at baseline, and presence of PD-MCI at baseline.
Our findings with respect to overall mortality are in agreement with earlier findings by MacLeod et al. [4] on factors frequently associated with mortality in PD based on a large systematic review. They found that increasing age at onset, male sex, presence of dementia, and higher parkinsonian impairment scores are frequently reported to be related to overall mortality in PD. In comparison to mild cognitive impairment, dementia is a more severe state of cognitive decline with functional impairment, and therefore expected to be more strongly related to mortality. We found that an earlier stage of cognitive decline was also related to mortality. Considering previous reports of the association between higher parkinsonian impairment scores and mortality, we did not replicate this finding in terms of an effect of UPDRS-III scores on overall mortality when accounting for LED, but did show a negative impact of higher LED at baseline. Since significant motor impairment is the main reason to start drug treatment, the presence of LED in the model may mask the influence of UPDRS-III on mortality. A post-hoc analysis removing LED from the model confirmed this and showed a significantly increased risk of overall mortality for higher UPDRS-III Levy B score on baseline (HR 1.14, 1.01–1.29 95% CI, p-value 0.04). Therefore, there was a significant relation between motor symptom severity and overall mortality in the data, but this relation no longer had a significant contribution after accounting for LED at baseline. These mutual relations between patient characteristics clearly illustrate the added value of the multivariable analyses used in the current study.
New findings relate to PD-related mortality, which, to the knowledge of the authors, has not been reported for multiple factors beyond age and sex. In contrast to overall mortality, PD-related mortality was related to early onset PD. This finding may be related to the fact that those who develop PD at an early age, when expected overall mortality in the population is low, have a relatively low risk of mortality due to causes unrelated to PD and therefore a long exposure to the risks of PD. Furthermore, levodopa equivalent dose and mild cognitive impairment at baseline were found to increase the risk of PD-related mortality. As for overall mortality, removal of LED from the model led to an increase of the coefficient for UPDRS-III Levy B score, up to a similar estimate as for overall mortality, but not significantly so (HR 1.10, 0.98–1.26 95% CI, p-value 0.10). In general, the similar findings for levodopa equivalent dose, motor symptom severity and mild cognitive impairment with respect to both overall and PD-related mortality were anticipated, since correction for mortality in the general population is not expected to adjust the association between mortality and PD-specific characteristics.
We would like to emphasize that our results with respect to factors found to be associated with mortality, whether overall or PD-specific, do not have a causal interpretation. Our findings are based on observational data and moreover, as illustrated by the unmasking of the effect of motor impairment on mortality when LED is unaccounted for, some factors are collinear. Therefore, our results do not imply any harm of levodopa treatment. Theoretically, the most plausible explanation is that progressive disease in terms of motor impairment leads to both early levodopa treatment and increased mortality. Recent evidence shows the absence of any disease-modifying effect of early levodopa treatment [24].
The implications of our findings for the broader field of Parkinson’s disease research include increased insight into the long-term consequences of patient heterogeneity early in disease and increased insight into the factors associated with this heterogeneity of disease. While mortality is a coarse measure, the importance of age-of-onset and non-dopaminergic features such as cognitive disorder have also been associated with progressive disease in studies aiming find PD subtypes [25–27].
Strong aspects include the collection of data from a cohort of newly diagnosed PD patients, high quality prospective follow-up for mortality resulting in complete mortality data for more than 13 years, and expert diagnosis of PD at baseline and follow-up. Limitations encompass inclusion of consecutive out clinic patients instead of a community-based sample, the median 3.3 months’ lag between time of initial PD diagnosis and baseline measurement, and the presence of exclusion criteria possibly related to mortality (age over 85, severe global cognitive decline, and the presence of somatic illness with a life expectancy of less than 1 year). While commonly occurring, the latter possibly led to overestimation of survival, since exceptionally prone individuals were excluded. In addition, the strong aspect of long follow-up coincides with the baseline data being collected at a time when there was less awareness concerning the possible importance of for instance autonomic failure, REM sleep behavior disorder and other non-dopaminergic features in explaining heterogeneity in PD [25–27]. The same holds for imaging characteristics and cerebrospinal fluid features [28, 29]. While these features may shed additional light on the relation between PD subtypes and mortality in PD, we do not think that their omission affects the credibility and robustness of our findings in terms of well-established measures in PD. Relating to the timing of data collection, the age at time of PD diagnosis (68.8 years in the current cohort) may change over long periods of time (e.g. decrease due to increased opportunity for early diagnosis or increase due to aging of the population). While findings are always most clearly interpreted in their own time-frame, we think the findings in our cohort, with PD diagnosis based on purely on clinical characteristics, translate to current daily practice. Furthermore, due to the moderate number of events with respect to the number of factors evaluated for influence on mortality, we stress that while positive findings probably relate to clear signal, negative findings may relate to lack of power and are less strong.
Concluding, our findings provide confirmation and extension of the literature on overall mortality in PD, and new insights into PD-related mortality. Future research, possibly combining individual-patient-data from high quality studies on mortality in PD, might further improve precision of the estimates, evaluate additional covariates of possible interest (e.g., imaging and biomarker related measures), and include longitudinal follow-up data on the patient characteristics to allow for dynamic updating of the prediction of mortality with each new measurement.
CONFLICT OF INTEREST
Author disclosures:
Jeroen Hoogland reports no disclosures.
Rob de Bie reports grants from ZonMw, grants from Parkinson Vereniging (Netherlands patient organization) and unrestricted research grants from GE Health and Medtronic.
Bart Post reports no disclosures.
Author contributions:
Jeroen Hoogland, study concept and design, execution and interpretation of the statistical analyses, drafting the manuscript.
Bart Post, study concept and design, acquisition of data, critical revision of manuscript.
Rob M.A. de Bie, study concept and design, acquisition of data, critical revision of manuscript.
ACKNOWLEDGMENTS INCLUDING SOURCES OF SUPPORT
Funding sources for study were ZonMw (Dutch organization for health research and innovation) and Dutch Parkinson’s Disease Foundation.
REFERENCES
[1] | Ascherio A , Schwarzschild MA ((2016) ) The epidemiology of Parkinson’s disease: Risk factors and prevention. Lancet Neurol 15: , 1257–1272. doi: 10.1016/S1474-4422(16)30230-7 |
[2] | Elbaz A , Bower JH , Maraganore DM , Mcdonnell SK , Peterson BJ , Ahlskog JE , Schaid DJ , Rocca WA ((2002) ) Risk tables for parkinsonism and Parkinson’s disease. J Clin Epidemiol 55: , 25–31. |
[3] | Postuma RB , Berg D , Stern M , Poewe W , Olanow CW , Oertel W , Obeso J , Marek K , Litvan I , Lang AE , Halliday G , Goetz CG , Gasser T , Dubois B , Chan P , Bloem BR , Adler CH , Deuschl G ((2015) ) MDS clinical diagnostic criteria for Parkinson’s disease. Mov Disord 30: , 1591–1601. doi: 10.1002/mds.26424 |
[4] | Macleod AD , Taylor KSM , Counsell CE ((2014) ) Mortality in Parkinson’s disease: A systematic review and meta-analysis. Mov Disord 29: , 1615–1622. doi: 10.1002/mds.25898 |
[5] | Gelb DJ , Oliver E , Gilman S. , ((1999) ) Diagnostic criteria for Parkinson disease. Arch Neurol 56: , 33–33. doi: 10.1001/archneur.56.1.33 |
[6] | Muslimovic D , Post B , Speelman JD , Schmand B ((2005) ) Cognitive profile of patients with newly diagnosed Parkinson disease. Neurology 65: , 1239–1245. doi: 10.1212/01.wnl.0000180516.69442.95 |
[7] | Fahn S , Elton R ((1987) ) Members of the UPDRS Development Committee, The Unified Parkinson’s Disease Rating Scale, in: FahnS , MarsdenC , CalneD , GoldsteinM , (Eds.), Recent Dev Park Dis, Vol 2: , Macmillan Healthcare Information, Florhamark, NJ, pp. 153–163, 293–304. |
[8] | Folstein MF , Folstein SE , McHugh PR ((1975) ) “Mini-mental state”: A practical method for grading the cognitive state of patients for the clinician. J Psychiatr Res 12: , 189–198. doi: 10.1016/0022-3956(75)90026-6 |
[9] | Esselink RAJ , de Bie RMA , de Haan RJ , Lenders MWPM , Nijssen PCG , Staal MJ , Smeding HMM , Schuurman PR , Bosch DA , Speelman JD ((2004) ) Unilateral pallidotomy versus bilateral subthalamic nucleus stimulation in PD: A randomized trial. Neurology 62: , 201–207. |
[10] | Litvan I , Goldman JG , Tröster AI , Schmand BA , Weintraub D , Petersen RC , Mollenhauer B , Adler CH , Marder K , Williams-Gray CH , Aarsland D , Kulisevsky J , Rodriguez-Oroz MC , Burn DJ , Barker RA , Emre M ((2012) ) Diagnostic criteria for mild cognitive impairment in Parkinson’s disease: Movement Disorder Society Task Force guidelines. Mov Disord 27: , 349–356. doi: 10.1002/mds.24893 |
[11] | Broeders M , de Bie RMA , Velseboer DC , Speelman JD , Muslimovic D , Schmand B ((2013) ) Evolution of mild cognitive impairment in Parkinson disease. Neurology 81: , 346–352. doi: 10.1212/WNL.0b013e31829c5c86 |
[12] | Levy G , Tang MX , Cote LJ , Louis ED , Alfaro B , Mejia H , Stern Y , Marder K ((2000) ) Motor impairment in PD: Relationship to incident dementia and age. Neurology 55: , 539–544. |
[13] | van Buuren S , Groothuis-Oudshoorn K ((2011) ) Mice: Multivariate imputation by chained equations in R. J Stat Softw 45: . doi: 10.18637/jss.v045.i03 |
[14] | R Core Team ((2017) ) R: A language and environment for statistical computing. R Foundation for Statistical Computing, Vienna, Austria. https://www. R-project.org/ (accessed June 1, 2018). |
[15] | White IR , Royston P ((2009) ) Imputing missing covariate values for the Cox model. Stat Med 28: , 1982–1998. doi: 10.1002/sim.3618 |
[16] | Marshall A , Altman DG , Holder RL , Royston P ((2009) ) Combining estimates of interest in prognostic modelling studies after multiple imputation: Current practice and guidelines. BMC Med Res Methodol 9: . doi: 10.1186/1471-2288-9-57 |
[17] | Therneau T ((2015) ) _A Package for Survival Analysis in S_. https://CRAN.R-project.org/package=survival> (accessed June 1, 2018). |
[18] | Therneau TM , Grambsch PM ((2000) ) Modeling Survival Data: Extending the Cox Model, Springer, New York. |
[19] | Harrell Jr FE ((2017) ) rms: Regression Modeling Strategies. https://CRAN.R-project.org/package=rms (accessed June 1, 2018). |
[20] | Central Bureau for Statistics, Levensverwachting; geslacht, leeftijd (per jaar en periode van vijf jaren) (PubId 37360ned; last updated 30/05/2016), Statline. (n.d.). http://statline.cbs.nl/StatWeb/publication/?PA=37360ned (accessed June 1, 2018). |
[21] | Pohar M , Stare J ((2006) ) Relative survival analysis in R. Comput Methods Programs Biomed 81: , 272–278. doi: 10.1016/j.cmpb.2006.01.004 |
[22] | Pohar M , Stare J ((2007) ) Making relative survival analysis relatively easy. Comput Biol Med 37: , 1741–1749. doi: 10.1016/j.compbiomed.2007.04.010 |
[23] | Pohar MP. relsurv: Relative Survival, 2017. https://CRAN.R-project.org/package=relsurv (accessed June 1, 2018). |
[24] | Verschuur CVM , Suwijn SR , Boel JA , Post B , Bloem BR , van Hilten JJ , van Laar T , Tissingh G , Munts AG , Deuschl G , Lang AE , Dijkgraaf MGW , de Haan RJ , de Bie RMA ((2019) ) Randomized delayed-start trial of levodopa in Parkinson’s disease. N Engl J Med 380: , 315–324. doi: 10.1056/NEJMoa1809983 |
[25] | van Rooden SM , Colas F , Martínez-Martín P , Visser M , Verbaan D , Marinus J , Chaudhuri RK , Kok JN , van Hilten JJ ((2011) ) Clinical subtypes of Parkinson’s disease. Mov Disord 26: , 51–58. doi: 10.1002/mds.23346 |
[26] | Fereshtehnejad S-M , Romenets SR , Anang JBM , Latreille V , Gagnon J-F , Postuma RB ((2015) ) New clinical subtypes of Parkinson disease and their longitudinal progression: A prospective cohort comparison with other phenotypes. JAMA Neurol 72: , 863. doi: 10.1001/jamaneurol.2015.0703. |
[27] | Erro R , Picillo M , Vitale C , Palladino R , Amboni M , Moccia M , Pellecchia MT , Barone P ((2016) ) Clinical clusters and dopaminergic dysfunction in de-novo Parkinson disease. Parkinsonism Relat Disord 28: , 137–140. doi: 10.1016/j.parkreldis.2016.04.026 |
[28] | Marras C , Chaudhuri KR ((2016) ) Nonmotor features of Parkinson’s disease subtypes. Mov Disord 31: , 1095–1102. doi: 10.1002/mds.26510 |
[29] | Fereshtehnejad S-M , Zeighami Y , Dagher A , Postuma RB ((2017) ) Clinical criteria for subtyping Parkinson’s disease: Biomarkers and longitudinal progression. Brain 140: , 1959–1976. doi: 10.1093/brain/awx118 |


