
Regional Structural Hippocampal Differences Between Dementia with Lewy Bodies and Parkinson’s Disease
Abstract
Background:
Dementia with Lewy bodies (DLB) and Parkinson’s disease (PD) are considered subtypes of the α-synucleinopathy continuum that show similar and dissimilar clinical and morphological features.
Objective:
To further our understanding of brain abnormalities that might differentiate both disorders more clearly, we performed quantitative magnetic resonance (MR) imaging of the subcortical and cortical grey matter.
Methods:
Three-dimensional T1 weighted 3 tesla MR images of 14 DLB and 62 age- and gender-matched PD patients were examined to study cortical and subcortical grey matter structure. We used volumetric measurements to study total grey matter, and volumes of the pallidum, amygdala, putamen, caudate nucleus, thalamus and hippocampus. Whole-brain and structural network-based methods were used to identify local differences in grey matter and vertex-based shape analysis was used to assess focal hippocampal changes.
Results:
Volumetric, whole-brain and network-based analyses showed reduced hippocampal (p = 0.008) and right parahippocampal region volumes (p = 0.030) in DLB compared to PD patients. Shape analysis showed atrophy in the head and body of the right (p = 0.040) and in the head of the left (p = 0.030) hippocampus of DLB patients.
Conclusion:
DLB patients showed atrophy of the hippocampus and parahippocampal gyrus compared to PD patients with a differential involvement of the head and body of the hippocampus. Further studies should examine if these group-based findings can be used to differentiate both disorders on an individual level.
INTRODUCTION
Dementia with Lewy bodies (DLB) and Parkinson’s disease (PD) are both conditions characterized by the presence of α-synuclein in Lewy bodies and Lewy neurites [1]. Clinical features of patients with DLB and PD overlap, such as symptoms of parkinsonism, psychiatric/behavioral symptoms, autonomic dysfunction and cognitive impairment [2, 3].
However, the timing of symptoms, progression rate, and severity are different, and DLB patients show a decreased efficacy and tolerance of medication. DLB is diagnosed when dementia occurs before or concurrently with parkinsonism [2]. On the contrary, dementia occurring in the presence of well-established PD, is classified as PD with dementia (PDD) [2]. It is debated whether this distinction is valid [3, 4], as it is increasingly recognized that cognitive impairment and dementia are common in all stages of PD, and it is the only common manifestation of both disorders that is being regarded in this manner [4, 5].
At present, a clear distinction, if at all possible, between both disorders is also difficult, because the exact pathogenic mechanisms underlying the clinical heterogeneity are unknown. Previous structural MRI studies have shown grey matter atrophy in DLB and PD patients compared to control subjects [6–9]. Notably, there is evidence that there may be structural brain differences in grey matter between DLB and PD patient as well. However, until now, most studies focused on differences between DLB patients and healthy control subjects, patients with Alzheimer’s disease and patients with PDD [6]. One study compared total grey matter of DLB and PD patients and showed more pronounced atrophy in DLB [10], although DLB and PD groups were not matched for age or gender in this study, which may have influenced the results. Reduced cortical and subcortical volumes have further been found in DLB compared to PD patients, using region of interest approaches [11–13].
In the present study, we therefore evaluated if whole-brain and network-based magnetic resonance imaging (MRI) approaches to measure total and subcortical grey matter volume(s), may contribute in differentiating both disorders more clearly. Finally, vertex-based shape analysis was used to assess focal changes of subcortical structures.
METHODS
Study design and participants
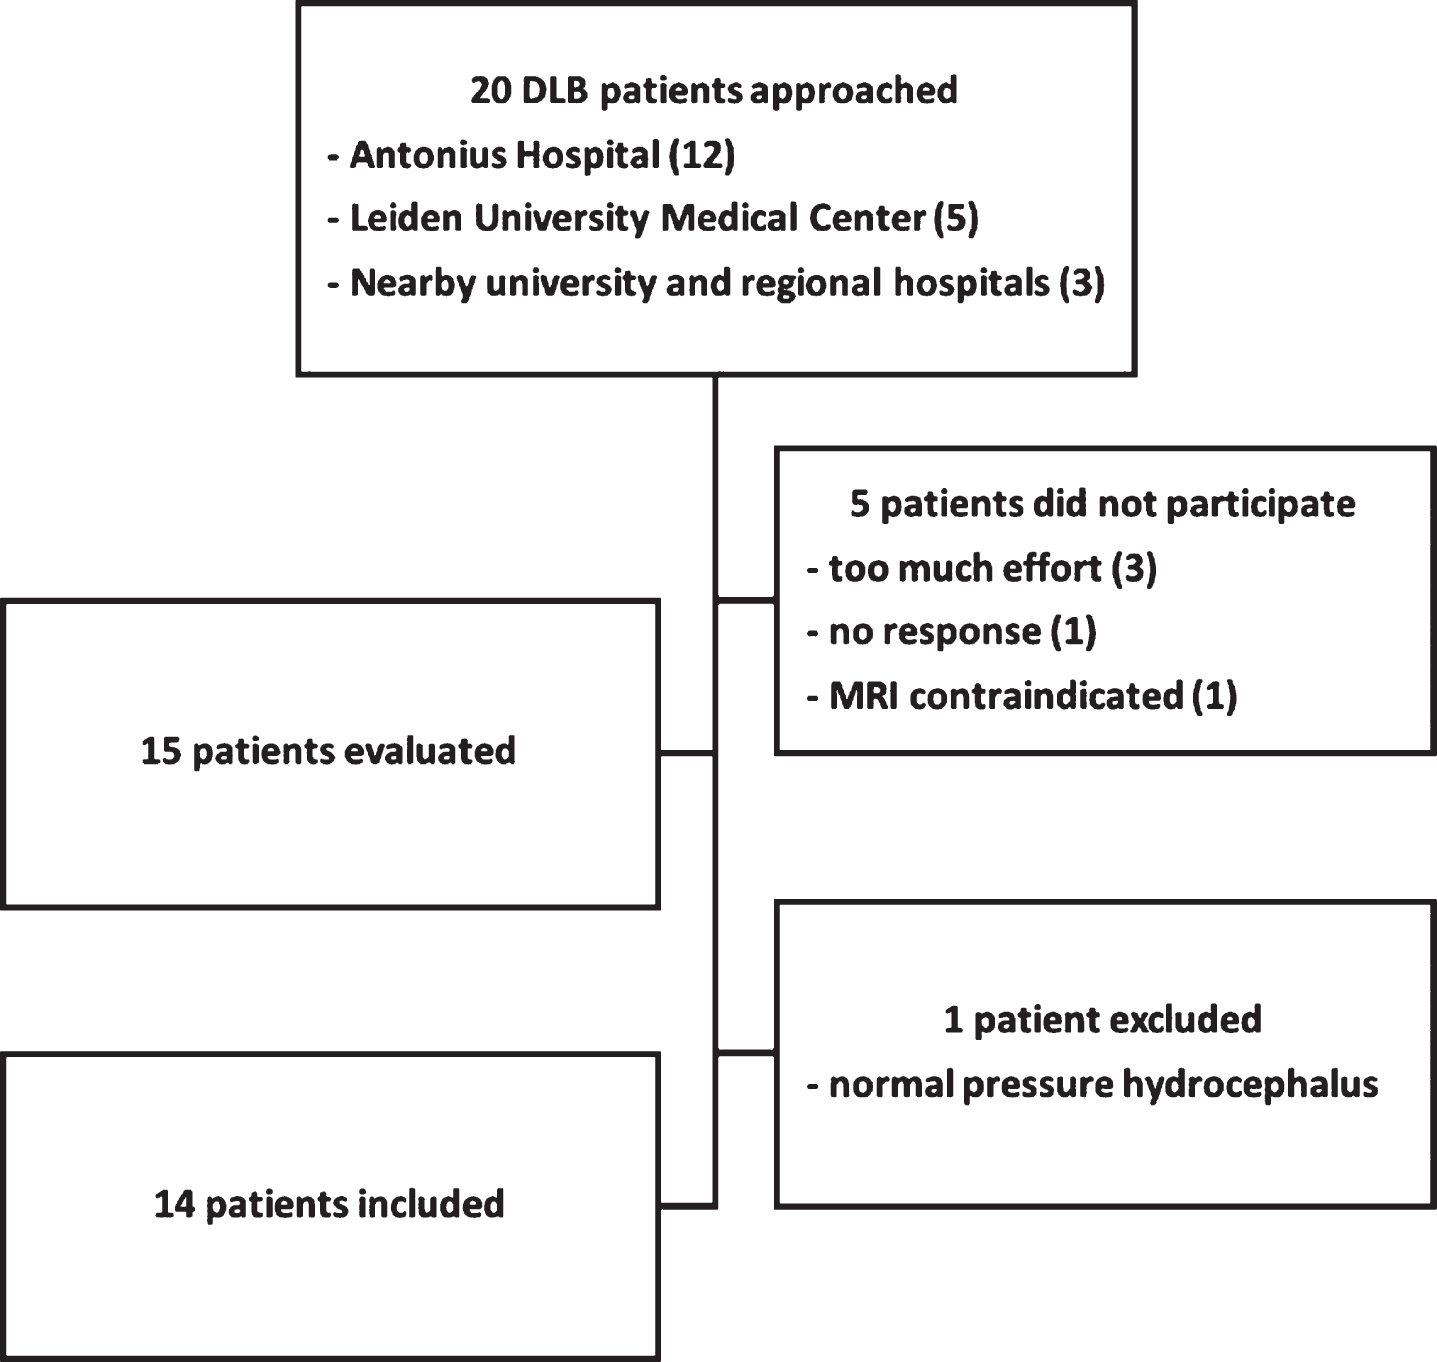
The present cross-sectional study is part of the PROfiling PARKinson’s disease (PROPARK) study. Patients were recruited from the outpatient clinic for Movement Disorders of the Department of Neurology of the Leiden University Medical Center (LUMC, Leiden, the Netherlands) and nearby university and regional hospitals between January 2013 and January 2016. Evaluations occurred at the LUMC. Fourteen DLB patients were included (Fig. 1). Sixty-two PD patients were selected from the PROPARK cohort, matched at group level for age and gender to the DLB patients. All PD patients fulfilled the United Kingdom Parkinson’s Disease Society Brain Bank criteria for idiopathic PD [14] and all DLB patients fulfilled the McKeith diagnostic criteria for probable DLB [15]. Patients were diagnosed with DLB or PD by a movement disorder specialist. Exclusion criteria were: previous or other disorders of the central nervous system, peripheral nerve disorders influencing motor and/or autonomic functioning, and psychiatric comorbidity not related to PD. All participants or his/her closest relative provided written informed consent according to the Declaration of Helsinki. Ethical approval was given by the Medical Ethics Committee of the LUMC.
Fig.1
Flowchart of inclusion for DLB patients.
Clinical assessments
All patients underwent standardized assessments, including an evaluation of demographic and clinical characteristics. Participants were tested while on dopaminergic medication (except for nine drug-naïve PD and eight drug-naïve DLB patients). The Movement Disorder Society Unified Parkinson’s Disease Rating Scale (MDS-UPDRS) motor scale (part III) was used to quantify the severity of motor signs [16]. Additionally, the SEverity of Non-dopaminergic Symptoms in Parkinson’s Disease (SENS-PD) scale was used [17], which is a composite score comprising three items with four response options (0–3) from each of the following domains: postural instability and gait difficulty, psychotic symptoms, excessive daytime sleepiness, autonomic dysfunction, cognitive impairment and depressive symptoms (total range: 0–54). These six domains represent a coherent complex of symptoms that largely do not improve with dopaminergic medication, that is already present in the early disease stages and increases in severity when the disease advances. Higher scores on both scales reflect more severe impairment. The Mini-Mental State Examination (MMSE) [18] and SCales for Outcomes in PArkinson’s disease-COGnition (SCOPA-COG, cognitive functioning, range 0–43) were used to assess cognitive performance. The SCOPA-COG is a valid and reliable instrument examining the following domains: memory, attention, executive functioning and visuospatial functioning [19]; lower scores reflect more severe impairment. Hallucinations were quantified using the hallucination item of the SCOPA Psychiatric 160;Complications (PC, range 0–3) scale [20]. A levodopa dose equivalent (LDE) of daily levodopa (LDE-Dopa), dopamine agonists (LDE-DA), as well as a total LDE was calculated according to the formula developed by Tomlinson et al. [21].
MRI analyses
Three-dimensional T1-weighted images were acquired on a 3 Tesla MRI scanner (Philips Achieva, Best, the Netherlands) with the following parameters: repetition time = 9.8ms, echo time = 4.6ms, flip angle = 8°, field of view 220×174×156 mm, 130 slices with a slice thickness of 1.2 mm with no gap between slices, resulting in a voxel size of 1.15 mm×1.15 mm×1.20 mm. All MRI scans were visually checked to ensure that no major artifacts or abnormalities were present in the data. Analyses were done using the software provided by FMRIB’s software library (FSL, version 5.0.8, Oxford, United Kingdom) [22]. Brain structures were identified using the Harvard-Oxford atlas integrated in FSL.
Volumetric measurements
Grey matter volume was estimated with SIENAX (Structural Image Evaluation, Using Normalization, of Atrophy Cross-sectional) [23], starting by extracting brain and skull images from the T1-weighted images. The brain image is then affine-registered to Montreal Neurological Institute (MNI) standard space, using the skull image to determine the registration scaling. This is primarily done in order to obtain the volumetric scaling factor, to be used as a normalization for head size. Next, tissue-type segmentation with partial volume estimation is carried out in order to calculate total volume of brain tissue and separate estimates of volumes of grey and white matter. FMRIB’s integrated registration and segmentation tool (FIRST) [24] was used to determine volumes of the hippocampus, pallidum, amygdala, putamen, caudate nucleus and thalamus in cm3. FIRST starts by registering each brain image to MNI standard space and fits models for the different structures (meshes) to the images. Boundary correction is applied for the volumetric output.
Voxel-based morphometry
VBM was used to investigate voxel-wise differences in grey matter volume between DLB and PD patients [22, 25, 26]. Structural images were brain-extracted and grey matter-segmented before being registered to the MNI standard space using non-linear registration. The resulting images were averaged and flipped along the x-axis to create a left-right symmetric, study-specific grey matter template with the same number of DLB and PD subjects, in order to create an unbiased template. All native grey matter images were non-linearly registered to this study-specific template and modulated to correct for local expansion (or contraction) due to the non-linear component of the spatial transformation. The modulated grey matter images were then smoothed with an isotropic Gaussian kernel with a sigma of 3 mm and concatenated into a four-dimensional data set, which was also used for further network analyses. A voxel-wise GLM was applied to the four-dimensional data set, using permutation-based non-parametric testing [27], with 5000 permutations, correcting for multiple comparisons across space. The statistical threshold was set at p < 0.05, Family-Wise Error corrected, using the Threshold-Free Cluster Enhancement (TFCE) technique [28]. A grey matter mask was applied in the statistical analysis and age and gender were used as covariates in the model.
Structural covariance networks
Computational network-based analyses are increasingly important in uncovering patterns of brain atrophy, which are not readily apparent by regional structural analysis. It is suggested that anatomical structures that are spatially distributed but functionally linked, co-vary in grey matter density within individuals across a population. These structural covariance networks (SCNs) can be affected by factors like age and disease. We used nine bilateral standardized SCNs, for detailed information see Hafkemeijer et al. [29]. The networks were derived using an independent component analysis, a statistical technique that is also commonly used to study functional network integrity. It defines spatial component maps of maximal statistical independence. The four-dimensional data set of grey matter images derived from our participants was used in a spatial regression against the standard SCN probability maps, using a general linear model (GLM) approach integrated in FSL to calculate individual SCN integrity scores. The integrity score is the beta coefficient of the regression analysis, reflecting the strength of the individual expression in each network. High scores indicate strong individual network expression.
Vertex-based shape analysis
We subsequently analyzed the hippocampal shape differences between DLB and PD patients on a per-vertex basis using hippocampal output from FIRST [24]. Vertex locations from each subject (at a corresponding anatomical point) are projected a surface constructed from the average shapes of all participants. The projections are scalar values that represent the signed, perpendicular distance from the average surface, where a positive value is outside the surface and a negative value is inside. The projection values were stored in a four-dimensional data set, which was used to calculate significant differences in shape between the groups. A GLM was used with an F-test, cluster-based thresholding corrected for multiple comparisons [24]. Age and gender were used as covariates in the statistical model.
Statistical analyses in SPSS
Demographic characteristics were compared using an independent-sample t-test (age) and a chi-square test (gender, number of drug-naïve patients for dopaminergic medication). Differences in normalized total grey matter volume between DLB and PD patients were analyzed with a univariate analysis of variance, adjusted for age and gender. Subcortical structure volume differences were studied using a univariate analysis of variance, adjusted for age, gender and unnormalized total brain volume. Differences in gray matter network scores were studied using a univariate analysis of variance, adjusted for age and gender. Within DLB patients, we investigated correlations between hippocampal volumes, SENS-PD and cognitive performance (SCOPA-COG and MMSE scores) and hallucinations using Spearman’s rank correlation coefficient. SPSS version 23.0 was used for all statistical analyses (IBM SPSS Statistics for Mac, Version 23.0. Armonk, NY: IBM Corp.).
RESULTS
There were no significant differences in gender, age and motor symptom severity (MDS-UPDRS III score) between the groups (Table 1). The mean disease duration was 3 years shorter in DLB compared to PD patients. DLB patients had a higher predominantly non-motor symptoms burden (SENS-PD score: 8 points difference). Both groups had cognitive deficits, but DLB patients were more cognitively impaired than PD patients (SCOPA-COG: 8 points difference, range 0–43 and MMSE score: 8 points difference, range 0–30). DLB patients had more (severe) hallucinations than PD patients, as the latter had no or only mild hallucinations with complete insight. Six DLB patients used dopaminergic medication, these patients used on average 546 mg/day less dopaminergic medication than PD patients. No differences in normalized total grey matter volume were found.
Table 1
Main characteristics of participants
| Characteristic (score range) N | DLB patients 14 | PD patients 62 | p-value |
| Men/women | 11/3 | 44/18 | 0.745 |
| Age, years | 73.1 (6.0) | 71.9 (4.1) | 0.597 |
| Disease duration, years | 5.5 (3.4) | 8.7 (4.2) | 0.011* |
| MDS-UPDRS motor score (0–132) | 36.5 (19.5) | 39.2 (16.7) | 0.608 |
| SENS-PD (0–54)a | 24.5 (8.0) | 16.2 (5.9) | <0.00* |
| MMSEb | 20.5 (6.0) | 28.3 (1.7) | <0.001* |
| SCOPA-COG (0–43)c | 17.1 (5.9) | 24.9 (4.1) | <0.001* |
| SCOPA PC hallucination item (0–3)d | 0 (2)∧ | 0 (0) | <0.019* |
| Total LDE, mg/daye | 389.7 (283.2) | 935.7 (513.6) | 0.014* |
| Drug-naïve patients | 8 | 9 | 0.001* |
| Grey matter volume, normalized | 665.3 (32.7) | 680.7 (40.7) | 0.335 |
Values are means (standard deviation) for continuous variables, numbers for gender and median (interquartile range) for hallucinations. MDS-UPDRS, Movement Disorder Society-Unified Parkinson’s Disease Rating Scale; SENS-PD, SEverity of Non-dopaminergic Symptoms in Parkinson’s Disease; MMSE, Mini-Mental State Examination; SCOPA-COG, SCOPA COGnition; PC, Psychiatric Complications; LDE, Levodopa dosage equivalent; n/a, not applicable. ∧range: 0–3. DLB/PD: aN = 11/58, bN = 14/60, cN = 12/57, dN = 13/62 eN = 6/51, *p < 0.05.
Voxel-based morphometry
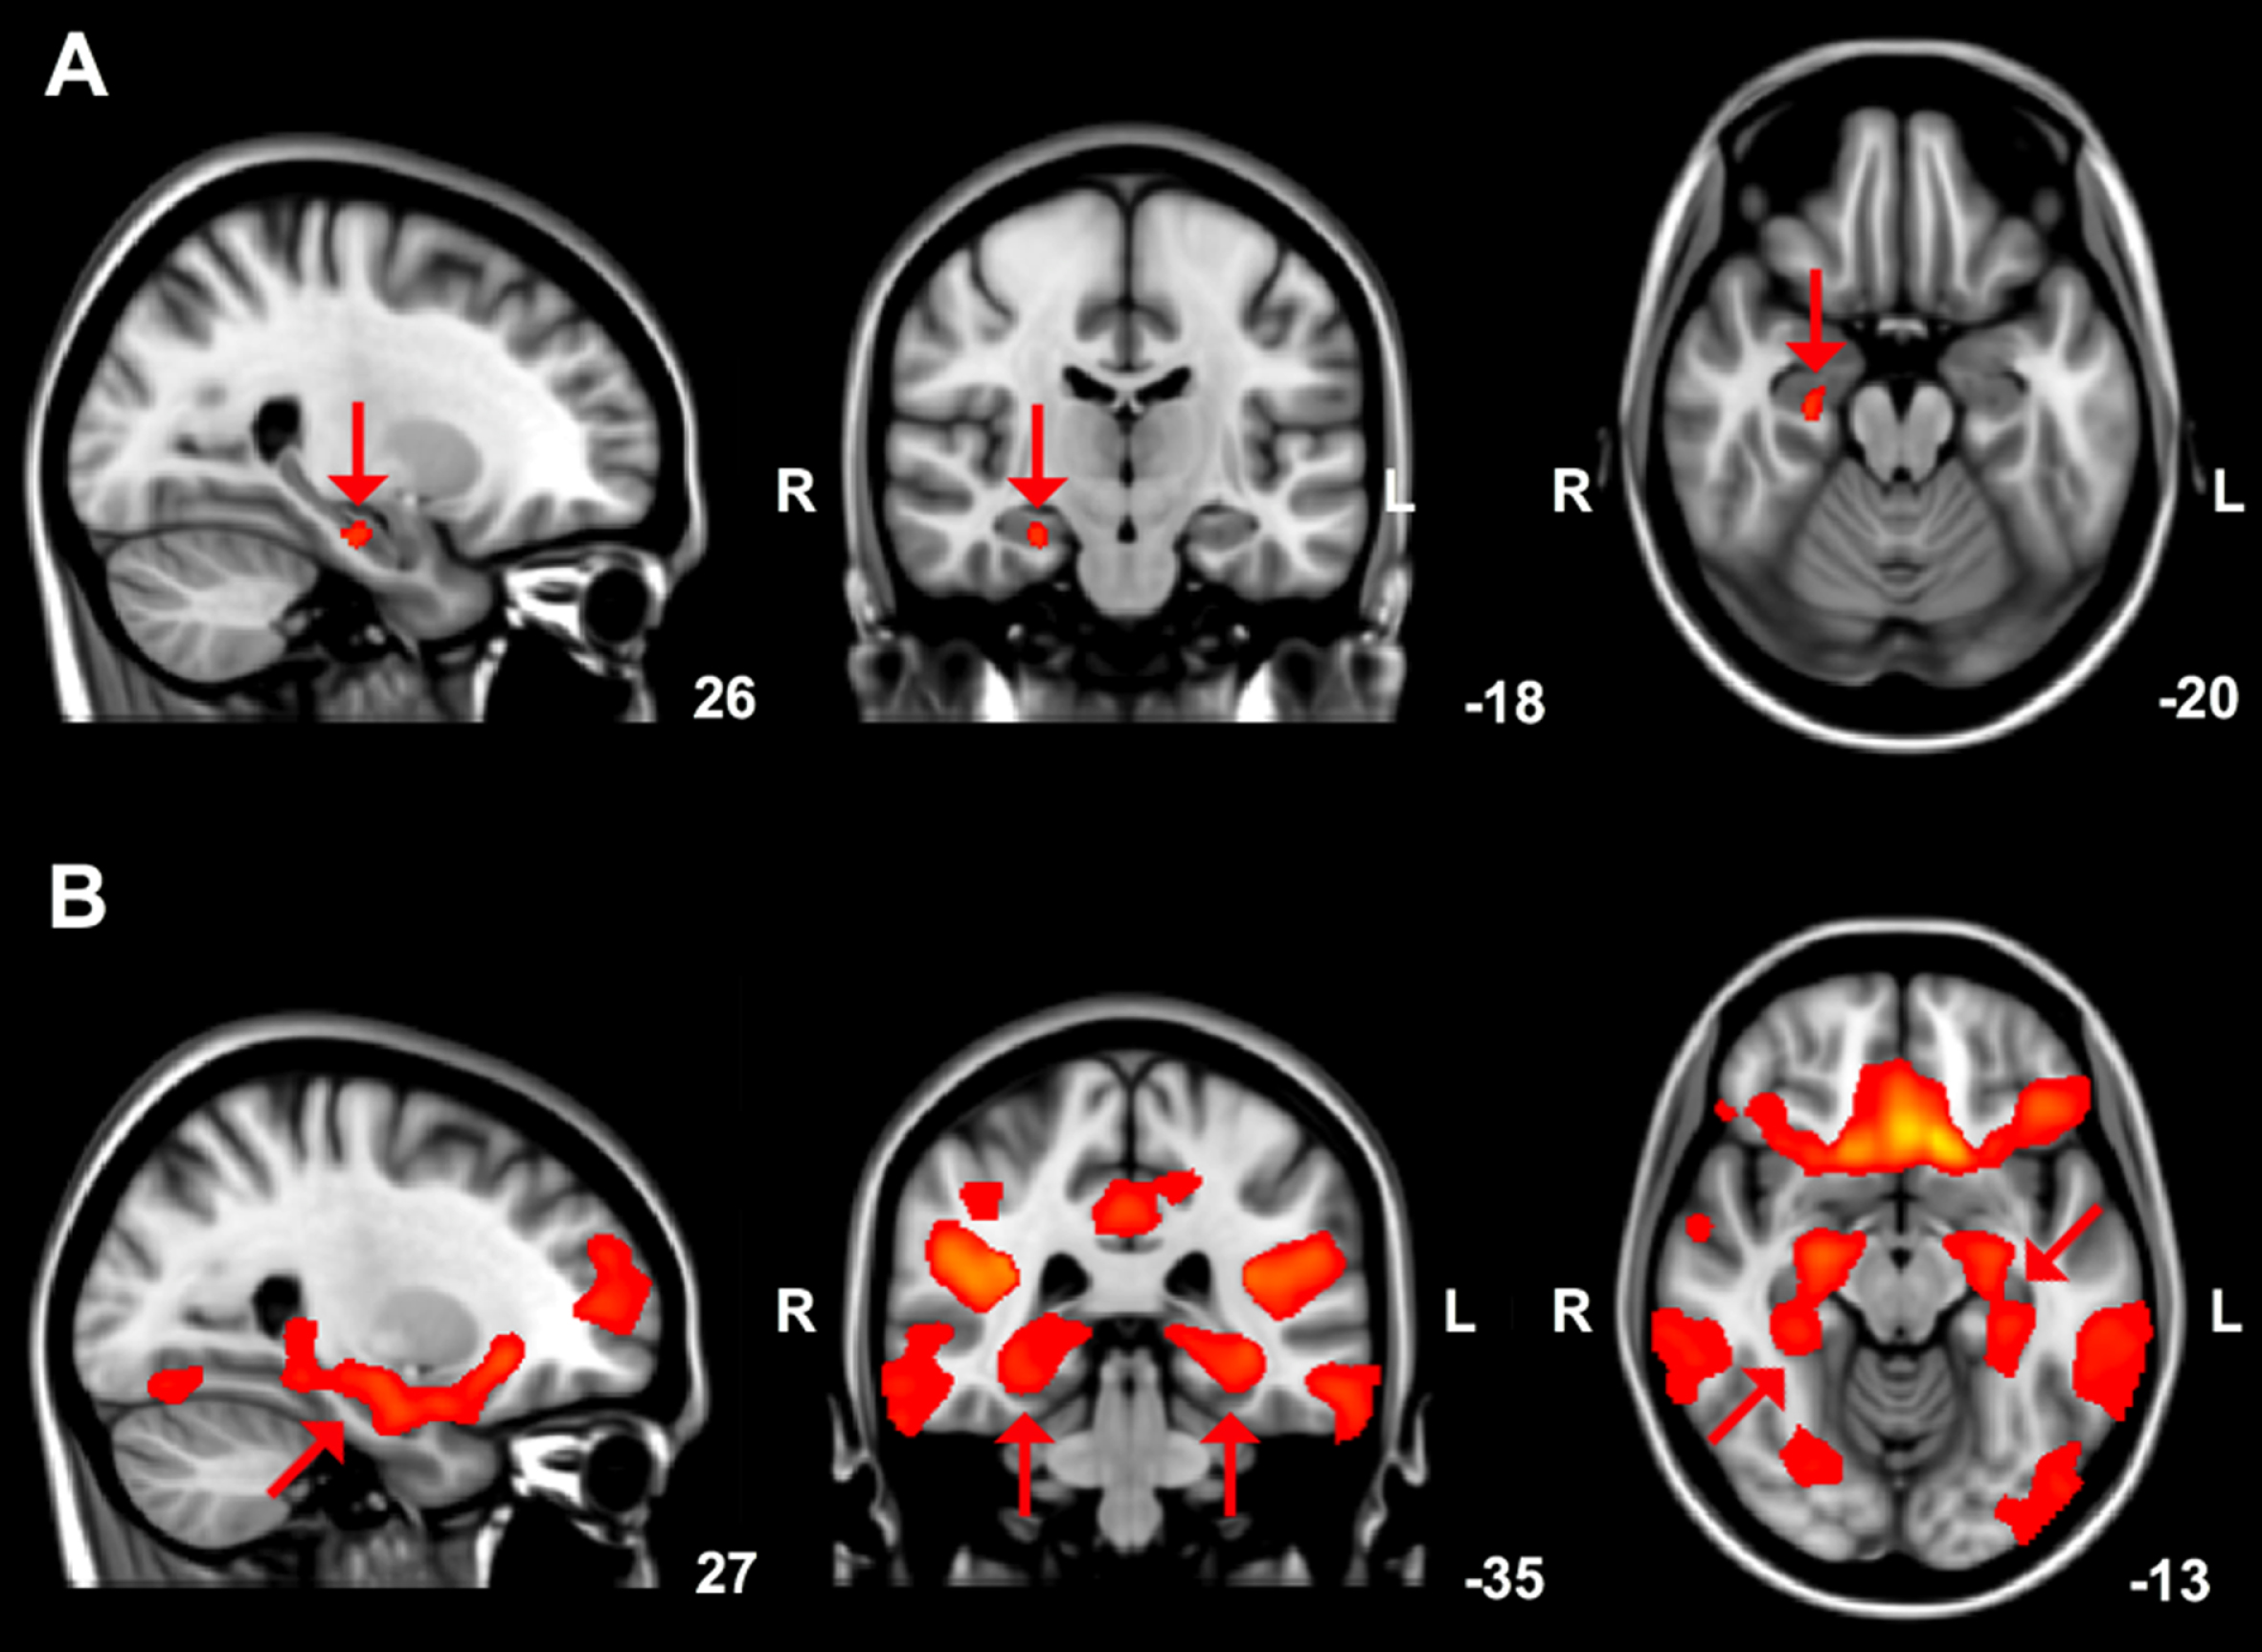
Whole brain voxel-wise differences in grey matter volume are shown in (Fig. 2A). DLB patients showed reduced grey matter compared to PD patients in the right hippocampus and right parahippocampal regions (Fig. 2A, red areas, p = 0.030 most significant voxel).
Fig.2
A) Brain areas showing reduced (arrows) grey matter volume in DLB compared to PD patients, overlaid on the MNI standard cerebral image with accompanying coordinates. Results with a threshold-free cluster enhancement (TFCE) family-wise error corrected p-value < 0.05 are shown. B) Grey matter structural covariance posterior cingulate cortex network, overlaid on the most informative slices of the MNI standard cerebral image with accompanying coordinates. Arrows indicate the parahippocampal gyrus and hippocampus.
Volumetric measurements
Mean total hippocampal volume was 0.7 cm3 lower in DLB compared to PD patients (Table 2). Volume estimates were also performed for the left and right hippocampus separately and showed lower hippocampal volumes in DLB compared to PD patients in both the right (p = 0.009, mean difference 0.4 cm3) and left (p = 0.026, mean difference 0.3 cm3) hemisphere. In the DLB group, associations between hippocampal volume and cognitive performance were tested and showed a correlation coefficient of 0.572 (MMSE score; p = 0.033; right hippocampus: rs = 0.619, p = 0.018; left hippocampus: rs = 0.384, p = 0.176) and 0.371 (SCOPA-COG score; p = 0.235; right hippocampus: rs = 0.308, p = 0.330; left hippocampus: rs = 0.228, p = 0.477). For hippocampal volume and predominantly non-motor symptom severity (SENS-PD score) Spearman’s rho was 0.055 (p = 0.873; right hippocampus: rs = 0.023, p = 0.947; left hippocampus: rs = 0.077, p = 0.821). The correlation coefficient for hippocampal volume and hallucinations (hallucination item SCOPA-PC) in the DLB group was –0.477 (p = 0.100; right hippocampus: rs = –0.547, p = 0.053; left hippocampus: rs = –0.358, p = 0.229).
Table 2
Volumetric measurements
| Characteristic (score range) N | DLB patients 14 | PD patients 62 | p-value |
| Hippocampus | 6.4 (0.3) | 7.1 (0.1) | 0.008* |
| Pallidum | 3.5 (0.2) | 3.6 (0.1) | 0.458 |
| Amygdala | 2.4 (0.1) | 2.3 (0.1) | 0.444 |
| Putamen | 8.5 (0.3) | 8.8 (0.1) | 0.291 |
| Caudate nucleus | 6.7 (0.2) | 6.6 (0.1) | 0.666 |
| Thalamus | 13.9 (0.3) | 14.2 (0.1) | 0.284 |
Values are estimated marginal means in cm3 (standard error), reported as the combined volume of right and left regions, adjusted for age and gender and unnormalized total brain volume. *p < 0.05.
Vertex-based shape analysis
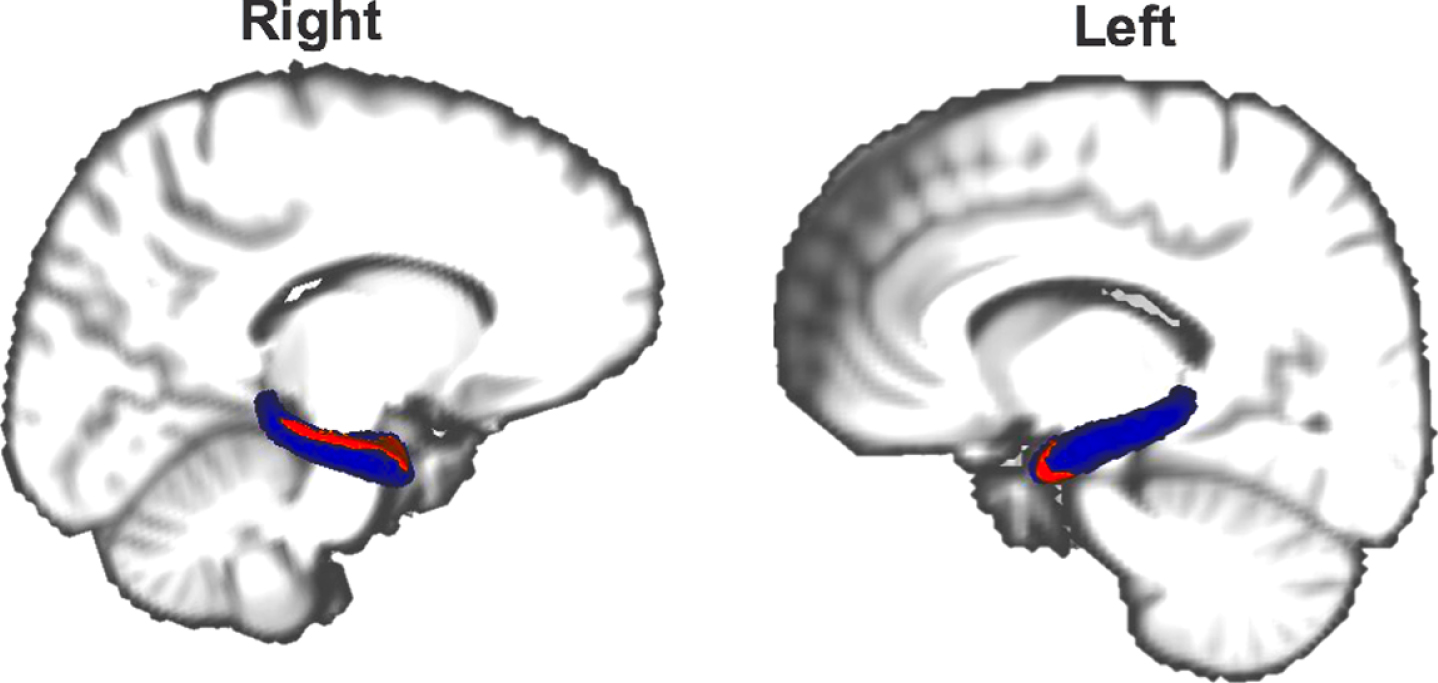
Based on the findings of the volumetric measurements and VBM we performed a vertex-based shape analysis to explore potential shape differences of the hippocampus between DLB and PD patients. Atrophy was found in the head and body of the right (p = 0.040; Fig. 3) and in the head of the left hippocampus (p = 0.030; Fig. 3) of DLB compared to PD patients.
Fig.3
Atrophy (red) of the hippocampus (blue) in DLB compared to PD patients. Results with Family-wise error corrected p-value < 0.05 are shown. The reader is referred to the web version of this article for interpretation of the references to color in this figure legend.
Structural covariance networks
Integrity scores of nine structural covariance grey matter networks are shown in Table 3. In DLB patients, the integrity of the anatomical posterior cingulate cortex network (network C: comprising regions of the parahippocampal gyrus and hippocampus; Fig. 2B) was significantly lower than in PD patients (p = 0.009). No significant differences were found in the other eight structural covariance networks between DLB and PD.
Table 3
Structural covariance networks
| Network N | DLB patients 14 | PD patients 62 | p-value | |
| A | Thalamus network | 0.003 (0.002) | 0.001 (0.001) | 0.472 |
| B | Lateral occipital cortex network | 0.018 (0.002) | 0.019 (0.001) | 0.471 |
| C | Posterior cingulate cortex network | 0.044 (0.002) | 0.050 (0.001) | 0.009* |
| D | Anterior cingulate cortex network | 0.026 (0.002) | 0.028 (0.001) | 0.572 |
| E | Temporal pole network | 0.005 (0.002) | 0.006 (0.001) | 0.391 |
| F | Putamen network | 0.019 (0.002) | 0.019 (0.001) | 0.825 |
| G | Cerebellum network | 0.031 (0.002) | 0.030 (0.001) | 0.922 |
| H | Cerebellum network | 0.016 (0.002) | 0.016 (0.001) | 0.959 |
| I | Cerebellum network | 0.006 (0.002) | 0.008 (0.001) | 0.134 |
Structural covariance networks are named based on the predominant brain region in the network. Values are estimated marginal means (standard error), adjusted for age and gender. *p < 0.05.
DISCUSSION
The results of this study using different MRI approaches to evaluate grey matter show a consistent (para)hippocampal volume loss in DLB compared to PD patients. Vertex-based shape analysis further showed atrophy in the head and body of the right and head of the left hippocampus in DLB compared to PD patients. Except for (para)hippocampal atrophy in DLB patients, no other structural differences in grey matter between DLB and PD patients were found.
The findings in this study are in line with the results of earlier studies [11–13], although these studies applied region of interest approaches to investigate differences between DLB and PD. Gazzina et al. and Borroni et al. further reported lower thalamus, caudate nucleus and middle occipital gyrus volume in DLB compared to PD patients [10, 12]. In both studies, the DLB group was older (Gazzina et al: DLB 74.4 and PD 69.4 year; Borroni et al.: DLB 74.2 and PD 66.3 year), consisted of more female subjects (Gazzina et al: DLB 43.8% and PD 18.8% female; Borroni et al.: DLB 46.2% and PD 9.1% female) and had higher MDS-UPDRS motor scores than the PD group (Gazzina et al: DLB 20.1 and PD 12.7; Borroni et al.: DLB 20.1 and PD 10.7) [10, 12]. These differences in age, gender and motor symptom severity likely contributed to the more extensive reductions in grey matter in DLB patients as compared to the findings in our study.
Our study shows regional atrophy in the head and body of the right and head of the left hippocampus in DLB compared to PD patients. To our knowledge, this is the first study in which vertex-based shape differences between DLB and PD patients are investigated. Neuropathological studies indicate a relative preservation of the CA1 and subiculum in DLB patients versus healthy control subjects, Alzheimer’s disease, and PD patients [30, 31]. MRI studies investigating hippocampal subfields in Alzheimer’s disease and DLB patients report a relative preservation of the CA1 in DLB patients as well [32, 33]. Collectively, the findings of all studies indicate that further exploration of regional atrophy of the hippocampus and its subfields in differentiating DLB from PD may be worthwhile.
We found that hippocampal volume correlated with cognitive performance (MMSE score) in DLB patients, although 14 is a small sample size to perform a correlation analysis. Nevertheless, the findings are in line with previous studies reporting that atrophy of the hippocampus and parahippocampal gyrus in DLB patients is correlated with cognitive decline [34, 35]. Brain amyloid-β deposition, including deposition in the hippocampus, is more marked in DLB [36]. Although the development of cognitive impairment and dementia seems multifactorial, brain deposition of amyloid-β is proposed to contribute to cognitive impairment in DLB and PD [36]. Moreover, current data suggest that concomitant amyloid-β and α-synuclein pathology may act synergistically to contribute to cognitive impairment [36].
Our findings in DLB patients were most pronounced in the right hemisphere, which is in accordance with earlier studies showing prominent structural and functional alterations in the right hemisphere of DLB patients [33, 37]. There are indications that a predominance of the right hemisphere for visuospatial processing plays a role in visual hallucinations [33, 38, 39]. DLB patients in this study had more (severe) hallucinations than PD patients and although we do not have data on the different types of hallucinations, visual hallucinations generally predominate in DLB and PD [40]. Visual hallucinations are a core feature of DLB [2] and, compared to PD, their prevalence is much higher [31]. In particular the atrophy that we found of the right parahippocampal gyrus in this study could be related to visual hallucinations in DLB patients [41, 42]. Heitz et al. found a correlation between perfusion of the right parahippocampal gyrus and the severity of visual hallucinations in DLB patients [42], while Harding et al. showed that higher Lewy body densities in the parahippocampal gyrus were associated with visual hallucinations in DLB patients [41]. Another study compared DLB with AD patients and also found parahippocampal atrophy in DLB patients [33], supporting the hypothesis that the parahippocampal gyrus plays an important role in visual hallucinations in DLB patients.
We used well-established, reproducible, data-driven methods to investigate grey matter in DLB and PD. We found consistent (para)hippocampal volume loss in DLB compared to PD patients, despite the relatively small number of DLB patients. Nevertheless, the results should be verified in a larger number of subjects. The mean disease duration of the DLB group was shorter than of the PD group in this study and our results may have been more pronounced with similar mean disease durations in both groups. Both groups had a comparable motor symptom severity, but DLB patients had higher predominantly non-dopaminergic symptoms scores and a worse cognitive performance than PD patients. Especially cognitive performance may have contributed to the hippocampal atrophy in DLB patients that we found. An additional group of PDD patients may provide additional inside into the relationship between cognition and our findings. However, it should be considered that PDD generally develops quite late in the disease course, and a large difference in disease duration between groups might lead to difficulties in attributing potential group differences to either differences in disease duration or disease type. It should further be noted that our study was set up to examine structural grey matter differences between DLB and PD patients, and the absence of a group of healthy control subjects did not allow for the detection of regions that are affected by atrophy in both PD and DLB patients. However, previous studies have shown grey matter atrophy in PD and DLB patients as compared to healthy control subjects [6–9].
To summarize, our data unequivocally show atrophy of the hippocampus and parahippocampal gyrus in DLB patients as compared with PD patients. Vertex-based shape analysis confirmed atrophy of the hippocampus in DLB, localized in the head and body. Moreover, integrity of the anatomical network that comprised (para)hippocampal regions, was significantly lower in DLB. These findings indicate that regional hippocampal differences between DLB and PD may be important in the distinction between the two disorders.
CONFLICTS OF INTEREST
The authors have no conflict of interest to report.
ACKNOWLEDGMENTS
We would like to thank all participants and the neurologists who helped recruiting participants.
The work reported in this article was supported by grants from the ‘Stichting ParkinsonFonds’.
REFERENCES
[1] | Jellinger KA ((2009) ) Formation and development of Lewy pathology: A critical update. J Neurol 256: , 270–279. |
[2] | McKeith IG , Boeve BF , Dickson DW , Halliday G , Taylor J-P , Weintraub D , Aarsland D , Galvin J , Attems J , Ballard CG , Bayston A , Beach TG , Blanc F , Bohnen N , Bonanni L , Bras J , Brundin P , Burn D , Chen-Plotkin A , Duda JE , El-Agnaf O , Feldman H , Ferman TJ , Ffytche D , Fujishiro H , Galasko D , Goldman JG , Gomperts SN , Graff-Radford NR , Honig LS , Iranzo A , Kantarci K , Kaufer D , Kukull W , Lee VMY , Leverenz JB , Lewis S , Lippa C , Lunde A , Masellis M , Masliah E , McLean P , Mollenhauer B , Montine TJ , Moreno E , Mori E , Murray M , O’Brien JT , Orimo S , Postuma RB , Ramaswamy S , Ross OA , Salmon DP , Singleton A , Taylor A , Thomas A , Tiraboschi P , Toledo JB , Trojanowski JQ , Tsuang D , Walker Z , Yamada M , Kosaka K ((2017) ) Diagnosis and management of dementia with Lewy bodies: Fourth consensus report of the DLB Consortium. Neurology 89: , 88–100. |
[3] | Postuma RB , Berg D , Stern M , Poewe W , Olanow CW , Oertel W , Obeso J , Marek K , Litvan I , Lang AE , Halliday G , Goetz CG , Gasser T , Dubois B , Chan P , Bloem BR , Adler CH , Deuschl G ((2015) ) MDS clinical diagnostic criteria for Parkinson’s disease. Mov Disord 30: , 1591–1601. |
[4] | Postuma RB , Berg D , Stern M , Poewe W , Olanow CW , Oertel W , Marek K , Litvan I , Lang AE , Halliday G , Goetz CG , Gasser T , Dubois B , Chan P , Bloem BR , Adler CH , Deuschl G ((2016) ) Abolishing the 1-year rule: How much evidence will be enough? Mov Disord 31: , 1623–1627. |
[5] | Chahine LM , Weintraub D , Hawkins KA , Siderowf A , Eberly S , Oakes D , Seibyl J , Stern MB , Marek K , Jennings D , Russell D , Fiocco A , Sethi K , Jackson P , Frank S , Thomas CA , James RC , Simuni T , Borushko E , Stern M , Rick J , Hauser R , Khavarian L , Richard I , Deeley C , Liang GS , Infeld L , Adler CH , Duffy AK , Saunders-Pullman R , Evatt ML , McMurray B , Lai E , Johnson S , DeBakey ME , Subramanian I , Gratiano A , Chung K , Lobb B , O’Conner S ((2016) ) Cognition in individuals at risk for Parkinson’s: Parkinson associated risk syndrome (PARS) study findings. Mov Disord 31: , 86–94. |
[6] | Mak E , Su L , Williams GB , O’Brien JT ((2014) ) Neuroimaging characteristics of dementia with Lewy bodies. Alzheimers Res Ther 6: , 18. |
[7] | Watson R , Colloby SJ ((2016) ) Imaging in dementia with Lewy bodies. J Geriatr Psychiatry Neurol 29: , 254–260. |
[8] | Pan PL , Song W , Shang HF ((2012) ) Voxel-wise meta-analysis of gray matter abnormalities in idiopathic Parkinson’s disease. Eur J Neurol 19: , 199–206. |
[9] | Sterling NW , Lewis MM , Du G , Huang X ((2016) ) Structural imaging and Parkinson’s disease: Moving toward quantitative markers of disease progression. J Parkinsons Dis 27: , 557–567. |
[10] | Borroni B , Premi E , Formenti A , Turrone R , Alberici A , Cottini E , Rizzetti C , Gasparotti R , Padovani A ((2015) ) Structural and functional imaging study in dementia with Lewy bodies and Parkinson’s disease dementia. Parkinsonism Relat Disord 21: , 1049–1055. |
[11] | Kenny ER , Burton EJ , O’Brien JT ((2008) ) A volumetric magnetic resonance imaging study of entorhinal cortex volume in dementia with lewy bodies. A comparison with Alzheimer’s disease and Parkinson’s disease with and without dementia. Dement Geriatr Cogn Disord 26: , 218–225. |
[12] | Gazzina S , Premi E , Turrone R , Acosta-Cabronero J , Rizzetti MC , Cotelli MS , Gasparotti R , Padovani A , Borroni B ((2016) ) Subcortical matter in the α-synucleinopathies spectrum: an MRI pilot study. J Neurol 263: , 1575–1582. |
[13] | Tam CWC , Burton EJ , McKeith IG , Burn DJ , O’Brien JT ((2005) ) Temporal lobe atrophy on MRI in Parkinson disease with dementia: a comparison with Alzheimer disease and dementia with Lewy bodies. Neurology 64: , 861–865. |
[14] | Gibb WR , Lees AJ ((1988) ) The relevance of the Lewy body to the pathogenesis of idiopathic Parkinson’s disease. J Neurol Neurosurg Psychiatry 51: , 745–752. |
[15] | McKeith IG , Dickson DW , Lowe J , Emre M , O’Brien JT , Feldman H , Cummings J , Duda JE , Lippa C , Perry EK , Aarsland D , Arai H , Ballard CG , Boeve B , Burn DJ , Costa D , Del Ser T , Dubois B , Galasko D , Gauthier S , Goetz CG , Gomez-Tortosa E , Halliday G , Hansen LA , Hardy J , Iwatsubo T , Kalaria RN , Kaufer D , Kenny RA , Korczyn A , Kosaka K , Lee VMY , Lees A , Litvan I , Londos E , Lopez OL , Minoshima S , Mizuno Y , Molina JA , Mukaetova-Ladinska EB , Pasquier F , Perry RH , Schulz JB , Trojanowski JQ , Yamada M ((2005) ) Diagnosis and management of dementia with Lewy bodies: Third report of the DLB consortium. Neurology 65: , 1863–1872. |
[16] | Goetz CG , Tilley BC , Shaftman SR , Stebbins GT , Fahn S , Martinez-Martin P , Poewe W , Sampaio C , Stern MB , Dodel R , Dubois B , Holloway R , Jankovic J , Kulisevsky J , Lang AE , Lees A , Leurgans S , LeWitt PA , Nyenhuis D , Olanow CW , Rascol O , Schrag A , Teresi JA , van Hilten JJ , LaPelle N ((2008) ) Movement Disorder Society-sponsored revision of the Unified Parkinson’s Disease Rating Scale (MDS-UPDRS): scale presentation and clinimetric testing results. Mov Disord 23: , 2129–2170. |
[17] | van der Heeden JF , Marinus J , Martinez-Martin P , van Hilten JJ ((2016) ) Evaluation of severity of predominantly non-dopaminergic symptoms in Parkinson’s disease: The SENS-PD scale. Parkinsonism Relat Disord 35: , 29–44. |
[18] | Folstein MF , Folstein SE , McHugh PR ((1975) ) “Mini-mental state”. A practical method for grading the cognitive state of patients for the clinician. J Psychiatr Res 12: , 189–198. |
[19] | Marinus J , Visser M , Verwey NA , Verhey FRJ , Middelkoop H a. M , Stiggelbout AM , Hilten JJ van ((2003) ) Assessment of cognition in Parkinson’s disease. Neurology 61: , 1222–1228. |
[20] | Visser M , Verbaan D , Van Rooden SM , Stiggelbout AM , Marinus J , Van Hilten JJ ((2007) ) Assessment of psychiatric complications in Parkinson’s disease: The SCOPA-PC. Mov Disord 22: , 2221–2228. |
[21] | Tomlinson CL , Stowe R , Patel S , Rick C , Gray R , Clarke CE ((2010) ) Systematic review of levodopa dose equivalency reporting in Parkinson’s disease. Mov Disord 25: , 2649–2653. |
[22] | Smith SM , Jenkinson M , Woolrich MW , Beckmann CF , Behrens TEJ , Johansen-Berg H , Bannister PR , De Luca M , Drobnjak I , Flitney DE , Niazy RK , Saunders J , Vickers J , Zhang Y , De Stefano N , Brady JM , Matthews PM ((2004) ) Advances in functional and structural MR image analysis and implementation as FSL. Neuroimage 23: , 208–219. |
[23] | Smith SM , Zhang Y , Jenkinson M , Chen J , Matthews PM , Federico A , De Stefano N ((2002) ) Accurate, robust, and automated longitudinal and cross-sectional brain change analysis. Neuroimage 17: , 479–489. |
[24] | Patenaude B , Smith SM , Kennedy DN , Jenkinson M ((2011) ) A Bayesian model of shape and appearance for subcortical brain segmentation. Neuroimage 56: , 907–922. |
[25] | Good CD , Johnsrude IS , Ashburner J , Henson RN , Friston KJ , Frackowiak RS ((2001) ) A voxel-based morphometric study of ageing in 465 normal adult human brains. Neuroimage 14: , 21–36. |
[26] | Douaud G , Smith S , Jenkinson M , Behrens T , Johansen-Berg H , Vickers J , James S , Voets N , Watkins K , Matthews PM , James A ((2007) ) Anatomically related grey and white matter abnormalities in adolescent-onset schizophrenia. Brain 130: , 2375–2386. |
[27] | Winkler AM , Ridgway GR , Webster MA , Smith SM , Nichols TE ((2014) ) Permutation inference for the general linear model. Neuroimage 92: , 381–397. |
[28] | Smith SM , Nichols TE ((2009) ) Threshold-free cluster enhancement: Addressing problems of smoothing, threshold dependence and localisation in cluster inference. Neuroimage 44: , 83–98. |
[29] | Hafkemeijer A , Altmann-Schneider I , de Craen AJ , Slagboom PE , van der Grond J , Rombouts SA ((2014) ) Associations between age and gray matter volume in anatomical brain networks in middle-aged to older adults. Aging Cell 13: , 1068–1074. |
[30] | Lippa CF , Smith TW , Swearer JM ((1994) ) Alzheimer’s disease and Lewy body disease: A comparative clinicopathological study. Ann Neurol 35: , 81–88. |
[31] | Harding AJ , Lakay B , Halliday GM ((2002) ) Selective hippocampal neuron loss in dementia with lewy bodies. Ann Neurol 51: , 125–128. |
[32] | Mak E , Su L , Williams GB , Watson R , Firbank M , Blamire A , O’Brien J ((2016) ) Differential atrophy of hippocampal subfields: A comparative study of dementia with Lewy bodies and Alzheimer disease. Am J Geriatr Psychiatry 24: , 136–143. |
[33] | Delli Pizzi S , Franciotti R , Bubbico G , Thomas A , Onofrj M , Bonanni L ((2016) ) Atrophy of hippocampal subfields and adjacent extrahippocampal structures in dementia with Lewy bodies and Alzheimer’s disease. Neurobiol Aging 40: , 103–109. |
[34] | Tagawa R , Hashimoto H , Nakanishi A , Kawarada Y , Muramatsu T , Matsuda Y , Kataoka K , Shimada A , Uchida K , Yoshida A , Higashiyama S , Kawabe J , Kai T , Shiomi S , Mori H , Inoue K ((2015) ) The relationship between medial temporal lobe atrophy and cognitive impairment in patients with dementia with Lewy bodies. J Geriatr Psychiatry Neurol 28: , 249–254. |
[35] | Yavuz BB , Ariogul S , Cankurtaran M , Oguz KK , Halil M , Dagli N , Cankurtaran ES ((2007) ) Hippocampal atrophy correlates with the severity of cognitive decline. Int Psychogeriatrics 19: , 67–77. |
[36] | Gomperts SN ((2014) ) Imaging the role of amyloid in PD dementia and dementia with Lewy bodies. Curr Neurol Neurosci Rep 14: , 472–481. |
[37] | Sabattoli F , Boccardi M , Galluzzi S , Treves A , Thompson PM , Frisoni GB ((2008) ) Hippocampal shape differences in dementia with Lewy bodies. Neuroimage 41: , 699–705. |
[38] | Sanchez-Castaneda C , Rene R , Ramirez-Ruiz B , Campdelacreu J , Gascon J , Falcon C , Calopa M , Jauma S , Juncadella M , Junque C ((2009) ) Correlations between gray matter reductions and cognitive deficits in dementia with Lewy bodies and Parkinson’s disease with dementia. Mov Disord 24: , 1740–1746. |
[39] | Jonas J , Frismand S , Vignal JP , Colnat-Coulbois S , Koessler L , Vespignani H , Rossion B , Maillard L ((2014) ) Right hemispheric dominance of visual phenomena evoked by intracerebral stimulation of the human visual cortex. Hum Brain Mapp 35: , 3360–3371. |
[40] | Eversfield CL , Orton LD ((2018) ) Auditory and visual hallucination prevalence in Parkinson’s disease and dementia with Lewy bodies: a systematic review and meta-analysis. Psychol Med 26: , 1–12. |
[41] | Harding AJ , Broe GA , Halliday GM ((2002) ) Visual hallucinations in Lewy body disease relate to Lewy bodies in the temporal lobe. Brain 125: , 391–403. |
[42] | Heitz C , Noblet V , Cretin B , Philippi N , Kremer L , Stackfleth M , Hubele F , Armspach J , Namer I , Blanc F ((2015) ) Neural correlates of visual hallucinations in dementia with Lewy bodies. Alzheimers Res Ther 7: , 6–14. |


