
The Unique and Combined Effects of Apathy and Depression on Cognition in Parkinson’s Disease
Abstract
Background:
Apathy and depression are associated with poor cognition in patients with Parkinson’s disease (PD). However, the cognitive signature of each syndrome is not well understood. The cognitive consequences of having apathy or depression, versus apathy and depression, are also unclear.
Objective:
This study investigated the unique and combined effects of apathy and depression on cognition in PD patients.
Methods:
PD patients were identified from a clinical research database as having self-reported apathy (n = 21), depression (n = 11), or both (n = 43). PD patients without apathy or depression served as the Control group (n = 49). The groups were of similar age, education, disease severity, age of symptom onset, and medication status. A multivariate analysis of variance (MANOVA) compared the groups on 17 neuropsychological test scores in the domains of attention, motor and psychomotor speed, construction, language, episodic memory, and executive functioning.
Results:
There was a significant overall effect of group: F(18,276) = 2.12, p = 0.006,
Conclusions:
PD patients with apathy alone or depression alone did not perform worse than PD controls on neuropsychological tests. Patients with apathy and depression performed worse than controls, but only on speed-based measures. This suggests that apathy and depression are associated with the same or similar circuits as those of cognitive and motor speed.
INTRODUCTION
Most patients with Parkinson’s disease (PD) will experience apathy, depression, or both in the course of their illness [1]. Literally, apathy refers to a loss of feeling or emotion (pathos), but the term has also been used to describe a reduction of self-generated voluntary behavior [2, 3], also described as abulia [4, 5]. Apathy often occurs as a symptom of depression. However, it is increasingly recognized as a distinct phenomenon in PD [6] and other neurological disorders. Although there is not a clear consensus on which neuroanatomical circuits are implicated [7], neurological diseases that typically present with apathy affect the basal ganglia and forebrain nuclei [3].
Apathy and depression are associated with poor cognition in PD (for a review, see [8]). However, studies of mood and cognition in PD often assess only apathy or depression, and have used inconsistent criteria. Studies have tended to target only one or two cognitive domains, which may miss or not fully capture a cognitive syndrome, and have been variable in their selection of cognitive measures and in their patient criteria (e.g., many studies exclude patients with dementia). Despite these limitations, apathy has been most consistently associated with poor executive functioning and depression has been most consistently associated with poor executive functioning and delayed episodic memory (for reviews, see [7, 8]). However, the findings are quite variable.
Only a few studies have systematically evaluated the cognitive consequences of apathy, depression, and both within the same PD patient sample. These studies have revealed impairments associated with apathy alone [9–12] and apathy with depression [11]. To our knowledge, no study that has assessed both apathy and depression found a specific effect of depressive symptoms alone. However, these studies have similar limitations to those assessing only one affective syndrome: they assessed a limited number of cognitive domains, operationally defined apathy and depression differently from one another, and had varied inclusion and exclusion criteria.
The current study compares the cognitive profiles of PD patients with apathy alone, depression alone, and both apathy and depression, compared with a control group of PD patients with neither emotional syndrome. Our test battery sampled all major cognitive domains and we do not exclude patients with dementia. We anticipated that patients with apathy alone and depression alone would produce similar cognitive profiles as has been demonstrated before –both groups would exhibit poor executive functioning, and the depression alone group would additionally exhibit poor delayed episodic memory, compared to a PD control group. We hypothesized that patients with both apathy and depression would also display poor executive functioning and delayed episodic memory, and worse than the groups with only one mood syndrome.
MATERIALS AND METHODS
All participants were identified from a clinical research database of patients with movement disorders who were evaluated in our neuropsychology clinic between September 2006 and June 2014. Most participants were candidates for deep brain stimulation surgery and were administered the same battery of neuropsychological tests. At the time of their clinical assessment, participants gave their written informed consent to have their data included in this database in accordance with the Johns Hopkins University School of Medicine Institutional Review Board.
The database contained information from 140 patients with PD. Patients were diagnosed by a movement disorders specialist neurologist using the United Kingdom Parkinson’s Disease Society Brain Bank criteria [13]. The neurologist evaluated all participants with the Unified Parkinson’s Disease Rating Scale [14], typically on the same day as their neuropsychological evaluation, but no more than 6 months before or after. Part III of this measure assessed participants’ motor signs on and off medications. Six patients were excluded from analyses because of factors other than PD that could have influenced their cognition: daily heavy marijuana use (n = 1), comorbid essential tremor (n = 2), atypical dystonia (n = 1), atypical psychotic features (n = 1), and normal pressure hydrocephalus (n = 1). Of the remaining 134, 10 (7.5%) were missing data sufficient to preclude analysis. The demographic and clinical characteristics of the remaining 124 participants are shown in Table 1. Handedness and hemibody of symptom onset were self-reported to the neuropsychologist or neurologist. Participants completed neuropsychological tests while “on” their usual medications. Unfortunately, we were not able to compute levodopa equivalent daily dosage from the information contained in our database. However, we report the percentage of participants from each group who were prescribed medications of various kinds (e.g., levodopa, dopamine agonists, etc.).
Participants’ symptoms of depression were assessed with the Geriatric Depression Scale [15]. Participants with total scores of 9 or greater were classified as depressed [16]. Participants’ symptoms of apathy were assessed with the Frontal Systems Behavior Scale - FrSBe –[17]. This is a 46-item behavior rating scale that produces 3 subscales, Apathy, Disinhibition, and Executive Dysfunction. Participants with Apathy T scores of 65 or greater were classified as apathetic. The FrSBe was not reviewed by a recent Movement Disorders Society task force on apathy assessment [18] because it is a multidimensional measure. However, the FrSBe’s apathy scale was supported by a factor analysis among patients with neurodegenerative illnesses including PD [19], and has been commonly used in this population [20, 21]. In patients with traumatic brain injury, the FrSBe apathy scale correlated moderately (r = 0.71) with the Apathy Evaluation Scale [22, 23], and was found to target a loss of goal-directed behavior and cognition, rather than a loss of emotional experience [22]. Participants were included in one of four groups: those without apathy or depression (Control group), those with apathy only (Apathy group), those with depression only (Depression group), and those with both apathy and depression (Bothgroup).
Neuropsychological tests by domain
Attention and processing speed
The Attention raw score from the Dementia Rating Scale –2nd ed. (DRS-2) [24] assessed participants’ auditory attention and working memory (digit span forward and backward), and ability to follow single and multiple-step instructions. The Speed and Comprehension of Language Processing (SCOLP) [25] Speed of Comprehension subtest measured participants’ ability to rapidly determine whether short sentences made sense or not (dependent variable, DV = age-based scaled score). The Trail Making Test, part A, measured participants’ visual scanning and psychomotor speed (DV = total raw time, in sec.).
Visual perception and constructional praxis
The DRS-2 Construction raw score measured participants’ ability to copy simple visual designs, and sign his or her own name.
Language
The 30-item Boston Naming Test [26] was a test of visual confrontation naming (DV = total correct raw score). Category-word fluency (animals and supermarket items; DV = total raw score) assessed participants’ ability to rapidly produce words within given semantic categories.
Learning and memory
Hopkins Verbal Learning Test –Revised (HVLT-R)[27] measured participants’ ability to recall a list of words immediately after hearing them (DV = raw total recall) and after a delay (DV = raw delayed recall). It also assessed participants’ delayed recognition memory for the word list (raw discrimination index). The Brief Visuospatial Memory Test –Revised (BVMT-R) [28] measured participants’ ability to recall geometric figures immediately after seeing them (DV = raw total recall) and after a delay (DV = raw delayed recall). It also assessed participants’ delayed recognition memory for the figures (raw discrimination index).
Executive functions
Letter-word fluency (letters F,A,S,P; DV = total raw score) assessed participants’ ability to rapidly produce words without category constraints. The Trail Making Test [29] part B, measured participants’ visual scanning, psychomotor speed, and attentional switching (DVs = raw time, in sec.). The Delis-Kaplan Executive Functioning System (D-KEFS) [30] Tower subtest measured participants’ planning of a complex, multiple-step action (DV = age-based scaled score). The Brixton Spatial Anticipation Test (BSAT) [31] measured participants’ learning and production of a visuospatial pattern (DV = raw number of errors).
Manual speed/dexterity
The Grooved Pegboard Test measured participants’ ability to rapidly manipulate small pegs (DV = mean raw time, in sec., pooled over four trials, two with each hand).
For some participants, timed neuropsychological tests were discontinued at 5 minutes because of poor performance. For other participants, tests were not discontinued (patients were evaluated by different clinicians who had different preferences in this regard). For participants whose administration was discontinued at 5 minutes, their missing data were replaced with the maximum score observed within their respective group. Data were replaced in this way for the Trail Making Test, part B (Control n = 1; Both n = 4) and the Grooved Pegboard Test (Control n = 1, Both n = 4). When available, someone who knew the participants well (typically a spouse or an adult child) completed the Lawton Instrumental Activities of Daily Living and Physical Self-Maintenance scales [32] and the short form of the Informant Questionnaire of Cognitive Decline in the Elderly (IQCODE) [33]. The IQCODE asks the informant to rate on a 5-point Likert scale how much the patient has declined within the past 10 years in performing 16 everyday cognitive tasks.
Not all scores in the neuropsychological test battery were analyzed in order to limit the number of variables in the statistical models. The DRS-2 also includes an Initiation/Perseveration Scale, Conceptualization Scale, and a Memory Scale. These were not analyzed because these domains were better assessed by other tests in the battery. However, the DRS-2 raw Total Score (summarizing all domain scores) was analyzed. The SCOLP Spot-the-Word subtest was not analyzed because this is a test of word knowledge, a “crystallized” ability, whereas all other test scores were of “fluid” abilities.
Univariate analyses of variance (ANOVAs) compared the groups on the dependent variables identified above. Variables on which the groups differed significantly were entered together into a multivariate analysis of variance (MANOVA) to further evaluate group differences while better accounting for family-wise alpha inflation. Significant univariate effects were decomposed with Tukey’s HSD tests.
RESULTS
Group characteristics
There were 49 (40%) participants in the Control group, 21 (17%) in the Apathy group, 11 (9%) in the Depression group, and 43 (35%) in the Both group. These proportions are similar to population-based samples of PD patients [1]. Univariate ANOVAs revealed that the groups were similar in age, sex, years of education, handedness, age at symptom onset, hemibody of symptom onset, and overall cognition as assessed by the DRS-2 total score (see Table 1). Eight participants (6%) produced a total score ≤123 on the DRS-2, suggestive of dementia [34] (Control n = 3; Apathy n = 2; Depression n = 1; Both n = 2). The groups were similar in their UPDRS motor (part III) scores off medication. On medication, the groups with significant apathy trended towards a higher score on this measure (i.e., greater number or more severe motor symptoms). The Both group reported the same level of apathy as the Apathy group (p = 0.24), and the same level of depression as the Depression group (p = 0.74). The two groups with apathy showed a statistical trend towards a higher score (indicating less independence) than the Control group on the Lawton measure of instrumental activities of daily living (ADL). The Depression group was rated as needed more help with basic ADLs than the Control group (p = 0.03). Raters described members of each group as having undergone similar cognitive decline on the IQCODE. The proportion of participants from each group taking medications was similar for most medication classes. However, participants with both apathy and depression were less likely to be taking dopamine agonists.
The FrSBe Apathy scale and the GDS-30 were Pearson correlated (r = 0.65, p < 0.001) when participants from all groups were analyzed together. However, when the groups were analyzed independently, only the Control group (r = 0.42, p = 0.003) and the Both groups (r = 0.50, p = 0.001) had significant correlations between the two measures. The measures were not significantly correlated for the Depression (r = 0.44, p = 0.176) or Apathy (r = 0.22, p = 0.341) groups.
Test scores
Univariate ANOVAs revealed significant group differences (p < 0.05) for the following variables: letter-word fluency, category-word fluency, SCOLP Speed of Comprehension, Trail Making Test A, Trail Making Test B, and Grooved Pegboard Test (Table 2). There were statistical trends towards group differences on the HVLT-R discrimination index and BVMT-R delayed recall. When the variables with significant group differences were entered into a MANOVA, the overall effect was significant:F(18, 261) = 2.10, p = 0.007,
Because fewer members of the Both group were taking dopamine agonist medication than members of other groups, we compared the cognitive test scores of Both group members prescribed dopamine agonist medication (n = 9) to those not prescribed those medications (n = 32; missing medication data n = 2). Independent samples t tests did not reveal group differences on any test (all ps≥0.11). This suggests that the group’s overall cognitive performance is not strongly influenced by members taking or not taking dopamine agonist medication.
DISCUSSION
This study investigated the cognitive profiles of PD patients with apathy, depression, and both, compared to PD patients without either mood syndrome. These four groups were similar to one another in cognitively relevant demographic and clinical variables. This study had two main findings. First, the only cognitive test scores that differed among the groups were from measures of reading speed (SCOLP), psychomotor speed (TMT, parts A and B), verbal fluency (letter-word; category-word), and manual speed/dexterity (Grooved Pegboard). There was no effect of mood status on (untimed) measures of attention, construction, visual confrontation naming, episodic memory, or executive functioning. Every timed score in our test battery, but not one untimed test score, yielded group differences. This suggests that the mechanism by which apathy and depression affect cognition is by slowing motor and cognitive processes, and/or that they associate with similar neural circuits.
The second major finding of this study is that having apathy and depression is worse for cognition than having either mood syndrome alone. The Apathy and Depression groups did not show specific impairment in the cognitive domains that we predicted (executive functioning and delayed memory), but as hypothesized, the Both group performed worse on average than the groups with only one mood syndrome. Although the only significant contrasts were between the Control and Both groups, our findings do not necessarily mean that apathy alone and depression alone are cognitively benign. Figure 1 shows that some participants from the Depression group, and particularly from the Apathy group, also performed meaningfully worse than the PD Control group.
The study by Santengelo et al. [11] provides a relatively comprehensive evaluation of the cognitive effects of apathy and depression in PD patients, and is most comparable to this study. Our findings are similar to theirs in that our Depression group did not perform statistically worse than Controls on any neuropsychological test. Their Apathy group, compared with their Control group, trended towards being slower on the Stroop Color Naming subtest and produced a worse interference score. Their Apathy and Both groups performed worse than Control participants on the Frontal Assessment Battery, a brief measure of executive functions. Unlike our findings, their Apathy group performed similarly, and in fact, slightly worse than their Both group across neuropsychological tasks, suggesting that apathy alone is sufficient for cognitive impairment. They found group differences on constructional tasks, whereas we did not. Unlike our study, Santengelo et al. did not show an effect of apathy, depression, or both on letter-cued fluency or category-cued fluency. These authors did not study episodic memory. Butterfield, Cimino, Hauser, & Sanchez-Ramos [12] observed an effect of apathy (with and without depression) on verbal episodic memory, whereas we did not. As mentioned previously, the literature on mood and cognition in PD is quite varied. Our findings support or contradict isolated published results depending on the task and group. However, the clearest and most meaningful contributions of our data are that (a) tests requiring cognitive and motor speed are most affected by apathy and depression, and (b) that apathy and depression are most detrimental to cognition when they are both present.
There are several potential reasons why our findings are somewhat different from the findings of others. Many of our patients were referred to our clinic because they were candidates for deep brain stimulation (DBS) surgery, which likely introduced bias in the ascertainment of participants. Our patient sample spans a larger range of disease severity and includes some patients with probable dementia (approximately 7%) based on their DRS-2 total scores. On average, our patients had PD for 2–4 years more than patients reported in similar studies [10–12]. These factors suggest that our PD sample had more advanced disease than the patient samples of other studies. However, our groups were similar to each other on markers of disease severity (e.g., UPDRS scores, disease duration, age at symptom onset), so as not to confound interpretation of cognitive score differences.
Our findings do not speak directly to the underlying pathophysiology of poor cognition in patients with apathy and/or depression. It is commonly espoused that fronto-striatal dysfunction is a common mechanism that may underlie apathy [2], depression [35] and some of the cognitive deficits found in PD [36–39]. In this case, it makes sense that patients with both apathy and depression displayed the slowest motor and psychomotor speed (including verbal fluency), which are known to rely on fronto-striatal circuits [40]. However, cognition, apathy, and depression are also associated with complex and nuanced relationships among cholinergic, noradrenergic, and serotonergic systems, as well as other factors [39, 41–43]. Functional neuroimaging studies have found that the neural correlates of apathy can be dissociated from the neural correlates of depression in patients with PD [44, 45], but a clear consensus has not been reached (for a review, see [7]).
Recent reports of mood and cognition in PD, including the current study, have tested patients while they are on medications. However, the role of medication classes and doses is unclear. Ours is the only study to report classes of patient medications (levodopa, dopamine agonists, etc.). Varanese et al. [10] reported levodopa equivalent daily dose (LEDD), but did not comment on its potential relationships with apathy, depression, and cognition. Other recent studies of mood and cognition have not reported LEDD [11, 12]. Our database did not permit us to compute LEDD, but we were able to compare the proportion of group members who were prescribed different classes of medications. The groups were similar in the classes of medications they were prescribed, except that fewer members of the Both group were prescribed dopamine agonist medication. It is not likely that the absence of agonist medication contributed to their poor performance on cognitive testing. A follow-up analysis revealed that members of the Both group who were prescribed agonist medication did not differ on any cognitive test from members of the Both group who were not prescribed agonist medication.
The study of apathy and cognition is limited by unclear and multiple meanings of apathy, for example, as a lack of emotional experience, as a loss of self-generated voluntary behavior, or both. Starkstein and Leentjens [46] proposed diagnostic criteria for an apathy syndrome, which required diminished goal directed behavior (e.g., dependency on prompts to perform activities), diminished goal directed cognition (e.g., lack of interest in learning), and diminished “concomitants of goal directed behavior,” such as unchanging or flat affect, or lack of emotional reactivity. Despite this third criterion, the patient’s own experience of emotion may not be fully captured by this definition; patients’ display of affect may be influenced by hypomimia, for example. The Frontal Systems Behavior Scale more effectively captures a loss of goal-directed behavior than a loss of emotional experience [22]. It will be beneficial to replicate and extend our findings with other measures of apathy that better capture the patients’ experience of emotion, like the Lille Apathy Rating Scale [47]. Because patients may not have full insight into their own condition, it will also be important for our findings to be replicated with informant reported measures of apathy, such as the informant version of the Apathy Scale [48].
We described the Both group as having two mood syndromes –apathy and depression. However, it is difficult to say whether these patients truly have two disorders, or whether they have one with both apathetic and depressive features. For example, it is possible that by displaying more features of apathy, the Both group simply had worse depression than the Depression group. On one hand, the GDS scores were not different between these groups, suggesting equivalent depression. On the other hand, the FrSBE Apathy Scale and the GDS scores were moderately correlated among members of the Both group, indicating that patients with more severe depression also had more severe apathy. The relationship between apathy and depression, particularly in patients with neurological illness, is complex and poorly understood. Self-report and informant-report measures may not produce satisfying answers to this conceptual problem, as this leads to problems with operational definitions and specific assessment measures. More satisfying answers may come from structural and functional imaging studies of patients with one or both mood syndromes to determine if underlying anomalies are a matter of degree or of type. Currently, there is evidence that the two syndromes are dissociable, for example, with resting state functional magnetic resonance imaging [45], but there is not yet a consensus on which neuroanatomical circuits are most strongly implicated [7].
In summary, this study compared the neuropsychological profiles of PD patients with apathy, depression, and both, compared with a PD Control group. This study included patients with a wider range of disease severity than has been previously reported, and did not exclude patients with dementia. Our data revealed that only group differences were between the Control group and the group with both apathy and depression. Specifically, The Both group performed worse on tests of manual and psychomotor speed (including verbal fluency). This indicates that the presence of both apathy and depression is worse for cognition than either mood syndrome alone. This suggests that these mood syndromes affect cognition primarily by slowing motor and psychomotor speed, and/or that they share similar neural circuitry.
CONFLICT OF INTEREST
The authors have no conflict of interest to report.
FINANCIAL DISCLOSURES
No author has any financial disclosures related to this study.
Within the past 12 months, author M.C.’s salary has been supported by clinical fees and by a stipend from the Copper Ridge Institute, Inc. (paid to Johns Hopkins University). Author Z.M. has receivedconsulting fees from Ipsen, the Massachusetts Medical Society, and NAVIDEA Biopharmaceuticals. Z.M. has received grant support (paid to Johns Hopkins University) from AbbVie, NIH, Michael J. Fox Foundation, and the National Parkinson Foundation. Author J.B. has received grant support from the NIH, a stipend from the Copper Ridge Institute, Inc., clinical fees (all the above contributing to his salary from the Johns Hopkins University). He has also been a consultant to InVentiv Health, Inc. and has given expert witness consultation and testimony in multiple personal injury and medical malpractice cases. Author S.A. has no disclosure.
ACKNOWLEDGMENTS
The authors thank Mr. Ryan Jollie for his assistance with data entry and Dr. Kelly Mills for his assistance interpreting some of the findings.
REFERENCES
1 | Ziropadja L, Stefanova E, Petrovic M, Stojkovic T, Kostic VS (2012) Apathy and depression in Parkinson’s disease: The Belgrade PD study report Parkinsonism Relat Disord 18: 339 342 |
2 | Levy R, Dubois B (2006) Apathy and the functional anatomy of the prefrontal cortex-basal ganglia circuits Cereb Cortex 16: 916 928 |
3 | Levy R (2012) Apathy: A pathology of goal-directed behaviour: A new concept of the clinic and pathophysiology of apathy Rev Neurol (Paris) 168: 585 597 |
4 | Heilman KM, Watson RT (1991) Intentional motor disorders In Frontal Lobe Function and Dysfunction Levin HS, Eisenberg HM, Benton AL Oxford University Press Oxford |
5 | Ribot TH (1904) Les Malades de la Volonte Alcan Paris |
6 | Kirsch-Darrow L, Marsiske M, Okun MS, Bauer RM, Bowers D (2011) Apathy and depression: Separate factors in Parkinson’s disease J Int Neuropsychol Soc 17: 1058 1066 |
7 | Santangelo G, Trojano L, Barone P, Errico D, Grossi D, Vitale C (2013) Apathy in Parkinson’s disease: Diagnosis, neuropsychological correlates, pathophysiology and treatment Behav Neurol 27: 501 513 |
8 | Poletti M, De Rosa A, Bonuccelli U (2012) Affective symptoms and cognitive functions in Parkinson’s disease J Neurol Sci 317: 97 102 |
9 | Quilodran R, Viñales L, Araneda A, Santos I, Castilla F (2014) Modulation of feedback-related negativity during trial-and-error task in Parkinson disease: Assessing the role of apathy and depression in cognitive deficits (P5. 244) Neurology 82: P5 P244 P245 |
10 | Varanese S, Perfetti B, Ghilardi MF, Di Rocco A (2011) Apathy, but not depression, reflects inefficient cognitive strategies in Parkinson’s disease PLoS One 6: e17846 |
11 | Santangelo G, Vitale C, Trojano L, Longo K, Cozzolino A, Grossi D, Barone P (2009) Relationship between depression and cognitive dysfunctions in Parkinson’s disease without dementia J Neurol 256: 632 638 |
12 | Butterfield LC, Cimino CR, Oelke LE, Hauser RA, Sanchez-Ramos J (2010) The independent influence of apathy and depression on cognitive functioning in Parkinson’s disease Neuropsychology 24: 721 730 |
13 | Hughes AJ, Daniel SE, Kilford L, Lees AJ (1992) Accuracy of clinical diagnosis of idiopathic Parkinson’s disease: A clinico-pathological study of 100 cases J Neurol Neurosurg Psychiatry 55: 181 184 |
14 | Fahn S, Elton R (1987) Unified Parkinson’s disease rating scale Recent Dev Parkinsons Dis 11: 153 163 |
15 | Yesavage J, Brink T, Rose T, Lum O, Huang V, Adey M, Leirer O (1983) Geriatric Depression Scale (GDS) J Psychiatric Res 17: 37 49 |
16 | Schrag A, Barone P, Brown RG, Leentjens AF, McDonald WM, Starkstein S, Weintraub D, Poewe W, Rascol O, Sampaio C, Stebbins GT, Goetz CG (2007) Depression rating scales in Parkinson’s disease: Critique and recommendations Mov Disord 22: 1077 1092 |
17 | Grace J, Malloy P (2001) Frontal Systems Behavior Scale (FrSBe): Professional Manual Psychological Assessment Resources Lutz, FL |
18 | Leentjens AF, Dujardin K, Marsh L, Martinez-Martin P, Richard IH, Starkstein SE, Weintraub D, Sampaio C, Poewe W, Rascol O, Stebbins GT, Goetz CG (2008) Apathy and anhedonia rating scales in Parkinson’s disease: Critique and recommendations Mov Disord 23: 2004 2014 |
19 | Stout JC, Ready RE, Grace J, Malloy PF, Paulsen JS (2003) Factor Analysis of the Frontal Systems Behavior Scale (FrSBe) Assessment 10: 79 85 |
20 | Buelow MT, Frakey LL, Grace J, Friedman JH (2014) The contribution of apathy and increased learning trials to risky decision-making in Parkinson’s disease Arch Clin Neuropsychol 29: 100 109 |
21 | Zgaljardic DJ, Borod JC, Foldi NS, Mattis PJ, Gordon MF, Feigin A, Eidelberg D (2006) An examination of executive dysfunction associated with frontostriatal circuitry in Parkinson’s disease J Clin Exp Neuropsychol 28: 1127 1144 |
22 | Lane-Brown AT, Tate RL (2009) Measuring apathy after traumatic brain injury: Psychometric properties of the Apathy Evaluation Scale and the Frontal Systems Behavior Scale Brain Inj 23: 999 1007 |
23 | Marin RS, Biedrzycki RC, Finrinciogullari S (1991) Reliability and validity of the apathy evaluation scale Psychiatry Res 38: 143 162 |
24 | Jurica PJ, Leitten CL, Mattis S (2004) Psychological Assessment Resources DRS-2 dementia rating scale-2: Professional manual |
25 | Baddeley AD, Emslie H, Nimmo-Smith I (1992) The speed and capacity of language-processing test ThamesValley Test Company |
26 | Selnes OA, Carson K, Rovner B, Gordon B (1988) Language dysfunction in early and late onset possible Alzheimer’s disease Neurology 38: 1053 |
27 | Brandt J, Benedict RH (2001) Psychological Assessment Resources Hopkins verbal learning test, revised: Professional manual |
28 | Benedict RH (1997) Brief visuospatial memory test–revised: Professional manual PAR |
29 | Reitan RM (1958) Validity of the Trail Making Test as an indicator of organic brain damage Percept Mot Skills 8: 271 276 |
30 | Delis DC, Kaplan E, Kramer JH (2001) Delis-Kaplan executive function system (D-KEFS) Psychological Corporation |
31 | van den Berg E, Nys GM, Brands AM, Ruis C, van Zandvoort MJ, Kessels RP (2009) The Brixton Spatial Anticipation Test as a test for executive function: Validity in patient groups and norms for older adults J Int Neuropsychol Soc 15: 695 703 |
32 | Lawton MP, Brody EM (1969) Assessment of older people: Self-maintaining and instrumental activities of daily living Gerontologist 9: 179 186 |
33 | Jorm A (1994) A short form of the Informant Questionnaire on Cognitive Decline in the Elderly (IQCODE): Development and cross-validation Psychol Med 24: 145 153 |
34 | Llebaria G, Pagonabarraga J, Kulisevsky J, Garcia-Sanchez C, Pascual-Sedano B, Gironell A, Martinez-Corral M (2008) Cut-off score of the Mattis Dementia Rating Scale for screening dementia in Parkinson’s disease Mov Disord 23: 1546 1550 |
35 | Mayberg HS, Solomon DH (1995) Depression in Parkinson’s disease: A biochemical and organic viewpoint Adv Neuro 65: 49 |
36 | Carbon M, Ma Y, Barnes A, Dhawan V, Chaly T, Ghilardi MF, Eidelberg D (2004) Caudate nucleus: Influence of dopaminergic input on sequence learning and brain activation in Parkinsonism Neuroimage 21: 1497 1507 |
37 | Ravizza SM, Goudreau J, Delgado MR, Ruiz S (2011) Executive function in Parkinson’s disease: Contributions of the dorsal frontostriatal pathways to action and motivation Cogn Affect Behav Neurosci 12: 193 206 |
38 | Domellof ME, Elgh E, Forsgren L (2011) The relation between cognition and motor dysfunction in drug-naive newly diagnosed patients with Parkinson’s disease Mov Disord 26: 2183 2189 |
39 | Kehagia AA, Barker RA, Robbins TW (2010) Neuropsychological and clinical heterogeneity of cognitive impairment and dementia in patients with Parkinson’s disease Lancet Neurol 9: 1200 1213 |
40 | Jokinen P, Karrasch M, Bruck A, Johansson J, Bergman J, Rinne JO (2013) Cognitive slowing in Parkinson’s disease is related to frontostriatal dopaminergic dysfunction J Neurol Sci 329: 23 28 |
41 | Barone P, Aarsland D, Burn D, Emre M, Kulisevsky J, Weintraub D (2011) Cognitive impairment in nondemented Parkinson’s disease Mov Disord 26: 2483 2495 |
42 | Lemke MR (2008) Depressive symptoms in Parkinson’s disease Eur J Neurol 15: 21 25 |
43 | Aarsland D, Pahlhagen S, Ballard CG, Ehrt U, Svenningsson P (2012) Depression in Parkinson disease–epidemiology, mechanisms and management Nat Rev Neurol 8: 35 47 |
44 | Robert G, Le Jeune F, Lozachmeur C, Drapier S, Dondaine T, Peron J, Travers D, Sauleau P, Millet B, Verin M, Drapier D (2012) Apathy in patients with Parkinson disease without dementia or depression: A PET study Neurology 79: 1155 1160 |
45 | Skidmore FM, Yang M, Baxter L, von Deneen K, Collingwood J, He G, Tandon R, Korenkevych D, Savenkov A, Heilman KM, Gold M, Liu Y (2013) Apathy, depression, and motor symptoms have distinct and separable resting activity patterns in idiopathic Parkinson disease Neuroimage 81: 484 495 |
46 | Starkstein SE, Leentjens AF (2008) The nosological position of apathy in clinical practice J Neurol Neurosurg Psychiatry 79: 1088 1092 |
47 | Sockeel P, Dujardin K, Devos D, Deneve C, Destee A, Defebvre L (2006) The Lille apathy rating scale (LARS), a new instrument for detecting and quantifying apathy: Validation in Parkinson’s disease J Neurol Neurosurg Psychiatry 77: 579 584 |
48 | Starkstein SE, Mayberg HS, Preziosi T, Andrezejewski P, Leiguarda R, Robinson RG (1992) Reliability, validity, and clinical correlates of apathy in Parkinson’s disease J Neuropsychiatry Clin Neurosci 4: 134 139 |
Figures and Tables
Fig.1
Low Performing Participants. Percentage of participants from each group who scored below −1.5 standard deviation (SD) units of the PD Control group. The SD scores for the TMT A, TMT B, and Grooved pegboard test were inverted so that a smaller score indicated worse performance.
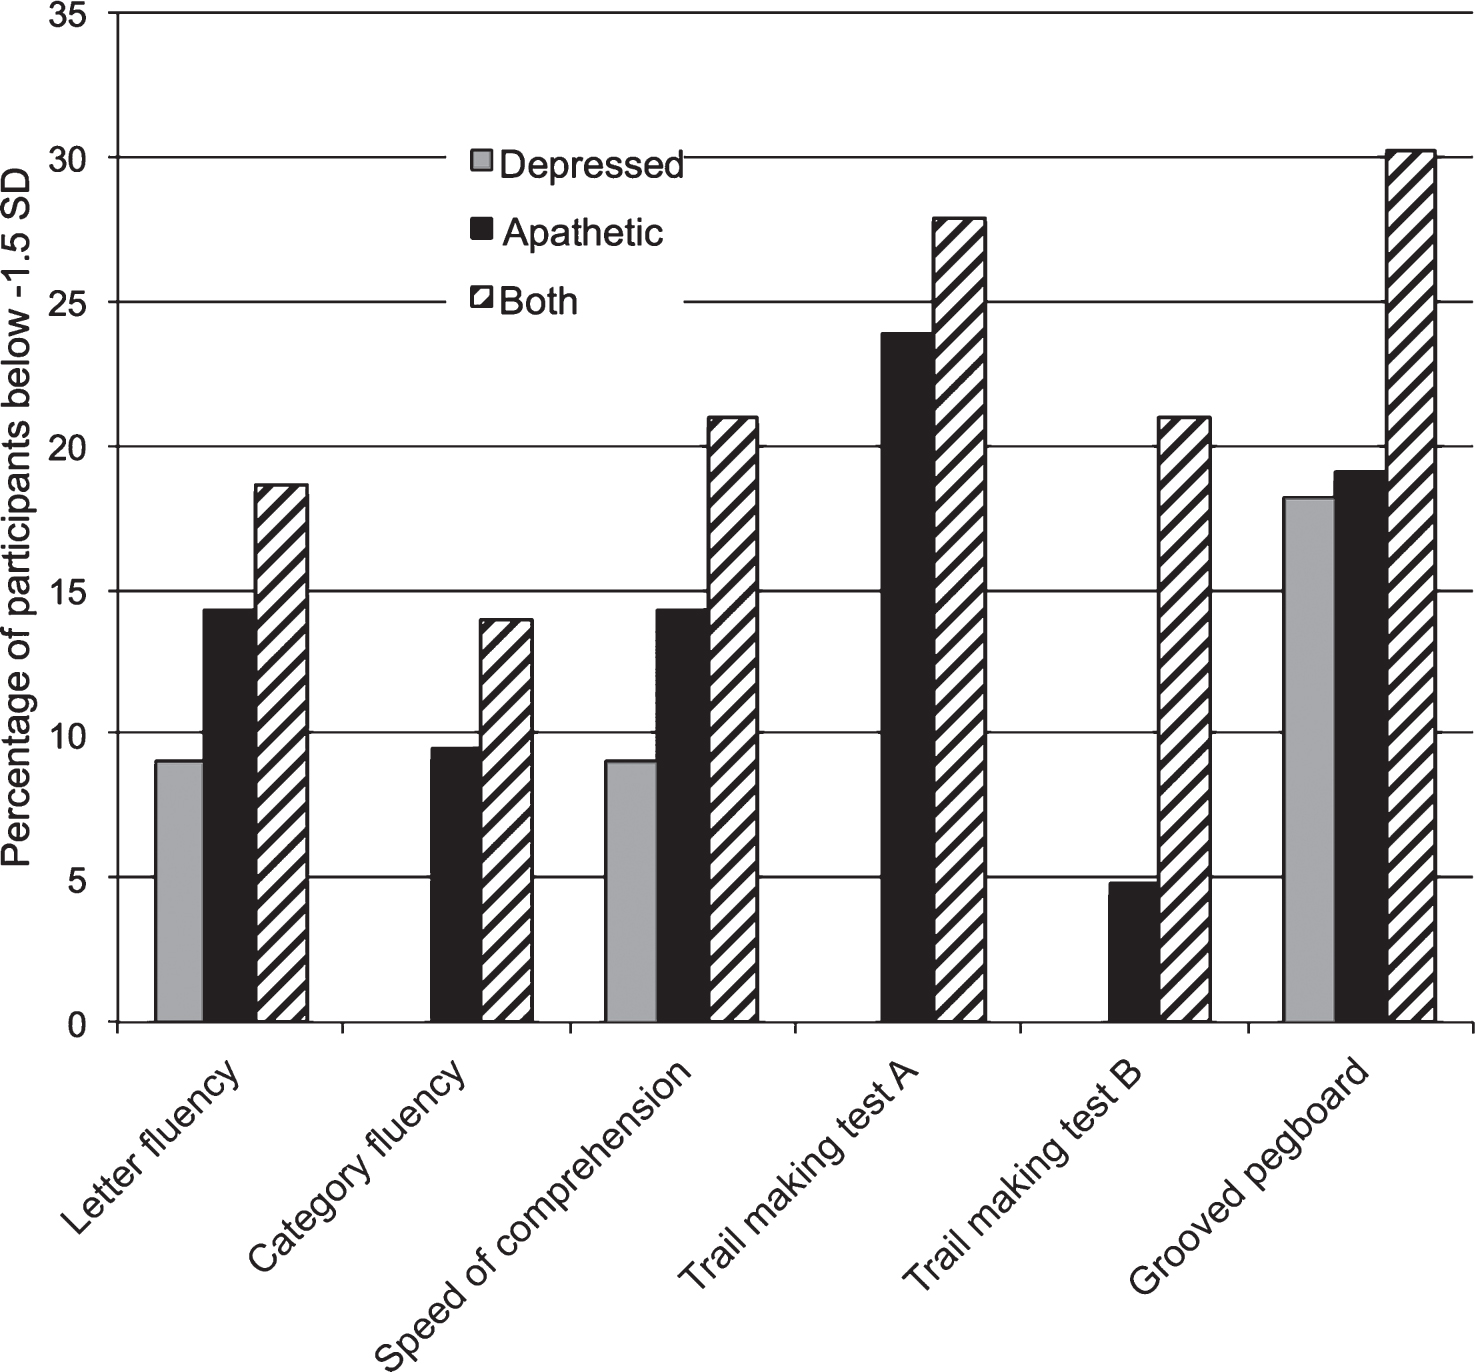
Table 1
Demographic and clinical variables
| PD Control | Depression | Apathy | Both | p | |||||||||
| n = 49 | n = 11 | n = 21 | n = 43 | ||||||||||
| Mean | (SD) | Max/Min | Mean | (SD) | Max/Min | Mean | (SD) | Max/Min | Mean | (SD) | Max/Min | ||
| Age | 64.5 | (9.6) | 79/49 | 64.8 | (7.7) | 76/49 | 65.3 | (9.1) | 83/48 | 63.6 | (8.5) | 81/37 | 0.89 |
| Sex (% male) | 67.3 | 72.7 | 71.4 | 69.8 | 0.98 | ||||||||
| Education | 15.0 | (2.9) | 20/9 | 16.3 | (2.9) | 20/12 | 15.6 | (2.9) | 20/12 | 14.3 | (3.1) | 22/8 | 0.16 |
| Handedness (% right) | 87.8 | 90.9 | 95.2 | 95.3 | 0.54 | ||||||||
| Hemibody* (% right) | 57.1 | 44.4 | 58.8 | 55.9 | 0.26 | ||||||||
| Age of symptom onset | 54.3 | (11.0) | 75/10 | 53.8 | (5.8) | 63/44 | 57.8 | (10.2) | 76/38 | 54.5 | (11.1) | 76/24 | 0.64 |
| Years with symptoms | 10.3 | (4.2) | 23/4 | 10.9 | (6.6) | 21/2 | 8.9 | (3.9) | 20/1 | 9.8 | (6.6) | 35/2 | 0.69 |
| UPDRS off medication | 33.4 | (11.8) | 64/11 | 31.4 | (10.7) | 46/20 | 29.2 | (10.1) | 50/18 | 38.4 | (11.9) | 58/18 | 0.14 |
| UPDRS on medication | 15.6 | (8.3) | 30/2 | 15.0 | (10.2) | 36/5 | 18.2 | (9.9) | 39/4 | 22.1 | (11.0) | 52/8 | 0.07 |
| DRS-2 Total Score | 136.4 | (6.4) | 144/113 | 136.4 | (5.9) | 143/123 | 136.1 | (9.9) | 144/107 | 134.4 | (6.7) | 143/115 | 0.56 |
| GDS-30 Total Score | 3.8 | (2.2) | 8/0 | 12.7 | (4.7) | 21/9 | 6.0 | (1.7) | 8/1 | 13.8 | (4.2) | 25/9 | <0.01 |
| FrSBE (self) Apathy T | 52.1 | (7.6) | 64/37 | 56.0 | (9.6) | 64/33 | 73.9 | (8.5) | 96/65 | 81.9 | (12.3) | 117/65 | <0.01 |
| Lawton (rater) ADL | 1.1 | (1.6) | 7/0 | 3.5 | (3.7) | 11/0 | 1.8 | (2.3) | 9/0 | 2.4 | (2.3) | 8/0 | 0.02 |
| Lawton (rater) IADL | 2.8 | (3.1) | 12/0 | 4.7 | (5.6) | 16/0 | 5.2 | (5.6) | 15/0 | 5.2 | (4.6) | 15/0 | 0.09 |
| IQCODE | 3.2 | (0.3) | 4.7/3.0 | 3.5 | (0.4) | 4.0/3.0 | 3.4 | (0.6) | 4.7/3.0 | 3.4 | (0.4) | 4.9/2.9 | 0.12 |
| Levodopa (%) | 95.9 | 90.9 | 90.5 | 92.7 | 0.53 | ||||||||
| Dopamine Agonist (%) | 58.3 | 45.5 | 76.2 | 22.0 | <0.01 | ||||||||
| COMT Inhibitor (%) | 14.6 | 9.1 | 0.0 | 17.1 | 0.25 | ||||||||
| MAO-B Inhibitor (%) | 33.3 | 36.4 | 19.0 | 22.0 | 0.45 | ||||||||
| Anticholinergic (%) | 4.2 | 9.1 | 9.5 | 2.4 | 0.58 | ||||||||
| Other Med. (%) | 27.1 | 45.5 | 19.0 | 26.8 | 0.47 | ||||||||
The groups were compared on the variables above with a one-way ANOVA or a chi-squared test, depending on whether the variable was continuous or categorical. *“Hemibody” refers to the hemibody of PD symptom onset. Values shown in bold are significant at p < 0.05.
Table 2
Univariate analyses
| Control | Depression | Apathy | Both | F | p |
| |
| DRS-2 Attention | 36.2±1.3 | 35.9±1.1 | 36.1±1.4 | 36.0±0.7 | 0.21 | 0.89 | 0.01 |
| DRS-2 Construction | 5.7±0.9 | 5.9±0.3 | 5.6±1.2 | 5.9±0.5 | 0.83 | 0.48 | 0.02 |
| SCOLP Speed Comp. | 8.06±2.9 | 6.91±2.7 | 7.84±2.7 | 6.23±2.9 | 3.37 | 0.02 a | 0.08 |
| Grooved Peg (mean) | 133.1±60.0 | 160.2±95.3 | 178.3±93.6 | 203.8±97.0 | 5.10 | <0.01 a | 0.12 |
| BNT-30 | 28.2±3.0 | 27.5±1.9 | 26.8±5.2 | 27.1±3.1 | 1.14 | 0.34 | 0.03 |
| Letter-word fluency | 55.0±19.2 | 55.6±16.2 | 49.7±13.7 | 43.6±19.3 | 3.23 | 0.03 a | 0.08 |
| Category-word fluency | 41.3±11.6 | 45.3±12.2 | 42.1±9.5 | 36.5±10.2 | 2.81 | 0.04 a | 0.07 |
| HVLT-R total recall | 22.0±5.3 | 23.0±5.0 | 21.2±6.8 | 20.3±5.8 | 1.02 | 0.39 | 0.03 |
| HVLT-R delayed recall | 7.5±2.7 | 7.2±3.4 | 6.9±3.5 | 6.2±3.5 | 1.25 | 0.30 | 0.03 |
| HVLT-R discrimination | 10.2±1.6 | 10.4±1.5 | 9.1±2.6 | 9.2±2.3 | 2.55 | 0.06 | 0.06 |
| BVMT-R total recall | 16.5±7.6 | 16.4±9.8 | 14.7±7.8 | 13.8±6.8 | 1.07 | 0.36 | 0.03 |
| BVMT-R delayed recall | 7.1±3.1 | 6.6±3.6 | 6.1±3.2 | 5.2±3.3 | 2.55 | 0.06 | 0.06 |
| BVMT-R discrimination | 5.2±1.0 | 4.6±2.0 | 4.8±1.6 | 5.0±1.3 | 0.87 | 0.45 | 0.02 |
| Trail Making Test A | 46.5±17.5 | 48.2±13.3 | 56.5±36.8 | 60.9±28.3 | 2.71 | 0.05 a | 0.06 |
| Trail Making Test B | 120.0±76.8 | 117.2±53.6 | 114.5±67.8 | 169.9±87.7 | 3.84 | 0.01 a | 0.09 |
| D-KEFS Tower SS | 10.0±3.2 | 10.9±3.0 | 9.8±1.8 | 8.9±3.1 | 1.66 | 0.18 | 0.04 |
| Brixton SAT errors | 22.2±10.5 | 25.9±7.3 | 23.7±8.5 | 23.7±9.7 | 0.51 | 0.68 | 0.01 |
Scores are reported as: mean±SD. a Post-hoc analyses of these group differences revealed that the Both group performed worse than the Control group. Values shown in bold are significant at p < 0.05.


