
Versatile pressure and temperature controlled cell for neutron reflectometry and small-angle neutron scattering
Abstract
We have designed and realized a temperature and pressure controlled cell for Neutron Reflectometry (NR) and Small Angle Neutron Scattering (SANS) that is compatible with simultaneous optical transmission and resistivity measurements. The cell can accommodate samples up to 102 mm (4 inch) in diameter, can be pressurized from vacuum up to 10 bar gas pressure and the sample temperature can be controlled up to 350°C. The four single crystal quartz windows ensure both a good neutron and optical transmission and hence can be used in combination with in-situ optical transmission measurements. We present the cell and illustrate its performance with a series of neutron reflectometry experiments performed on Ta based thin films under a hydrogen containing atmosphere.
The presence of certain gases and temperature have a substantial impact on the material properties, including solar cells, steels, polymers and hydrogen sensing materials. In these fields of research, in situ neutron scattering experiment are of inestimable value to asses the influence of these external parameters on the material properties [4,13–16,20,26,27]. In addition, experiments often need to be performed in inert atmospheres to prevent possible oxidation or nitration. For example, Neutron Reflectometry (NR) is used to quantify the amount of hydrogen absorbed by hydrogen storage [9,12,17,18,21,23,24] and optical hydrogen sensing materials as a function of the applied hydrogen pressure and temperature [2,3,5,7,11]. In the latter case, NR provides valuable insights in the relationship between the structural properties such as the hydrogen concentration and layer expansion and its optical performance as a hydrogen sensor. Furthermore, Small Angle Neutron Scattering (SANS) is frequently used to study the structure of precipitates in steels as well as hydrogen inclusions, both of which are drastically affected by temperature and gas environment. To allow such in situ/operando neutron studies [28], it is vital to develop reliable, compact and versatile sample environments in which both temperature and gas pressure/environment can be controlled simultaneously.
Here, the aim is to design, construct and validate a versatile pressure and temperature controlled cell for NR and SANS studies. Specifically, the design requirements are that we can control the pressure between
In this work, we developed a versatile pressure and temperature controlled cell for neutron reflectometry and small-angle neutron scattering studies. Specifically, the temperature in the cell can be controlled up to 350°C and the pressure up to 10 bar. We first describe the cell and then illustrate its performance with a series of neutron reflectometry experiments. The cell and engineering drawings thereof are available to the user community upon reasonable request.
1.Design and construction
1.1.Design
Figures 1 and 2 display schematics, an exploded view and photograph of the cell. It consists of 3 main components: (i) the body of the cell including a circular lid, (ii) an insert that serves as a sample support and heating plate and (iii) a base plate with 4 cylindrical posts to mount the body of the cell to the support plate. With the exception of the heating plate (stainless steel), all components are made from aluminum. All materials and suppliers are specified in Table 1. The dimensions of the base plate are 220 × 220 mm2.
The cell can be used in two modes: positioned horizontally for NR measurements (Fig. 1a) and positioned vertically for SANS measurements (Fig. 1b). In the NR configuration, the sample is inserted by removing the lid from the top. For the SANS configuration, the cell is rotated by 90° with respect to the NR configuration. This implies that the sample is loaded from the side and that the cell is supported by 4 cylindrical posts from the side at which the rectangular NR window is mounted. The cylindrical windows (see details below in the next section) of the cell that accommodate the transport of the SANS beam allows the transport of a circular beam with a maximum diameter of 18 mm2. As the maximum scattering angle for this beam size is
Fig. 1.
Schematics of the cell in (a) NR and (b) SANS modes. (c) Photograph of the cell in horizontal orientation (‘NR mode’).
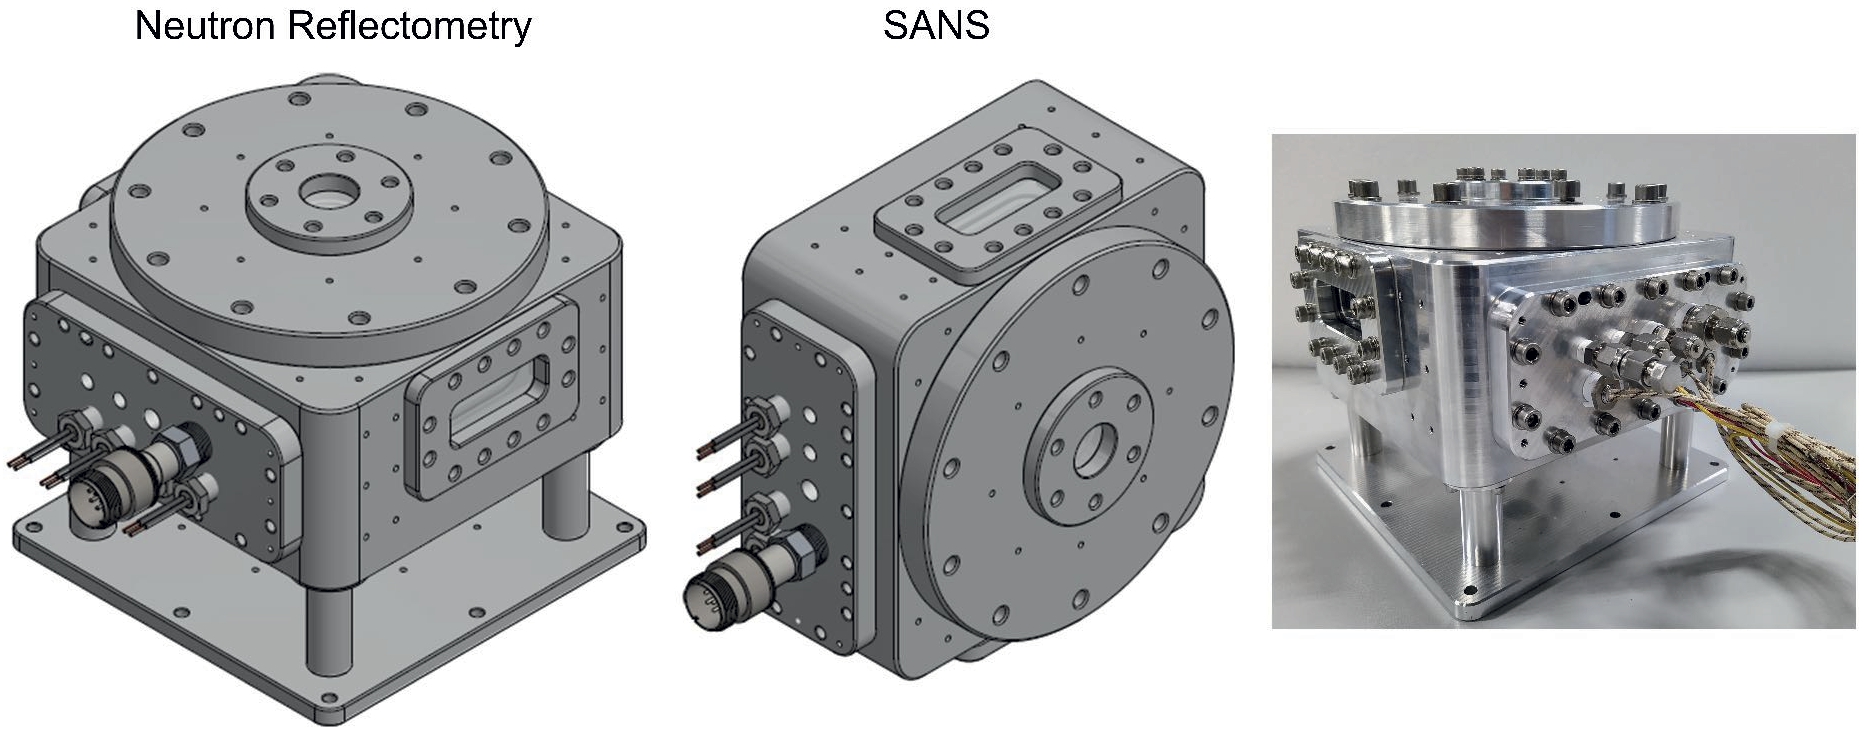
Fig. 2.
(left) Exploded view of the pressure and temperature controlled cell. (right) Schematics of the cell in NR and SANS mode in which the beam is illustrated. The cell consists of three main components: (1) the cell body including the lid, the (2) insert and the base plate (3.1) with cylindrical posts (3.2). Unless stated otherwise, the components are made from aluminum. The cell body consists of (1.1) main body, (1.2) quartz windows for reflectometry, (1.3) quartz windows for SANS, (1.4) Kalrez O-Ring 55.25 × 2.62 mm2, (1.5) Kalrez O-Ring 158.42 × 2.62 mm2, (1.6) Kalrez O-Ring 29.82 × 2.62 mm2, (1.7) lid, (1.8) aluminum plate to clamp the quartz windows for SANS (1.9) and reflectometry (1.10), (1.11) Kalrez O-Ring 29.82 × 2.62 mm2, (1.12) parallel pin (dowel pin). (2.1) Back plate for the insert, (2.2) stainless steel heating plate, (2.3) stainless steel holder plate, (2.4) sample support plate, (2.5) clamp for SANS samples, (2.6) multipin connector, (2.7) heating rods. The drawing is to scale and the red shading illustrates the neutron beams when the cell is used for reflectometry and SANS (1.10). The dimensions are indicated in mm.
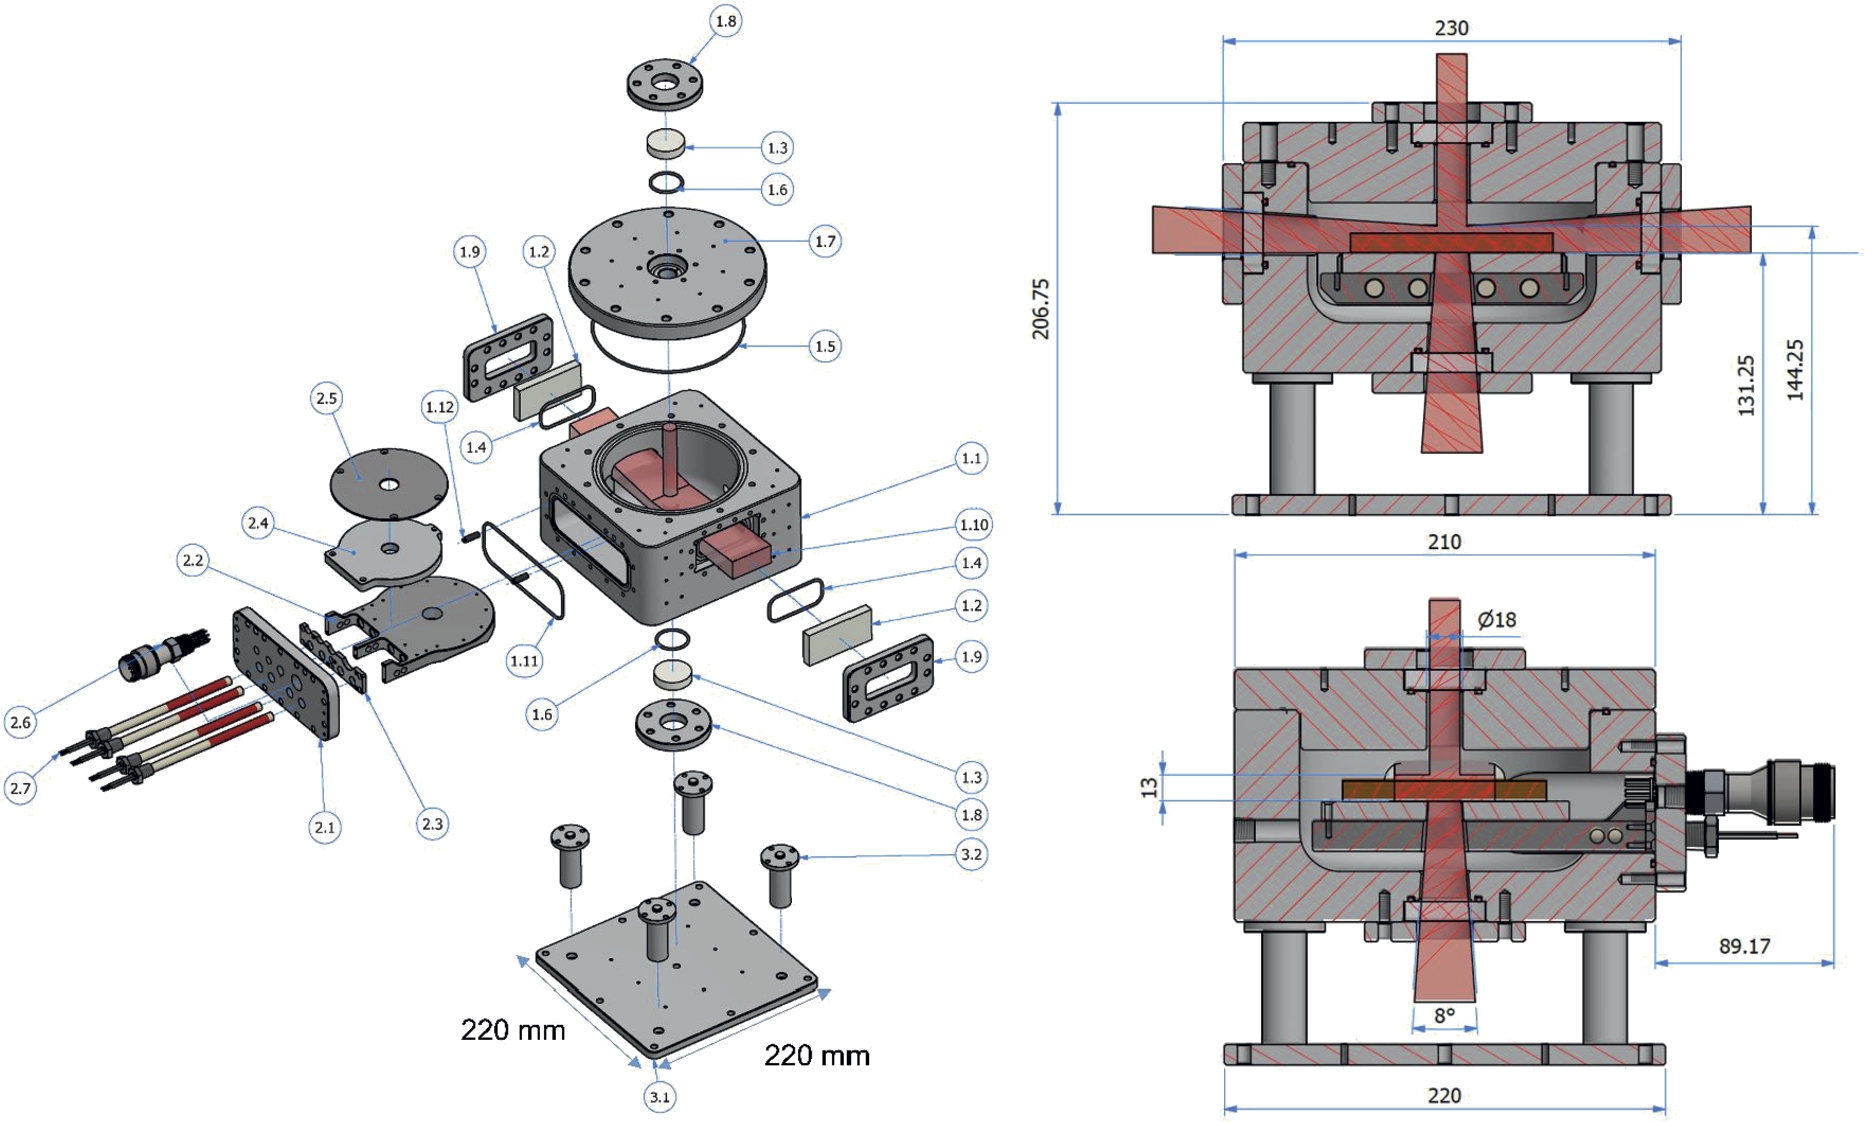
Table 1
This table reports the material specifications and suppliers of all used items
| Item | Material | Supplier |
| Cell body | Aluminium 6082 | Salomon’s Metalen B.V., Groningen, The Netherlands |
| Back plate sample support | Aluminium 7075 | Salomon’s Metalen B.V., Groningen, The Netherlands |
| Heating plate | Stainless Steel 310(S) | Salomon’s Metalen B.V., Groningen, The Netherlands |
| Heating rods (4×) | Custom made 60 V, 38 W heating rods with a diameter of 0.371 inch (9.4 mm) and total length of 7.1 inch (180 mm). One features a Type K Thermocouple | Kurval B.V., Nieuw Vennep, The Netherlands |
| O-rings | Kalrez FFKM 75 6375 | DuPont, Wilmington, Delaware, United States |
| NR window | 80 × 40 × 10 mm3 single crystal quartz, both 80 × 40 mm2 sides polished with s/d 40/20, L/10 and optical axis normal to the polished surface | VM-TIM GmbH, Jena, Germany |
| SANS window | VM-TIM GmbH, Jena, Germany | |
| Multipin connector | 1/2 inch NPT 10 pin Multipin Connector MIL-C 5015, 10094-11-A | MPF Products Inc., Gray Court, South Carolina, United States |
| Bolts for windows | Fabory B.V, Tilburg, The Netherlands | |
| Bolts for the lid (10×) | Fabory B.V, Tilburg, The Netherlands | |
| Parallel pin (dowel pin) | Parallel pin (dowel pin) hardened, m6 DIN 6325 Steel | Fabory B.V, Tilburg, The Netherlands |
1.1.1.Windows
The cell has four single crystal quartz windows (VM-TIM GmbH, Jena, Germany) to allow the passage of neutron beams with minimum loss of intensity. Two of these windows, each 80 × 40 × 10 mm3, allow the passage of a beam with maximum dimensions of 60 × 30 mm2 and are used for NR experiments. The other two windows are used for SANS measurements and are cylindrical with a diameter of 40 mm and a thickness of 10 mm, allowing the passage of a circular beam with a maximum dimension of 18 mm. The windows are optically transparent and polished on both sides with
The windows are mounted with the help of two aluminum clamps that are fixed to the cell body with M6 bolts. To seal the windows, Kalrez O-rings are used with a diameter of 2.62 mm and placed in a groove.
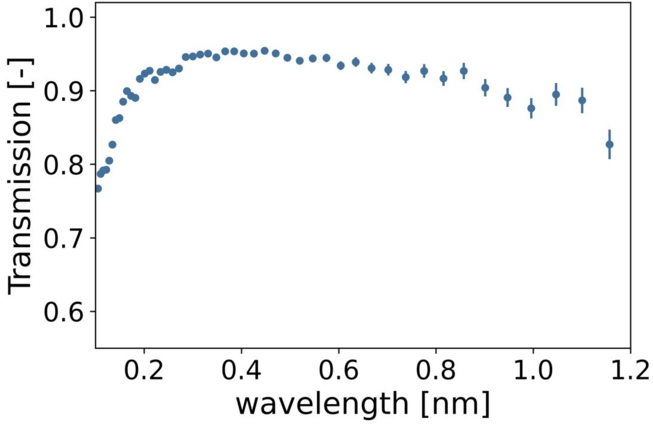
The neutron transmission of the quartz windows was measured at room temperature (
Fig. 3.
Wavelength-dependent neutron transmission of the pressure cell in NR mode.
1.1.2.Insert for sample support and heating
Fig. 4.
Schematics of the insert that supports and heats the sample. The insert is made of an aluminum back plate, through which the 4 heating cartridges are inserted with a 1/4 inch NPT connection. A 1/2 inch NPT multipin connector is used to facilitate electrical connections and one 1/4 inch NPT connection can be used to directly connect a vacuum hose to the cell. Two additional 1/8 inch NPT are placed that can be used for other connections. The heating rods are positioned inside a stainless steel plate on top of which a sample support plate is mounted. A circular hole with a diameter of 18 mm facilitates the transmission of the neutron beam for SANS measurements and optical measurements.
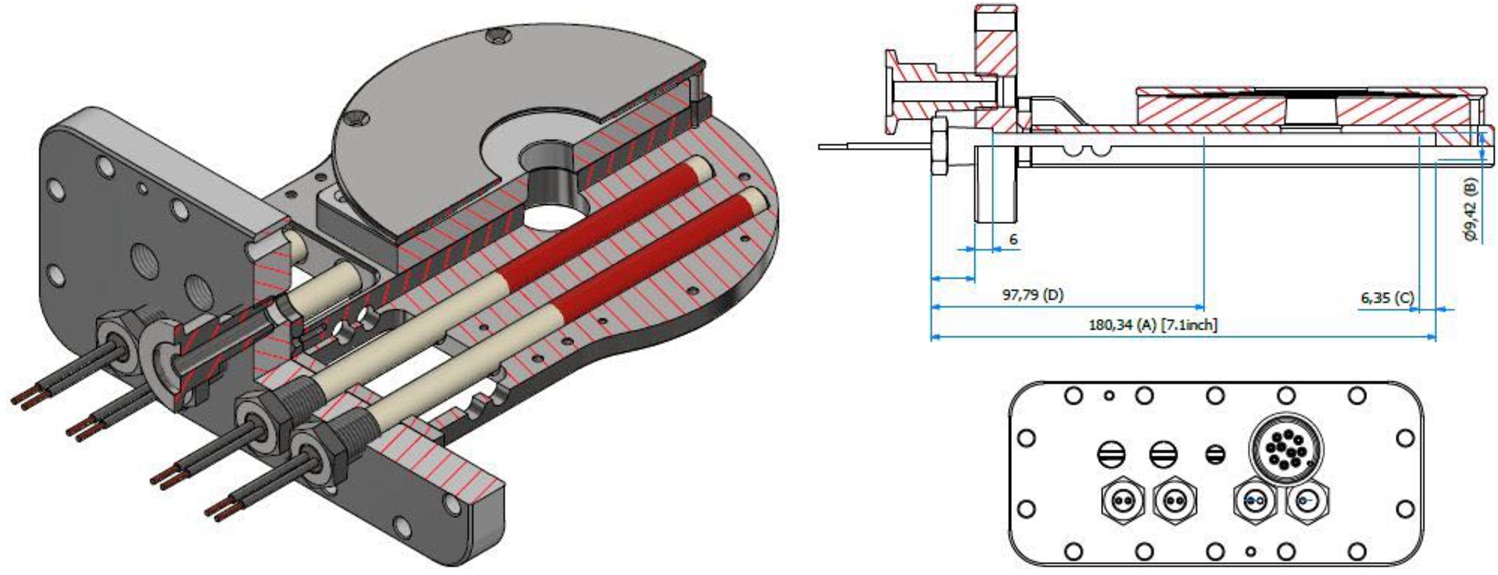
Figure 4 displays a detailed view of the insert which is made of an aluminum back plate to which a stainless steel 310(S) heating plate is assembled. Stainless steel 310(S) was selected for its excellent corrosion resistance as well as high strength at high temperatures. On top of the heating plate, a sample support plate is positioned to which samples with a maximum diameter of 4 inch (101.6 mm) can be clamped. To allow optical transmission and SANS measurements, a 18 mm diameter hole is made in the heating and sample support plate.
The contact area between the back plate and the heating plate is minimized to reduce the heat flow to the cell body. In the cell no heat shields are used because the temperature stays relatively low and there is limited space. Some heat is still transmitted to the body, either via conduction and radiation and also via convection if the cell is not operated under vacuum. The body can be water cooled with a cooling block to prevent it becoming too hot for material and personal safety. This block is made in house from a brass bar with a channel drilled in it and is attached to the side of the body.
Four cartridge heaters are placed inside the heater plate. The heaters (Watlow 2285-7052) are 60 V, 200 W each and have a K-type thermocouple to monitor the internal temperature. The cartridges have a diameter of 0.371 inch (9.4 mm) and a total length of 7.1 inch (180 mm) of which only the section in the heater plate is heated. The cold zones are 3.85 inch (98 mm) on the connection side and 0.25 inch (6.4 mm) on the tip side. The cartridge heaters feature a maximum temperature of 760°C and have a 1/4 inch NPT plug (stainless steel 304) that allow them to be fixed to the back plate. The heating rods are connected in series such that the heating will stop if one of the heaters malfunctions. The electrical connections are placed outside the cell to prevent electrical discharges at low gas pressures. To improve the thermal connection each heater is fixed along its length with three screws in the bottom of the heater plate. This is especially important when operating in vacuum where there is no convection.
Table 2
Material parameters used for the stress and thermal simulations
| Aluminum 6061 | Stainless steel heating plate | Quartz window and sample | Helium (10 bar) | Argon (10 bar) | |
| Density [kg/m3] | 2,700 | 7,750 | 2,650 | 0.163 | 1.620 |
| Thermal conductivity [W/(m.K)] | 167 | 2 | 1 | 0.152 | 0.016 |
| Specific heat [J/(kg.K)] | 896 | 480 | 710 | 5,193 | 520 |
| Thermal expansion coefficient [10−5/K] | 2.36 | 1.70 | 1.30 | ||
| Young’s modulus [MPa] | 68,900 | 193,000 | 7,254 | ||
| Bulk modulus [MPa] | 25,903 | 169,300 | 3,664 | ||
| Shear modulus [MPa] | 67,549 | 73,664 | 3,100 | ||
| Poisson’s ratio | 0.33 | 0.31 | 0.17 | ||
| Compressive yield strength [MPa] | 276 | 207 | 77 | ||
| Tensile yield strength [MPa] | 276 | 207 | 1,100 |
A 1/2 inch NPT 10 multipin connector with a maximum design pressure of 34 bar is placed to allow for electrical connections for e.g. resistivity measurements and the placement of additional thermocouples. The connector allows for a maximum of 10 A and 700 V to be transported and has for example been used for four-point resistivity measurements.
1.2.Stress simulations
Stress simulations were performed to assess the structural integrity of the cell when it is pressurized to 10 bar. These simulations were performed with ANSYS R21.1 Academic using the finite element method. The mechanical stress analysis is performed on the individual components of the cell. This is a worst case scenario as in this way there is no support from other parts. The calculations are done at a pressure of 2 MPa, i.e. a factor two higher than the maximum design pressure of 1 MPa. All relevant material parameters used for the computations can be found in Table 2.
Table 3 reports the results. Comparing the yield strength of the various materials with the maximum Von Mises Stress computed for all parts it can be seen that the stresses are well below what is mechanically desired. Indeed, the highest stresses are observed on the cell body itself with a maximum calculated Von Mises stress of 84 MPa, being a factor three lower than the yield strength of the material. Furthermore, we observe that the maximum deformation of the windows is 0.05 mm, of the cell body 0.04 mm and of the lid 0.03 mm.
Table 3
Results of the stress simulations at which the cell is pressurized to a pressure of 2 MPa
| Part | Material | Yield strength material [MPa] | Maximum calculated Von Mises Stress [MPa] | Safety factor |
| Cell body | Aluminum 6082 | 260 | 84 | 3 |
| Lid | Aluminum 6082 | 260 | 39 | 7 |
| Back plate sample support and heating plate | Aluminum 7075 | 503 | 61 | 8 |
| Quartz window for NR | Quartz | 77 | 12 | 6 |
| Window clamp for NR | Aluminum 6082 | 260 | 69 | 4 |
| Quartz window for SANS | Quartz | 77 | 13 | 6 |
| Window clamp for SANS | Aluminum 6082 | 260 | 54 | 5 |
1.3.Thermal simulations
Steady-state thermal simulations were performed to (i) estimate the required heating power (heating loss to the environment), (ii) assess the temperature homogeneity of the sample and (iii) evaluate the temperature of the maximum temperature of the outer cell wall. Similar to the stress simulations, these simulations were performed with ANSYS R21.1 Academic. All relevant material parameters can be found in Table 2. During the simulations an ambient temperature of 22°C was assumed and the sample was modeled as a quartz disc with a diameter of 4 inch (101.6 mm) and a thickness of 10 mm. The simulations were performed both by positioning the cell in NR (horizontal) and SANS mode (vertical).
The simulations were performed for both vacuum and a gas atmosphere of 10 bar of argon and 10 bar of helium. In the simulations the heating cartridges were heated to 400°C. The combination of these parameters, i.e. the highest pressure and temperature, represent the most extreme designed operating conditions of the cell. To estimate the heat loss to the environment, we consider the convection
Figures 5–7 and Table 4 report the results of the simulations showing three important points. First of all, the results indicate that the power of the heating rods is sufficient to heat the sample to
Secondly, the results show that the temperature of the outer wall and the windows remains modest, at max. 65°C in a 10 bar helium atmosphere. In the case of vacuum and argon at 10 bar, the outer wall and window temperature are much lower and below 40°C. Thirdly, we observe that the thermal gradients within the samples remain modest. At the maximum temperature, we observe that the gradient is for NR measurements at max. 3°C over the surface of a 4 inch wafer, whilst for SANS it is only 1°C.
As we will see later, the thermal simulations represent an ideal case. In particular, it does not take into account the non-ideal contact between various materials, such as the heating plate and the sample support plate, the sample support plate to the sample, as well as the limited heat transfer between the heating rods and the heating plate. These effects are especially relevant when operating under vacuum. As a result, to reach a certain sample temperature, the heating rods and support plate have to be at a higher temperature than expected based on the simulations. The sample still reaches the desired maximum temperature.
Fig. 5.
Temperature distribution of the cell when the temperature of the heating rods is set to 400°C and the cell is under vacuum. (a) Entire cell body, (b) sample support and heating plate, (c) close-up of the sample in NR mode, (d) close-up of the sample in SANS mode. The black lines indicate the elements used for the finite element method simulations.
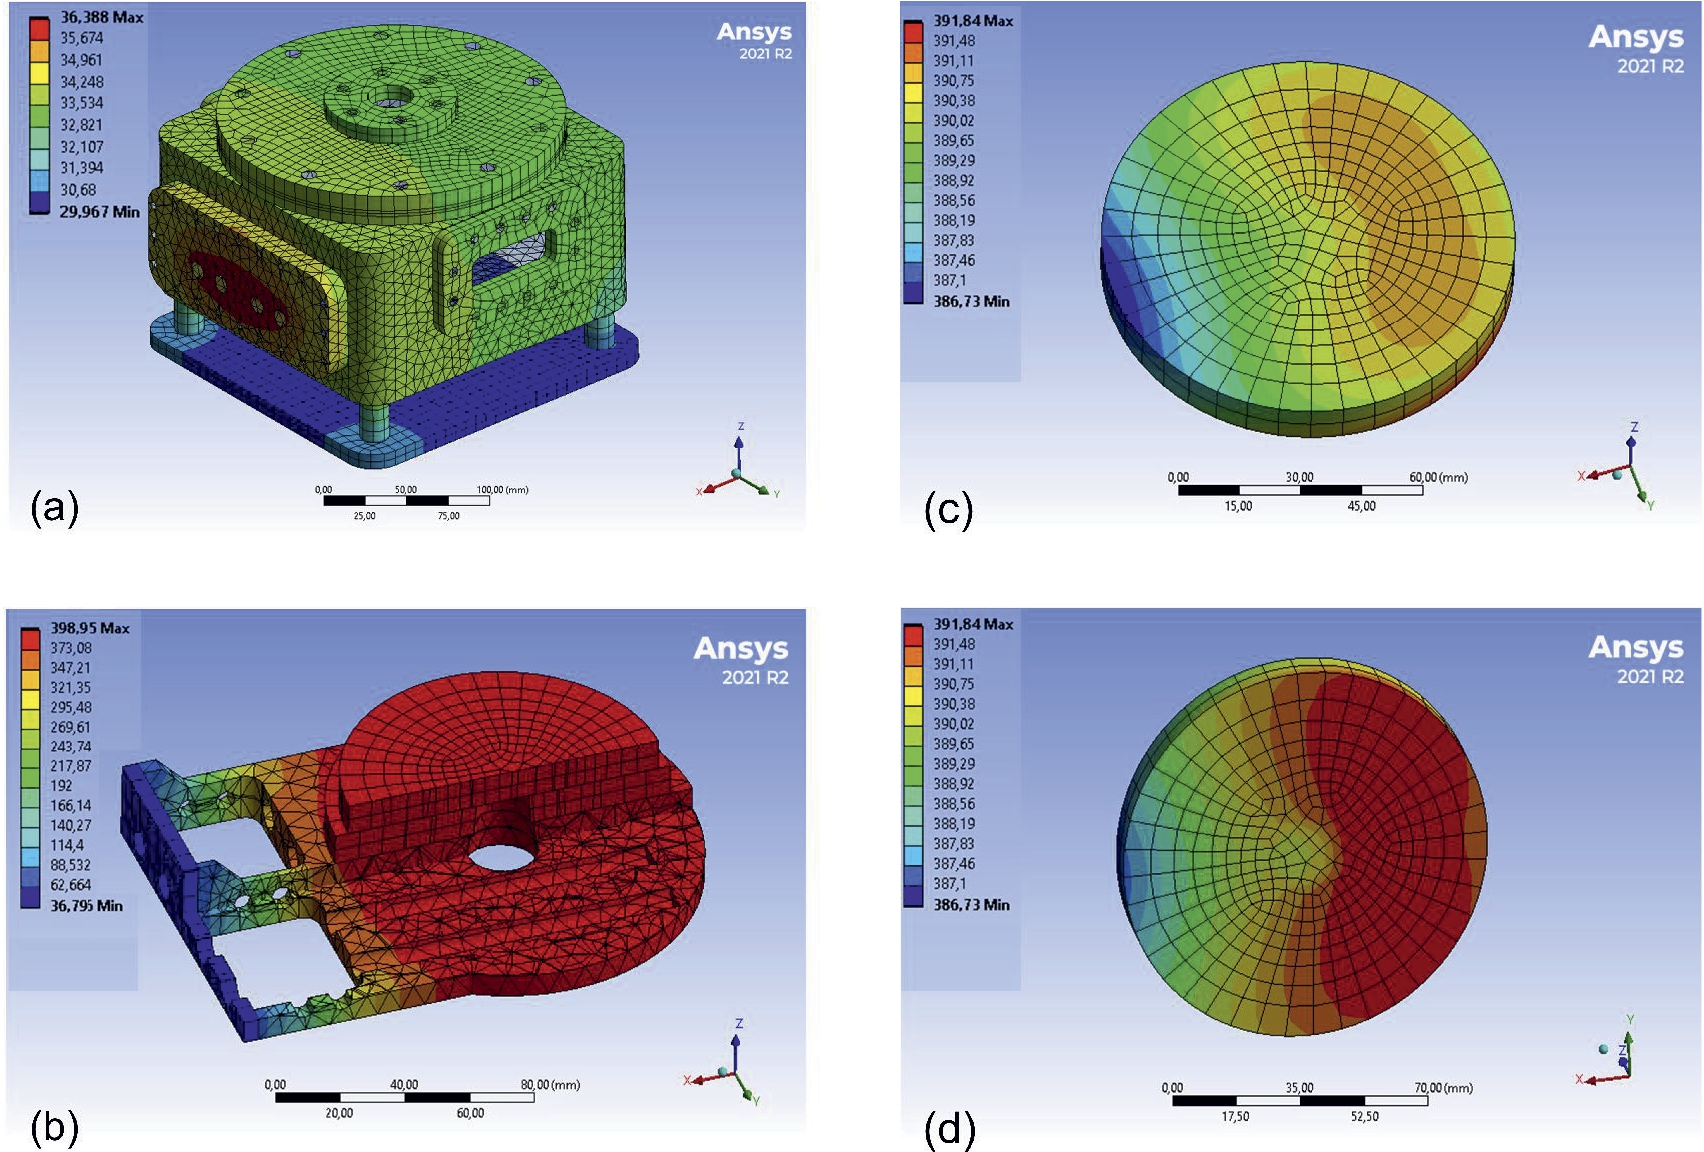
Fig. 6.
Temperature distribution of the cell when the temperature of the heating rods is set to 400°C and the cell is pressurized with 10 bar of argon. (a) Entire cell body, (b) sample support and heating plate, (c) close-up of the sample in NR mode, (d) close-up of the sample in SANS mode. The black lines indicate the elements used for the finite element method simulations.
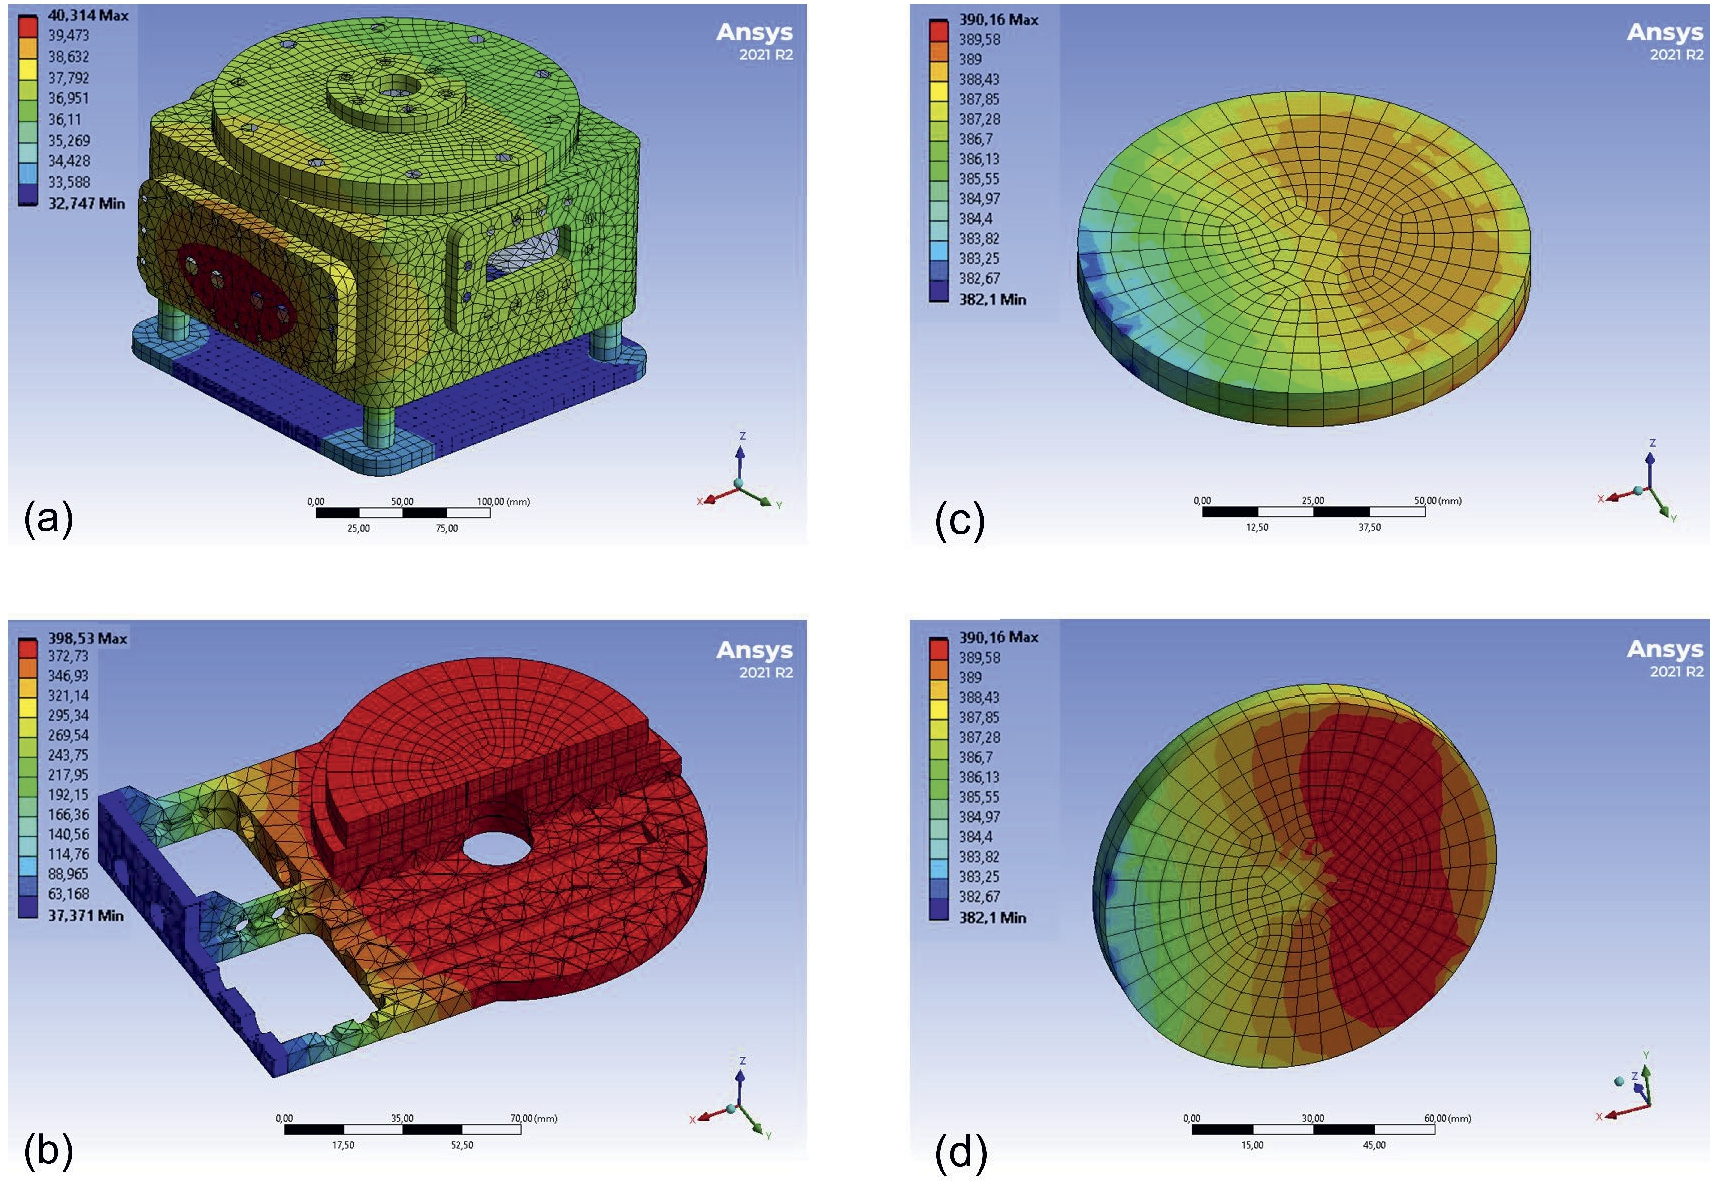
Fig. 7.
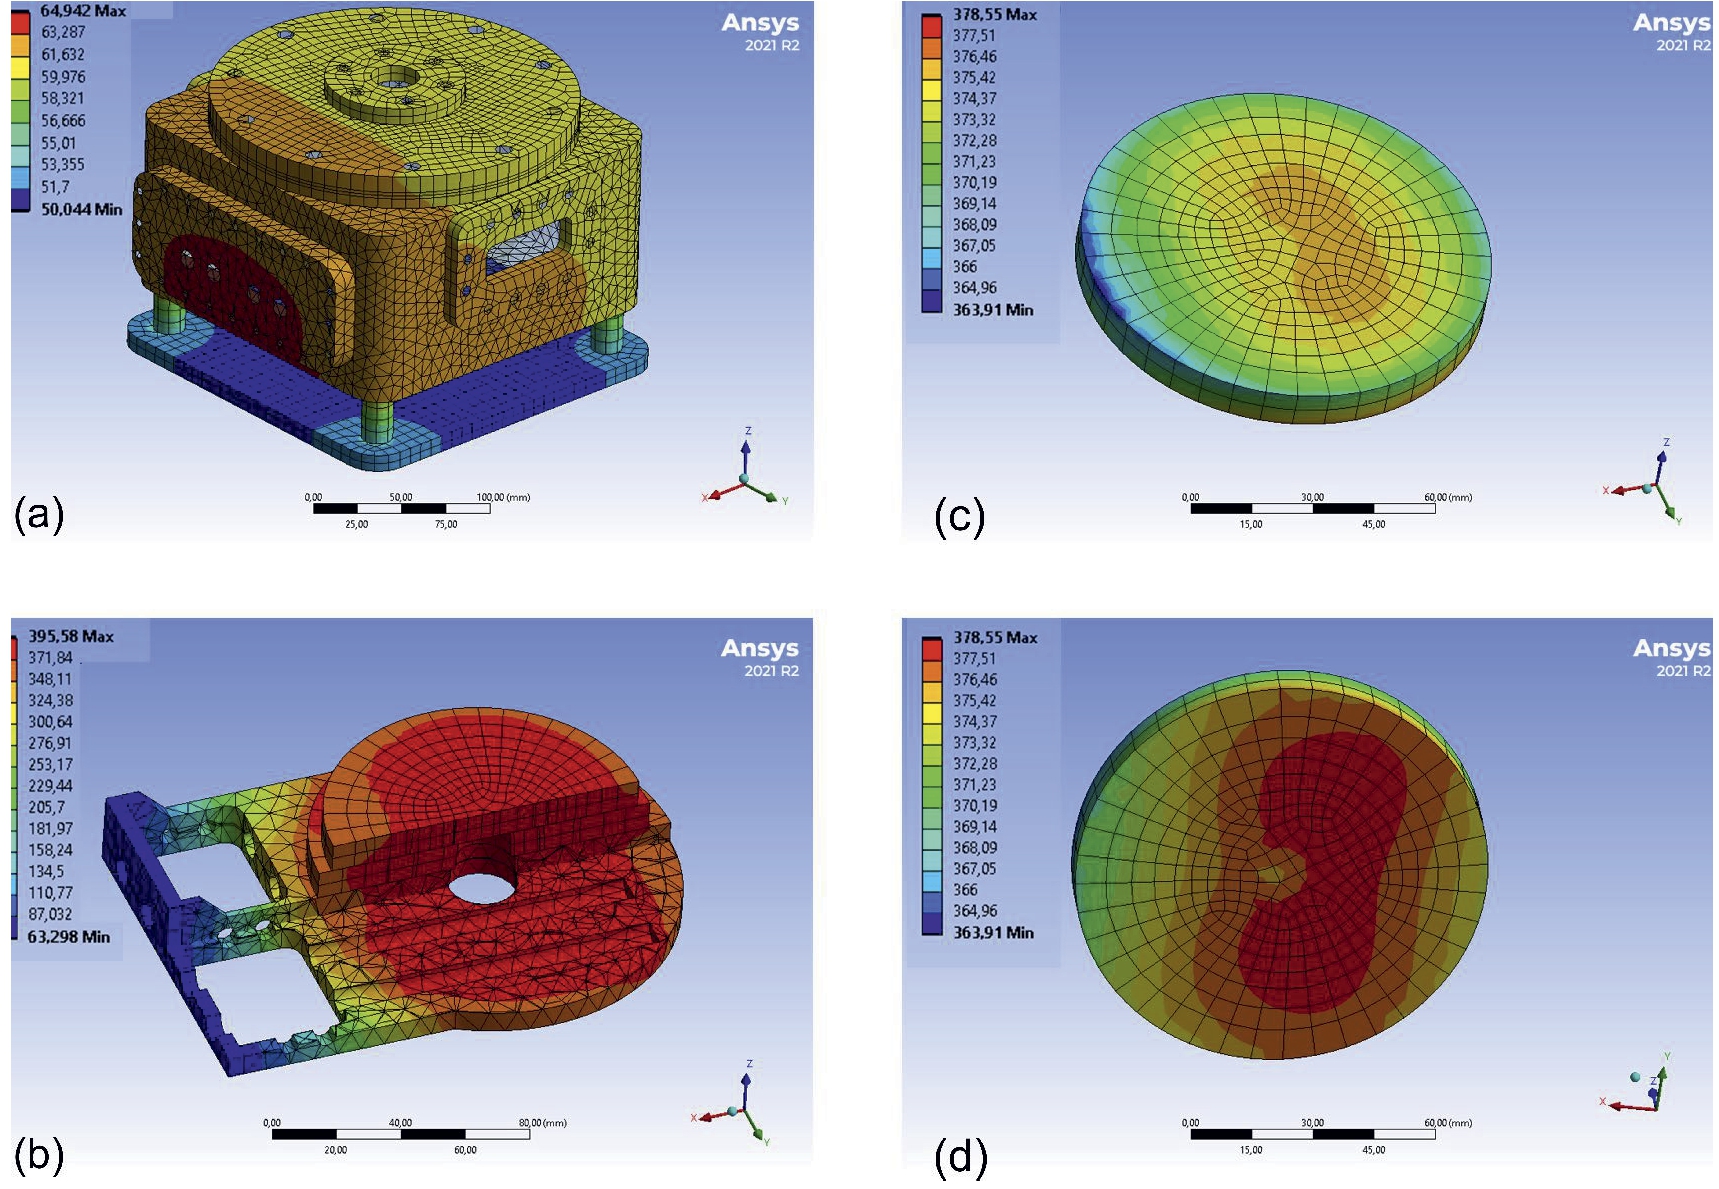
Temperature distribution of the cell when the temperature of the heating rods is set to 400°C and the cell is pressurized with 10 bar of helium. (a) Entire cell body, (b) sample support and heating plate, (c) close-up of the sample in NR mode, (d) close-up of the sample in SANS mode. The black lines indicate the elements used for the finite element method simulations.
1.4.Pressure and flow control
The pressure control of the cell is schematically depicted in Fig. 8 and all components are specified in Table 5. For the purposes of our measurements, the cell is operated as a vacuum flow cell. Pressure is supplied by a gas cylinder and substantially reduced to 11 bar with a double-stage pressure regulator. A MKS instruments pressure controller reads the pressure from the MKS instruments Baratron manometer and controls a solenoidal inlet valve (n.c.) to regulate the pressure inside the cell. A vacuum pump is connected to the other side of the cell. In between the vacuum pump and the cell, a mass flow controller (n.c.) and a solenoidal outlet valve, powered by a Delta Elektronica, are placed. The function of the solenoidal outlet valve is threefold: (i) to be able to swiftly reduce the pressure, (ii) provide maximum pumping capacity when operating in vacuum, and (iii) to increase the flow at low pressures (
The pressure and flow can be set, read and logged using a bespoke LabVIEW program. To facilitate this, the MKS controller and outlet valve are connected to a personal computer (pc) through a National Instruments USB DAQ. The mass flow controller and vacuum transducer are connected directly to the pc using a USB and RS485 connection, respectively.
The cell was vacuum leak tested using a helium leak tester Alcatel ASM-180TD+. The leak rate was found to be lower than 10−5 mbar.l/s. This implies that the vacuum level is limited by the pump and not by the cell itself.
1.5.Temperature control
The temperature of the cell is controlled using a Genlab Bench Top Control Station BTC2000/485 (Genlab Ltd., Cheshire, United Kingdom). It uses two Eurotherm P116/CC/VH/LRX/R/4CL controllers, each connected to one K-type thermocouple in the cell. One Eurotherm controller regulates the temperature of the sample support plate from the thermocouple placed in it. The temperature control station works by switching a solid state relay on and off using pulse-width and pulse-frequency modulation at up to 5 Hz with the help of PID control. The relay passes the 230 V mains voltage to the four heating rods connected in series, providing 750 W. The other Eurotherm controller is used for overheat protection by disabling the power output if the thermocouple inside one of the heating rods reaches a set temperature limit. The Genlab Control Station communicates with the LabVIEW program on the pc via RS-485.
The thermal performance of the cell is tested, with the cell chamber being vacuum or filled with 100 mbar argon or 1 bar of air. In vacuum the aluminum sample support plate reaches a maximum temperature of 380°C when the heater rod temperature is limited to 550°C. This large difference is expected due to the limited contact between the heating rods and the steel plate in which the rods are inserted and because of the absence of a gas providing some of the heat transfer. The top surface of a 3 inch diameter, 5 mm thick quartz substrate reached a temperature of 310°C. This was measured using a third thermocouple pressed down on the surface with a lever.
As expected, operating the cell in argon or air yields much smaller temperature differences between the heating rods, aluminum sample support plate and the top of the 5 mm thick quartz substrate. When limiting the heating rods to 450°C, the temperature in the sample stage reaches 350°C in 100 mbar argon. It illustrates that instead of heating a sample in vacuum, some argon (or helium) gas can be used as exchange gas to improve the heat transfer from the heating rods to the sample. We are currently reviewing options to improve this thermal contact.
Above a sample plate temperature of 200°C, the cell body is water cooled with a brass cooling block attached to the side of the body to keep the body below 60°C. With water cooling, the maximum body temperature is 40°C with the heating rods at 550°C. This is measured with a surface temperature thermocouple on the body. The cooling block is built in-house with a 4 mm diameter channel using a flow rate of 1 l/min. A sample plate temperature of 200°C is reached within 6 minutes. The steady state temperature stability is within 1°C.
Table 4
Results of the thermal simulations when the temperature of the heating rods are set to 400°C and the cell is (i) under vacuum, (ii) filled with 10 bar Argon and (iii) filled with 10 bar He
| Vacuum | 10 bar Argon | 10 bar Helium | |
| Heating rods temperature [°C] | 400 | 400 | 400 |
| Heat loss to environment (convection) [W] | 33 | 45 | 120 |
| Outer cell wall mean temperature [°C] | 33 | 37 | 62 |
| Outer cell wall max. temperature [°C] | 36 | 40 | 65 |
| Quartz window max. temperature [°C] | 34 | 38 | 64 |
| Sample temperature NR (surface, center) [°C] | 390 | 388 | 374 |
| Sample temperature SANS (surface, center) [°C] | 389 | 388 | 376 |
| Max. temperature gradient on sample surface for NR [°C] | 3 | 3 | 4 |
| Max. temperature gradient in sample for SANS [°C] | 1 | 1 | 1 |
Fig. 8.
Schematics of the pressure and temperature control system. In the schematics, the cell is positioned horizontally for neutron reflectometry measurements. (1) gas cylinder, (2) double-stage pressure regulator, (3) MKS instruments 0248AC-100SV solenoid inlet valve (n.c.), (4) pressure relief valve, (5) MKS instruments Baratron type 627DMCC1B manometer, (6) MKS instruments type 250E-1-D pressure controller, (7) personal computer, (8) pressure cell (0–10 bar), (9) single crystal quartz window, (10) sample, (11) heating plate with 4 60 V, 38 W heating rods connected in series, of which one has a thermocouple, (12) thermocouple clamped to the sample, (13) manual air-valve, (14) solenoid outlet valve, n.c. (Bronkhorst F-001AI-IIU033-V, connected to a Delta Elektronica ES030 – 5 power supply), (15) Bronkhorst F-201CV-200-AAD-33-V EL Flow Select 200 mln/min Ar n.c. mass flow controller, (16) Adixen Drytel 1025 vacuum pump, (17) Thyracont VSP64DL vacuum transducer.
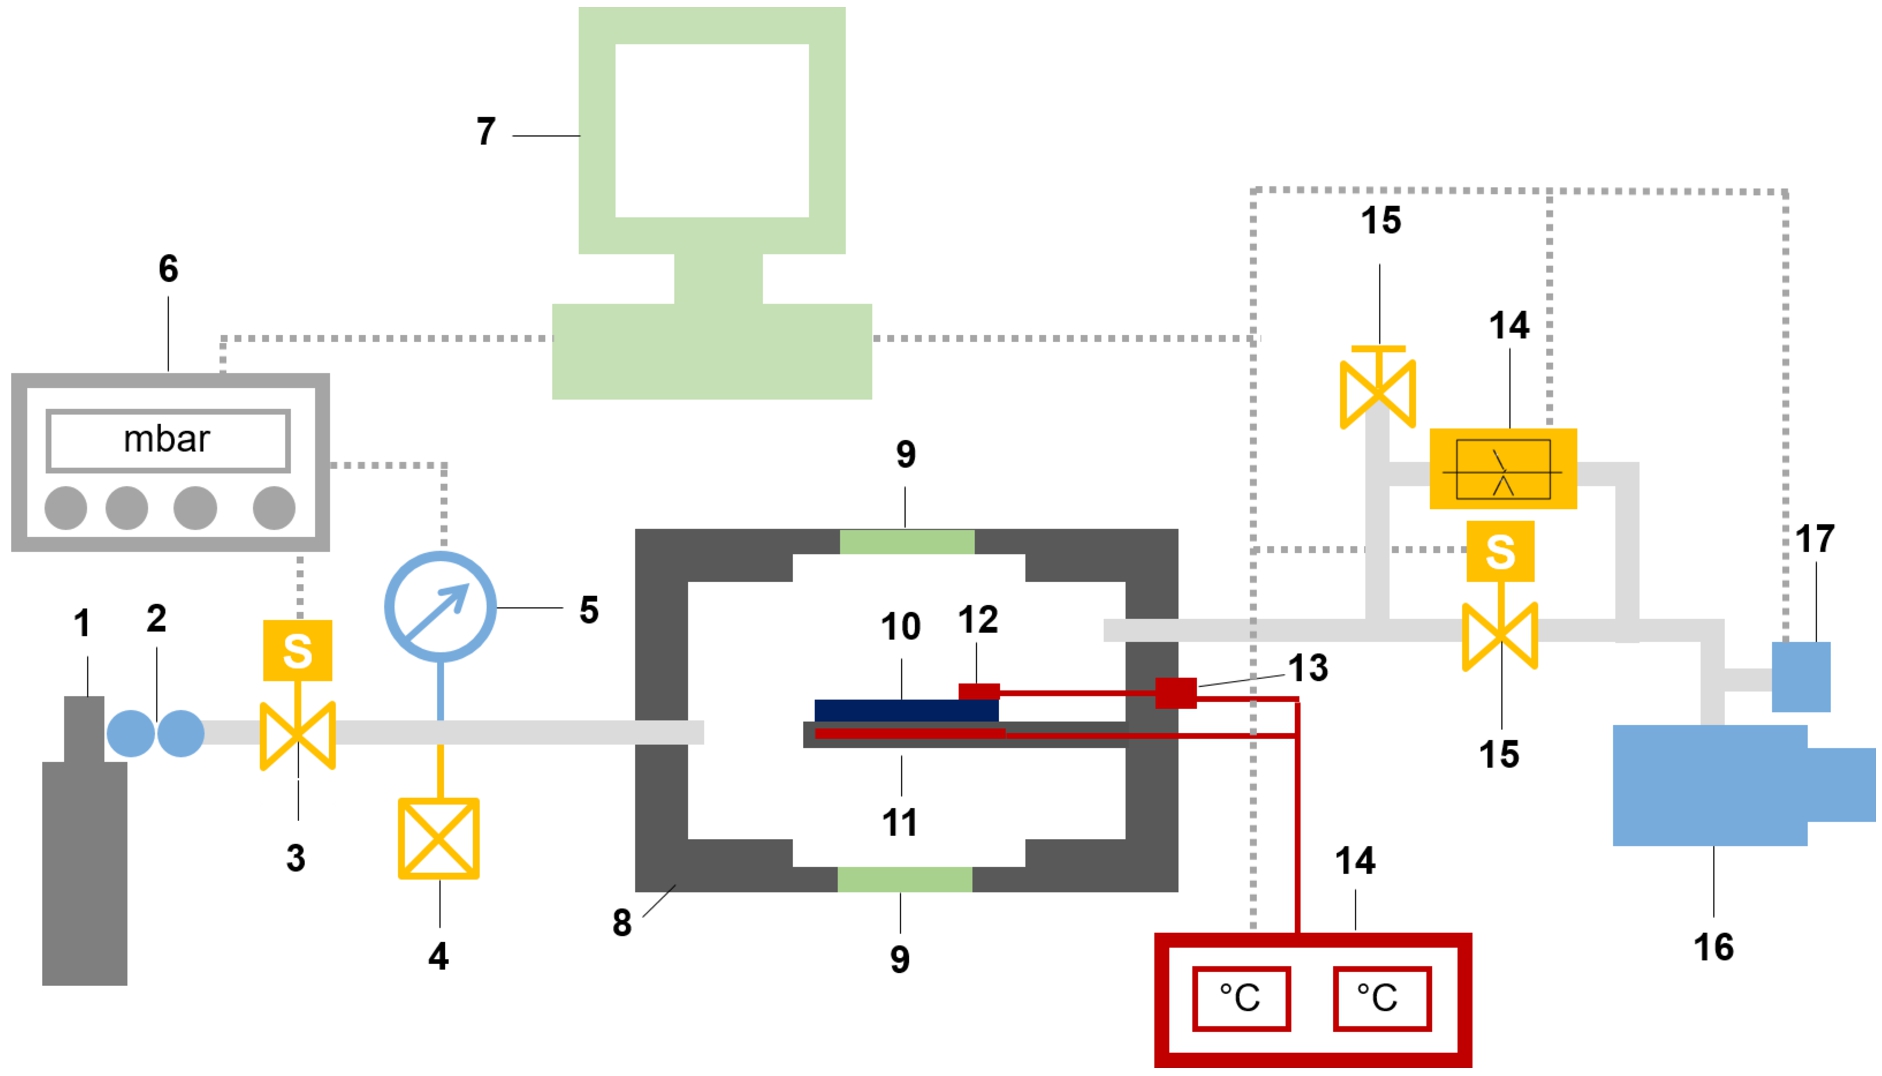
Table 5
Specifications of the auxiliary equipment used for the pressure-, flow- and temperature control
| Component | Model | Supplier |
| Inlet valve | MKS instruments 0248AC-10000SV solenoid inlet valve | MKS Instruments, Inc., Andover, Massachusetts, United States |
| Pressure controller | MKS instruments type 250E-1-D | MKS Instruments, Inc., Andover, Massachusetts, United States |
| Manometer | MKS Baratron type 627DMCC1B manometer | MKS Instruments, Inc., Andover, Massachusetts, United States |
| Outlet valve | Bronkhorst F-001AI-IIU033-V, connected to a Delta Elektronica ES030 – 5 power supply | Bronkhorst High-Tech BV, Ruurlo, The Netherlands |
| Flow controller | Bronkhorst F-201CV-200-AAD-33-V EL Flow Select 200 mln/min Ar n.c. mass flow controller | Bronkhorst High-Tech BV, Ruurlo, The Netherlands |
| Pump | Adixen Drytel 1025 vacuum pump | Pfeiffer Vacuum GmbH, Asslar, Germany |
| Vacuum transducer | Thyracont VSP64DL vacuum transducer | Thryracont Vacuum Instruments GmbH, Passau, Germany |
| DAQ | USB-6008 Low-Cost Multifunction I/O | National Instruments corp., Austin, Texas, United States |
| Thermocouple on sample | Type K thermocouple | Genlab Ltd., Cheshire, United Kingdom |
| Heating rods (4×) | Watlow type 2285-7052, 60 V, 200 W cartridge heaters, diameter 0.371 inch (9.4 mm), length 7.1 inch (180 mm) with built in K-type thermocouple. | Kurval B.V., Nieuw Vennep, The Netherlands |
| Temperature controller | Genlab Bench Top Control Station BTC2000/485 | Genlab Ltd., Cheshire, United Kingdom |
2.Example of use: Hydrogenation of a Ta-based film
Fig. 9.
In-situ NR results of the 40 nm Ta thin films with a 4 nm Ti adhesion layer and capped with a 10 nm Pd0.6Au0.35Cu0.05 at
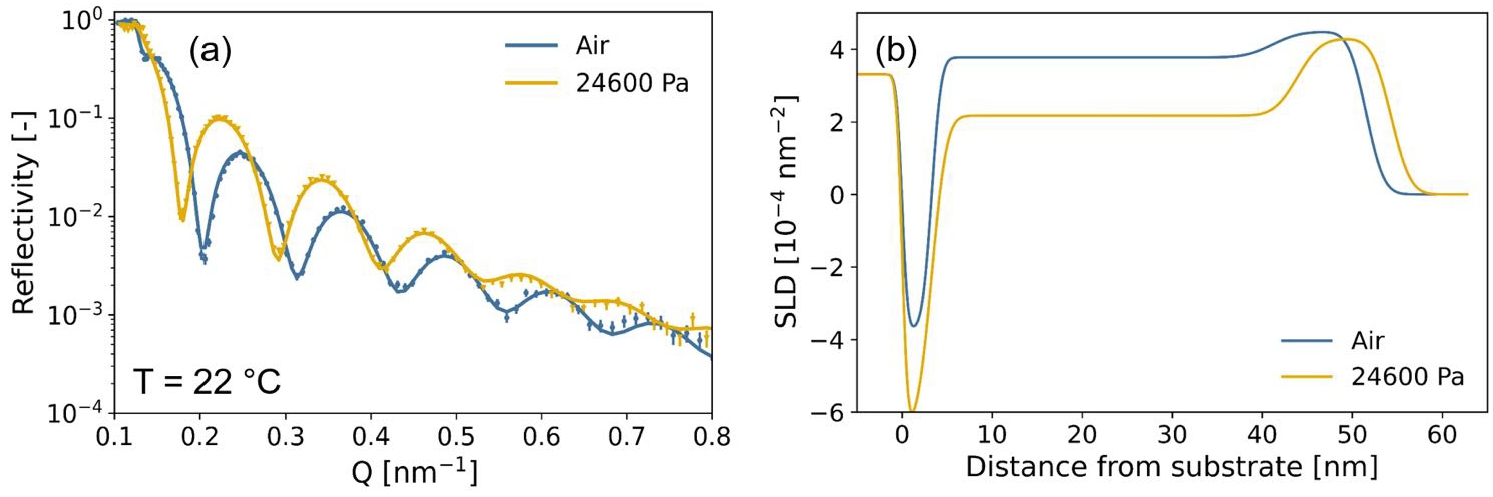
To illustrate the performance of the cell, we performed neutron reflectometry experiments on a Ta based thin film samples to determine the hydrogen concentration and expansion of the Ta layer when exposed to a certain partial hydrogen pressure. The samples consists of a 4 nm titanium adhesion layer, a 40 nm Ta sensing layer and a 10 nm Pd0.6Au0.4 capping layer (nominal thicknesses) to catalyze the hydrogen dissociation and recombination reaction and prevent the film from oxidation. The samples were produced by magnetron sputtering on quartz substrates with a diameter of 76.2 mm (3 inch) with a thickness of 3.0 mm, a surface roughness < 0.5 nm and a flatness of 2 lambda over 85% CA Central (Coresix Precision Glass, Inc., VA, USA) following a procedure described elsewhere [6].
The neutron reflectometry measurements were performed at the time-of-flight neutron reflectometer ROG located at the 2.3 MW HOR reactor of the Delft University of Technology, Delft, The Netherlands. The double disc chopper was set to a frequency of 17.7 Hz with an interdisc distance of 0.280 m resulting in a wavelength resolution of
Figure 9 displays the room temperature neutron reflectometry results on the Ta-based thin film in air and under a partial hydrogen pressure of
Besides the example above, we have already used the hydrogenation cell for several studies, of which some have been published [1,8,22].
3.Conclusion
In conclusion, we have successfully designed and realized a cell of which the temperature and pressure can be controlled and that can be used in combination with NR and SANS. The cell is compatible with simultaneous optical transmission and resistivity measurements, can accommodate samples up to 4 inch in diameter, be pressurized up to 10 bar, and temperature controlled up to 350°C while also allowing operation in vacuum. The four single crystal quartz windows ensure a high neutron and optical transmission. The performances of the cell is illustrated with neutron reflectometry experiments performed on a Ta based thin films under a hydrogen-containing atmosphere. The cell and engineering drawings thereof are available to the user community upon reasonable request.
Acknowledgements
The authors acknowledge funding from the OYSTER (Optimised Yield – for Science, Technology & Education – of Radiation) program, funded by The Netherlands Organisation for Scientific Research (NWO).
References
[1] | L.J. Bannenberg, L. Blom, K. Sakaki, K. Asano and H. Schreuders, Completely elastic deformation of hydrogenated Ta thin films, ACS Materials Letters 5: (4) ((2023) ) 962–969. doi:10.1021/acsmaterialslett.3c00038. |
[2] | L.J. Bannenberg, C. Boelsma, H. Schreuders, S. Francke, N.-J. Steinke, A.A. Van Well and B. Dam, Optical hydrogen sensing beyond Palladium: Hafnium and Tantalum as effective sensing materials, Sensors and Actuators B 283: ((2019) ), 538–548. doi:10.1016/j.snb.2018.12.029. |
[3] | L.J. Bannenberg, B. Boshuizen, F.A.A. Nugroho and H. Schreuders, Hydrogenation kinetics of metal hydride catalytic layers, ACS Applied Materials & Interfaces 13: (44) ((2021) ), 52530–52541. 34709777. doi:10.1021/acsami.1c13240. |
[4] | L.J. Bannenberg, M. Heere, H. Benzidi, J. Montero, E.M. Dematteis, S. Suwarno, T. Jaron, M. Winny, P.A. Orlowski, W. Wegner, A. Starobrat, K.J. Fijalkowski, W. Grochala, Z. Qian, J.-P. Bonnet, I. Nuta, W. Lohstroh, C. Zlotea, O. Mounkachi, F. Cuevas, C. Chatillon, M. Latroche, M. Fichtner, M. Baricco, B.C. Hauback and A. El Kharbachi, Metal (boro-) hydrides for high energy density storage and relevant emerging technologies, International Journal of Hydrogen Energy 45: (58) ((2020) ), 33687–33730. doi:10.1016/j.ijhydene.2020.08.119. |
[5] | L.J. Bannenberg, F.A.A. Nugroho, H. Schreuders, B. Norder, T.T. Trinh, N.-J. Steinke, A.A. Van Well, C. Langhammer and B. Dam, Direct comparison of PdAu alloy thin films and nanoparticles upon hydrogen exposure, ACS Applied Materials & Interfaces 11: (17) ((2019) ), 15489–15497. doi:10.1021/acsami.8b22455. |
[6] | L.J. Bannenberg, H. Schreuders and B. Dam, Tantalum-Palladium: Hysteresis-free optical hydrogen sensor over 7 orders of magnitude in pressure with sub-second response, Advanced Functional Materials 31: ((2021) ), 2010483. doi:10.1002/adfm.202010483. |
[7] | L.J. Bannenberg, H. Schreuders, H. Kim, K. Sakaki, S. Hayashi, K. Ikeda, T. Otomo, K. Asano and B. Dam, Suppression of the phase coexistence of the fcc–fct transition in hafnium-hydride thin films, The Journal of Physical Chemistry Letters 12: (45) ((2021) ), 10969–10974. doi:10.1021/acs.jpclett.1c03411. |
[8] | L.J. Bannenberg, H. Schreuders, N. van Beugen, C. Kinane, S. Hall and B. Dam, Tuning the properties of thin-film TaRu for hydrogen-sensing applications, ACS Applied Materials & Interfaces 15: (6) ((2023) ), 8033–8045. doi:10.1021/acsami.2c20112. |
[9] | L.J. Bannenberg, H. Schreuders, L. van Eijck, J.R. Heringa, N.-J. Steinke, R. Dalgliesh, B. Dam, F.M. Mulder and A.A. van Well, Impact of nanostructuring on the phase behavior of insertion materials: The hydrogenation kinetics of a magnesium thin film, The Journal of Physical Chemistry C 120: (19) ((2016) ), 10185–10191. doi:10.1021/acs.jpcc.6b02302. |
[10] | M. Björck and G. Andersson, GenX: An extensible X-ray reflectivity refinement program utilizing differential evolution, Journal of Applied Crystallography 40: (6) ((2007) ), 1174–1178. doi:10.1107/S0021889807045086. |
[11] | C. Boelsma, L.J. Bannenberg, M.J. van Setten, N.-J. Steinke, A.A. Van Well and B. Dam, Hafnium – an optical hydrogen sensor spanning six orders in pressure, Nature Communications 8: ((2017) ), 15718. doi:10.1038/ncomms15718. |
[12] | S.J. Callori, C. Rehm, G.L. Causer, M. Kostylev and F. Klose, Hydrogen absorption in metal thin films and heterostructures investigated in situ with neutron and X-ray scattering, Metals 6: (6) ((2016) ), 125. doi:10.3390/met6060125. |
[13] | M.J. Demkowicz and J. Majewski, Probing interfaces in metals using neutron reflectometry, Metals 6: (1) ((2016) ), 20. doi:10.3390/met6010020. |
[14] | J.A. Dura, E.D. Rus, P. Kienzle and B.B. Maranville, Nanolayer analysis by neutron reflectometry, in: Nanolayer Research: Methodology and Technology for Green Chemistry, T. Imae, ed., Elsevier, Amsterdam, (2017) . |
[15] | F. Fernandez-Alonso and D.L. Price, Neutron Scattering, Academic Press, (2013) . |
[16] | H. Fritzsche, J. Huot and D. Fruchart, Neutron Scattering and Other Nuclear Techniques for Hydrogen in Materials, Springer, (2016) . |
[17] | H. Fritzsche, C. Ophus, C.T. Harrower, E. Luber and D. Mitlin, Low temperature hydrogen desorption in MgAl thin films achieved by using a nanoscale Ta/Pd bilayer catalyst, Applied Physics Letters 94: (24) ((2009) ), 241901. doi:10.1063/1.3154550. |
[18] | H. Fritzsche, M. Saoudi, J. Haagsma, C. Ophus, E. Luber, C. Harrower and D. Mitlin, Neutron reflectometry study of hydrogen desorption in destabilized MgAl alloy thin films, Applied Physics Letters 92: (12) ((2008) ), 121917. doi:10.1063/1.2899936. |
[19] | S. Holmryd and D. Connor, SiO2 (quartz), MgO, PbF2, and Bi as low-pass neutron velocity filters, Review of Scientific Instruments 40: (1) ((1969) ), 49–56. doi:10.1063/1.1683747. |
[20] | A. Junghans, E.B. Watkins, R.D. Barker, S. Singh, M.J. Waltman, H.L. Smith, L. Pocivavsek and J. Majewski, Analysis of biosurfaces by neutron reflectometry: From simple to complex interfaces, Biointerphases 10: (1) ((2015) ), 019014. doi:10.1116/1.4914948. |
[21] | P. Kalisvaart, E. Luber, H. Fritzsche and D. Mitlin, Effect of alloying magnesium with chromium and vanadium on hydrogenation kinetics studied with neutron reflectometry, Chemical Communications 47: (14) ((2011) ), 4294–4296. doi:10.1039/c0cc05501h. |
[22] | A. Morisset, T. Famprikis, F.-J. Haug, A. Ingenito, C. Ballif and L.J. Bannenberg, In situ reflectometry and diffraction investigation of the multiscale structure of p-type polysilicon passivating contacts for c-Si solar cells, ACS Applied Materials & Interfaces 14: (14) ((2022) ), 16413–16423. doi:10.1021/acsami.2c01225. |
[23] | A.E. Munter and B.J. Heuser, Deuterium phase behavior in thin-film Pd, Physical Review B 58: (2) ((1998) ), 678. doi:10.1103/PhysRevB.58.678. |
[24] | A.E. Munter, B.J. Heuser and M. Ruckman, In situ neutron-reflectometry measurements of hydrogen and deuterium absorption in a Pd/Nb/Pd layered film, Physical Review B 55: (21) ((1997) ), 14035. doi:10.1103/PhysRevB.55.14035. |
[25] | V.F. Sears, Neutron scattering lengths and cross sections, Neutron news 3: (3) ((1992) ), 26–37. doi:10.1080/10448639208218770. |
[26] | G.L. Squires, Introduction to the Theory of Thermal Neutron Scattering, Courier Corporation, (1996) . |
[27] | B.T.M. Willis and C.J. Carlile, Experimental Neutron Scattering, Oxford University Press, (2017) . |
[28] | K.G. Yager, O.M. Tanchak, C.J. Barrett, M.J. Watson and H. Fritzsche, Temperature-controlled neutron reflectometry sample cell suitable for study of photoactive thin films, Review of scientific instruments 77: (4) ((2006) ), 045106. doi:10.1063/1.2194090. |


