
A fast-cooling mode for blue series furnaces
Abstract
Blue series top-loading furnaces are regularly used at neutron facilities to carry out experiments at up to
1.Introduction
According to annual reports of the Institut Laue-Langevin (ILL), the ILL-type furnace, also known as the blue series, appeared in the mid-1980s after the importance of high temperatures at ILL was proven by 83 experiments requiring a furnace in 1980 (664 days). In 1975, several furnaces had been built and a lot of requests for help from users justified the creation of the “Furnace” group inside the “Sample Environment” department. The first successful ILL experiment performed at elevated temperature is certainly the measurement of the structure factor of liquid rubidium up to
In 1980, Raymond Serve launched an ILL furnace project based on Pierre Aldebert’s design whom research works were pursued by a British team of scientists [1,2]. This furnace featured a double concentric resistor system and a very practical top-mounted electrical supply. The furnace reached
In the late 1980s, Pierre Andant innovated with a monolithic resistor using point-welded 50 μm niobium foils. In 1993, following the requests of other facilities, the production of the blue series handed over to the company AS Scientific Ltd (U.K.). Nowadays, these furnaces are still used at the ILL, the ISIS Facility (UK), the Paul Scherrer Institute (PSI, Switzerland) and many other neutron facilities worldwide.
Fig. 1.
Schematic representation of the blue series furnaces used at many neutron facilities. The temperature of the sample placed at the bottom of the stick is measured with thermocouples. The heating elements consist of a double concentric resistor made from 40 and 50 μm vanadium and niobium foils respectively. It is surrounded by heat shields made from the same foils. The body and the current leads of the furnace are water cooled.

The weakness of these furnaces is the impossibility to break the vacuum at temperatures above 100 or
At ISIS, as shown in Fig. 2, exchange gas is introduced from
2.Using exchange gas
Fig. 2.
Sample temperature variation after exchange gas introduction at 150, 300 and
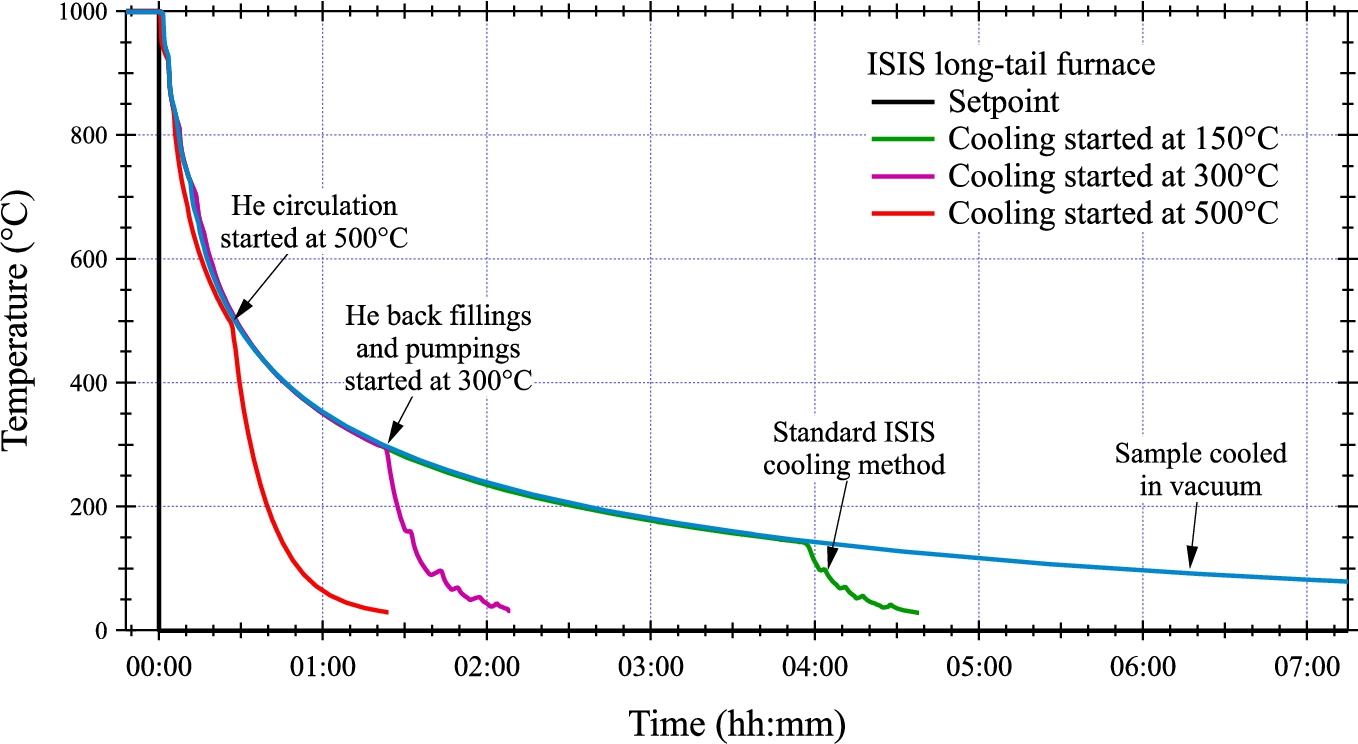
Without introducing exchange gas, the sample reaches a temperature of
From this experience, the ISIS team tried to start introducing the gas at higher temperatures in a long-tail furnace. The tests, performed with a sample stabilised beforehand at
The curve obtained by starting injecting gas at
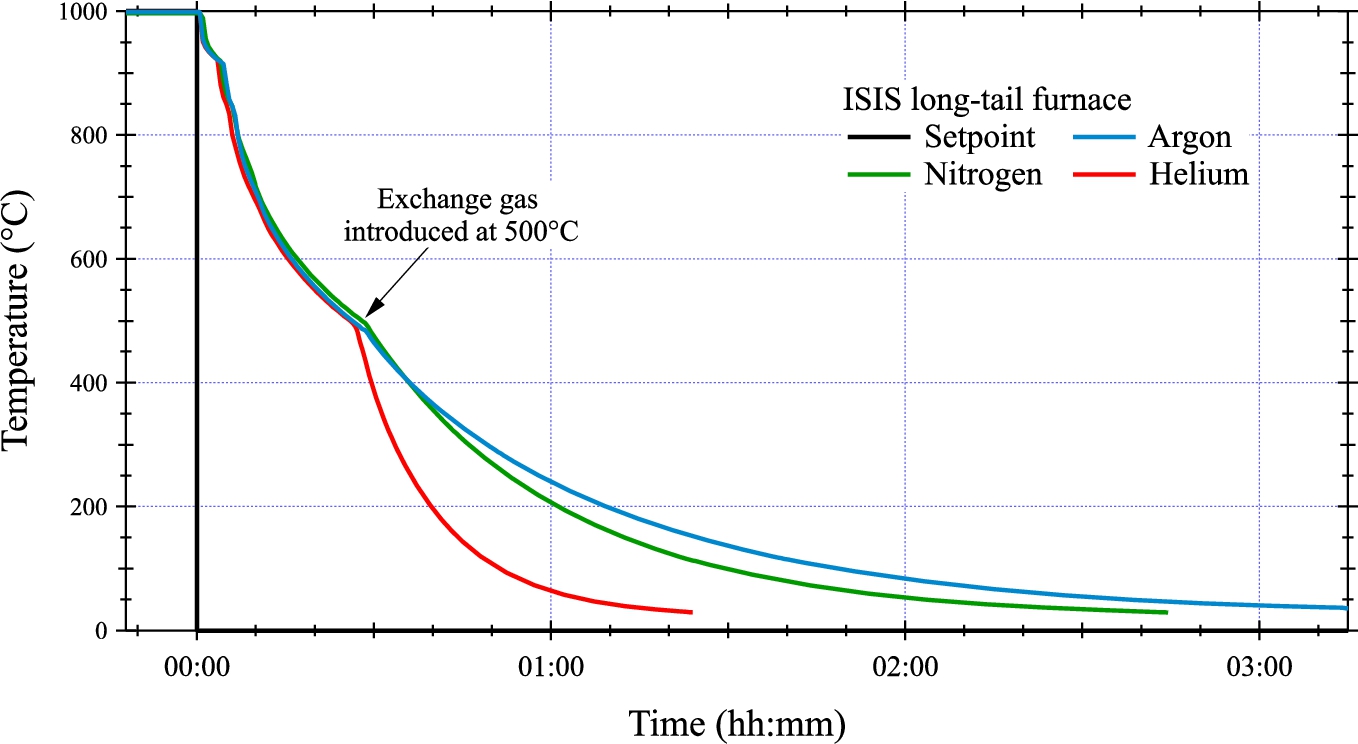
The same tests were then conducted with other inert gases and the results are summarised in Fig. 3. As expected, helium clearly provides the best cooling rates, up to two times quicker than argon. It can be noted that this result does not depend whether the gas is injected at the bottom or top of the vacuum vessel.
Fig. 3.
Sample temperature variation after the introduction of argon, helium or nitrogen at
3.Optimum flow-rate of helium
3.1.Long-tail furnaces
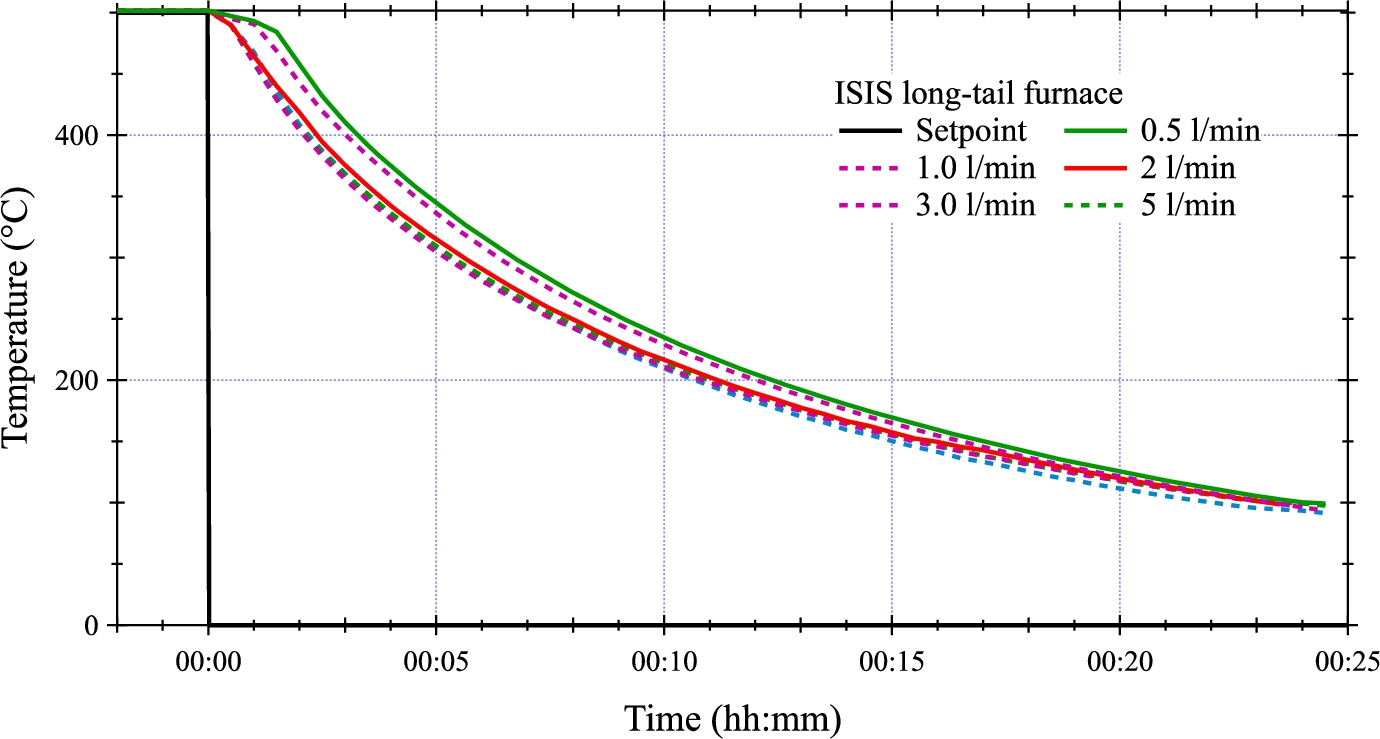
In order to further reduce beam time losses and prevent repeated heating of the body of the long-tail furnaces, the ISIS team has performed a series of cooling tests with a continuous flow instead of a single or repeated introduction of helium. The results, presented in Fig. 4, were obtained with helium flowed at 10, 5, 3, 2, 1 and 0.5 l/min using a standard flowmeter. Clearly, the optimum cooling rate is obtained above 2 l/min. The gain in time is of only a few minutes but the temperature of the body of the furnace stays at acceptable temperatures, of the order of
Fig. 4.
Sample temperature variations observed when circulating helium from
3.2.Short-tail furnaces
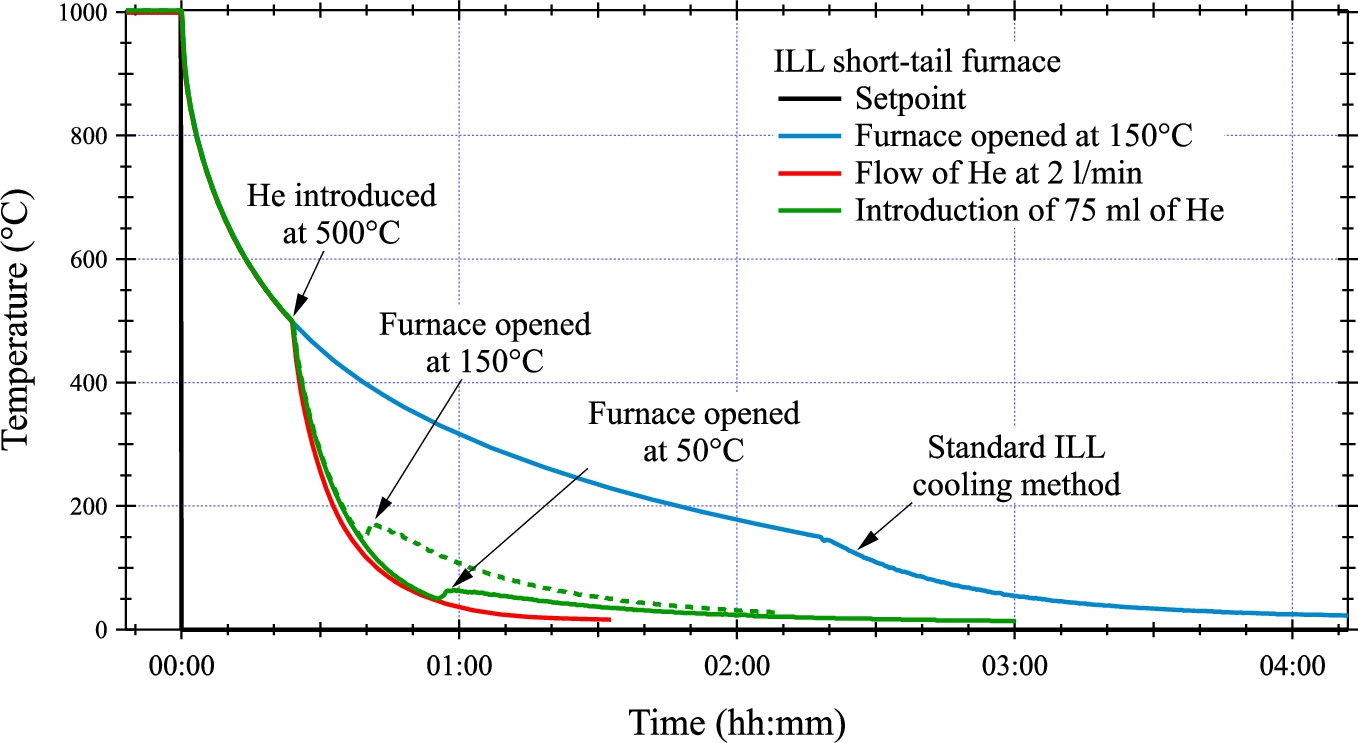
The furnaces used at the ILL are slightly different than those used at ISIS. They have a smaller beam window and are closed at the bottom with an aluminium alloy flange which is easier to cool down. The mass to cool is therefore less important and the heat exchange is more efficient. In normal operation, the sample cools down to
Tests conducted at the ILL with the above parameters determined at ISIS also lead to very good results. A gain factor of 4 was obtained by flowing He exchange gas at 2 l/min starting from
Fig. 5.
Sample temperature variations observed for a short-tail furnace when circulating helium from
4.Automation of the fast-cooling mode
Because some of us were expecting a reduction of the lifetime of the heating elements and heat shields of the furnaces, a manual setup has been adapted to all furnaces at ISIS and adopted in the experimental programs. Records have been kept to identify if any change to the lifetime of the elements were shortened due to the rapid cooling. This has been conducted for almost a year and no shortening of the operational life has been observed.
We have therefore decided that the final system would be automated so that the new cooling process becomes an easy task or even a transparent task for the visiting scientists. The ISIS team has developed an electronics controlling the evacuation of the vessel, the heating of the sample and the regulation of the flow of helium. The components controlled by a PLC (Programmable Logic Controllers) are presented in Fig. 6. From the sample temperature reading, the pressure in the vacuum vessel and the user setpoint, the PLC decides what to do. It prepares the heating by pumping the vacuum vessel to a sufficient level before starting the turbo pump. Once the required pressure is reached, it launches the regulation loop and enables the heating. When the user requests a cooling, the PLC reduces the heating power, stops the turbo pump and closes the vacuum solenoid valve. When the sample temperature reaches
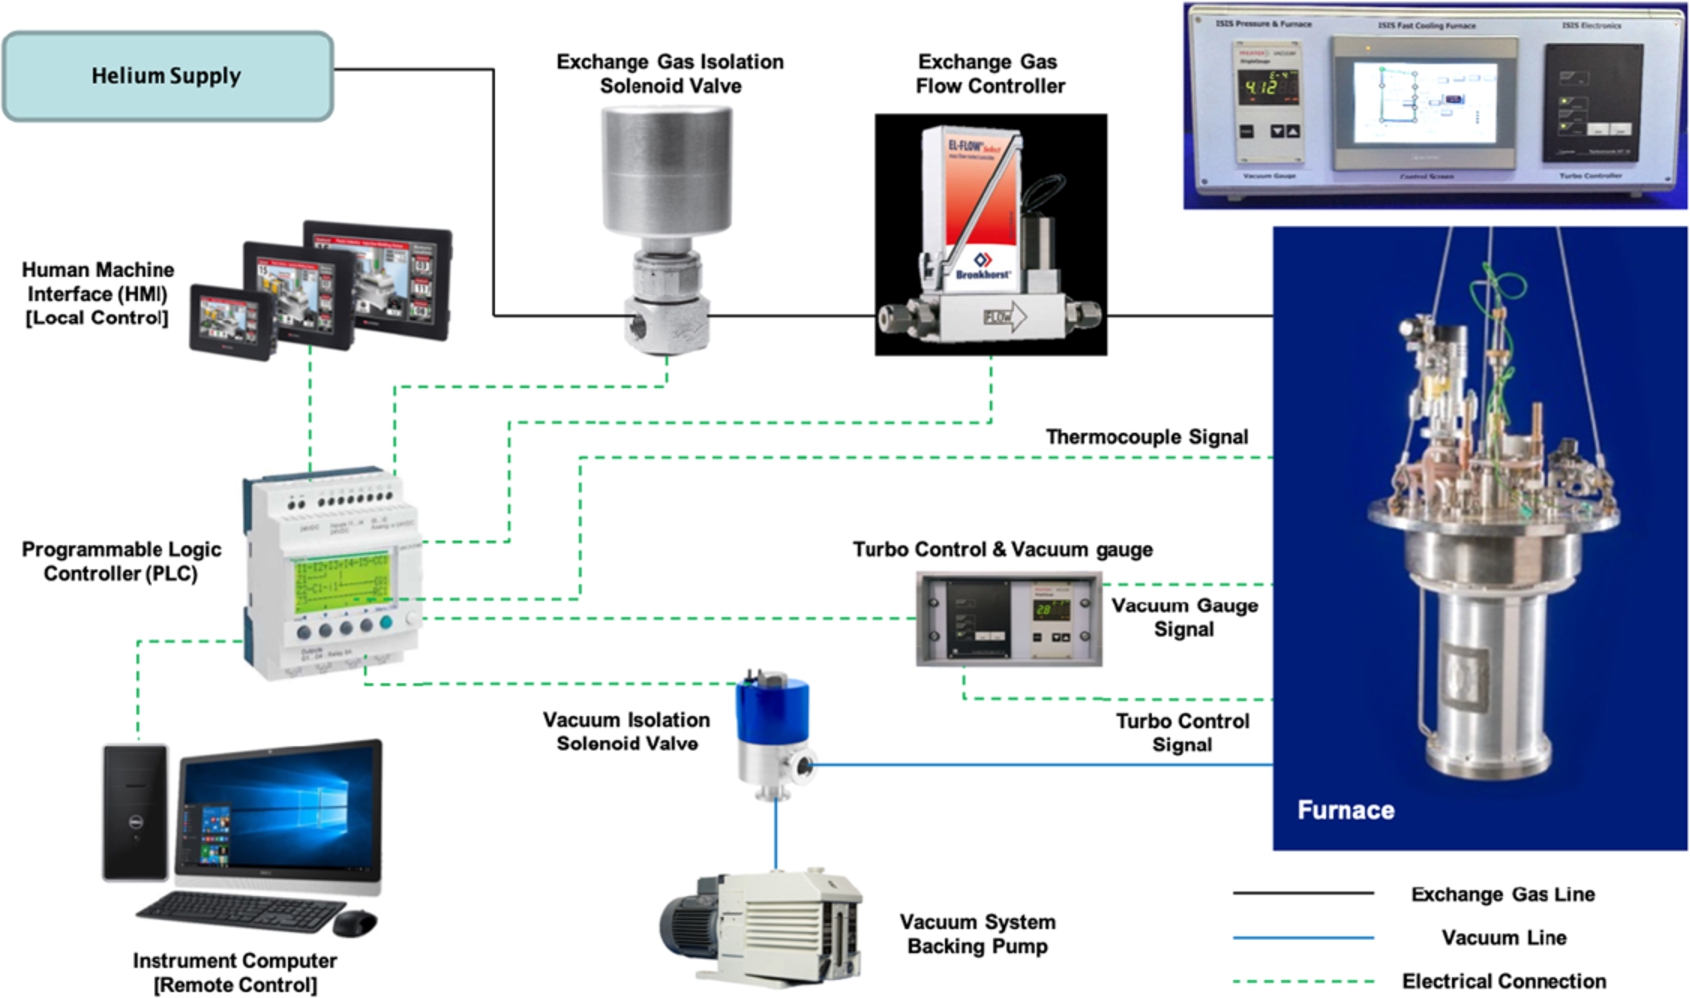
Fig. 6.
Diagram of the components driven by a programmable logic controller to implement automatically the fast-cool mode on long-tail furnaces. A photo of the produced controller is shown at the top right, above a photo of a long-tail furnace.
For ILL short-tail furnaces, the implementation of the fast-cool mode only requires a buffer and a set of valves allowing to inject 75 ml of helium when the temperature becomes lower than
5.Conclusion
We have presented a simple technique for reducing the cool-down times of blue series furnaces by a factor 4 to 5. The technique consists in flowing or injecting a predefined quantity of helium gas from
In 2018, 72 high-temperature experiments have been carried out at ISIS (181 days in total). Thanks to the fast cooling furnace system, over 42 days of neutron beam time have been saved, leading to an increase in efficiency of 23%. This is vital as new neutron guides, optics and detectors enable fast data collection. This will also be essential for new facilities such as the European Spallation Source.
Acknowledgements
 We thank very much colleagues from EU neutron facilities for the fruitful discussions held during this project and in particular M. Bartkowiak (PSI) and J. Peters (FRM II). This work was performed within the World class Science and Innovation with Neutrons in Europe 2020 (“SINE2020”) project, funded by the European Commission, Grant Agreement no. 654000.
References
[1] | P. Aldebert, Etude par diffraction et diffusion quasiélastic des neutrons de la mobilité anionique présentée à haute temperature par des oxydes réfractaires: Application à l’albumine et aux formes de haute temperature de la zircone et des sesquioxides de terres rares, (La2O3 et Nd2O3), PhD thesis, Université Paul Sabatier de Toulouse, 1980. |
[2] | P. Aldebert, Neutron and X-ray experiments at high temperature, Revue de Physique Appliquée 19: ((1984) ), 649–662. doi:10.1051/rphysap:01984001909064900. |
[3] | R. Block, J.B. Suck, W. Gläser, W. Freyland and F. Hensel, Measurement of the structure factor of liquid rubidium by neutron diffraction up to 1400 K and 200 bar, Berichte der Bunsengesellschaft für physikalische Chemie 80: (8) ((1976) ), 718–721. doi:10.1002/bbpc.19760800811. |
[4] | J. Ollivier and H. Mutka, IN5 cold neutron time-of-flight spectrometer, prepared to tackle single crystal spectroscopy, Journal of the Physical Society of Japan 80: (Suppl.B) ((2011) ), 003. doi:10.1143/JPSJS.80SB.SB003. |
[5] | R. Serve, Annual Report (1983). |


