
Expansion of the detector bank of the Necsa neutron powder diffractometer
Abstract
The neutron detector of Necsa’s “Powder Instrument for Transition in Structure Investigations” (PITSI) diffractometer is a pseudo area configuration that has an active area of
In this report the conversion of the current USB-communication based system to an Ethernet based system to reduce the hardware footprint and complexity, as well as the amount of cabling needed is reported. The optimisation of the operating parameters of the new detector electronics is also discussed.
1.Introduction
1.1.PITSI at SAFARI-1
The South African Fundamental Atomic Research Installation, SAFARI-1, is a 20 MW tank-in-pool type materials testing/research reactor operated by the South African Nuclear Energy Corporation (Necsa) SOC Limited. In addition to the production of radio isotopes, SAFARI-1 offers various irradiation services, neutron activation analysis, as well as hosts a number of neutron beam-line instruments [5]. The Powder Instrument for Transition in Structure Investigations (PITSI) [6] was commissioned in mid-2014 and has since provided the South African research community with a unique capability to perform temperature dependent angular dispersive neutron powder diffraction studies. It supports both low and high temperature sample environments to facilitate in-situ parametric studies of crystallographic and magnetic phenomena covering the temperature range 1.5 to 1800 K. Its flexibility in the choice of the monochromator reflections, focus conditions and take-off angles allow selection of instrumental characteristics that suit investigation over a wide range of scientific problems.
1.2.Detector bank
The PITSI detector assembly employs 15 vertically stacked Reuter-Stokes model RS-P4-0824-208 linear position sensitive 3He-filled tubes to cover an effective active area of
Table 1
Properties of the PITSI linear position sensitive detector bank tubes
| Diameter (mm) | Active length (mm) | He3 pressure (atm) | Body material | Internal insulator | Operating voltage (V) | Thermal neutron flux range ( |
| 25.4 | 609.6 | 8.2 | 304 S.S. | Al2O3 ceramic | 1275–1950 |
1.3.Data acquisition and reduction
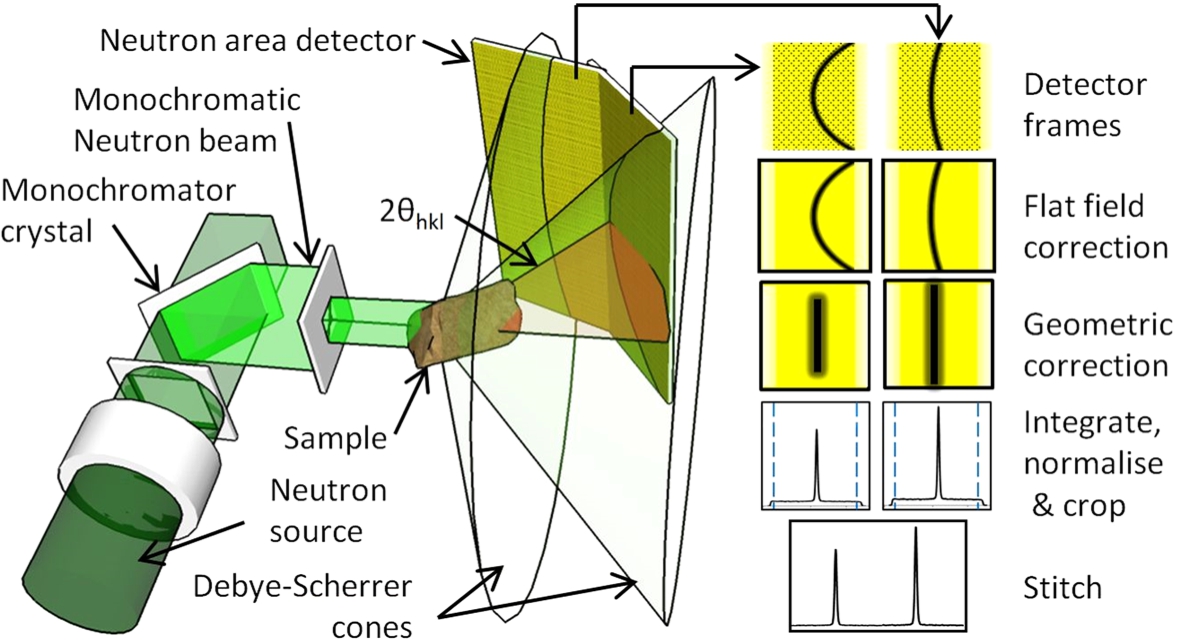
The analogue signals from each detector tube are processed with an Instrumentation Associate’s (IA) Position Encoding Module (PEM) through a pre-amplifier [1]. Each PEM fits in a standard NIM crate slot and communicates with the host computer via a USB interface. The PITSI detector bank therefore requires 15 PEMS and 15 USB cables. The PEMs operating parameters are configured via the IA software PSDControl which calibrates each detector using data of isotropically scattered neutrons transmitted through a cadmium mask with regular vertical slits that is positioned in front of the detector array. Calibrated data is requested from the Ansto Histogram Memory Server (HM) via a TCP/IP protocol which provides it to the SINQ Instrument Control Software (SICS) [3]. The spatially scattered data is stored together with a complete list of instrument parameters in a NeXus data file. The in-house developed ScanManipulator [4] data processing software is used to apply various data correction algorithms as shown in Fig. 1 and amongst others outputs an intensity vs. 2θ data file which can be imported into Rietveld refinement programs for further analysis.
Fig. 1.
Illustration of the main neutron optical components of PITSI and data processing steps required to obtain a complete diffraction pattern.
1.4.Beam time optimisation
Improvement of the overall instrument efficiency has become a priority to accommodate a steadily growing user base, as well as a requirement for the investigation of dynamic effects that occur in crystallographic and magnetic transitions. The latter requires analysis of full diffraction patterns, or a wide range of diffraction peaks, simultaneously in an ideal situation. Notwithstanding the instrument rendering medium resolution diffraction data quality, it has become a priority to reduce the long measurement times currently required with investigations. Through the implementation of a large double focused monochromator the flux at the sample position is already maximised. An outstanding contributor that can be readily improved is to enlarge the detector subtention angle, whilst retaining the highest possible capture efficiency at each diffraction angle.
2.Expansion concept
2.1.Multi bank detector array
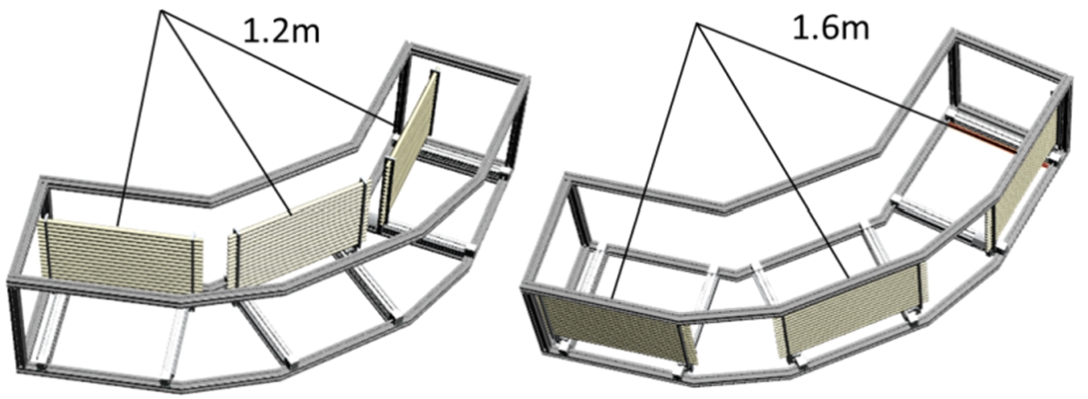
Various expansion concepts have been explored with the aim at minimising cost and implementation effort whilst maximising the detector active area and versatility. The configuration shown in Fig. 2 was selected as it incorporates the existing detector elements and signal processing, thereby minimising costs. The complete detector array will consist of three banks each containing 16 vertically stacked tubes (48 in total) which in conjunction with an adjustable sample-to-detector distance, between 1.2 m and 1.6 m, will provide an additional capability to either select highest peak intensity, or highest angular resolution. The incorporation of an additional detector in the bank height is a logical expansion since each (new) analogue electronic module can process 8 detectors. These expansions will thus increase the active area of each bank to
Fig. 2.
Illustration of the new expanded PITSI detector array respectively positioned at 1.2 m and 1.6 m from the sample position.
2.2.Data acquisition electronics
Adding an additional 33 detector elements to the current electronic system would require an additional 33 PEMs and 33 USB cables to be installed, i.e. 48 respectively in total. In order to reduce the cabling and physical size of the electronics, it was decided to replace the IA system with the Mesytec psd+ implementation [2]. Eight detector elements can be connected directly to a single Mesytec MPSD-8+ readout module using high voltage coaxial cables. The readout module contains a preamplifier and window discriminator with the gain and threshold values adjustable via computer control. Up to eight readout modules can in turn be connected to the data bus of the MCPD-8 data collector module using Lemo connections and communicates with the host computer through a single Ethernet cable. The complete PITSI detector implementation using the Mesytec system therefore requires only 7 NIM slots.
2.3.Software system
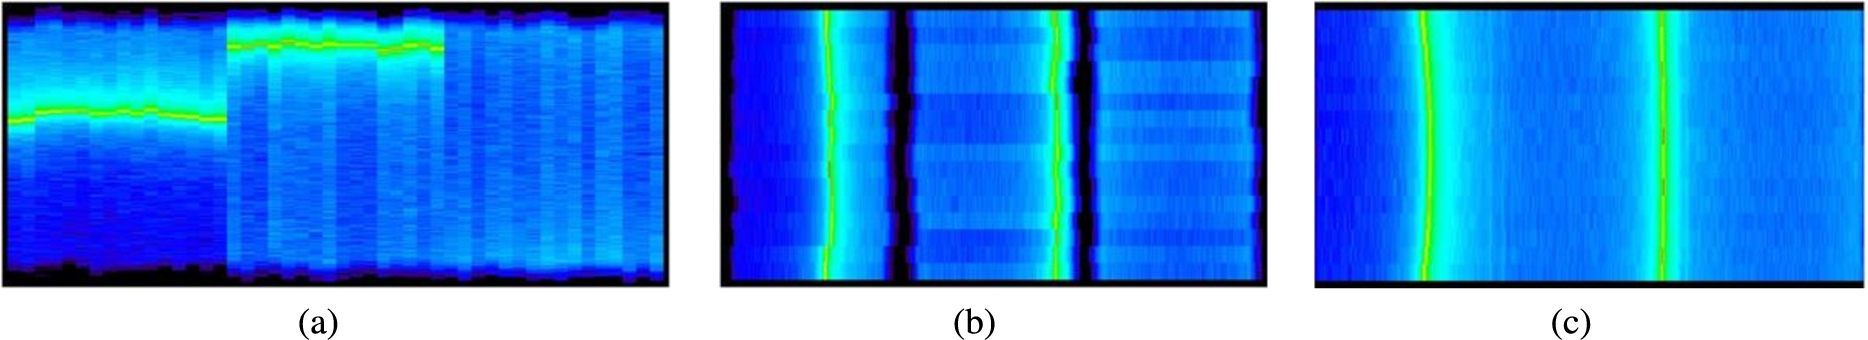
The HM receives raw event data directly from the Mesytec system via TCP/IP as
Fig. 3.
Simulated dataset of the expanded PITSI detector showing (a) raw, (b) tiled & rotated and (c) calibrated diffraction data.
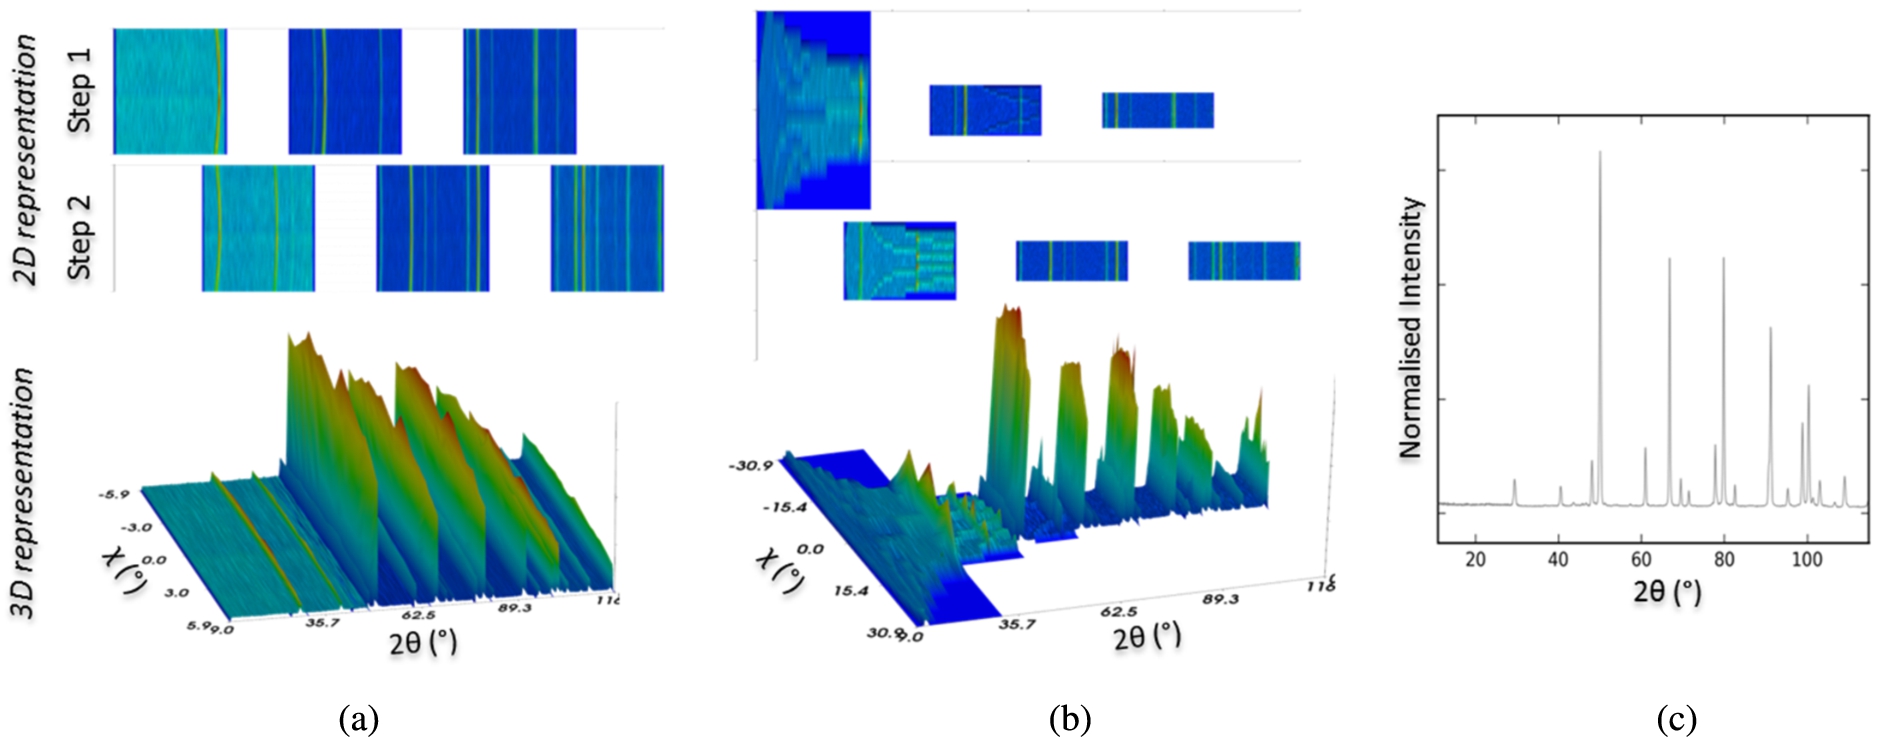
As the dataset contains information from three individual detector banks, the set must be split into three frames, each representing a different 2θ range. The complete 2θ range then contains six frames obtained from two measurement steps (Fig. 4(a)). Once separated, the frames can be processed (Fig. 4(b)) as usual with ScanManipulator to produce the final diffraction pattern (Fig. 4(c)). It is envisaged to automate the dataset sectioning in ScanManipulator.
Fig. 4.
Illustrations of the sectioned datasets: (a) before and (b) after flat field & geometric corrections have been applied; (c) Final 1D diffraction pattern of an Al2O3 powder after corrected frames has been integrated, normalised and stitched.
3.Signal optimisation
As a first upgrade step of the data acquisition system the electronics of the original bank has been replaced with the Mesytec system. The detection efficiency of measured signals was maximised through a parametric optimisation process of the pre-amplifier gain and window discriminator threshold values by sequential permutations from 0.1 to 1.2 and 10% to 80% respectively against criteria discussed in the following sections.
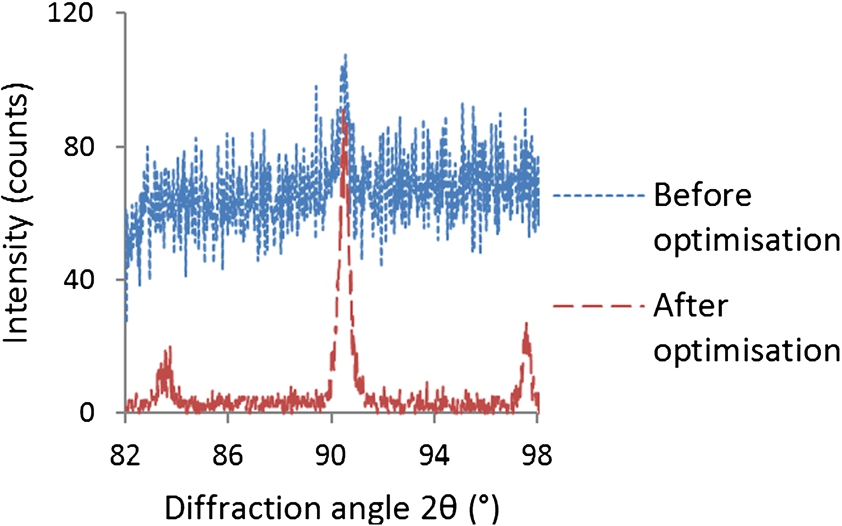
In addition to minimising the electronic noise, signal optimisation was performed by analysing a relatively strong diffraction peak from a silicon powder sample at a diffraction angle close to 90°. At this angle the peak should have a symmetric distribution. The peak was fitted with a Gaussian function using the least-squares technique to produce intensity and background values as defined in Fig. 5. Figure 6 emphasises the importance of signal optimisation by comparing a partial diffraction pattern obtained with high gain and low threshold values with a pattern obtained after optimisation.
Fig. 5.
Measured diffraction peak fitted with a Gaussian function.
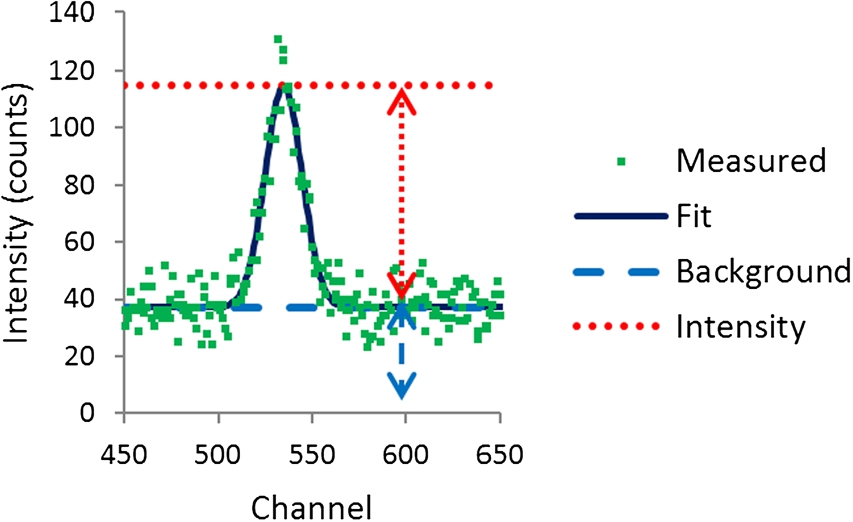
Fig. 6.
Partial diffraction pattern of silicon before and after detector electronics optimisation.
3.1.Electronic noise
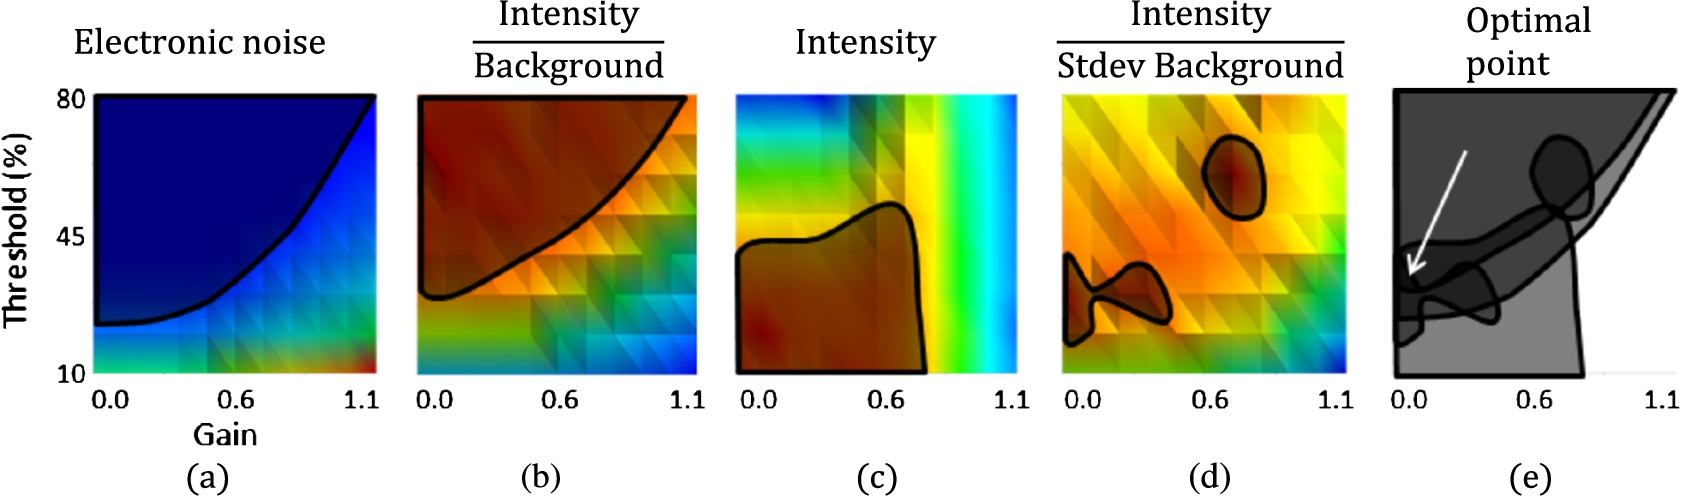
The electronic noise was defined as the total number of events registered by the detection system when the neutron beam was closed. It was assumed that background radiation levels are sufficiently low so as not to influence the measurement. Ideally, the threshold and gain values should be such that the electronic noise in the system are minimised. The optimised domain shown in Fig. 7(a) confirms that increased electronic noise is present with high gain and low threshold values.
3.2.Signal-to-noise ratio
A common measure in electronic optimisation is the signal-to-noise ratio. This was optimised (maximised) by equating the diffraction peak intensity to the required signal, and the background to the noise. The optimised domain is presented in Fig. 7(b).
3.3.Intensity
Even though the signal-to-noise ratio is a very important factor, the resulting optimisation may present a solution where both the intensity and background levels are very low, which will result in unrealistic long measurement times. To avoid this situation the domain of maximum peak intensity was identified as shown in Fig. 7(c).
3.4.Intensity vs. standard deviation of background
Overlaying the optimised domains up to this point would result in a relatively large viable domain. It was however noticed that the spread of measured background values varies drastically throughout this domain and the intensity vs. standard deviation of the background was therefore maximised as shown in Fig. 7(d).
3.5.Summary
The optimal setup parameters of the analogue electronics were identified from the convergence of the respective saddle points for each criteria under consideration in the overlaid representation shown in Fig. 7(e) as:
Fig. 7.
Illustration of various evaluation parameters with respect to pre-amplifier gain and discriminator threshold values to determine the optimal range of the detector electronic system.
4.Conclusion and future work
The detector analogue electronic acquisition system of PITSI has been successfully upgraded to a modern Ethernet based system which will simplify the expansion of the detector bank active area. All required data reduction functionalities are currently present in ScanManipulator, but minor additions are needed to automate the splitting of datasets into separate frames.
Acknowledgements
The Department of Energy of the Republic of South Africa are thanked for financial support with the Beam-line Facility Upgrade Program at the SAFARI-1 research reactor. Assistance, support and technical discussions with Mark Lesha and technology sharing by the Australian Centre for Neutron Scattering at ANSTO are greatly acknowledged.
References
[1] | |
[2] | |
[3] | H. Heer, M. Könnecke and D. Maden, The SINQ instrument control software system, Physica B 241–243: ((1998) ), 124–126. doi:10.1016/S0921-4526(97)00528-0. |
[4] | D. Marais, A.M. Venter and J. Markgraaff, Data processing at the South African Nuclear Energy Corporation SOC Ltd (Necsa) neutron diffraction facility, in: Proceedings of SAIP2015, (2016) , pp. 198–203. ISBN 978-0-620-70714-5. |
[5] | W.J. Strydom, A.M. Venter, C.B. Franklyn and F.C. de Beer, The role of Safari-1 in industry and academia, Physica Scripta T97: ((2002) ), 45. |
[6] | A.M. Venter, P.R. van Heerden, D. Marais, J.C. Raaths and Z.N. Sentsho, PITSI: The neutron powder diffractometer for transition in structure investigations at the SAFARI-1 research reactor, Physica B ((2018) ). doi:10.1016/j.physb.2017.12.017. |


