Abstract
The effects of chemical binding energy on neutron total cross section were investigated by means of elastic and inelastic neutron scattering techniques. The metal hydrides Ti0.45Cr0.45Mo0.1D1.8 and Ti0.48Cr0.32V0.2D1.8 were used for the experiment, for which the expected effects can be detected via the observed dynamics of deuterium (D). The D local mode was observed by inelastic measurement at ∼100 meV for the first-order excitation, and higher order vibrational modes up to n=4 were observed. Apart from these ordinary local vibrations, a specific energy potential ℏω0 in the system was observed by elastic measurements as a recoil effect. It is found that the wave length dependence of the incoming neutron largely affects its intensity even for a coherent cross section. The effect should be taken into account particularly for the analysis with time-of-flight technique of pulse neutron diffraction.
1.Introduction
The neutron total cross section σftot of free atoms is known to be less than that of atoms in the fully bound state σbtot, as is evident from the following relationship where A denotes the nucleus mass [16],
(1)σftot=A2(1+A)2σbtot.
The recoil of the nucleus causes an effective reduction in the neutron total cross section (CS) upon collision of neutrons with the nucleus. With respect to the difference between
σftot and
σbtot for various nucleus
A, the case of hydrogen (H) and deuterium (D) shows the maximum difference between their values of CS. This difference in the CS can provide us an opportunity to observe the local structure (atomic correlation) of particular atoms by contrasting the scattering amplitudes.
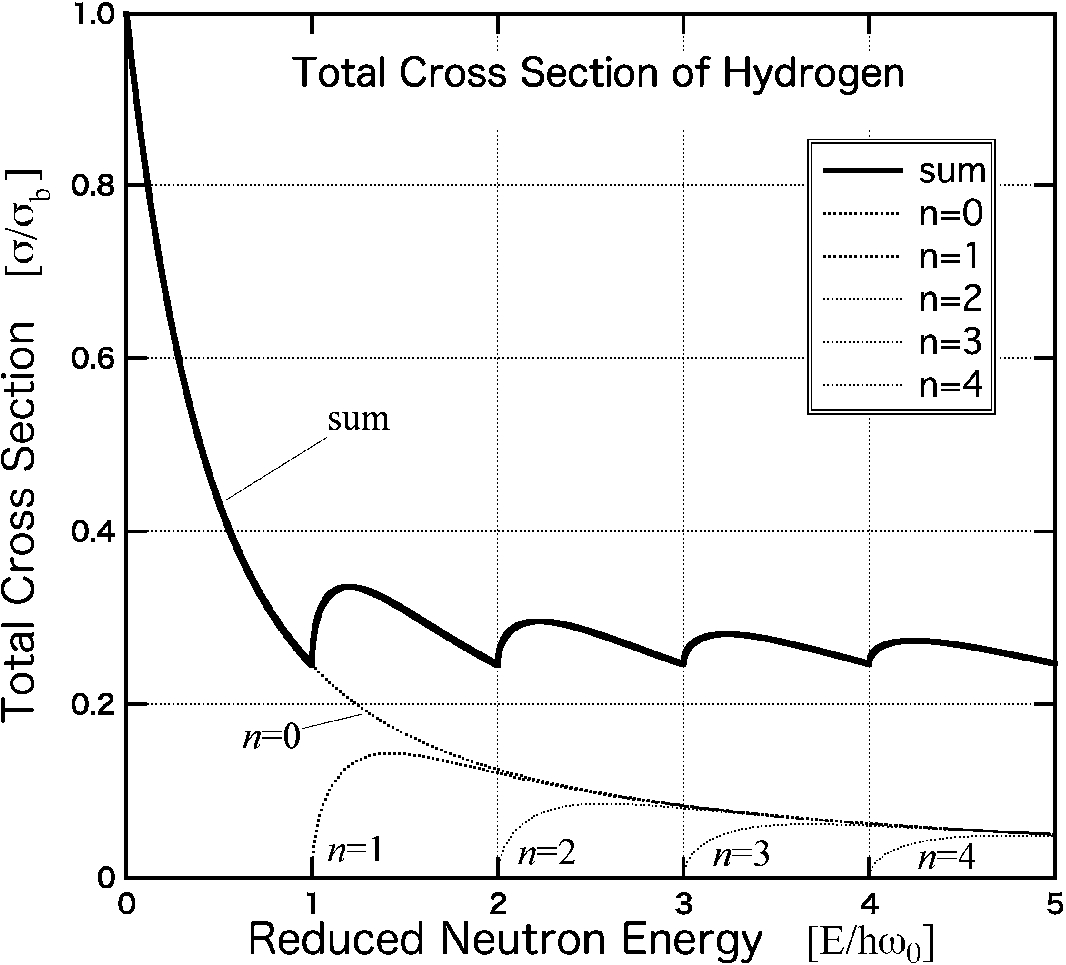
The cross section σtot also shows its neutron-energy dependence, in particular, bound atoms under chemical potentials of the system considerably affect the observed scattering intensity. The neutron-energy dependence of σtot can be written as [13],
(2)σtot=σℏω04E(Mm)∑n1n!∫x−(n)x+(n)dxxne−x,
where
(3)x±(n)=mM1ℏω0(1+γ′)2[E12±(E−nℏω0(1+γ′))12]2
with the specific binding energy of the neutrons (the potential energy in the system) being equal to
ℏω0. The terms
M and
m correspond to the masses of the scattering particles and neutrons, respectively. The parameter
γ′ is defined as
γ′=m/Mmol. The term
Mmol denotes the molecular center mass. For the case of
m=M and
γ′=0 (the case of rigid molecules), corresponding to the scattering process by a proton, the CS reduces to the result first derived by Fermi [
4]. Thus, the
σtot value of hydrogen is calculated (up to
n=4) as shown in Fig.
1. The
σtot depicted as a function of the reduced energy
ℏω0 has the unit of
σbtot. Therefore the CS of the fully bound state
σbtot (
E=0) is four times larger than
σftot at
E→∞ as indicated by Eq. (
1) for hydrogen atoms. The value of
σtot drops with increasing neutron energy originating from the recoil effect. Further, certain minima at the threshold of the potential energy levels are observed at
E=nℏω0 (
n: integer). This
oscillation of
σtot can aid in the determination of the binding energy of atoms in the system without performing any time-consuming inelastic measurements. Our first experimental attempt involved the observation of the abovementioned energy minima via elastic neutron scattering. For an isotropic potential such as that due to hydrogen’s harmonic vibration, well-defined oscillating spectra of
σtot can be observed, and such spectra have also reportedly been observed in metal hydrides [
16]. In general, the presence of an anisotropic potential and thermal motion of atoms causes smearing of the resulting signal, and therefore, we cannot expect such a clear oscillating spectrum. For single crystals, even with an anisotropic potential energy, the potential can be mapped on the momentum (
Q) and energy (
E) space by selecting the scattering direction
q as a momentum transfer. These kind of measurements normally require higher incident energy to observe its energy dependence covering enough
Q range of certain scattering angle. In this experiment, the cross sections for both the elastic and inelastic channel have been investigated.
Fig. 1.
Calculated neutron total cross section σtot of hydrogen with the chemical binding energy ℏω0. The dotted line represents the cross section values for n=0, and the narrow dotted lines correspond to those for n=1,2,3 and 4, as obtained from Eq. (2). The solid line indicates the sum of the cross section contributions exhibiting a quick drop and an oscillating behavior with neutron energy. σtot at E→∞ is extrapolated to quarter of that at E=0, which corresponds to σbtot.
2.Experimental procedure
Utilizing the advantage of the higher flux available at the epithermal energy range, the energy dependence of the elastic (dσdΩ) and inelastic (d2σdΩdE) cross sections were measured by means of the pulsed neutron technique. The materials containing D, namely, Ti0.45Cr0.45Mo0.1D1.8 (TCMD) and Ti0.48Cr0.32V0.2D1.8 (TCVD), which are both known as hydrogen storage materials were used [1,9,14,15]. The body centered cubic (bcc) structure of this system is expected to absorb a considerable quantity of hydrogen, and turns into an fcc structure as a result. Hydrogen (deuterium in this case) atoms occupy the interstitial sites forming a cubic structure by themselves. In neutron diffraction, since the sum of scattering amplitudes from metals is almost zero (null-alloy), the reflections contributed only by D atoms can be detectable as coherent peaks. In a previous study, structural analysis was performed by neutron powder diffraction, and each of the sites occupied by D atoms were determined [8].
Neutron experiments were performed at the KENS neutron facility in the High Energy Accelerator Research Organization (KEK) using the epithermal neutron diffractometer EXCED [12,17] for elastic measurements (ENS) with the following experimental condition I. Inelastic measurements (INS) were also performed using the chopper spectrometer INC [2,7] with the experimental condition II to directly survey the dynamical range of hydrogen atomic motions.
Condition I (ENS): About 3 grams each of TCMD and TCVD powder samples were sealed into a vanadium can filled with He gas. The measurement was performed at T=24,200 K, and at room temperature (∼300 K). A white neutron beam was used to detect the Bragg peaks at certain Q values with various wavelengths λ satisfying the condition, Q=4πsinθ/λ. The data from the pixels in one-dimensional position sensitive detectors (PSDs) were summed up and time-focused. This variety of λ yields an energy uncertainty that is shown in Fig. 3 as energy error bars.
Condition II (INS): TCMD powder sample of 8.2 grams was used for INS. The powder sample placed in an aluminum can was mounted in a closed-cycle refrigerator to cool the sample down to 30 K. The incident neutron energy Ei was chosen as Ei=50.6,102.9,205.7 and 519.8 meV by varying the chopper rotational phasing and frequency. We mainly employed the data obtained with Ei=50.6 and 519.8 meV for a wide energy range. For data processing, detectors in the scattering angle range of 48.6° to 109.5° were summed over with the data for Ei=519.8 meV.
3.Results and discussion
3.1.Elastic scattering measurement
The ENS measurements were performed on TCMD and TCVD powder samples using a white beam. The time-focused powder pattern for TCMD obtained at T=24 K is shown in Fig. 2. All the coherent peaks are from the correlation of D atoms because the sum of scattering amplitudes of metals is nearly zero, and thus, we can easily observe the correlation of D atoms (light atoms) in a multi-component system without any hindrance from other heavy atoms. As regards the peak observed at 4 Å−1, corresponding to the (2 2 0) reflection of the original crystal structure, 6 pixels of PSDs (60 cm of effective length) out of 128 were only bunched up as shown in the inset of Fig. 2. Since the PSDs are placed parallel to the horizontal scattering plane, each bunched segment comprising 6 pixels can change its positioning angle. Therefore, we can focus on a certain limited neutron energy contributing to the reflection of the peak. Because of an asymmetric profile, the double Gaussian fitting including the constant background well reproduces the peak shape (inset: solid line) [6]. Excluding the constant background involving the elastic incoherent part of the CS, we can take into account only the coherent part of the CS σcoh for the elastic scattering and inelastic scattering processes. Thus, the neutron-energy dependence of the integrated intensity of σcoh can be obtained. The intensity at the detectors for all the samples were normalized by the incoherent intensity data for vanadium I(λ) in order to directly compare the data obtained by different detectors at neutron energies. The Lorentz factor for a powder sample with white beam is simultaneously corrected, which is written as L−1(θ)=sin3θλ4. Therefore, we can safely compare the peak integrated intensities at various detector segments.
Fig. 2.
TCMD powder profile measured at T = 24 K. All the coherent peaks (Bragg peaks) are due to D atoms. Inset: the peak at 4 Å−1 summed over six chosen pixels that are at a certain scattering angle (open circles). The solid line indicates the fitting by two Gaussians and the constant background.
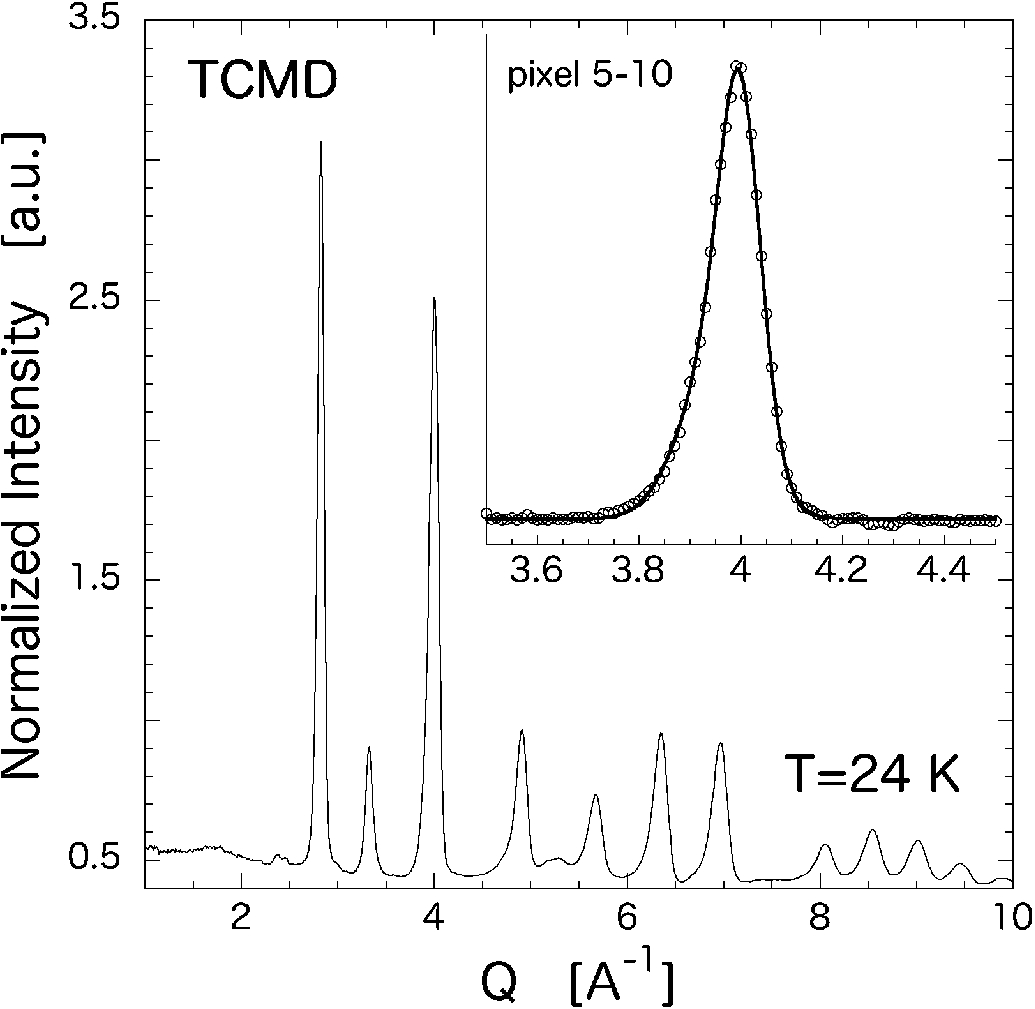
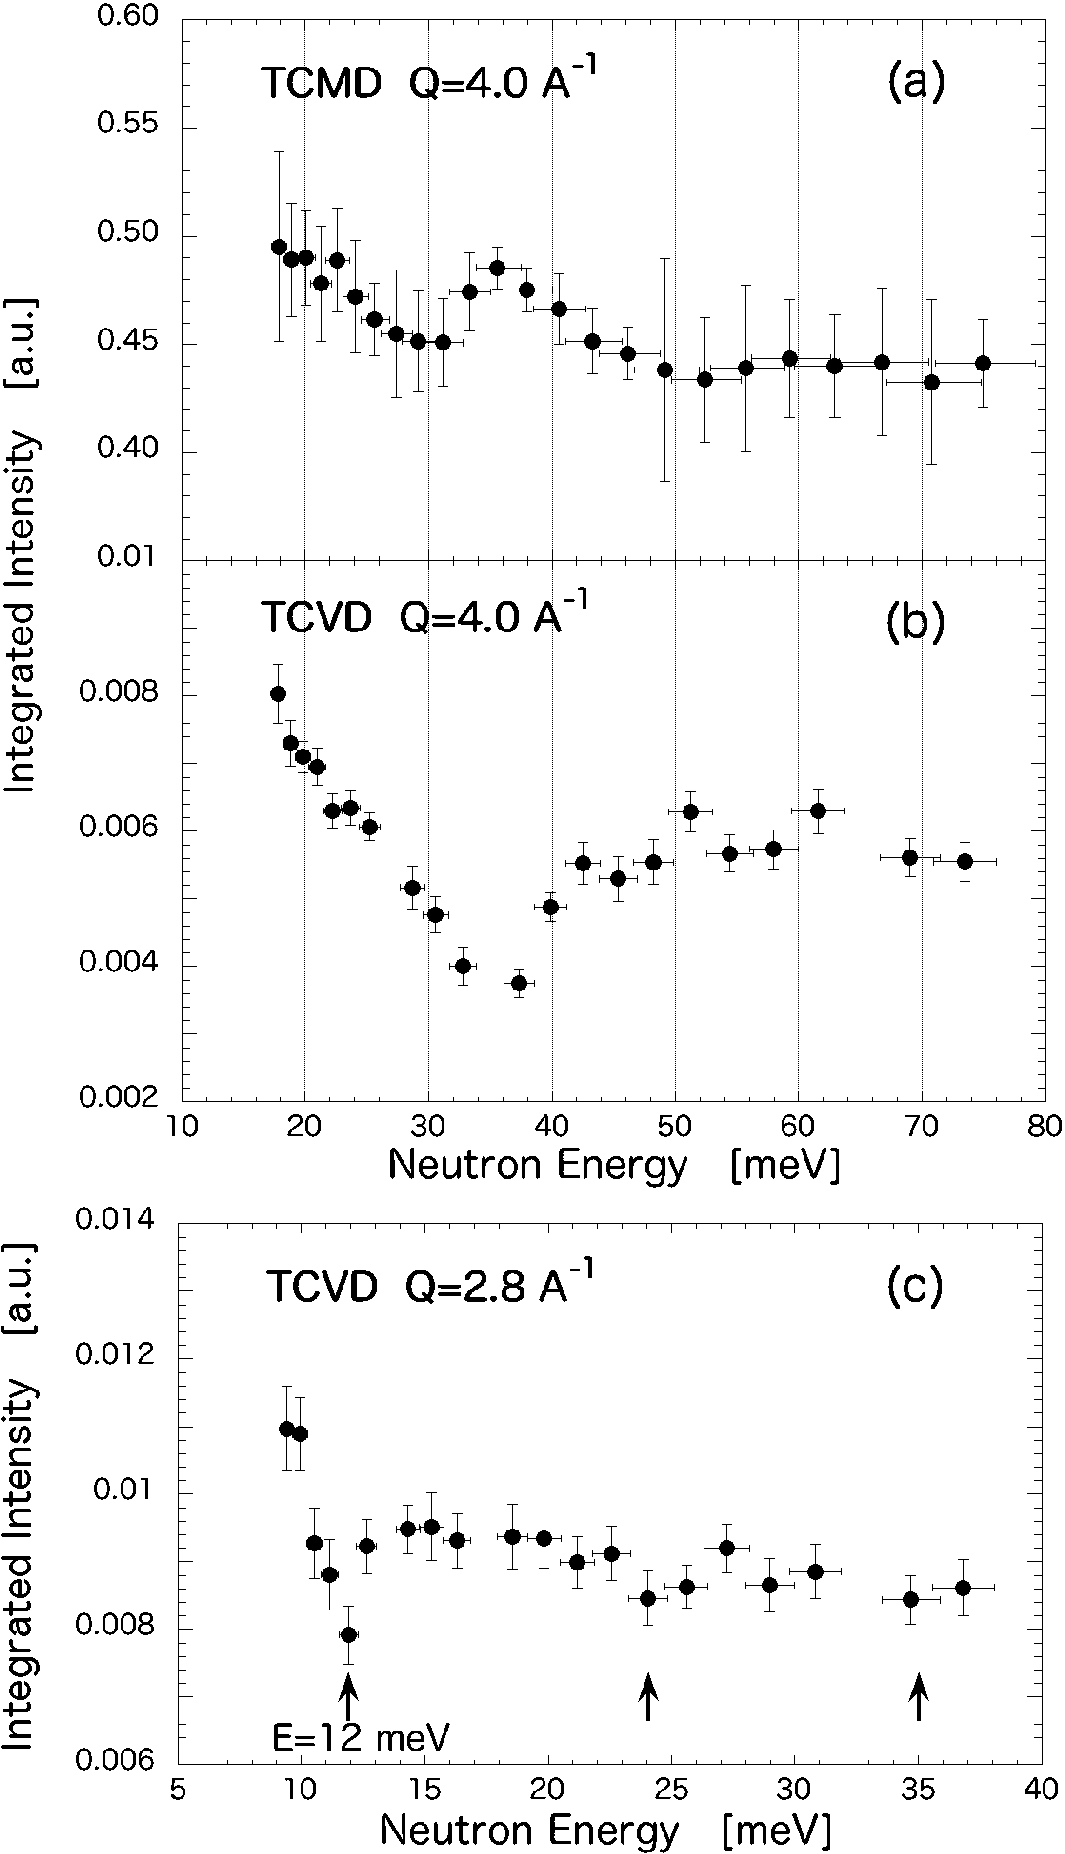
Figure 3 shows the energy dependence of the integrated peak intensity for TCMD and TCVD. The reflection at Q=2.8 Å−1 for TCVD was also analyzed using the abovementioned approach. All the peaks exhibit a dip–hump structure and oscillating behavior over increasing neutron energy. For TCMD (Fig. 3(a)), the first dip (n=1) is observed at ℏω0=30 meV and the second dip is observed around ℏω0=52 meV, and subsequently no further higher-order contributions can be seen. For TCVD (Fig. 3(b)), because the detector array could not cover a sufficient energy range for n⩾2 at Q=4 Å−1, only the first dip was observed at 35 meV and the indication of a second dip was observed around 80 meV. In Fig. 3(c), oscillating behavior up to n=3 was observed for the Q=2.8 Å−1 peak. The plotted energy error is evaluated from the neutron energy distribution of the six bunched detector pixels contributing to the reflection of the peak. The peak at Q=2.8 Å−1 of TCMD has been also analyzed in the same manner, showing similar dip–hump tendencies (not shown here). Even though the clue of dips at 15 and 25 meV has been indicated by the analysis, the fitting errors are too large to precisely interpret the dip energy.
Fig. 3.
Obtained neutron-energy dependence of the integrated peak intensity σtot for (a) TCMD Q=4 Å−1; (b) TCVD Q=4 Å−1; and (c) TCVD Q=2.8 Å−1.
3.2.Inelastic scattering measurement
The INS spectrum for TCMD at the incident neutron energy of Ei=519.8 meV at T=30 K is shown in Fig. 4. The Q-integrated energy spectrum shows the periodic excitations in addition to the incoherent scattering at E=0 (solid curve). These broad in energy and having no dispersion peaks are from hydrogen (D) local modes. The dynamical motion of hydrogen in most metal hydrides can be roughly described in the energy range of 70–150 meV energy as local vibrational modes [3,11,16]. The first excitation energy observed in TCMD (108 meV) is within this energy region. From the fitting of this oscillating feature, the excitation energies are centered at 107.8, 215.0, 322.8 and 407.9 meV for n=1,2,3 and 4, respectively (n represents the nth excitation). Thus, the dynamics at high energy are dominated by the vibration of hydrogen (D) atoms as a incoherent inelastic scattering process. Further, the observed dynamics are completely different from that observed in ENS experiments.
Fig. 4.
Inelastic scattering spectrum of TCMD measured at T=30 K and Ei=500 meV. Periodic excitations (indicated by arrows) in addition to the incoherent peak at E=0 (solid line) are originated as local vibrational modes of deuterium ions.
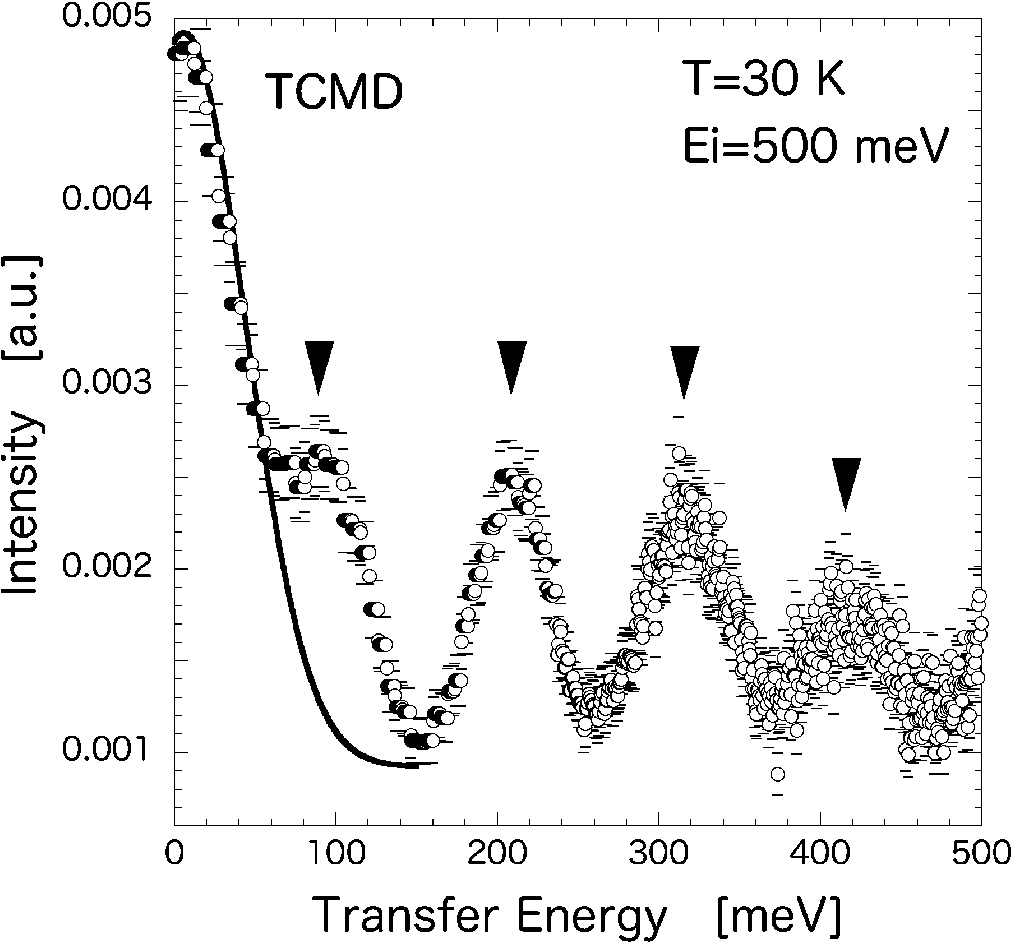
Fig. 5.
Inelastic scattering spectrum of TCMD measured at T=30 K and Ei=50.6 meV. Two features indicated arrows A and B are presented.
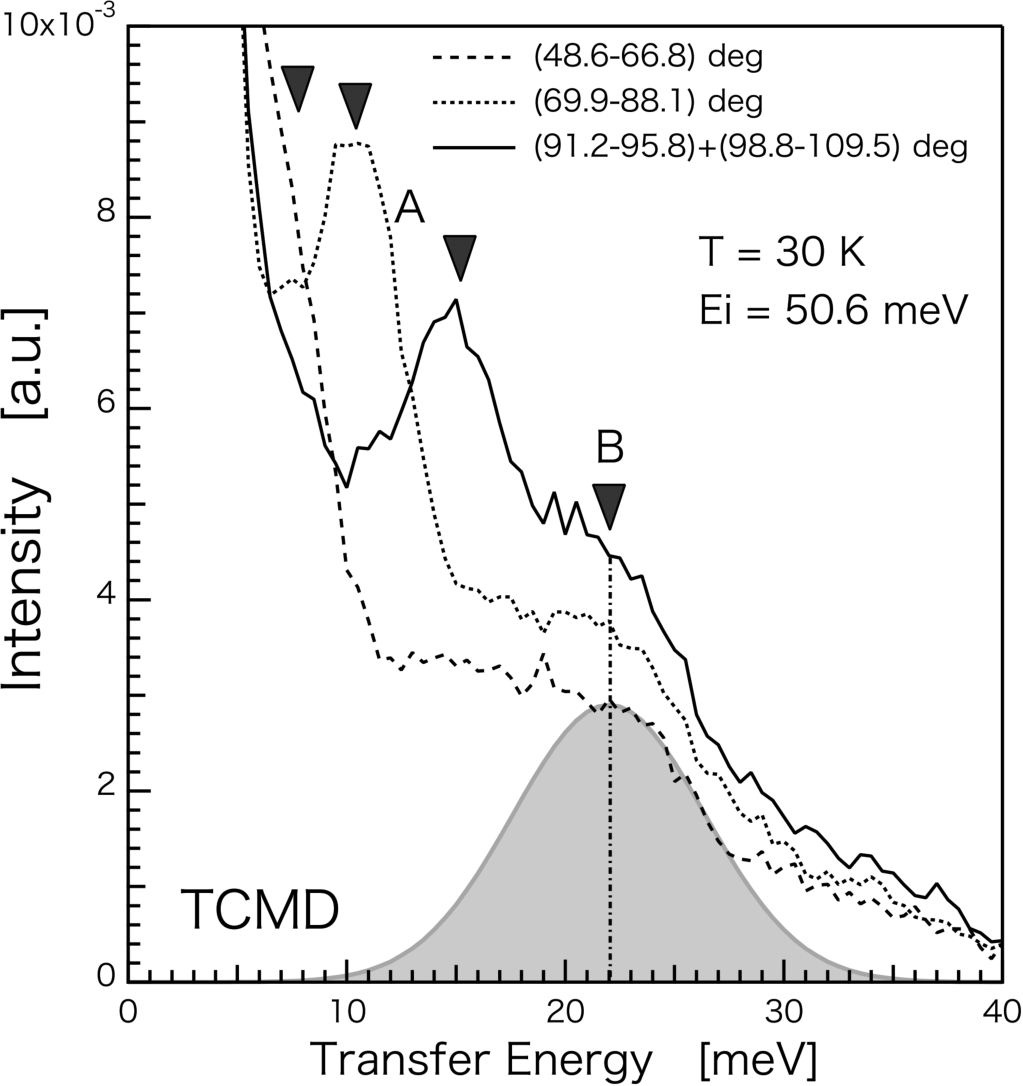
On the other hand, the Ei=50.6 meV measurement shows the different aspects in inelastic spectrum. One shows dispersive behavior indicated by “A” in Fig. 5. The peak A is turned out to be a background noise. The other (arrow “B”) shows broad and non-dispersive feature, centered at E∼22 meV. It is unclear whether the peak at 22 meV observed in the inelastic measurement is directly related to the elastic dip–hump structures. Inelastic signals viewed by INS are |Q| integrated, which means the peak energy is average value containing all over the Q direction. In the case of ENS, since we only take into account the scattering cross section from a certain reflection by atoms, particular direction of Q mostly contribute to the oscillating behavior of diffracted intensity. This different way in data treatment possibly causes the different energy value in obtained spectra. In this experiment, the most significant point is that the CS dσcohdΩ is observed in ENS measurement in principle although the CS dσcohdΩdE is observed in INS measurement. It should be also noted that former experiments of the same type of metal hydrides experiments discuss with total cross section σtot.
3.3.Cross section and chemical binding energy
The excitations of the D local modes are observed at 100 meV with a 100 meV energy separation in the INS measurements. These modes are attributed to D harmonic vibrations of atoms (ions). On the other hand, the ENS experiment suggests that the energy observed as a dip in the energy dependence of σtot is at ℏω0=30 meV for TCMD (ℏω0=12 and 35 meV for TCVD). These specific energy values can be considered as the potential energy of the absorbed hydrogen atoms. There are several (anisotropic) chemical potentials in the system, and therefore, the higher order excitations (n⩾3) is smeared out. However, the primary energy level can still affect the value of σtot.
As regards the components of σtot, it is consists of the elastic and inelastic scattering process of both coherent σcoh and incoherent σinc CS (dσtotdΩ=dσcohdΩ+dσincdΩ); the absorption cross section σa is omitted here. As mentioned previously since the constant background level is subtracted from the peak profile, the incoherent part is already subtracted in the data shown in Fig. 3. However, the subtracted data may still include a finite incoherent part due to imperfect data treatment. Nevertheless, this error is supposedly constant only for the neutron energy dependence. Furthermore elastic coherent scattering, namely, Bragg reflection shows no such energy dependence. Thus, only the inelastic scattering process can contribute to the neutron energy dependence of the CS. There still remains the possibility of the contribution of coherent inelastic scattering such as phonon excitation, though the observed periodic dip indicates the lack of phonon contribution, since the Q-dependence is considerably different from the phonon Q-dependence. Furthermore, the intensity of dσcohdΩdE term as phonon expected to be much smaller compared to elastic cross section in general. Thus, we conclude that these specific energy dips in the neutron intensity originate due to the chemical binding energy at D atomic sites or the local hopping of D atoms.
This implies that two types of excitation processes coexist in single system, namely the phonon collective modes and D local hopping modes. A paradox of this kind was reported in the case in magnetic excitations of diluted Ising magnets [5], where both the excitation of Ising clusters and short range two or three spin clusters are observed at each energy level. In hydrogen storage material (proton containing material), since the hydrogens are bound at crystallographic equilibrium positions, there is local potential well with the binding energy in addition to the hydrogen vibrational modes. From pressure composition isotherm measurements, the D desorption temperature is roughly estimated to be 100°C for TCMD under a D partial pressure of p∼0.1 MPa, whereas it is about 200°C for TCVD. This implies that in TCVD the chemical binding energy for D is larger than that in TCMD. Assuming that the desorption temperature is proportional to the chemical binding energy, the difference in the dip energy observed for TCMD and TCVD can be explained. The energy equivalent of the desorption temperature is obtained as 32 and 40.8 meV for TCMD and TCVD, respectively; these are in good agreement with the observed dip energy.
In the TCVD Q=2.8 Å−1 measurement, a considerably smaller dip energy has been observed (Fig. 3(c)). The second and possibly the third dips appear fairly periodic, implying well monotonic energy levels. The different momentum transfer Q sees the different direction in a reciprocal space. The reflection at Q=2.8 Å−1 is ascribed to the (2 0 0) Miller index despite the fact that the peak at Q=4.0 Å−1 is from the (2 2 0) reflection. The direction of the potential energy in the reciprocal space is different. This also suggests that the potential is anisotropic. Importantly, the results of the elastic experiments suggest that the intensity of the coherent peak, even at small neutron energy of few tens of meV, is easily affected by recoil effects, particularly for light atoms. This can cause a serious problem in crystal structure analysis for instance. Even for the coherent term of elastic scattering (dσcohdΩ) the recoil effects should seriously been taken into account for structural evaluation. Usually, thermal fluctuation (Debye–Waller factor), Lorentz factor, absorption effects and other external effects are analytically corrected. Therefore, almost all these effects are put into the corrections. However, the neutron wave length (λi) dependence of the recoil effect is totally deferent from these external effects. In particular, crystal structure analysis of pulse neutron uses time focused spectra with some band width of incoming λi. Therefore, the λi dependence is inevitably involved in the process of structural analysis. Theoretical evaluation of the reduction of neutron cross section as Compton scattering is reported by Karlsson [10]. According to the evaluation, the magnitudes and momentum dependences of CS “anomalies” are quantitatively predicted. The anomalies of the CS is strongly related to the neutron recoil effects.
4.Conclusion
The effects of the chemical binding energy on the neutron cross section were investigated by means of both elastic and inelastic neutron scattering techniques. The hydrogen-storing materials of Ti0.45Cr0.45Mo0.1D1.8 (TCMD) and Ti0.48Cr0.32V0.2D1.8 (TCVD) were chosen in order to observe the recoil effects of light atoms in the potential. In the case of inelastic measurements the observed excitations are due to the hydrogen local mode (incoherent inelastic scattering process) at around 100 meV with a 100 meV step. In contrast, in elastic measurements a dip–hump structure was observed in the integrated intensity with respect to the incident neutron energy. These energy dips appear structurally completely different from those observed in INS measurements. In this study, we clearly observe the finite change of the integrated intensity of the coherent peaks as a recoil effect of cross section. This potentially affects the structural analysis.
Acknowledgements
One of the authors TY is partly supported by a Grant-in-Aid for Scientific Research of MEXT (Scientific Research (C) No. 26400376 and Scientific Research (B) No. 25287081). TY and SI are supported by a Grant-in-Aid for Scientific Research of MEXT (Scientific Research (C) No. 24540352).
References
[1] | E. Akiba and H. Iba, Intermetallics 6: ((1998) ), 461. |
[2] | M. Arai, M. Kohgi, M. Itoh, H. Iwasa, N. Watanabe, S. Ikeda and Y. Endoh, KENS Report-VII, 1988, p. 9. |
[3] | J. Boronat, C. Cazorla, D. Colognesi and M. Zoppi, Phys. Rev. B 69: ((2004) ), 174302. |
[4] | E. Fermi, Riceraca Sci. 2: ((1936) ), 13. |
[5] | H. Ikeda and K. Ohoyama, Phys. Rev. B 45: ((1992) ), 7484. |
[6] | S. Ikeda, M. Furusaka, T. Fukunaga and A.D. Taylor, J. Phys.: Condens. Matter 2: ((1990) ), 4675. |
[7] | S. Itoh, M. Arai and M. Kawai, Appl. Phys. A 74: ((2002) ), S198. |
[8] | K. Iwase, T. Kamiyama, Y. Nakamura, K. Mori, M. Yonemura, S. Harjo, T. Ishigaki and E. Akiba, Materials Transactions 47: ((2006) ), 271. |
[9] | T. Kabutomori, H. Takeda, Y. Wakisaka and K. Ohnishi, J. Alloys Compd. 231: ((1995) ), 528. |
[10] | E.B. Karlsson, Phys. Scr. 77: ((2008) ), 065301. |
[11] | R. Khoda-Bakhsh and D.K. Ross, J. Phys. F: Met. Phys. 12: ((1982) ), 15. |
[12] | K. Kuwahara, S. Sugiyama, K. Iwasa, M. Kohgi, M. Nakamura, Y. Inamura, M. Arai and S. Kunii, Appl. Phys. A 74: ((2002) ), S302. |
[13] | S.W. Lovesey, Theory of Neutron Scattering from Condensed Matter, Oxford Science Publications. |
[14] | M. Okada, T. Chou, A. Kamegawa, T. Tamura, H. Takamura, A. Matsukawa and S. Yamashita, J. Alloys Compd. 356: –357: ((2003) ), 480. |
[15] | T. Tamura, T. Kazumi, A. Kamegawa, H. Takamura and M. Okada, J. Alloys Compd. 356: –357: ((2003) ), 505. |
[16] | W.L. Whittemore and A.W. McRevnolds, Phys. Rev. 113: ((1959) ), 806. |
[17] | T. Yokoo, M. Arai, K. Kuwahara, M. Nakamura, Y. Inamura, S. Sugiyama, R. Yamamoto and M. Kohgi, Neutron News 15: ((2004) ), 18. |


