
Longitudinal Changes in Neuropsychological Functioning in Japanese Patients with Myotonic Dystrophy Type 1: A Five Year Follow-Up Study
Abstract
Background:
Myotonic dystrophy type 1 (DM1) is a form of muscular dystrophy that causes various symptoms, including those of the central nervous system. Some studies have reported cognitive decline in patients with DM1, although the available evidence is limited.
Objective:
This study aimed to describe longitudinal differences in neuropsychological function in patients with DM1.
Methods:
A total of 66 Japanese adult patients with DM1 were investigated using a neuropsychological battery to assess several cognitive domains, including memory, processing speed, and executive function. The patients underwent neuropsychological evaluation approximately five years after baseline (Times 1 and 2).
Results:
Thirty-eight patients underwent a second neuropsychological evaluation. The participants in the Time 2 evaluation were younger than those who did not participate in Time 2. Patients showed a decline in the Mini-Mental State Examination, Trail Making Test (TMT), Block Design, and Symbol Digit Modalities Test at Time 2 (P < 0.05). Age at Time 1 was associated with a decline in TMT-A and TMT-B scores (rho = 0.57 and 0.45, respectively).
Conclusion:
These results suggest a cognitive decline in patients with DM1 and warrant further investigation into the possible effects of age-related changes.
INTRODUCTION
Myotonic dystrophy type 1 (DM1) is a muscular dystrophy that presents with various symptoms such as progressive muscular weakness, fatigue, myotonia, and alterations to the central nervous system (CNS). Previous brain imaging studies of DM1 have demonstrated white matter abnormalities, global and regional cortical volume loss, and reduced fractional anisotropy [1–3]. There are only few longitudinal brain imaging studies in DM1. A recent study found reduced cortical and subcortical structures and increased white matter lesions, indicating the neurodegenerative nature of the disease [4]. Contrastingly, other studies suggested that the neurodegenerative process was marginal [5, 6]. Although the specific pathological mechanisms underlying CNS involvement are not well established, accumulating studies have shown cognitive impairment in patients with DM1 [7–9]. A meta-analysis examined cognitive impairment in patients with DM1 compared with a healthy population and suggested that cognitive dysfunction is involved across different domains, such as global cognition, memory, and visuospatial ability [7]. While impairment was widespread in cognitive domains and presented some consistent patterns, there was high heterogeneity in performance and impairment [10]. Although cognitive impairment in patients with DM1 has been established in cross-sectional studies, the longitudinal trajectories of cognitive function have not been well investigated. Therefore, longitudinal studies on cognitive functioning in patients with DM1 are critical for a better understanding of their trajectories.
Several studies have investigated the longitudinal changes in cognitive performance in patients with DM1. One of the earliest studies did not find a longitudinal decline in neuropsychological performance in 16 patients with a mean follow-up period of 12 years from baseline assessment [11]. Conversely, other studies have suggested that cognitive impairment in DM1 may worsen over time in particular neuropsychological tests, such as the Trail Making Test-B (TMT-B) and the verbal fluency test [12, 13]. A recent large study (n = 115) reported that patients with DM1 showed longitudinal declines in the domains of verbal memory, attention, and psychomotor speed, nine years after the initial assessment [14]. Other studies have compared the changes in neuropsychological test performance between patients with DM1 and healthy individuals. For example, two recent studies showed that the Block Design Test of the Wechsler Adult Intelligence Scale (WAIS) and the Rey-Osterrieth Complex Figure test declined over time compared with healthy individuals 11 years or five years after baseline assessment [5, 15]. They suggested that the worsening of cognitive functioning was greater than that in age-matched healthy individuals; however, the neuropsychological tests that detected decline or worse performance were inconsistent between the studies.
A few studies have examined the factors associated with cognitive changes in patients with DM1. For example, Gallais et al. suggested that age and disease duration are associated with a decline in most neuropsychological tests [14]. Another study found that age at first assessment is associated with declines in a test assessing visuo-constructive ability (Block Design test), implying that the decline in ability in DM1 starts early and remains stable [15]. Other studies indicated that the heterogeneity of the trajectories may be associated with the classification of the disease based on the age at onset [6, 14, 16]. Although previous studies have examined longitudinal cognitive changes in DM1, the declines over time in this population remain unclear. Since cognitive function is associated with a patient’s participation, independence, and quality of life [17–20], identifying the longitudinal course of cognitive impairment may contribute to plans for support and interventions [21]. Therefore, further evidence of longitudinal changes in cognitive functioning in patients with DM1 is essential to improve our understanding of cognition in DM1.
This study aimed to describe longitudinal differences in neuropsychological function in patients with DM1. We compared the neuropsychological functioning of Japanese patients with DM1 at Time 1 (baseline) and Time 2 (5-year follow-up). Additionally, because previous studies suggested different trajectories in cognitive function and neurodegenerative process depending on their age of onset [6, 14, 16], we explored longitudinal changes in neuropsychological functioning between the groups.
MATERIALS AND METHODS
Participants
Patients were recruited from five hospitals: the National Hospital Organization (NHO) Osaka Toneyama Medical Center, the NHO Okinawa National Hospital, the NHO Akita National Hospital, the Yokohama Rosai Hospital, and the Osaka University Hospital. Based on the age at onset, we classified patients using criteria from a recent Outcome Measures for Myotonic Dystrophy group (OMMYD-4) as follows: clinical onset at 1–18 years as the pediatric form, 18–40 years as the adult form, and > 40 years as the late-onset form. The CTG repeat lengths of patients, as measured by several commercial laboratories, were obtained from the hospital’s electronic medical records. A baseline assessment was conducted on 66 patients, most of whom had previously participated in a cross-sectional study [17]. The patients were reevaluated approximately five years after the baseline assessment (mean = 5.4 years, SD = 0.5).
Written informed consent was obtained from all participants. The procedures in this study complied with the ethical standards of the relevant national institutional committees on human experimentation, the Declaration of Helsinki of the World Medical Association, and later amendments.
Assessment of cognitive function
We assessed general cognitive function using the Mini-Mental State Examination (MMSE); visuo-constructive ability using the Block Design test of the WAIS-III; psychomotor speed using the TMT-A and TMT-B, and the Symbol Digit Modalities Test (SDMT); attention using the Digit Span Test (forward and backward); and executive function using the Wisconsin Card Sorting Test (WCST). The battery was selected from the neuropsychological test battery used in our cross-sectional study to reduce the burden on patients [17]. We selected the measures recommended by the OMMYD-2 (Block Design and TMT) [22], the measures associated with clinically important factors (quality of life [QoL] or disease unawareness; Digit Span Test and WCST) [17, 23], or measures that have been used in various neurological disorders (MMSE and SDMT) [7, 24].
Psychological measures
We also evaluated apathy, excessive daytime sleepiness, fatigue, and QoL using the Apathy Scale [25], the Epworth Sleepiness Scale [26], Multidimensional Fatigue Inventory [27], and the Individualized QoL questionnaire (INQoL) [28, 29], respectively.
Statistical analyses
We first evaluated the differences between patients who participated in the Time 2 assessment and those who did not by performing an independent t-test. The primary aim of this study was to examine longitudinal changes in neuropsychological performance between Times 1 and 2. Since we cannot assume that cognitive changes are normally distributed in DM1, the Wilcoxon signed-rank test was performed to test for longitudinal changes in patients. Additionally, we exploratory compared the differences in cognitive measures between pediatric and adult-onset patient groups. Wilcoxon rank sum test was used to compare the group differences. The median of the delta score (Time 2 – Time 1) and corresponding 95% confidence interval (CI) were calculated using bootstrapping with 10,000 replicates. Standardized mean difference (SMD) was calculated to evaluate the longitudinal difference calculated by the following formula:
As an exploratory analysis, we examined the association between cognitive function at Time 1 and death and clinical deterioration at Time 2 using logistic regression models. Based on the small number of events and patients (n = 20 and 66, respectively), we calculated the estimates of the individual cognitive variables, with sex and age at Time 1 in the models as covariates.
Statistical analyses were performed using the R 4.0.4 statistical software (R Core Team, Vienna, Austria). The significance level was set at a two-tailed P < 0.05.
RESULTS
A total of 66 patients with DM1 participated in this study. At Time 2, 16 patients were deceased, four were not evaluated because of clinical deterioration, five lost contact, and three declined/withdrew participation (Fig. 1). Finally, 38 patients (including 12 pediatric form, 20 adult form, and five late-onset) participated in the Time 2 assessment (Table 1). We compared patients who completed the Time 2 assessment with those who did not participate in Time 2. The results showed that the participants were younger and had better neuropsychological test scores at Time 1 (Table 1), suggesting that participants who completed the neuropsychological assessment at Time 2 may be biased toward younger patients and have better performance.
Fig. 1
Flow of this study.
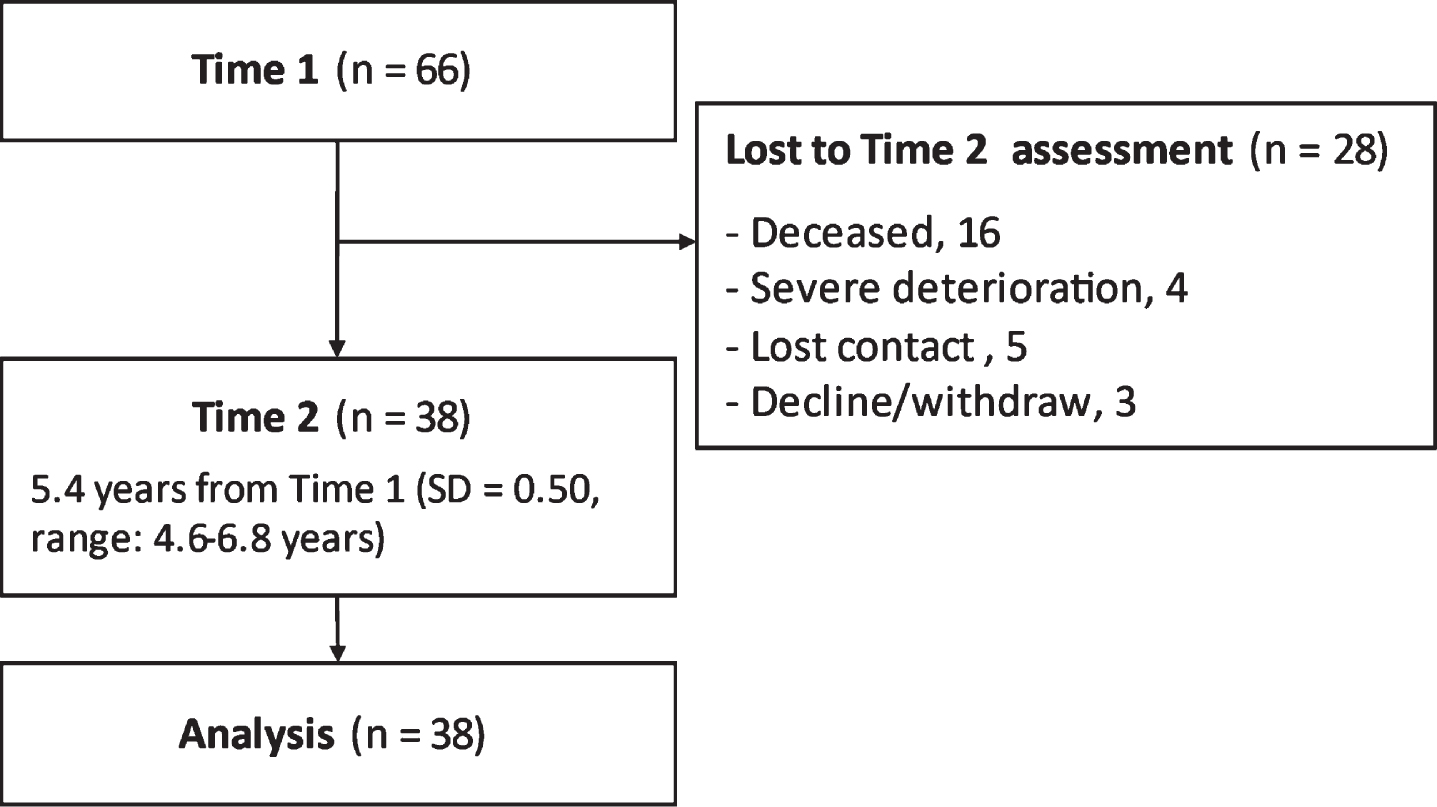
Table 1
Participant characteristics
| Patients participated | Patients not participated | Statistics | P-value | |||
| Sex (male/female), n | 38 (21/17) | 28 (19/9) | χ2 = 0.61 | 0.435 | ||
| Type of the disease, n | χ2 = 3.01 | 0.222 | ||||
| Pediatric onset | 12 | 4 | ||||
| Adult onset | 20 | 18 | ||||
| Late onset | 5 | 6 | ||||
| NA | 1 | 0 | ||||
| n | Median (IQR) | n | Median (IQR) | Z | P-value | |
| Age at Time 1 | 38 | 42.5 (37, 51) | 28 | 52 (47, 58) | 3.12 | 0.002 |
| Education years | 38 | 12 (12, 13) | 25 | 12 (12, 14) | 0.09 | 0.934 |
| Onset age | 37 | 25 (16, 35) | 28 | 28 (20, 36) | 0.90 | 0.375 |
| Disease duration at Time 1 | 37 | 19 (3, 26) | 28 | 23.5 (14, 30) | 2.04 | 0.041 |
| CTG repeat length | 35 | 800 (393, 1163) | 26 | 825 (600, 1425) | 0.90 | 0.374 |
| MMSE | 38 | 28.5 (26, 30) | 28 | 25.5 (23, 28) | – 2.18 | 0.029 |
| TMT-A | 38 | 117 (96, 146) | 24 | 170.5 (137, 310) | 2.88 | 0.003 |
| TMT-B | 36 | 137 (101, 183) | 20 | 253 (127, 388) | 2.38 | 0.017 |
| Block design | 36 | 28 (20, 34) | 27 | 18 (11, 29) | – 2.60 | 0.009 |
| Digit span: forward | 33 | 6 (5, 7) | 23 | 5 (4, 7) | – 0.76 | 0.452 |
| Digit Span: backward | 33 | 4 (3, 5) | 23 | 4 (3, 5) | 0.10 | 0.922 |
| SDMT | 33 | 42 (35, 47) | 23 | 26 (20, 36) | – 2.73 | 0.006 |
| WCST CA | 34 | 3.5 (2, 5) | 22 | 1 (0, 3) | – 2.99 | 0.002 |
| WCST TE | 34 | 15 (13, 28) | 22 | 22.5 (20, 29) | 1.66 | 0.099 |
| MFI: fatigue | 36 | 64 (54, 72) | 27 | 59 (55, 72) | – 0.15 | 0.882 |
| ESS: daytime sleepiness | 38 | 8 (5,10) | 25 | 4 (3, 7) | – 2.47 | 0.013 |
| Apathy scale | 38 | 19 (15, 22) | 27 | 19 (15, 25) | 0.82 | 0.417 |
| INQoL QoL score | 24 | 50 (34, 67) | 11 | 59.4 (31, 75) | 0.52 | 0.618 |
IQR: Interquartile range (Q1, Q3); MMSE: Mini-mental State Examination; TMT: Trail Making Test; SDMT: Symbol digit modalities test; WCST: Wisconsin Card Sorting Test; CA: categories achieved; TE: total errors; MFI: Multidimensional Fatigue Inventory; ESS: Epworth Sleepiness scale; INQoL: Individualized Quality of Life; NA: Not available. Bold font shows significance in statistical tests (p < 0.05).
Table 2 summarizes the comparisons between Time 1 and Time 2 among patients (n = 38). Wilcoxon signed-rank tests showed that MMSE, TMT-B, Block Design, and SDMT scores significantly declined five years after the baseline (Table 2). Although the bootstrapping 95% CI of TMT-A and INQoL did not include 0, the Wilcoxon signed-rank test did not reach a significant threshold (P = 0.067 and 0.070, respectively). Other measures did not reveal significant changes (Table 2, Supplemental Figures 1 and 2). Additionally, we explored the difference in longitudinal changes between pediatric and adult onset groups. The late-onset group was not included in the statistical comparisons because the number of patients was limited (n = 5). There was a significant group difference in changes in WCST total error (TE) score (P = 0.044). Although several indices showed moderate SMD, the differences were not significant owing to the small sample size of the subgroups (Supplemental Tables 1–3).
Table 2
Longitudinal changes after 5.5 years
| N | Time 1 | Time 2 | Difference | Wilcoxon signed-rank test | SMD | |||
| Median (IQR) | Median (IQR) | Median (95% CI) | Z | P-value | ||||
| MMSE | 38 | 28.5 (26, 30) | 27 (24, 30) | 0 (– 1.95, – 0.08) | 2.04 | 0.042 | – 0.34 | |
| TMT-A | 36 | 116 (96, 144) | 128 (90, 182) | 13 (8.6, 58.0) | – 1.83 | 0.067 | 0.41 | |
| TMT-B | 32 | 134 (100, 180) | 146 (98, 213) | 18.5 (4.9, 46.7) | – 2.02 | 0.044 | 0.40 | |
| Block design | 35 | 28 (20, 33.5) | 24 (16, 34) | – 4 (– 3.9, – 0.6) | 2.53 | 0.011 | – 0.47 | |
| Block design (scaled) | 35 | 4 (3, 5.5) | 4 (3, 6) | 0 (– 0.3, 0.7) | – 0.84 | 0.403 | 0.15 | |
| Digit span: forward | 33 | 6 (5, 7) | 5 (5, 6) | 0 (– 0.6, 0.2) | 0.90 | 0.366 | – 0.14 | |
| Digit span: backward | 33 | 4 (3, 5) | 4 (4, 5) | 0 (– 0.2, 0.6) | – 1.09 | 0.277 | 0.16 | |
| SDMT | 31 | 44 (35, 47) | 39 (25, 44) | – 4 (– 7.6, – 3.4) | 3.86 | <0.001 | – 0.88 | |
| WCST CA | 33 | 4 (2, 5) | 4 (1, 5) | 0 (– 0.9, 0.7) | 0.67 | 0.504 | – 0.06 | |
| WCST TE | 33 | 15 (13, 28) | 18 (11, 26) | 1 (– 2.9, 3.7) | – 0.07 | 0.943 | 0.04 | |
| MFI: fatigue | 36 | 64 (54, 72) | 63.5 (59, 73) | 1.5 (– 1.6, 4.6) | – 0.60 | 0.549 | 0.14 | |
| ESS: daytime sleepiness | 38 | 8 (5, 10) | 10 (6, 12) | 0.5 (– 0.2, 2.4) | – 1.62 | 0.105 | 0.27 | |
| Apathy | 38 | 19 (15, 22) | 20 (13, 22) | 1 (– 1.0, 2.2) | – 0.94 | 0.345 | 0.12 | |
| INQoL: QoL score | 24 | 50 (34, 67) | 58 (43, 72) | 5.9 (0.8, 15.0) | 1.81 | 0.070 | 0.42 | |
The data is based on patients who completed assessments at Time 1 and 2. IQR: Interquartile range (Q1, Q3); CI: confidence interval; SMD: standardized mean difference; MMSE: Mini-mental State Examination; TMT: Trail Making Test; SDMT: Symbol digit modalities test; WCST: Wisconsin Card Sorting Test; CA: categories achieved; TE: total errors; MFI: Multidimensional Fatigue Inventory; ESS: Epworth Sleepiness scale; INQoL: Individualized Quality of Life. Bold font shows significance in statistical tests (P < 0.05).
Over 80% of the patients performed one SD or two SDs below the general population in the Block Design and SDMT (Table 3). Of the participants, 6–64% performed two SDs worse than the age-adjusted performance of the general population at Time 1. However, the distribution did not show consistent declines from baseline, except for the SDMT test (39 to 67%).
Table 3
Patients who performed over 1SD or 2SDs below the general population
| Over 1SD worse | Over 2 SD worse | |||||
| Time 1 | Time 2 | Time 1 | Time 2 | |||
| n | n [%] | P-value | n [%] | n [%] | P-value | |
| TMT-A | 20 [53] | 18 [50] | 1.0 | 16 [42] | 11 [31] | 0.55 |
| TMT-B | 13 [36] | 12 [36] | 1.0 | 9 [25] | 8 [24] | 1.0 |
| Block design | 32 [89] | 30 [83] | 0.63 | 23 [64] | 19 [53] | 0.22 |
| Digit span: forward | 16 [48] | 17 [47] | 1.0 | 2 [6] | 2 [6] | 1.0 |
| Digit span: backward | 12 [36] | 10 [28] | 0.58 | 7 [21] | 3 [8] | 0.34 |
| SDMT | 28 [85] | 30 [83] | 1.0 | 13 [39] | 24 [67] | 0.004 |
| WCST CA | 12 [35] | 12 [33] | 1.0 | 2 [6] | 3 [8] | 1.0 |
| WCST TE | 8 [24] | 7 [19] | 0.73 | 7 [21] | 3 [8] | 0.22 |
TMT: Trail Making Test; SDMT: Symbol digit modalities test; WCST: Wisconsin Card Sorting Test CA: categories achieved; TE: total errors. Bold font shows significance in statistical tests (P < 0.05).
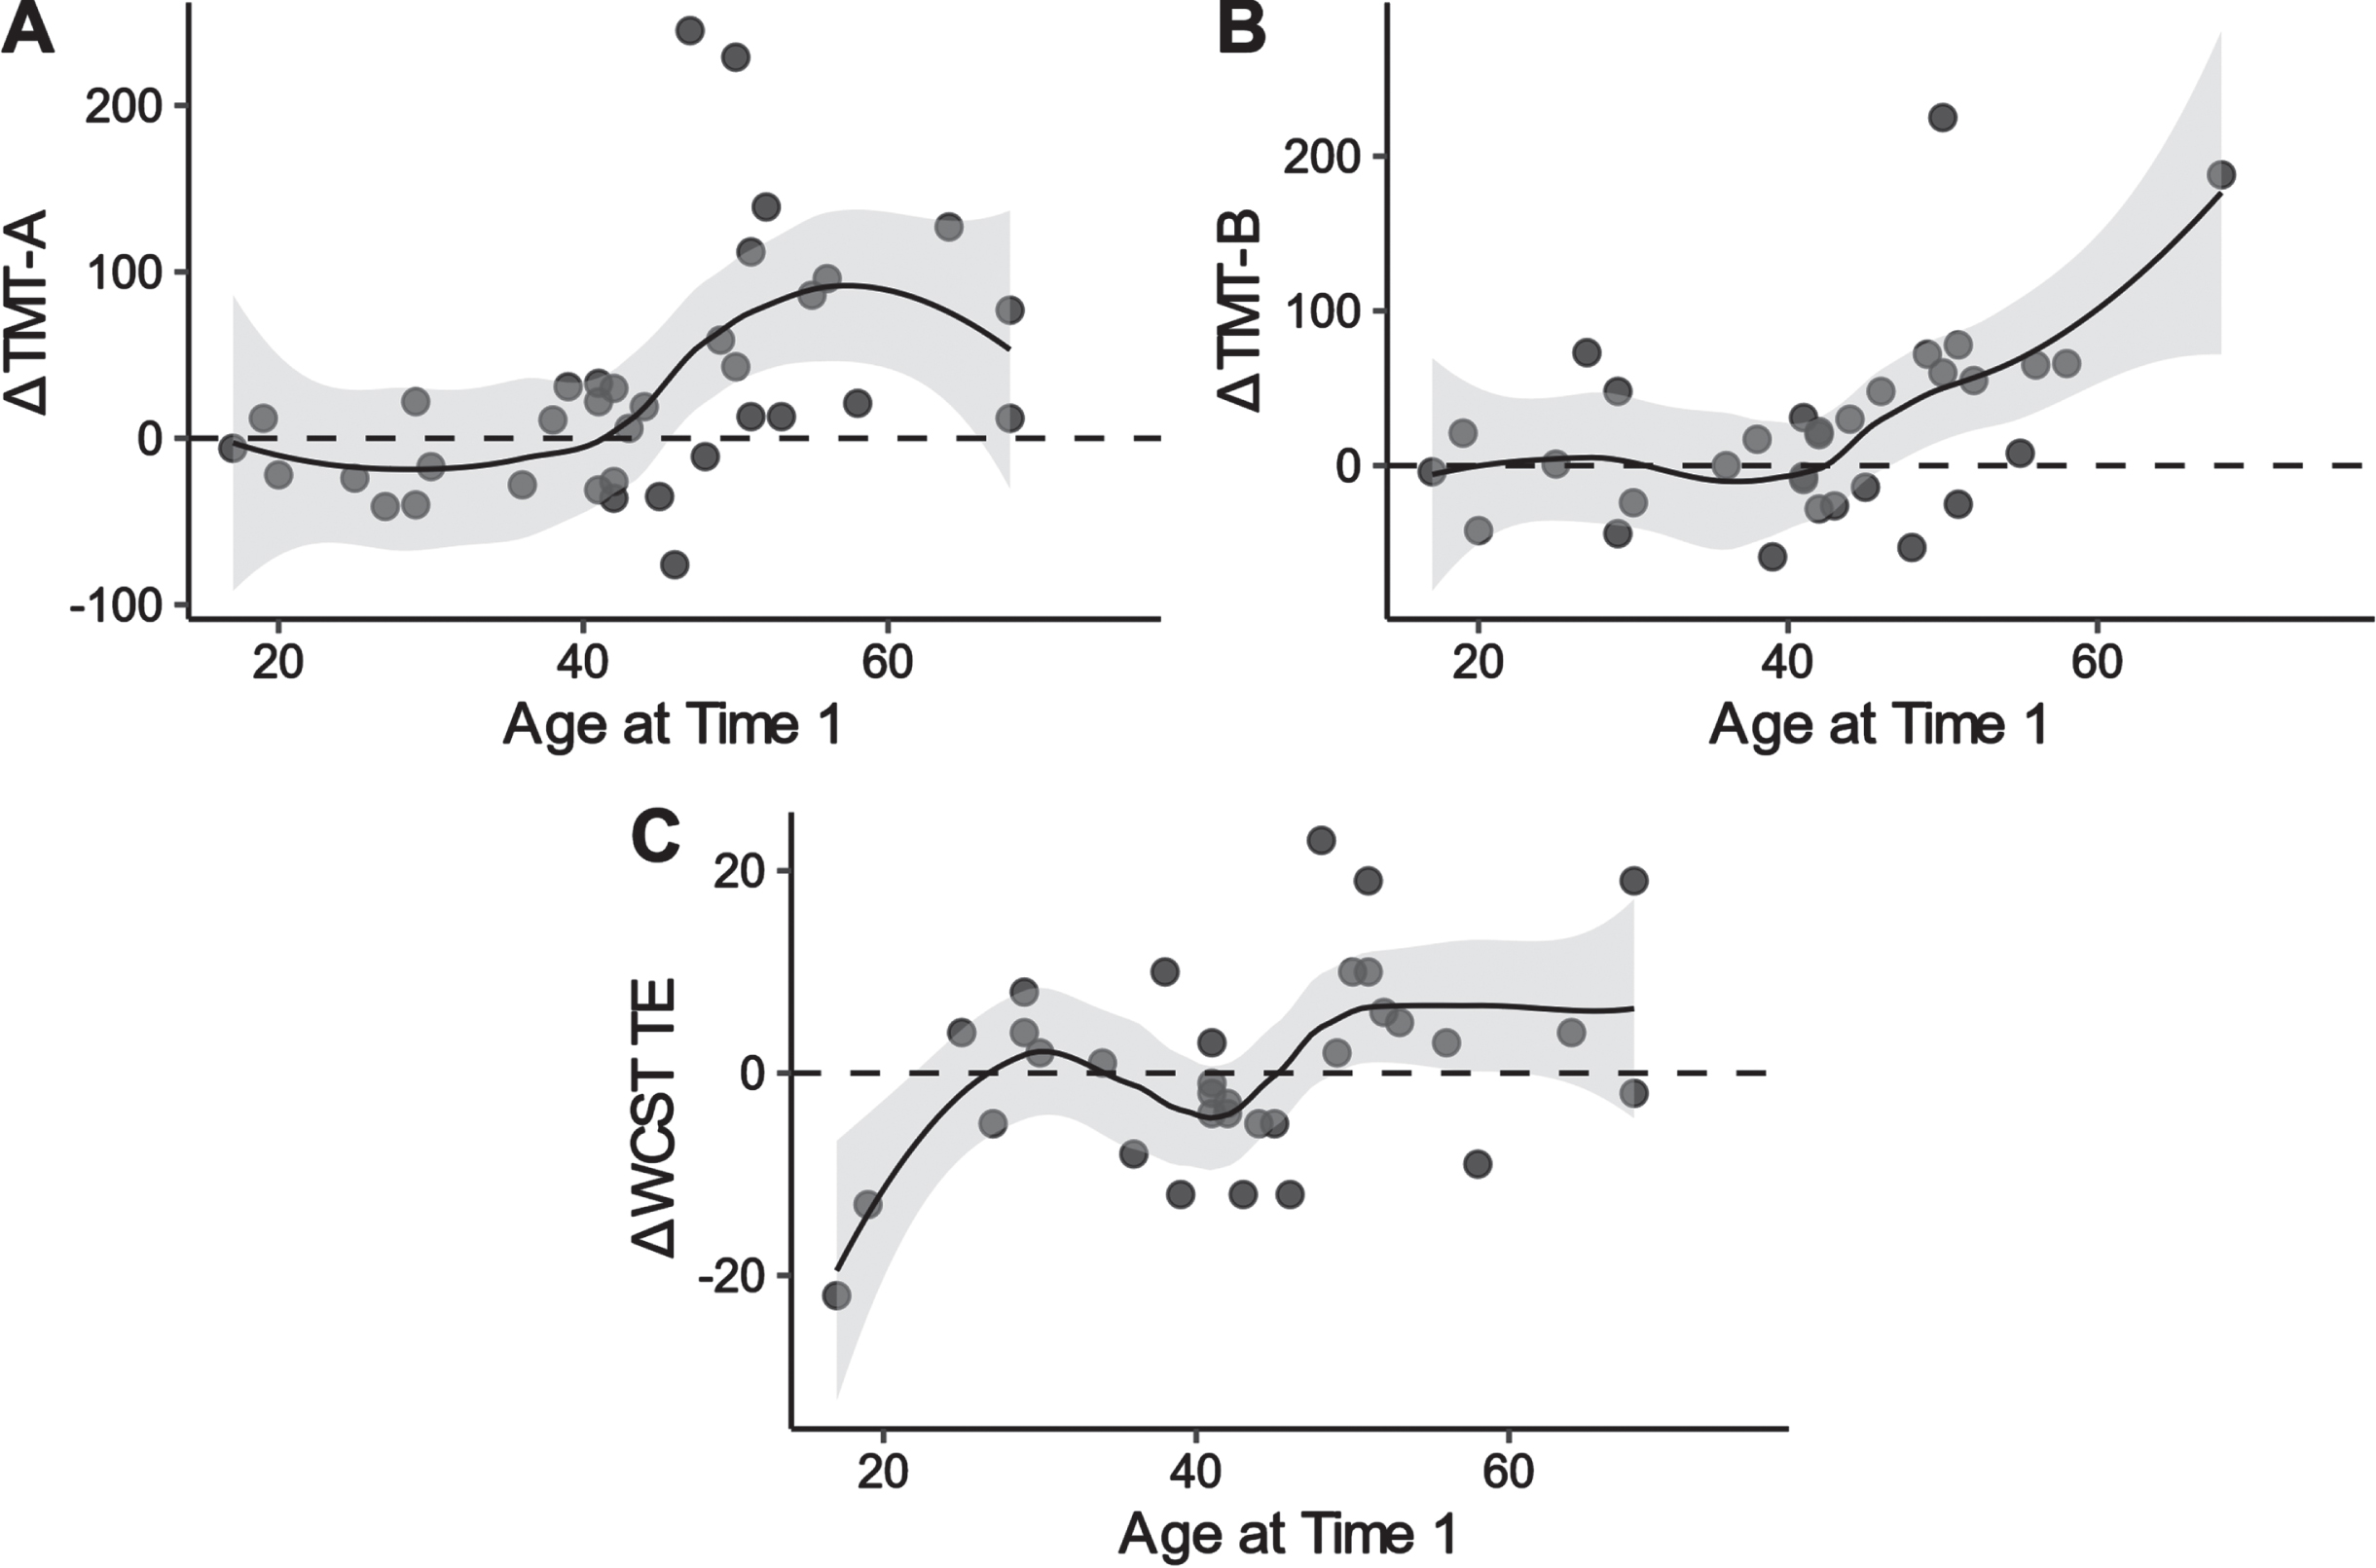
We evaluated the association between age and neuropsychological performance. A higher age at assessment was associated with higher delta scores on the TMT-A, TMT-B, and WCST TE scores (i.e., a decline in performance) (Spearman’s rho = 0.56, 0.44, and 0.35, respectively). Figure 2 illustrates the nonlinear association between age and test performances. The Loess curves suggest that the decline may have occurred from the 40 s on in TMT-A and TMT-B; however, the pattern is not clear enough in the WCST to draw meaningful conclusions.
Fig. 2
Locally weighted scatterplot smoothing for age at baseline on delta scores of TMT-A, TMT-B, and WCST TE in patients with DM1. TMT: trail making test; WCST: Wisconsin card sorting test; TE: total errors; DM1: myotonic dystrophy type 1.
Exploratory analysis for the association between neuropsychological performance and functional outcome
As an exploratory analysis, we examined the association between neuropsychological performance at Time 1 and functional outcomes (death and clinical deterioration; n = 20). Logistic regression analyses showed significant associations between the functional outcomes at Time 2 and the TMT-A, TMT-B, and WCST Categories achieved (Supplemental Table 4), with lower performance associated with higher odds of death or deterioration.
DISCUSSION
This study aimed to evaluate longitudinal changes in cognitive function in DM1 patients. At 5.4 years after the baseline assessment, there were significant declines in indices of the MMSE, TMT-B, Block Design, and SDMT; however, the decline in the cognitive domains seems marginal.
This study suggests that patients with DM1 showed cognitive decline in particular domains, including general cognition, processing speed, and visual construction ability. Similar to the current study, Winblad et al. investigated longitudinal changes in cognitive performance through a five-year follow-up assessment [34]. They detected significant worsening in Vocabulary, Block Design, Raven’s Auditory Verbal Learning Test, TMT-A and TMT-B, and the Spatial Span Test. Although we found a significant decline in the raw scores of the neuropsychological assessment, we did not detect an increase in patients who scored one SD or two SDs below the normative mean, except for SDMT, a test that is potentially susceptible to the peripheral physical function of the patients [35]. These inconsistencies may be explained by the differences in patient baseline severity between this and a previous study [34]. The death rates five years after baseline were 24% and 9%, respectively, while the mean age of the patients was similar between the studies (37 and 38 years, respectively). The results of our study were derived from the data of patients who completed both assessments at Times 1 and 2. Therefore, patients with more severe decline may not have been able to participate to the assessment at Time 2, which may have underestimated the potential decline in patients.
Another possible explanation is that the extent of the longitudinal decline in neuropsychological tests may be gradual or may have occurred in an earlier phase of the disease. Gallais et al. detected declines in many neuropsychological performances; however, they did not detect a decline in the Block Design and Digit Span Tests of the WAIS-R [14], similar to our findings. By contrast, a recent study compared patients with DM1 and healthy controls and detected deterioration in cognitive performance using the Block Design and the Rey– Osterrieth Complex Figure Test [15], although other neuropsychological measures did not differ significantly. The differences between studies may suggest that the stage of the disease affects the course of cognitive decline over the years to come. A recent study validating computerized batteries did not detect a decline a year after the baseline; conversely, a few indices showed improvements [36]. Further research is required to establish the longitudinal trajectory of cognitive functioning in patients with DM1.
We exploratory examined longitudinal differences between the pediatric and adult onset groups in neuropsychological measures. Most measures did not show significant differences in the longitudinal changes between groups, except for the WCST TE. However, the results should be interpreted carefully because of the limited sample size and smaller overlap in CIs in several measures. As a previous study suggested the possible different profiles of neurodevelopmental and/or neurodegenerative processes in pediatric and adult-onset patients [6], potential differences in neuropsychological trajectories between the classifications of DM1 should be investigated in future studies.
The current study found associations between age at baseline and the delta scores of the TMT-A and TMT-B and the WCST TE. These relationships suggest that a decline in psychomotor speed may occur in individuals in their 40 s. Another possible explanation may be a decline in executive function as TMT-A and TMT-B are also indicated that performance is affected by both psychomotor speed and executive function (e.g., attention shifting). Labayru et al. found an association between age and longitudinal changes in a block design test in patients with DM1 [15]. Although the association was not significant in this study, a similar tendency was found at ages 20–60 (Supplemental Figure 3). These patterns suggest that the slopes of the associations differ depending on age and cognitive domains. Previous studies have also suggested that age at assessment is a predictive factor for cognitive changes over time, as are disease duration and education [14]. This may explain the variability and heterogeneity of longitudinal changes in neuropsychological performance in patients with DM1, and the results should be interpreted cautiously because of the large heterogeneity of the DM1 phenotype.
Recent neuroimaging studies in patients with DM1 have suggested that some neuropsychological measures may predict the progressive loss of white matter volume in patients [6]. Although neuropsychological performance may not always assess a single cognitive function and may not show an association with brain volumes in particular regions, the cognitive domains in which deterioration is observed suggest a relationship with the impairment of certain brain functions. This decline may be related to specific brain abnormalities in patients with DM1 [4, 6, 37].
Fatigue, daytime sleepiness, and apathy did not significantly worsen during this period. A previous study that compared patients with DM1 and healthy controls over five years, similar to the current study, did not find a significant decline over time, which was affected by the small sample size (n = 16 vs. 17) [5]. Conversely, recent longitudinal studies have demonstrated a significant worsening in daytime sleepiness and fatigue [38, 39] over a 7-and 9-year period after baseline. Similar to the neuropsychological test performance, the lack of significant worsening in our study may be due to the relatively small sample size and shorter follow-up period (five years). The same issue discussed above in neuropsychological measures may also apply to these findings, such as the characteristics of participated patients and time of measurement in the disease course. Considering the slow disease progression, longer follow-up periods are required to identify the trajectories of these symptoms.
Although there were associations between cognitive function and functional and survival outcomes, the cardiovascular, respiratory, and muscular involvement may complicate these associations. Cardiac and respiratory involvement, and the deterioration or treatment of these problems, may complicate the findings [40–42]. These exploratory results identified possible prognostic factors for DM1, although over-interpretation of the results should be avoided. Neuropsychological assessment could be a potential candidate for predicting the prognosis or trajectory of patients with DM1 and may inform future treatment strategies in clinical practice.
LIMITATIONS
First, this study did not include a control group at Times 1 and 2. Comparisons between patient and control groups would provide more reliable findings by excluding potential confounding factors, such as natural declines and learning effects. This was a major limitation of this study. Second, the patients who participated in the Time 2 assessment were younger and had better cognitive performance at Time 1 than those who did not participate in the Time 2 assessment. Such characteristics may bias the findings (i.e., lack of or less longitudinal decline in patients). In addition, as prior test experience affects the performance of individuals (e.g., the learning effect) [36], estimated declines may be underestimated, although five years from the baseline would minimize such effects. Therefore, both longitudinal (i.e., within individuals) and age-stratified cross-sectional studies (i.e., between individuals) are required to characterize the trajectory of cognitive functioning in DM1. Third, the sample size and characteristics may have limited the statistical power to identify longitudinal changes and better subgroup analyses. Since previous studies suggested potential differences between the subgroups (pediatric, adult, and late-onset) [6, 14], stratified analyses may provide more meaningful information on longitudinal changes in cognitive function in DM1. Fourth, SDMT showed an increase in patients who performed two SDs worse than the general population in this study. Owing to the task characteristics of the SDMT, which requires copying symbols in small squares, performance may be affected by progressive muscular weakness in peripheral function [35]. Other neuropsychological performance, including TMT and Block design, may also be the case. By contrast, another study found no effects of muscular impairment on the decline in neuropsychological performance measures [14]. The effects may be limited to specific neuropsychological tests; however, we cannot exclude the possibility of a performance decline resulting from progressive peripheral muscular impairment. Investigation using reliable neuropsychological measures that will not be affected by the muscular impairment would strengthen the findings of the longitudinal trajectories.
CONCLUSION
Despite these limitations, this is the first longitudinal study on DM1 in an Asian country. Cognitive decline in DM1 may be slow but is detected after 5.4 years from the baseline. Therefore, integrating recent longitudinal studies and methodologies is needed. Future studies with longer follow-up periods will reveal the trajectories of cognitive function in patients with DM1.
DECLARATIONS
Ethics approval and consent to participate
Informed consent was obtained from all study participants. All procedures involving human participants performed in this study were in accordance with ethical standards and the 1964 Helsinki Declaration and its later amendments. This study was approved by the Osaka University Clinical Research Review Committee (approval no. 14480).
Consent for publication
Not applicable.
Data availability statement
The datasets generated and/or analyzed during the current study are not publicly available because of privacy constraints related to ethical approval, but are available from the corresponding author upon reasonable request.
Competing interests
The authors have no conflict of interest to report.
ACKNOWLEDGMENTS
This work was supported in part by research grants from the Japan Agency for Medical Research and Development (AMED; 17ek0109259, 22ek0109474, and 23ek0109619), the Ministry of Health and Welfare of Japan (21FC1006), and the Japan Society for the Promotion of Science KAKENHI (21K03047). The funders had no role in the study design, data collection and analysis, decision to publish, or manuscript preparation.
AUTHOR CONTRIBUTIONS
HF was critically involved in the study design as well as the collection, analysis, and interpretation of the data and wrote the draft of the manuscript. HF, SS, OI, TM, and MPT participated in the development of this study. YU and OI were critically involved in the design and interpretation of the data. SS, MK, TN, TM, and MPT were involved in patient recruitment and clinical assessment. All authors contributed intellectually to the data interpretation and approved the final manuscript.
SUPPLEMENTARY MATERIAL
[1] The supplementary material is available in the electronic version of this article: https://dx.doi.org/10.3233/JND-230083.
REFERENCES
[1] | Cabada T , Iridoy M , Jerico I , Lecumberri P , Seijas R , Gargallo A , et al. Brain Involvement in Myotonic Dystrophy Type A Morphometric and Diffusion Tensor Imaging Study with Neuropsychological Correlation. Arch Clin Neuropsychol. (2017) ;32: (4):401–12. doi: 10.1093/arclin/acx008. |
[2] | Caso F , Agosta F , Peric S , Rakocevic-Stojanovic V , Copetti M , Kostic VS , et al. Cognitive impairment in myotonic dystrophy type 1 is associated with white matter damage. PLoS One. (2014) ;9: (8):e104697. doi: 10.1371/journal.pone.0104697. |
[3] | Labayru G , Diez I , Sepulcre J , Fernandez E , Zulaica M , Cortes JM , et al. Regional brain atrophy in gray and white matter is associated with cognitive impairment in Myotonic Dystrophy type 1. NeuroImage Clinical. (2019) ;24: :102078. doi: 10.1016/j.nicl.2019.102078. |
[4] | Cabada T , Diaz J , Iridoy M , Lopez P , Jerico I , Lecumberri P , et al. Longitudinal study in patients with myotonic dystrophy type Correlation of brain MRI abnormalities with cognitive performances. Neuroradiology. (2021) ;63: (7):1019–29. doi: 10.1007/s00234-020-02611-9. |
[5] | Gliem C , Minnerop M , Roeske S , Gartner H , Schoene-Bake JC , Adler S , et al. Tracking the brain in myotonic dystrophies: A 5-yearlongitudinal follow-up study. PLoS One. (2019) ) 14: (3):e0213381. doi: 10.1371/journal.pone.0213381. |
[6] | Labayru G , Jimenez-Marin A , Fernandez E , Villanua J , Zulaica M , Cortes JM , et al. Neurodegeneration trajectory in pediatric and adult/late DM A follow-up MRI study across a decade. Ann Clin Transl Neurol. (2020) ;7: (10):1802–15. doi: 10.1002/acn3.51163. |
[7] | Okkersen K , Buskes M , Groenewoud J , Kessels RPC , Knoop H , van Engelen B , et al. The cognitive profile of myotonic dystrophy type A systematic review and meta-analysis. Cortex. (2017) ;95: :143–55. doi: 10.1016/j.cortex.2017.08.008. |
[8] | Okkersen K , Monckton DG , Le N , Tuladhar AM , Raaphorst J , van Engelen BGM Brain imaging in myotonic dystrophy type A systematic review. Neurology. (2017) ;89: (9):960–9. doi: 10.1212/WNL.0000000000004300. |
[9] | Simoncini C , Spadoni G , Lai E , Santoni L , Angelini C , Ricci G , et al. Central Nervous System Involvement as Outcome Measure for Clinical Trials Efficacy in Myotonic Dystrophy Type 1. Front Neurol. (2020) ;11: :624. doi: 10.3389/fneur.2020.00624. |
[10] | Peric S , Rakocevic Stojanovic V , Mandic Stojmenovic G , Ilic V , Kovacevic M , Parojcic A , et al. Clusters of cognitive impairment among different phenotypes of myotonic dystrophy type 1 and type 2. Neurol Sci. (2017) ;38: (3):415–23. doi: 10.1007/s10072-016-2778-4. |
[11] | Tuikka RAL , Somer R.K. H.V. Cognitive function in myotonic dystrophy: A follow-up study. Eur Neurol. (1993) ;33: (6):436–41. doi: 10.1159/000116989. |
[12] | Modoni A , Silvestri G , Vita MG , Quaranta D , Tonali PA , Marra C Cognitive impairment in myotonic dystrophy type 1 (DM1): A longitudinal follow-up study. J Neurol. (2008) ;255: (11):1737–42. doi: 10.1007/s00415-008-0017-5. |
[13] | Sansone V , Gandossini S , Cotelli M , Calabria M , Zanetti O , Meola G Cognitive impairment in adult myotonic dystrophies: A longitudinal study. Neurol Sci. (2007) ;28: (1):9–15. |
[14] | Gallais B , Gagnon C , Mathieu J , Richer L Cognitive decline over time in adults with myotonic dystrophy type A 9-year longitudinal study. Neuromuscul Disord. (2017) ;27: (1):61–72. doi: 10.1016/j.nmd.2016.10.003. |
[15] | Labayru G , Aliri J , Zulaica M , Lopez de Munain A , Sistiaga A Age-related cognitive decline in myotonic dystrophy type An 11-year longitudinal follow-up study. J Neuropsychol. (2019) ;14: (1):121–34. doi: 10.1111/jn12192. |
[16] | Lindeblad G , Kroksmark AK , Ekstrom AB Cognitive and adaptive functioning in congenital and childhood forms of myotonic dystrophy type A longitudinal study. Dev Med Child Neurol. (2019) ;61: (10):1214–20. doi: 10.1111/dmcn.14161. |
[17] | Fujino H , Shingaki H , Suwazono S , Ueda Y , Wada C , Nakayama T , et al. Cognitive impairment and quality of life in patients with myotonic dystrophy type 1. Muscle Nerve. (2018) ;57: (5):742–8. doi: 10.1002/mus.26022. |
[18] | Tremblay M , Muslemani S , Cote I , Gagnon C , Fortin J , Gallais B Accomplishment of instrumental activities of daily living and its relationship with cognitive functions in adults with myotonic dystrophy type 1 childhood phenotype: An exploratory study. BMC Psychol. (2021) ;9: (1):56. doi: 10.1186/s40359-021-00562-1. |
[19] | van As D , Okkersen K , Bassez G , Schoser B , Lochmuller H , Glennon JC , et al. Clinical Outcome Evaluations and CBT Response Prediction in Myotonic Dystrophy. J Neuromuscul Dis. (2021) ;8: (6):1031–46. doi: 10.3233/JND-210634. |
[20] | Van Heugten C , Meuleman S , Hellebrekers D , Kruitwagen-van Reenen E , Visser-Meily J Participation and the Role of Neuropsychological Functioning in Myotonic Dystrophy Type 1. J Neuromuscul Dis. (2018) ;5: (2):205–14. doi: 10.3233/JND-170246. |
[21] | Suwazono S , Ueda Y , Maedo S Impairment of the central nervous system in patients with myotonic dystrophy type How much do we know and how to deal with it. Jpn J Rehabil Med. (2022) ;59: (2):170–4. doi: 10.2490/jjrmc.59.170. |
[22] | Gagnon C , Meola G , Hebert LJ , Laberge L , Leone M , Heatwole C Report of the second Outcome Measures in Myotonic Dystrophy type 1 (OMMYD-2) international workshop San Sebastian, Spain, October 16, 2013. Neuromuscul Disord. (2015) ;25: (7):603–16. doi: 10.1016/j.nmd.2015.01.008. |
[23] | Baldanzi S , Bevilacqua F , Lorio R , Volpi L , Simoncini C , Petrucci A , et al. Disease awareness in myotonic dystrophy type An observational cross-sectional study. Orphanet J Rare Dis. (2016) ;11: :34. doi: 10.1186/s13023-016-0417-z. |
[24] | Benedict RH , DeLuca J , Phillips G , LaRocca N , Hudson LD , Rudick R , et al. Validity of the Symbol Digit Modalities Test as a cognition performance outcome measure for multiple sclerosis. Mult Scler. (2017) ;23: (5):721–33. doi: 10.1177/1352458517690821. |
[25] | Starkstein SE , Fedoroff JP , Price TR , Leiguarda R , Robinson RG Apathy following cerebrovascular lesions. Stroke. (1993) ;24: (11):1625–30. |
[26] | Takegami M , Suzukamo Y , Wakita T , Noguchi H , Chin K , Kadotani H , et al. Development of a Japanese version of the Epworth Sleepiness Scale (JESS) based on item response theory. Sleep Med. (2009) ;10: (5):556–65. doi: 10.1016/j.slee2008.04.015. |
[27] | Smets EM , Garssen B , Bonke B , De Haes JC The Multidimensional Fatigue Inventory (MFI) psychometric qualities of an instrument to assess fatigue. J Psychosom Res (1995) ;39: (3):315–25. |
[28] | Fujino H , Saito T , Takahashi MP , Takada H , Nakayama T , Ogata K , et al. Validation of The Individualized Neuromuscular Quality of Life in Japanese patients with myotonic dystrophy. Muscle Nerve. (2018) ;58: (1):56–63. doi: 10.1002/mus.26071. |
[29] | Vincent KA , Carr AJ , Walburn J , Scott DL , Rose MR Construction and validation of a quality of life questionnaire for neuromuscular disease (INQoL). Neurology. (2007) ;68: (13):1051–7. doi: 10.1212/01.wnl.0000257819.47628.41. |
[30] | Japan Society for Higher Brain Dysfunction. Clinical Assessment for Attention (CAT). Tokyo: Shinko Igaku Shuppan; (2006) . |
[31] | Japanese WAIS-III Publication Committee. Japanese Wechsler Adult Intelligence Scale, third edition. Tokyo: Nihon Bunka Kagakusya; (2006) . |
[32] | Kado Y , Sanada S , Yanagihara M , Ogino T , Abiru K , Nakano K Effect of development and aging on the modified Wisconsin Card Sorting Test in normal subjects. No To Hattatsu. (2004) ;36: (6):475–80. |
[33] | Toyokura M , Tanaka H , Furukawa T , Yamanouchi Y , Murakami K Normal aging effect on cognitive task performance of information-processing speed: Analysis of paced auditory serial addition task and trail making test. No To Seishin No Igaku. (1996) ;7: (4):401–9. |
[34] | Winblad S , Samuelsson L , Lindberg C , Meola G Cognition in myotonic dystrophy type A 5-year follow-up study. Eur J Neurol. (2016) ;23: (9):1471–6. doi: 10.1111/ene.13062. |
[35] | Hamilton MJ , McLean J , Cumming S , Ballantyne B , McGhie J , Jampana R , et al. Outcome Measures for Central Nervous System Evaluation in Myotonic Dystrophy Type 1 May Be Confounded by Deficits in Motor Function or Insight. Front Neurol. (2018) ;9: :780. doi: 10.3389/fneur.2018.00780. |
[36] | Deutsch GK , Hagerman KA , Sampson J , Dent G , Dekdebrun J , Parker DM , et al. Brief assessment of cognitive function in myotonic dystrophy: Multicenter longitudinal study using computer-assisted evaluation. Muscle Nerve. (2022) ;65: (5):560–7. doi: 10.1002/mus.27520. |
[37] | Langbehn KE , van der Plas E , Moser DJ , Long JD , Gutmann L , Nopoulos PC Cognitive function and its relationship with brain structure in myotonic dystrophy type 1. J Neurosci Res. (2021) ;99: (1):190–9. doi: 10.1002/jnr.24595. |
[38] | Laberge L , Gallais B , Auclair J , Dauvilliers Y , Mathieu J , Gagnon C Predicting daytime sleepiness and fatigue: A 9-year prospective study in myotonic dystrophy type 1. J Neurol. (2020) ;267: (2):461–8. doi: 10.1007/s00415-019-09592-7. |
[39] | Peric S , Bjelica B , Bozovic I , Pesovic J , Paunic T , Banovic M , et al. Fatigue in myotonic dystrophy type A seven-year prospective study. Acta Myol. (2019) ;38: :239–44. |
[40] | Dogan C , De Antonio M , Hamroun D , Varet H , Fabbro M , Rougier F , et al. Gender as a modifying factor influencing myotonic dystrophy type 1 phenotype severity and mortality: A nationwide multiple databases cross-sectional observational study. PLoS One. (2016) ;11: (2):e0148264. doi: 10.1371/journal.pone.0148264. |
[41] | Vosse BAH , Seijger C , Cobben N , van Engelen B , van Kuijk SMJ , Faber C , et al. Noninvasive Home Mechanical Ventilation in Adult Myotonic Dystrophy Type A Systematic Review. Respiration. (2021) ;100: (8):816–25. doi: 10.1159/000515453. |
[42] | Wahbi K , Porcher R , Laforet P , Fayssoil A , Becane HM , Lazarus A , et al. Development and Validation of a New Scoring System to Predict Survival in Patients With Myotonic Dystrophy Type 1. JAMA Neurol. (2018) ;75: (5):573–81. doi: 10.1001/jamaneurol.2017.4778. |


