
Muscle Ultrasound Abnormalities in Individuals with RYR1-Related Malignant Hyperthermia Susceptibility
Abstract
Background:
Variants in RYR1, the gene encoding the ryanodine receptor-1, can give rise to a wide spectrum of neuromuscular conditions. Muscle imaging abnormalities have been demonstrated in isolated cases of patients with a history of RYR1-related malignant hyperthermia (MH) susceptibility.
Objective:
To provide insights into the type and prevalence of muscle ultrasound abnormalities and muscle hypertrophy in patients carrying gain-of-function RYR1 variants associated with MH susceptibility and to contribute to delineating the wider phenotype, optimizing the diagnostic work-up and care for MH susceptible patients.
Methods:
We performed a prospective cross-sectional observational muscle ultrasound study in patients with a history of RYR1-related MH susceptibility (n = 40). Study procedures included a standardized history of neuromuscular symptoms and a muscle ultrasound assessment. Muscle ultrasound images were analyzed using a quantitative and qualitative approach and compared to reference values and subsequently subjected to a screening protocol for neuromuscular disorders.
Results:
A total of 15 (38%) patients had an abnormal muscle ultrasound result, 4 (10%) had a borderline muscle ultrasound screening result, and 21 (53%) had a normal muscle ultrasound screening result. The proportion of symptomatic patients with an abnormal result (11 of 24; 46%) was not significantly higher compared to the proportion of asymptomatic patients with an abnormal ultrasound result (4 of 16; 25%) (P = 0.182). The mean z-scores of the biceps brachii (z = 1.45; P < 0.001), biceps femoris (z = 0.43; P = 0.002), deltoid (z = 0.31; P = 0.009), trapezius (z = 0.38; P = 0.010) and the sum of all muscles (z = 0.40; P < 0.001) were significantly higher compared to 0, indicating hypertrophy.
Conclusions:
Patients with RYR1 variants resulting in MH susceptibility often have muscle ultrasound abnormalities. Frequently observed muscle ultrasound abnormalities include muscle hypertrophy and increased echogenicity.
INTRODUCTION
Variants in RYR1, the gene encoding the skeletal muscle ryanodine receptor, can give rise to a wide spectrum of neuromuscular conditions including congenital myopathies [1], exertional rhabdomyolysis (ERM) [2–4] and malignant hyperthymia (MH) susceptibility [5, 6]. MH susceptible individuals may develop a life-threatening hypermetabolic adverse reaction in response to volatile anesthetics and/or the depolarizing muscle relaxant succinylcholine [7]. Previous studies have shown that MH susceptible individuals frequently suffer from neuromuscular symptoms such as cramps and myalgia, and may develop muscle weakness later in life [2, 8, 9]. Moreover, a recent study has suggested a link between RYR1-related ERM and an increased MH risk, when triggering agents are administered in timely association with viral illnesses or intense exercise in genetically susceptible individuals [10]. Furthermore, gain-of-function RYR1 variants resulting in MH susceptibility are associated with fatigue [11], muscle hypertrophy [2, 8], late-onset axial muscle weakness [12] and mild bleeding abnormalities [13], indicating that MH susceptibility is not only a pharmacogenetic disorder, but can be considered a mild myopathy with additional non-skeletal muscle symptoms.
These clinical observations raise questions whether there are structural abnormalities in skeletal muscle of MH susceptible individuals carrying gain-of-function RYR1 variants. Although knowledge about symptoms and skeletal muscle abnormalities related to MH susceptibility has substantially increased in recent years [9, 14], there are still several knowledge gaps. For instance, previous imaging studies on skeletal muscle abnormalities were mostly limited to patients with congenital myopathies, the most severe end of the spectrum of RYR1-related disease and did not include any data on imaging abnormalities in the upper extremities [15, 16]. The recent RYR1-Related Diseases International Research Workshop has emphasized expansion of natural history data throughout to full spectrum of RYR1-related disease as an important research priority in the field of RYR1-related disease [17].
Muscle ultrasound with visual assessment is a non-invasive, patient-friendly and accessible technique used in various neuromuscular disorders to establish a diagnosis, and to monitor disease progression longitudinally [18]. It has been shown to be a practical and reliable alternative to more invasive techniques such as electromyography (EMG) and muscle MRI [19] and is able to detect early skeletal muscle abnormalities [20]. The sensitivity of muscle ultrasound to detect a neuromuscular disorder is about 70% using a qualitative analysis, but can be increased up to 92% when using a quantified approach [21–23].
Based on previous preliminary observations [2, 8, 9, 12, 24], we hypothesized that patients with a history of RYR1-related MH susceptibility and/or ERM frequently do have muscle ultrasound abnormalities reflected as an increased skeletal muscle echogenicity and hypertrophy. This prospective, cross-sectional, observational clinical study assessed muscle ultrasound abnormalities, and their correlation with neuromuscular symptoms and muscle thickness in patients with RYR1-related MH susceptibility and/or ERM. We expect our study to provide important insights into the type and prevalence of muscle ultrasound abnormalities and muscle hypertrophy in patients carrying gain-of-function RYR1 variants associated with MH susceptibility and/or ERM and to contribute to delineating the wider phenotype, optimizing the diagnostic work-up and care for MH susceptible patients.
MATERIALS AND METHODS
Standard protocol approvals, registrations, and patient consents
This study was approved by the regional medical ethics committee (CMO Arnhem–Nijmegen, registration number 2020-6251). All participants provided written informed consent according to the Declaration of Helsinki. The study protocol was pre-registered at ClinicalTrials.gov (ID: NCT04610619). The present study is part of a parent project involving four sub-projects aiming to delineate the phenotype of RYR1-related MH susceptibility and ERM comprehensively, including a questionnaire study, a clinical study [9], an imaging study, and an immunological study. Procedures relevant for this report are described in detail in Part 2 “Questionnaire studies” and Part 3 “Imaging studies” of the parent project study protocol [25].
Study design and participant recruitment
This study was a prospective, cross-sectional, observational, clinical study, reporting the results of the muscle ultrasound examinations performed during the study visits of a four-part study. Participants were recruited between August 2020 and June 2021 from the MH cohort seen at the MH Investigation Unit in the Canisius Wilhelmina Hospital, Nijmegen, The Netherlands and from the ERM cohort seen at the neuromuscular clinic of the Radboud University Medical Centre, Nijmegen, The Netherlands as previously reported [9, 25].
Inclusion criteria were:
• A history of MH susceptibility according the European Malignant Hyperthermia Group (EMHG) guideline [26] and/or ERM fulfilling one of the RHABDO criteria [27]. ERM was defined as at least one episode of the following symptoms: cramps, myalgia, myoglobinuria, muscle weakness and/or muscle swelling, in combination with an acute creatine kinase (CK) increase (>10 000 U/L) and a subsequent fall of the CK level.
• RYR1 variant(s), identified by whole exome, targeted, partial, or full RYR1 sequencing and classified as pathogenic, likely pathogenic or variant of unknown significance for MH susceptibility [28];
• The ability to speak, read, write, and understand Dutch;
• Age ≥18 years old.
Exclusion criteria were:
• An initial presentation of an RYR1-related congenital myopathy, manifesting as muscle weakness preceding other symptoms;
• Other (neuromuscular) diseases resulting in muscle weakness;
• Use of systemic steroids for a period >14 days during the last three months;
• A current pregnancy or breastfeeding;
• If participants fulfilled exclusion criteria relevant for other parts of the parent study [25], including:
∘ A contra-indication for MRI, because of the MRI study;
∘ Symptoms of angina pectoris, because of the exercise tests;
∘ Current malignancy, because of the exercise tests [25].
Selection bias was minimized by including one participant per family, to avoid inter-family differences or confounding co-morbidities with a genetic origin other than RYR1-related disease [29]. If two or more individuals from the same family were willing to participate and matched the inclusion criteria, the individual who responded first was included in the study.
Study procedures
Standardized history of neuromuscular symptoms and physical activity
All participants were asked to complete a comprehensive online questionnaire, assessing I) medical and family history, II) neuromuscular symptoms, III) healthcare burden and expenditure because of neuromuscular symptoms and IV) physical activity. All participants filled out the questionnaires at home. The results of the questionnaire study on neuromuscular symptoms has been published recently [9], and were used in the current study to investigate the correlation between muscle ultrasound abnormalities and reported neuromuscular symptoms. Most important findings were that individuals with RYR1-related MH susceptibility and/or ERM do frequently suffer from (exertional) myalgia, cramps and may develop muscle weakness [9]. Since these symptoms are common in the general population, participants who reported (exertional) cramps, myalgia and/or muscle weakness on a daily or weekly basis were classified as symptomatic. Participants without, or with less frequent symptoms (e.g. on a monthly basis) were classified as asymptomatic. The relevant part of the questionnaire on neuromuscular symptoms was translated from Dutch to English and is available as Supplementary File 1.
Physical activity was assessed using the long form of the International Physical Activity Questionnaire (IPAQ) [30]. The activity level of each participant was classified as low, moderate or high according to the questionnaire instructions.
Muscle ultrasound studies
Muscle selection The following muscles were examined bilaterally: biceps brachii, biceps femoris, deltoid, paraspinal (thoracic and lumbar), gastrocnemius (medial head), iliopsoas, proximal vastus lateralis and trapezius. These muscles were selected because RYR1-related congenital myopathies are associated with proximal and axial muscle weakness and MRI abnormalities [1, 6, 12, 15, 16].
Positioning participants during muscle ultrasound examinations. The biceps brachii, iliopsoas and proximal vastus lateralis muscles were examined in a supine position with the arms and legs in the anatomical resting position. The biceps femoris, paraspinal (thoracic and lumbar) and gastrocnemius muscles (medial head) were examined in the prone position with the arms and legs in the anatomical resting position. The deltoid and trapezius muscles were examined in sitting position with both arms and legs in the anatomical resting position.
Equipment. Muscle ultrasound was performed using an Esaote MyLabTwice ultrasound scanner (Esaote SpA, Genoa, Italy) with a 3–13 MHz broadband linear transducer. A fixed preset was used and all system settings were kept constant for all measurements to ensure reproducibility [18]. The biceps brachii, deltoid, thoracic paraspinals, gastrocnemius (medial head), and trapezius muscles were examined using a fixed 4 cm depth setting. The biceps femoris, iliopsoas, lumbar paraspinals and proximal vastus lateralis were examined using a fixed 6 cm depth setting. To avoid an uneven grayscale distribution, the ultrasound focus for this machine needed to be fixed in the lower edge of the image. A fixed gain of 50% was used for all muscles. Image settings were not adjusted during or after the examination. To minimize variation, three consecutive measurements were performed for each muscle for further offline grayscale analysis.
Timing and setting of the study procedures
All study procedures were performed by experienced neurodiagnostic technicians at the outpatient clinic of the Radboud University Medical Centre, Nijmegen, The Netherlands. Anatomical landmarks were used to ensure that all technicians selected the same region of the muscle and all ROIs were verified by visual inspection by one of the authors (NvA). All study procedures were performed in clinically stable conditions. One participant had an ERM event prior to inclusion. As this potentially could have influenced the muscle ultrasound appearance, his study visit was rescheduled to three months after the ERM event. The other participants did not have any MH and/or ERM events in the year prior to inclusion.
Image analysis
Qualitative analysis
Visual analysis with a semi-quantitative grading was performed of each muscle scanned using the Heckmatt rating scale (HRS) [22]:
• HRS grade 1: normal muscle
• HRS grade 2: increased echogenicity without attenuation of the deeper image regions
• HRS grade 3: a larger increase in echogenicity with some visible loss of normal muscle architecture and some attenuation
• HRS grade 4: shows a strongly increased echogenicity with complete loss of recognizable muscle architecture and strong attenuation
All images were scored by the same observer, a neurologist with >20 years experience in diagnostic muscle ultrasound (NvA) in a single blinded fashion. This neurologist was blinded until the full analysis was completed. A HRS of ≥2 was considered abnormal. Two compound HRS sum scores were calculated: I) a participant-specific HRS sum score to give insight into the degree of muscle ultrasound abnormalities for each individual participant and II) a muscle-specific HRS sum score to give insight into which muscles were affected across the entire patient cohort.
The degree of muscle ultrasound abnormalities was determined by adding up the HRS grades of all 18 muscles. Thus, this approach lead to a minimum score of 18 in an unaffected participant and a maximum score of 72 in severely affected participant. Next, a HRS sum score was calculated per muscle by adding up all HRS scores in all 40 participant, leading to a minimum score of 40 to a maximum of 160 per muscle.
Quantitative grayscale analysis
In all muscle ultrasound images a region of interest (ROI) was drawn, using a custom local software ensemble (“Qumia version 3.0”). All ROIs were drawn by one physician (LRvdB) and subsequently checked by our experienced ultra-sonographer (NvA). The ROIs were drawn in such a way to include the largest possible area of the muscle in the ROI, ignoring the lateral 1 cm edges of the images because of artefacts occurring in these regions. Examples of ROIs for all muscles investigated in this study are showed in Supplemental Figures 1 and 2.
For each muscle, the mean grayscale within the ROI of the three images was calculated using the computer-assisted grayscale histogram analysis function of the Qumia software. Our center has developed a recently published prediction model for echogenicity and muscle thickness, using linear regression derived from a large set of muscles from healthy individuals [31]. In this model, age, sex, height, weight, BMI and handedness are used as predictors. This obviates the need to include any additional healthy subjects in specific muscle ultrasound research studies for comparison. The detailed protocol was previously reported [31]. In the present study, the mean grayscale of each muscle was compared to the previously obtained muscle-specific reference value and converted to a z-score.
Finally, the results of the full muscle ultrasound study were subjected to a protocol for muscle ultrasound screening for neuromuscular disorders which has been published previously [31, 32]. Based on this screening protocol for neuromuscular disorders, the full muscle ultrasound study of each patient was categorized as normal, borderline (i.e. uncertain) or abnormal. The flowchart of this protocol is shown in Supplementary Figure 3.
Muscle thickness analysis
Muscle atrophy and/or hypertrophy was assessed measuring muscle thickness using the caliper function of the ultrasound system. The method of measuring muscle thickness for all muscle investigated in this study is shown in Supplemental Figures 4 and 5. Muscle thickness was also compared to muscle specific reference values from healthy controls as described above and converted to z-scores [31].
Statistical analysis
The statistical analysis was performed using IBM SPSS (IBM Corp, IBM SPSS Statistics for Windows, version 27, Armonk NY, USA). Demographic characteristics, muscle and participant specific HRS sum scores, the number of muscles with an increased echogenicity defined as a z-score >2 and muscle atrophy (z-score<2) or hypertrophy (z-score>2) were presented using descriptive statics. To study whether the mean z-score of the study cohort deviated from 0 (i.e. the average z-score of that muscle in the reference population), the z-scores of each muscle and all nine muscles combined were compared to 0 using the one sample t-test. Normality was confirmed with the use of histograms. Pearson correlation coefficient was used to test correlation between grayscale and muscle thickness. The chi-square test was used to compare categorical variables. P-values of <0.05 were considered statistically significant.
Due to the explorative nature of this study, we did not perform a power calculation. The sample size was based on a previous questionnaire study [11], clinical studies [2, 8, 9], a histopathological study [14], case series reporting imaging abnormalities in patients with RYR1-related MH susceptibility and/or ERM [2, 12] and MRI studies in patients with RYR1-related congenital myopathies [15, 16]. These studies with approximately 40 participants showed a substantial clinical and histopathological continuum between patients with RYR1-related myopathies and MH susceptibility and/or ERM and imaging abnormalities.
Data availability
The anonymized dataset generated during this study is available from the corresponding author on reasonable request from qualified investigators.
RESULTS
Participants
The study cohort is similar to the cohort previously reported [9]. A total of 104 individuals were invited to participate of whom 71 responded and were informed about the study procedures. After the informed consent procedure and check of eligibility criteria, 40 individuals were eventually included. The participant selection process, reason for exclusion and overall study design are summarized in Fig. 1 [9].
Fig. 1
Selection process and reason for exclusion of study participants. A summary of the selection process and exclusion criteria for this study. ERM = exertional rhabdomyolysis; MH = malignant hyperthermia; MRI = magnetic resonance imaging. With permission adapted from LR van den Bersselaar et al. [9].
![Selection process and reason for exclusion of study participants. A summary of the selection process and exclusion criteria for this study. ERM = exertional rhabdomyolysis; MH = malignant hyperthermia; MRI = magnetic resonance imaging. With permission adapted from LR van den Bersselaar et al. [9].](https://content.iospress.com:443/media/jnd/2023/10-4/jnd-10-4-jnd230018/jnd-10-jnd230018-g001.jpg)
In 39 participants (98%), MH susceptibility was confirmed by either an RYR1 variant pathogenic for MH (n = 36; 90%) (28, 33, 34) and/or a positive in vitro contracture test (IVCT) (n = 21; 53%) (26, 35). A total of 18 participants (45%) were primarily investigated with the IVCT, and were at a later time found to carry RYR1 variant(s) pathogenic for MH. The participant in whom MH susceptibility could not be formally confirmed, carried the RYR1 variant c.6710G>A, p.Cys2237Tyr, which has been previously associated with MH. He was referred to the MH-unit, however, he refused an IVCT [36, 37]. The rare exome variant ensemble learner (REVEL) predicts this variant to have a damaging effect on ryanodine receptor-1 function [38]. The demographic and genetic characteristics of the study cohort are summarized in Table 1.
Table 1
Demographic and genetic characteristics (n = 40)
| Median age (years) [IQR] | 48 [36–57] |
| Male sex, n (%) | 25 (62.5) |
| Median height (cm) [IQR] | 178 [169–183] |
| Median weight (kg) [IQR] | 87 [73–100] |
| Median body mass index (kg/m2) [IQR] | 28 [24–31] |
| Country of origin, n (%) | |
| Netherlands, n (%) | 36 (90.0) |
| Indonesia, n (%) | 1 (2.5) |
| Turkey, n (%) | 1 (2.5) |
| Netherlands - Indonesia, n (%) | 1 (2.5) |
| Netherlands - Curacao, n (%) | 1 (2.5) |
| Malignant hyperthermia susceptibility confirmed, n (%) | 39 (97.5) |
| Personal history of a malignant hyperthermia reaction, n (%) | 9 (22.5) |
| Personal history of exertional rhabdomyolysis event, n (%) | 6 (15.0) |
| RYR1 variant pathogenic for malignant hyperthermia, n (%) | 36 (90) |
| c.14545G>A, p.Val4849Ile, n (%) | 16 (40.0) |
| c.1021G>A, p.Gly341Arg, n (%) | 5 (12.5) |
| c.6617C>T, p.Thr2206Met, n (%) | 4 (10.0) |
| c.38T>G, p.Leu13Arg, n (%) | 3 (7.5) |
| c.1840C>T, p.Arg614Cys, n (%) | 2 (5.0) |
| c.7300G>A, p.Gly2434Arg, n (%) | 2 (5.0) |
| c.14210G>A, p.Arg4737Gln and c.4178A>G, p.Lys1393Arg (Cis), n (%) | 2 (5.0) |
| c.7361G>A, p.Arg2454His, n (%) | 1 (2.5) |
| c.38T>G, p.Leu13Arg and c.6419G>A, p.Arg2140Gln (Trans), n (%) | 1 (2.5) |
| Other RYR1 variants, n (%) | 4 (10.0) |
| c.1024G>A, p.Glu342Lys, n (%) | 1 (2.5) |
| c.12226C>T, p.Phe4076Leu, n (%) | 1 (2.5) |
| c.10616G>A, p.Arg3539His, n (%) | 1 (2.5) |
| c.6710G>A, p.Cys2237Tyr, n (%) | 1 (2.5) |
Summary of the age, sex, height, weight, body mass index and country of origin of the study participants. The number of malignant hyperthermia and exertional rhabdomyolysis events and RYR1 variants identified in the patients with a history of RYR1-related malignant hyperthermia susceptibility and/or exertional rhabdomyolysis are also listed. The RYR1 variants are categorized as pathogenic for malignant hyperthermia [28] and other variants. IQR = interquartile range. With permission adapted from LR van den Bersselaar et al. [9].
Standardized history of neuromuscular symptoms and physical activity
The standardized questionnaire focusing on neuromuscular symptoms was completed by all 40 participants. A total of 24 (60%) of participants reported (exertional) cramps, myalgia and/or muscle weakness on a daily/weekly basis and were therefore considered symptomatic as summarized in Table 2. Detailed results of this standardized assessment of neuromuscular symptoms have been reported separately [9].
Table 2
Qualitative analysis of muscle ultrasound studies and neuromuscular symptoms from all study participants (n = 40)
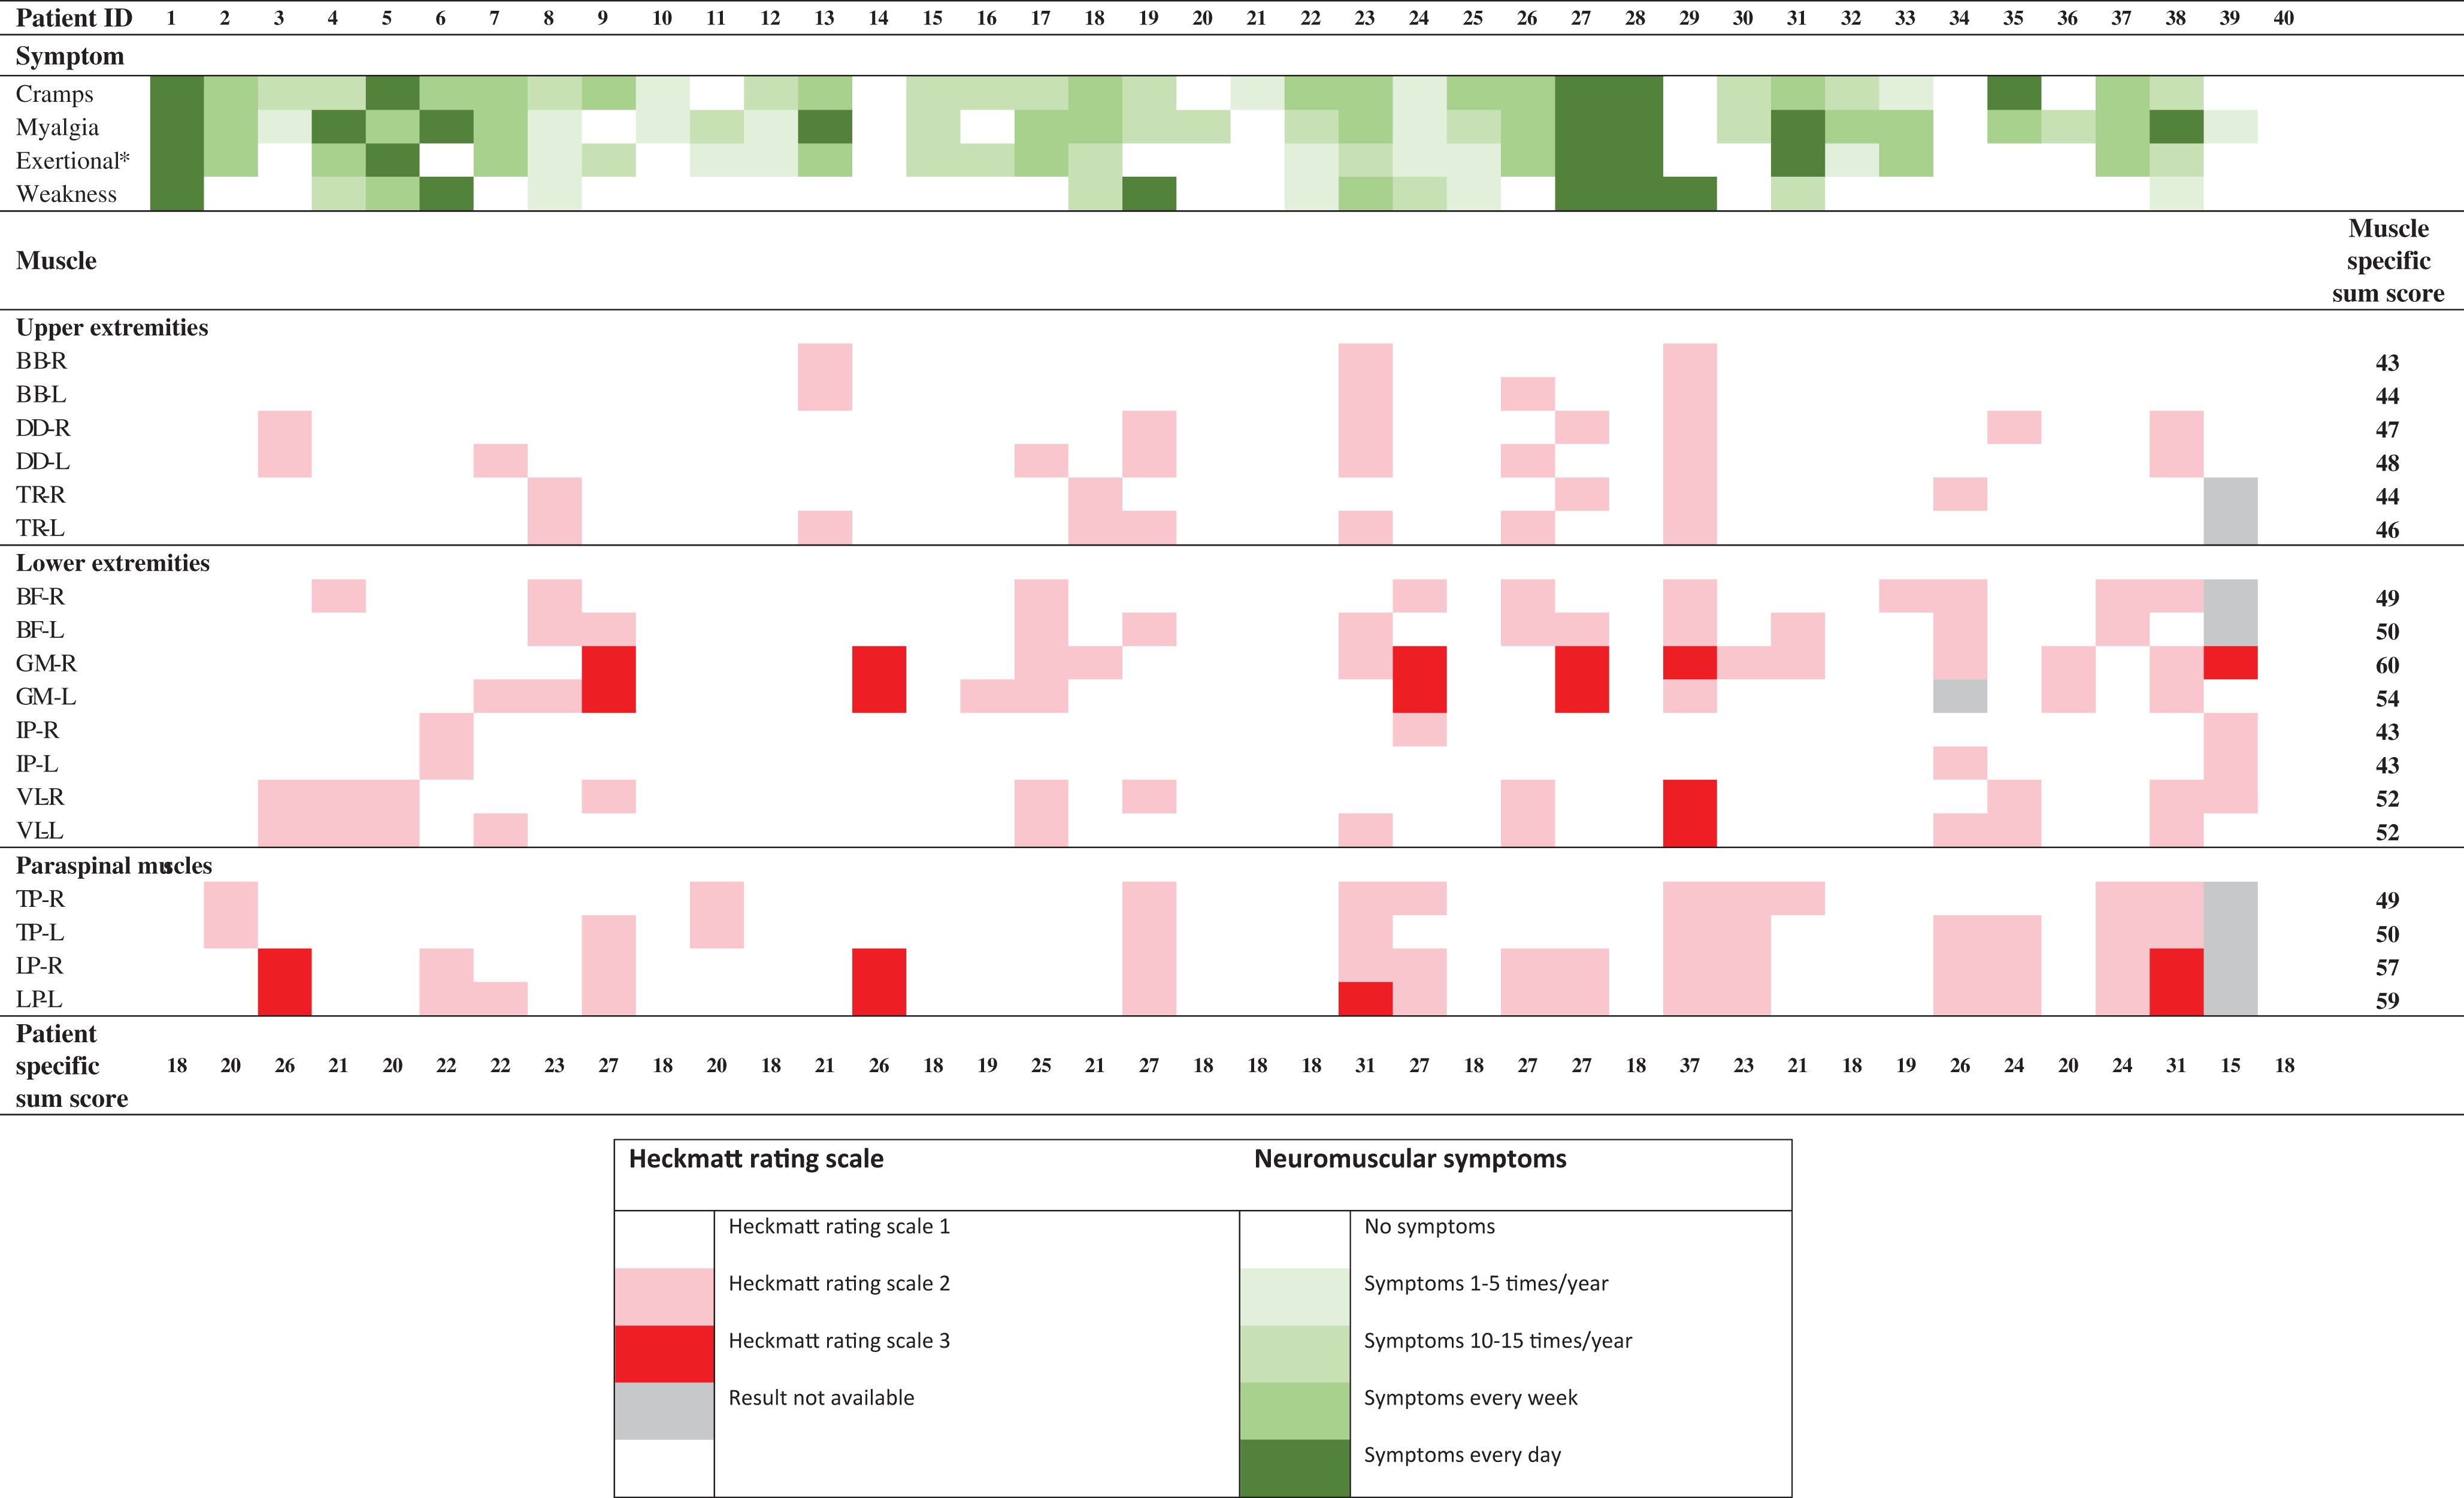
Summary of neuromuscular symptoms, the Heckmatt rating scale, [22] patient specific Heckmatt rating scale sum score and muscle specific Heckmatt rating scale sum score. The patient specific Heckmatt rating scale sum score for patient 34 and patient 40 are incomplete due to missing data. In none of the muscles an Heckmatt rating scale of 4 was reported. The full result of the standardized history of neuromuscular symptoms has been published separately [9]. *Exertional cramps and/or myalgia. BB = biceps brachii; BF = biceps femoris; DD = deltoid; GM = gastrocnemius medial head; HRS = Heckmatt rating scale; IP = Iliopsoas; L = left; LP = lumbar paraspinal; TP = thoracic paraspinal; R = right; TR = Trapezius; VL = vastus lateralis proximalis.
A total of 39 participants complected the international physical activity questionnaire. Activity levels were classified as high in 16 (40%) participants, moderate in 20 (50%) participants and low in 3 (7.5%) participants.
Muscle ultrasound analysis
Muscle ultrasound results were available from 711 muscles from the 40 participants examined. In two participants, a subset of the muscle ultrasound images were missing due to technical errors, protocol omission and/or lost images: the muscle ultrasound image of the left gastrocnemius from one participant was missing, and the muscle ultrasound images of the bilateral trapezius, thoracic and lumbar paraspinals, and biceps femoris from another participant were missing.
Qualitative ultrasound analysis
The median HRS per muscle was 1 (IQR 1 to 1). The median HRS compound score was 21 (IQR 18 to 26). Abnormal muscle ultrasound results (HRS ≥2) were reported in 29 (73%) participants of which most (28 of 29) had abnormal muscle ultrasound results in multiple muscles. Nine (23%) participants had a HRS grade 3 in at least one muscle and 8 of these 9 participants had an HRS grade 3 in multiple muscles. In none of the patients an HRS grade of 4 was reported.
The median muscle specific HRS sum score was 49 (IQR 45 to 52). The three muscles with the highest muscle specific HRS sum scores were the gastrocnemius (muscle specific HRS sum score 60 right- and 54 left-sided), lumbar paraspinals (muscle specific HRS sum score 57 right- and 59 left-sided) and the proximal vastus lateralis (bilateral muscle specific HRS sum score of 52).
Results of the qualitative muscle ultrasound analysis are summarized in Table 2.
Quantitative grayscale analysis
A total of 18 (45%) patients had increased echogenicity (z > 2) in at least one muscle. A total of 49 (7%) muscles had an increased echogenicity. None of the muscles investigated had a mean z score significantly higher compared to 0. The mean z-scores from the biceps femoris (z = –0.48; P < 0.001), gastrocnemius (z = –0.48; P = 0.041) and the vastus lateralis muscles (z = –0.42; P = 0.020) and the sum of all muscles (z = –0.18; P = 0.002) were, however, significantly lower than 0. There were no statically significant differences between left and right-sided muscles. The quantitative grayscale analysis is summarized in Table 3.
Table 3
Muscle ultrasound quantitative grayscale analysis (n = 40)
| Muscle | Echogenicity Mean Z-score±SD | P-value* | Number of muscles with an abnormal Z-score (>2) n, (%) |
| Biceps brachii (n = 80) | –0.44 (±2.08) | 0.062 | 6 (7.5) |
| Biceps femoris (n = 78) | –0.48 (±0.93) | <0.001 | 0 (0.0) |
| Deltoid (n = 80) | 0.01 (±1.34) | 0.940 | 6 (7.5) |
| Gastrocnemius (medial head) (n = 79) | –0.48 (±1.96) | 0.041 | 10 (12.7) |
| Iliopsoas (n = 80) | –0.01 (±1.43) | 0.975 | 8 (10.0) |
| Lumbar paraspinals (n = 78) | 0.16 (±1.39) | 0.307 | 8 (10.2) |
| Thoracic paraspinals (n = 78) | 0.04 (±1.41) | 0.779 | 5 (6.4) |
| Trapezius (n = 78) | –0.01 (±1.45) | 0.895 | 3 (3.8) |
| Vastus lateralis (proximal) (n = 80) | –0.42 (±1.59) | 0.020 | 3 (3.8) |
| Sum muscles (n = 711) | –0.18 (±1.56) | 0.002 | 49 (6.7) |
Muscle ultrasound quantitative grayscale analysis in individual muscles measured bilaterally and all nine muscles combined from all study participants (n = 40). *Z-scores were compared to 0 using the one sample t-test.
According to the muscle ultrasound screening protocol that was developed for pediatric patients suspected of a neuromuscular disorder and that is also used to screen adults clinically at our center [31, 32], 15 (38%) participants would have had an abnormal muscle ultrasound screening result (i.e. would have been identified as neuromuscular patients based on the standard ultrasound screening), 4 (10%) participants had a borderline muscle ultrasound screening result, and 21 (53%) participants had a normal muscle ultrasound screening result (Supplementary Figure 3).
Quantitative muscle thickness analysis
Abnormal muscle thickness z-scores were identified in muscles from 34 participants (85%). A total of 50 (7%) muscles had abnormal z-scores of which 8 were atrophic (z < 2) and 42 were hypertrophic (z > 2). For none of the muscles included in the study protocol the mean z-scores were statistically significant lower compared to 0. The mean z-scores of the biceps brachii (z = 1.45; P < 0.001), biceps femoris (z = 0.43; P = 0.002), deltoid (z = 0.31; P = 0.009), trapezius (z = 0.38; P = 0.010) and the sum of all muscles (z = 0.40; P < 0.001) were significantly higher compared to 0, indicating hypertrophy. There were no statically significant differences between left and right-sided muscles. The quantitative muscle thickness analysis is summarized in Table 4. Echogenicity was negatively correlated with muscle thickness (r = –0.337; P < 0.001).
Table 4
Muscle ultrasound thickness analysis (n = 40)
| Muscle | Muscle thickness Mean Z-score ±SD | P-value* | Number of muscles with Z-score <2 n, (%) | Number of muscles with Z-score >2 n, (%) Biceps |
| brachii (n = 80) | 1.45 (±1.24) | <0.001 | 0 (0.0) | 6 (7.5) |
| Biceps femoris (n = 78) | 0.43 (±1.21) | 0.002 | 0 (0.0) | 0 (0.0) |
| Deltoid (n = 80) | 0.31 (±1.02) | 0.009 | 0 (0.0) | 6 (7.5) |
| Gastrocnemius (medial head) (n = 79) | 0.34 (±1.57) | 0.057 | 2 (2.5) | 9 (11.4) |
| Iliopsoas (n = 80) | 0.18 (±1.27) | 0.212 | 2 (2.5) | 6 (7.5) |
| Lumbar paraspinals (n = 78) | 0.13 (±1.60) | 0.481 | 2 (2.6) | 8 (10.3) |
| Thoracic paraspinals (n = 78) | 0.15 (±1.18) | 0.268 | 2 (2.6) | 3 (3.8) |
| Trapezius (n = 78) | 0.38 (±1.28) | 0.010 | 0 (0.0) | 3 (3.8) |
| Vastus lateralis (proximal) (n = 80) | 0.19 (±1.06) | 0.119 | 0 (0.0) | 1 (1.3) |
| Sum muscles (n = 711) | 0.40 (±1.33) | <0.001 | 8 (1.1) | 42 (5.9) |
Muscle ultrasound thickness analysis in individual muscles measured bilaterally and all nine muscles combined from all study participants (n = 40). *Z-scores were compared to 0 using the one sample t-test.
Correlation of neuromuscular symptoms to muscle ultrasound abnormalities
In the subgroup of symptomatic patients (n = 24), all 432 muscle ultrasound images were available.
Qualitative ultrasound analysis
Of the 24 symptomatic participants, 19 (79%) had an abnormal qualitative muscle ultrasound result. The median patient specific HRS sum score in the symptomatic patients was 22 (IQR 19 to 27). Of the 16 asymptomatic patients, 10 (63%) had an abnormal qualitative muscle ultrasound result. The median patient specific HRS sum score in the subgroup of symptomatic patients was 20 (IQR 18 to 25). The proportion of symptomatic patients with an abnormal result (79%) was not significantly higher compared to the proportion of asymptomatic patients with an abnormal MUS result (63%) (P = 0.247). The median HRS sum score in the subgroup of symptomatic patients (22; IQR 19 to 27) was not significantly higher compared to the median HRS sum score in the subgroup of asymptomatic patients (20; IQR 18 to 25) (P = 0.093). The results of the qualitative analysis and neuromuscular symptoms in these patients are presented in Table 2.
Quantitative grayscale analysis
In the subgroup of symptomatic participants (n = 24), none of the mean z-scores were statistically significant increased. The mean z-scores from the biceps femoris (P < 0.013), gastrocnemius (P = 0.028) were significantly decreased (i.e. lower than 0). The quantitative grayscale analysis in the subgroup of symptomatic patients is summarized in Table 5.
Table 5
Muscle ultrasound quantitative grayscale in symptomatic from 24 participants measured bilaterally
| Muscle | Echogenicity Mean Z-score±SD | P-value* | Number of muscles with an abnormal Z-score (>2) n, (%) |
| Biceps brachii (n = 48) | –0.09 (±2.30) | 0.748 | 6 (12.5) |
| Biceps femoris (n = 48) | –0.37 (±0.99) | 0.013 | 0 (0.0) |
| Deltoid (n = 48) | 0.19 (±1.42) | 0.364 | 5 (10.4) |
| Gastrocnemius (medial head) (n = 48) | –0.57 (±1.74) | 0.028 | 5 (10.4) |
| Iliopsoas (n = 48) | 0.15 (±1.30) | 0.434 | 6 (12.5) |
| Lumbar paraspinals (n = 48) | 0.29 (±1.39) | 0.149 | 5 (10.4) |
| Thoracic paraspinals (n = 48) | 0.24 (±1.37) | 0.239 | 5 (10.4) |
| Trapezius (n = 48) | 0.26 (±1.44) | 0.216 | 3 (6.3) |
| Vastus lateralis (proximal) (n = 48) | –0.04 (±1.81) | 0.886 | 3 (6.3) |
| Sum muscles (n = 432) | 0.01 (±1.58) | 0.939 | 38 (8.8) |
Muscle ultrasound quantitative grayscale analysis in individual muscles measured bilaterally and all nine muscles combined in symptomatic participants (n = 24). *Z-scores were compared to 0 using the one sample t-test.
According to the muscle ultrasound screening protocol described above [31, 32], 11 of 24 (46%) symptomatic participants had an abnormal muscle ultrasound screening result, 3 (13%) had a borderline muscle ultrasound result and 10 (42%) had a normal muscle ultrasound result. Of the 16 asymptomatic participants, 4 (25%) had an abnormal muscle ultrasound result, 1 (6%) had a borderline muscle ultrasound result and 11 (69%) had a normal muscle ultrasound result. The proportion of symptomatic participants with an abnormal result (46%) was not significantly higher compared to the proportion of asymptomatic participants with an abnormal muscle ultrasound result (25%) (P = 0.182).
Late-onset proximal muscle weakness and muscle ultrasound abnormalities
From the participants included in the present study, three participants suffered from late-onset muscle weakness as outlined in detail before [9]. Muscle ultrasound results in these participants were variable. One of them had a completely normal qualitative (Table 2, participant 1) and quantitative muscle ultrasound assessment. The second had a normal quantitative muscle ultrasound result but an abnormal qualitative muscle ultrasound result. The gastrocnemius bilaterally had an HRS of 3. The bilateral lumbar paraspinals, left biceps femoris, right deltoid and the right trapezius had an HRS of 2 (Table 2, participant 27). The third participant with late-onset proximal muscle weakness had an abnormal qualitative muscle ultrasound result in 16 out of 18 examined muscles, the iliopsoas was the only muscle with a bilaterally normal qualitative muscle ultrasound result (Table 2, participant 29). The quantitative muscle ultrasound showed a marked increased echogenicity with elevated z-scores of the bilateral biceps brachii (7.30 and 7.60), deltoid (2.70 and 4.20), vastus lateralis (4.90 and 7.40), gastrocnemius (2.60 and 4.00) and unilateral trapezius (2.30), thoracic paraspinals (2.40) and lumbar paraspinals (2.70).
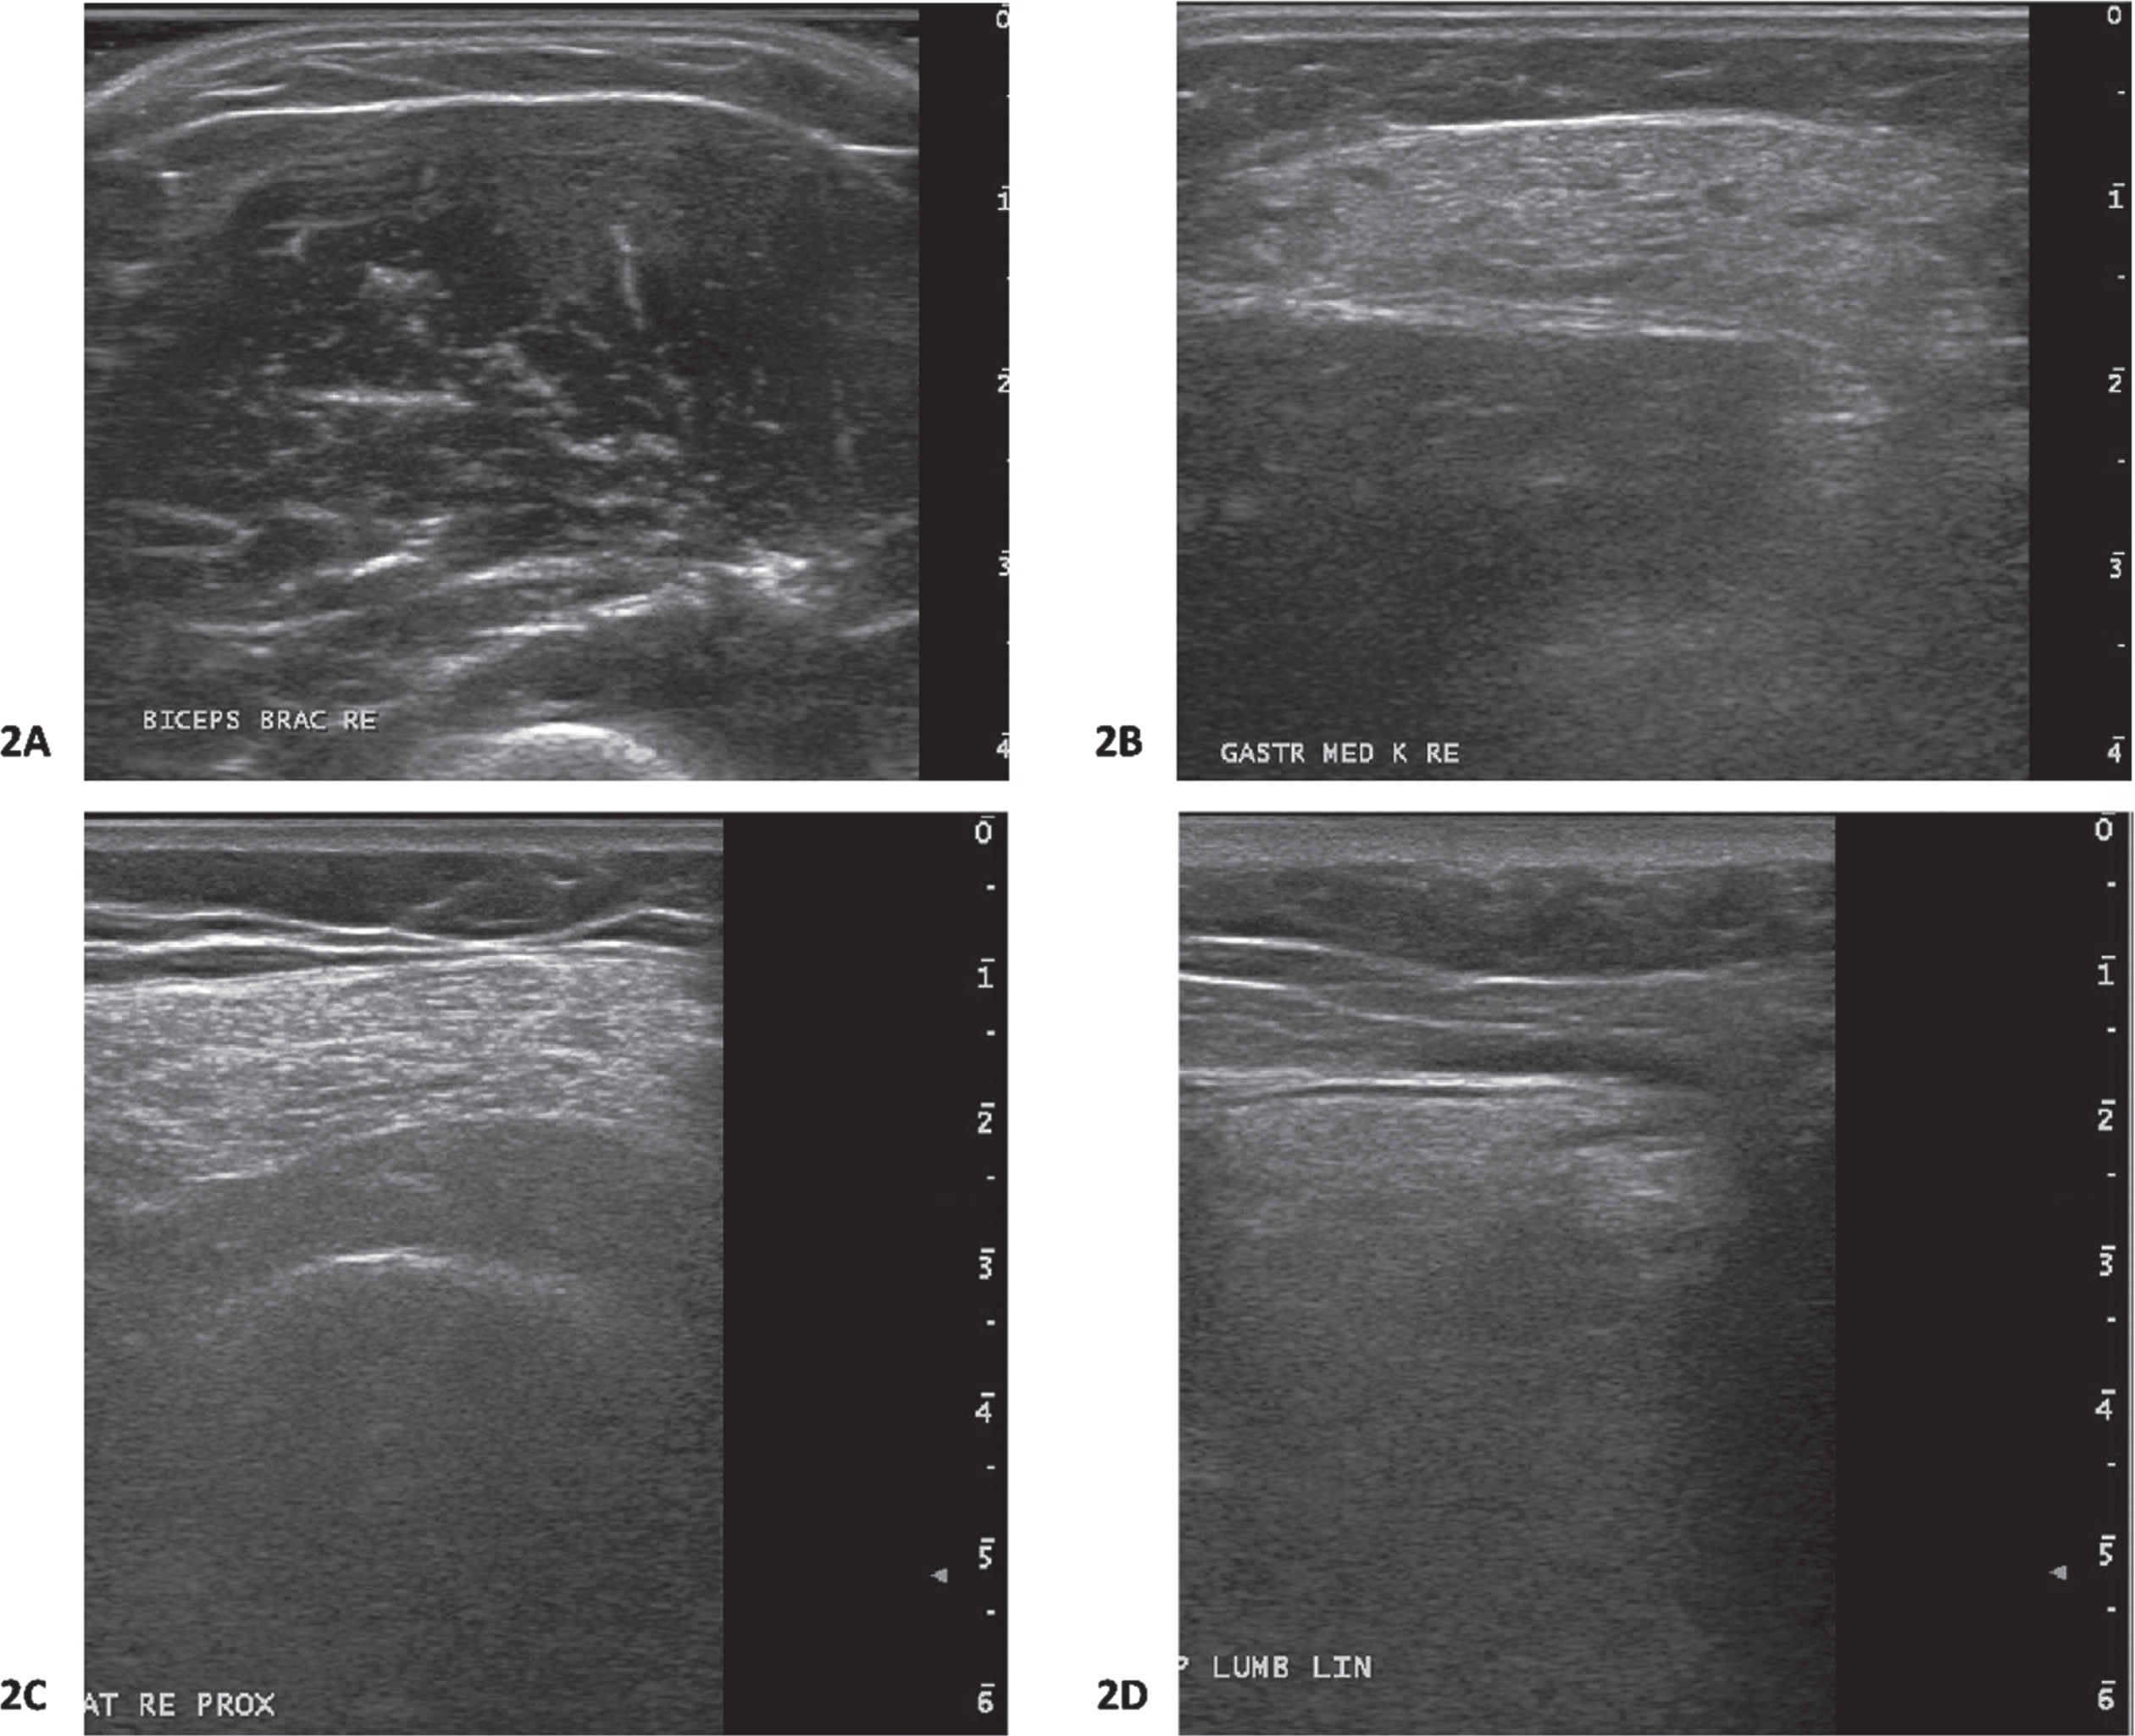
Muscle ultrasound images of participants with and without late-onset muscle proximal weakness are shown in Fig. 2.
Fig. 2
Muscle ultrasound images from participants. 2A: Biceps brachii muscle ultrasound image from a participants with late-onset proximal muscle weakness. This muscle ultrasound image shows normal echogenicity (Heckmatt rating scale(22) 1; z-score –3.7). The z-score for muscle thickness was 1.5. This participants carries the RYR1 c.12226C>T, p.Phe4076Leu variant. 2B: Gastrocnemius muscle ultrasound image from a participant with late-onset proximal muscle weakness. This muscle ultrasound image shows increased echogenicity (Heckmatt rating scale 3;(22) z-score 4.0). The z-score for muscle thickness was –1.2. This participants carries the RYR1 c.10616G>A, p.Arg3539His variant. This gastrocnemius muscle ultrasound image is from the same participant whose proximal vastus lateralis muscle ultrasound image is shown in Fig. 2C. 2C: Proximal vastus lateralis muscle ultrasound image from a participant with late-onset proximal muscle weakness. This muscle ultrasound image shows an increased echogenicity (Heckmatt rating scale 3;(22) z-score 7.4). The z-score for muscle thickness was –1.5. This participants carries the RYR1 c.10616G>A, p.Arg3539His variant. This proximal vastus lateralis muscle ultrasound image is from the same participant whose gastrocnemius muscle ultrasound image is shown in Fig. 2B. 2D: Paraspinal lumbar muscle ultrasound image from a participant with symptoms of cramps and myalgia. This muscle ultrasound image shows an increased echogenicity (Heckmatt rating scale 3;(22) z-score 3.1). The z-score for muscle thickness was –1.5. This participants carries the RYR1 c.1021G>A, Gly341Arg variant.
DISCUSSION
Our findings demonstrate that a significant proportion of individuals carrying MH-associated gain-of-function RYR1 variants do have both quantitative and visual muscle ultrasound abnormalities. The gastrocnemius, proximal vastus lateralis and thoracic and lumbar paraspinals most frequently showed an increased echogenicity. Another important finding is that muscles from MH susceptible individuals often have an increased muscle thickness, indicating muscle hypertrophy.
Increased echogenicity was not limited to muscles of MH susceptible participants with symptoms of cramps, myalgia and/or muscle weakness, but was also identified in asymptomatic participants (37.5% in the qualitative and 25% in the quantitative assessment). The grayscale analysis might have been affected by muscle hypertrophy. Muscle hypertrophy is known to result in an increased muscle to fascia ratio leading to a decrease in the grayscale, which is reflected by the negative correlation of echogenicity with muscle thickness in our study (r = –0.337; P < 0.001).
The findings in our study are in line with previous studies performed in selected cohorts of individuals with MH-associated RYR1 variants and relevant animal models. For instance, muscle hypertrophy has previously been reported in cases series utilizing CT and MRI studies in MH susceptible individuals with neuromuscular symptoms [2, 8]. Furthermore, MH susceptibility and the occurrence of an MH reaction have been associated with a muscular body build in human [39, 40] and in porcine MH models [41].
The high proportion of patients with muscle ultrasound abnormalities in the thoracic and lumbar paraspinals is particularly interesting in the light of previously reported late-onset axial weakness, back pain and MRI abnormalities in paraspinal muscles related to RYR1 variants [12, 42]. Furthermore, involvement of the gastrocnemius and vastus lateralis muscles as demonstrated in the present study, is similar to the pattern of muscle involvement in previous muscle MRI studies in patients with RYR1-related congenital myopathies [15, 16].
Previous studies on muscle ultrasound in MH susceptible individuals have reported mixed results. Increased echogenicity in muscles of the lower extremities has been reported using a qualitative approach [43], however, this could not be reproduced [44]. Nevertheless, both studies were designed to study the usefulness of muscle ultrasound as a non-invasive test to diagnose MH susceptibility and did not use a quantitative analysis, a broad screening protocol, nor take neuromuscular symptoms into account.
Our study has a number of limitations. The grayscale and muscle thickness results in our study were compared to muscle specific reference values from healthy controls in whom RYR1 sequencing was not performed. Therefore, it is theoretically possible that those controls carried unidentified RYR1 variants. However, taking into account the low prevalence of RYR1 gain-of-function variants [45], this has probably not had a major effect on our results. Furthermore, in the standardized neuromuscular history, we did not ask to localize neuromuscular symptoms such as cramps and myalgia and are therefore unable to correlate each individual symptom to specific muscle ultrasound abnormalities. Finally, we did include only one family member per family which may have resulted in selection bias, as individuals most affected by neuromuscular symptoms could be more inclined to reach out to the study team first.
Our observations do have important implications for the diagnosis and management of MH susceptible individuals carrying gain-of-function RYR1 variants. Firstly, neurologists and other professionals involved in follow-up and management of MH-susceptible individuals ought to be aware that muscle ultrasound abnormalities can be part of the MH disease spectrum, and are not necessarily an expression of concomitant other neuromuscular pathology. This might help to reduce unnecessary, and sometimes invasive investigations that are frequently performed in an attempt to diagnose an additional pathology [9]. Secondly, in this particular patient category, muscle ultrasound abnormalities do not necessarily correlate with the severity of symptoms of myalgia, muscle cramps and/or muscle weakness, and may occur in those with more severe symptoms, such as late-onset muscle weakness.
CONCLUSION
Individuals with RYR1 variants resulting in MH susceptibility and/or ERM often have muscle ultrasound abnormalities. Frequently observed muscle ultrasound abnormalities include muscle hypertrophy and increased echogenicity. Muscle ultrasound abnormalities were identified in patients with symptoms of cramps, myalgia and/or muscle weakness, but also in those without neuromuscular symptoms.
ACKNOWLEDGMENTS
The authors are grateful to all study participants and to the Canisius Wilhelmina –Radboudumc regional junior research funds for their financial support. Several authors of this publication are members of the Netherlands Neuromuscular Center (NL - NMD) and the European Reference Network for rare neuromuscular diseases (EURO-NMD).
FUNDING
This research was performed with the financial support of the Canisius-Wilhelmina Hospital –Radboudumc regional junior research funds. The Radboudumc and Canisius Wilhelmina Hospital were not involved in the study design, data collection, data analysis and/or writing of this manuscript.
CONFLICT OF INTEREST
Nens van Alfen acted as a muscle ultrasound consultant for Dynacure and performs editorial duties for Wiley Publishing Inc.; all payments go to their employer.
SUPPLEMENTARY MATERIAL
[1] The supplementary material is available in the electronic version of this article: https://dx.doi.org/10.3233/JND-230018.
REFERENCES
[1] | Jungbluth H , Treves S , Zorzato F , Sarkozy A , Ochala J , Sewry C , et al. Congenital myopathies: Disorders of excitation-contraction coupling and muscle contraction. Nat Rev Neurol. (2018) ;14: (3):151–67. |
[2] | Dlamini N , Voermans NC , Lillis S , Stewart K , Kamsteeg EJ , Drost G , et al. Mutations in RYR1 are a common cause of exertional myalgia and rhabdomyolysis. Neuromuscul Disord. (2013) ;23: (7):540–8. |
[3] | Kruijt N , van den Bersselaar LR , Kamsteeg EJ , Verbeeck W , Snoeck MMJ , Everaerd DS , et al. The etiology of rhabdomyolysis: An interaction between genetic susceptibility and external triggers. Eur J Neurol. (2021) ;28: (2):647–59. |
[4] | Kruijt N , den Bersselaar LV , Snoeck M , Kramers K , Riazi S , Bongers C , et al. RYR1-related rhabdomyolysis: A spectrum of hypermetabolic states due to ryanodine receptor dysfunction. Curr Pharm Des. (2022) ;28: (1):2–14. |
[5] | van den Bersselaar LR , Hellblom A , Gashi M , Kamsteeg EJ , Voermans NC , Jungbluth H , et al. Referral indications for malignant hyperthermia susceptibility diagnostics in patients without adverse anesthetic events in the era of next-generation sequencing. Anesthesiology. (2022) ;136: (6):940–53. |
[6] | Snoeck M , van Engelen BG , Küsters B , Lammens M , Meijer R , Molenaar JP , et al. RYR1-related myopathies: A wide spectrum of phenotypes throughout life. Eur J Neurol. (2015) ;22: (7):1094–112. |
[7] | Rosenberg H , Pollock N , Schiemann A , Bulger T , Stowell K . Malignant hyperthermia: A review. Orphanet J Rare Dis. (2015) ;10: :93. |
[8] | Witting N , Laforêt P , Voermans NC , Roux-Buisson N , Bompaire F , Rendu J , et al. Phenotype and genotype of muscle ryanodine receptor rhabdomyolysis-myalgia syndrome. Acta Neurol Scand. (2018) ;137: (5):452–61. |
[9] | van den Bersselaar LR , Jungbluth H , Kruijt N , Kamsteeg EJ , Fernandez-Garcia MA , Treves S , et al. Neuromuscular symptoms in patients with RYR1-related malignant hyperthermia and rhabdomyolysis. Brain Communications. (2022) ;4: (6). |
[10] | Riazi S , Bersselaar L , Islander G , Heytens L , Snoeck MMJ , Bjorksten A , et al. Pre-operative exercise and pyrexia as modifying factors in malignant hyperthermia (MH). Neuromuscul Disord. 2022. |
[11] | van Ruitenbeek E , Custers JAE , Verhaak C , Snoeck M , Erasmus CE , Kamsteeg EJ , et al. Functional impairments, fatigue and quality of life in RYR1-related myopathies: A questionnaire study. Neuromuscul Disord. (2019) ;29: (1):30–8. |
[12] | Løseth S , Voermans NC , Torbergsen T , Lillis S , Jonsrud C , Lindal S , et al. A novel late-onset axial myopathy associated with mutations in the skeletal muscle ryanodine receptor (RYR1) gene. J Neurol. (2013) ;260: (6):1504–10. |
[13] | Lopez RJ , Byrne S , Vukcevic M , Sekulic-Jablanovic M , Xu L , Brink M , et al. An RYR1 mutation associated with malignant hyperthermia is also associated with bleeding abnormalities. Sci Signal. (2016) ;9: (435):ra68. |
[14] | Knuiman GJ , Küsters B , Eshuis L , Snoeck M , Lammens M , Heytens L , et al. The histopathological spectrum of malignant hyperthermia and rhabdomyolysis due to RYR1 mutations. J Neurol. (2019) ;266: (4):876–87. |
[15] | Jungbluth H , Davis MR , Müller C , Counsell S , Allsop J , Chattopadhyay A , et al. Magnetic resonance imaging of muscle in congenital myopathies associated with RYR1 mutations. Neuromuscul Disord. (2004) ;14: (12):785–90. |
[16] | Klein A , Jungbluth H , Clement E , Lillis S , Abbs S , Munot P , et al. Muscle magnetic resonance imaging in congenital myopathies due to ryanodine receptor type 1 gene mutations. Arch Neurol. (2011) ;68: (9):1171–9. |
[17] | O’Connor TN , van den Bersselaar LR , Chen YS , Nicolau S , Simon B , Huseth A , et al. RYR-1-related diseases international research workshop: From mechanisms to treatments pittsburgh, PA, USA. J Neuromuscul Dis. 2022. |
[18] | Wijntjes J , van Alfen N . Muscle ultrasound: Present state and future opportunities. Muscle Nerve. (2021) ;63: (4):455–66. |
[19] | Pillen S , van Alfen N , Zwarts MJ . Muscle ultrasound: A grown-up technique for children with neuromuscular disorders. Muscle Nerve. (2008) ;38: (3):1213–4. |
[20] | Mul K , Horlings CGC , Vincenten SCC , Voermans NC , van Engelen BGM , van Alfen N . Quantitative muscle MRI and ultrasound for facioscapulohumeral muscular dystrophy: Complementary imaging biomarkers. J Neurol. (2018) ;265: (11):2646–55. |
[21] | Mah JK , van Alfen N . Neuromuscular ultrasound: Clinical applications and diagnostic values. Can J Neurol Sci. (2018) ;45: (6):605–19. |
[22] | Heckmatt JZ , Leeman S , Dubowitz V . Ultrasound imaging in the diagnosis of muscle disease. J Pediatr. (1982) ;101: (5):656–60. |
[23] | Pillen S , van Keimpema M , Nievelstein RA , Verrips A , van Kruijsbergen-Raijmann W , Zwarts MJ . Skeletal muscle ultrasonography: Visual versus quantitative evaluation. Ultrasound Med Biol. (2006) ;32: (9):1315–21. |
[24] | de Souza A . Adult-onset selective quadriceps femoris weakness in RYR1-related myopathy. Neurol Sci. (2022) ;43: (5):3453–5. |
[25] | van den Bersselaar LR , Kruijt N , Scheffer GJ , van Eijk L , Malagon I , Buckens S , et al. The neuromuscular and multisystem features of RYR1-related malignant hyperthermia and rhabdomyolysis: A study protocol. Medicine (Baltimore). (2021) ;100: (33):e26999. |
[26] | Hopkins PM , Rüffert H , Snoeck MM , Girard T , Glahn KP , Ellis FR , et al. European Malignant Hyperthermia Group guidelines for investigation of malignant hyperthermia susceptibility. Br J Anaesth. (2015) ;115: (4):531–9. |
[27] | Scalco RS , Snoeck M , Quinlivan R , Treves S , Laforét P , Jungbluth H , et al. Exertional rhabdomyolysis: Physiological response or manifestation of an underlying myopathy? BMJ Open Sport Exerc Med. (2016) ;2: (1):e000151. |
[28] | Johnston JJ , Dirksen RT , Girard T , Gonsalves SG , Hopkins PM , Riazi S , et al. Variant curation expert panel recommendations for RYR1 pathogenicity classifications in malignant hyperthermia susceptibility. Genet Med. (2021) ;23: (7):1288–95. |
[29] | Little J , Higgins JP , Ioannidis JP , Moher D , Gagnon F , von Elm E , et al. STrengthening the REporting of Genetic Association Studies (STREGA): An extension of the STROBE statement. PLoS Med. (2009) ;6: (2):e22. |
[30] | Craig CL , Marshall AL , Sjöström M , Bauman AE , Booth ML , Ainsworth BE , et al. International physical activity questionnaire: 12-country reliability and validity. Med Sci Sports Exerc. (2003) ;35: (8):1381–95. |
[31] | Boon AJ , Wijntjes J , O’Brien TG , Sorenson EJ , Cazares Gonzalez ML , van Alfen N . Diagnostic accuracy of gray scale muscle ultrasound screening for pediatric neuromuscular disease. Muscle Nerve. (2021) ;64: (1):50–8. |
[32] | Pillen S , Verrips A , van Alfen N , Arts IM , Sie LT , Zwarts MJ . Quantitative skeletal muscle ultrasound: Diagnostic value in childhood neuromuscular disease. Neuromuscul Disord. (2007) ;17: (7):509–16. |
[33] | White R , Schiemann AH , Burling SM , Bjorksten A , Bulger T , Gillies R , et al. Functional analysis of RYR1 variants in patients with confirmed susceptibility to malignant hyperthermia. Br J Anaesth. 2022. |
[34] | Group EMH . Diagnostic MH Mutations [Available from: https://www.emhg.org/diagnostic-mutations. |
[35] | Group EMH . A protocol for the investigation of malignant hyperpyrexia (MH) susceptibility. The European Malignant Hyperpyrexia Group. Br J Anaesth. (1984) ;56: (11):1267–9. |
[36] | Fridriksdottir R , Jonsson AJ , Jensson BO , Sverrisson KO , Arnadottir GA , Skarphedinsdottir SJ , et al. Sequence variants in malignant hyperthermia genes in Iceland: Classification and actionable findings in a population database. Eur J Hum Genet. (2021) ;29: (12):1819–24. |
[37] | Klingler W , Heiderich S , Girard T , Gravino E , Heffron JJ , Johannsen S , et al. Functional and genetic characterization of clinical malignant hyperthermia crises: A multi-centre study. Orphanet J Rare Dis. (2014) ;9: :8. |
[38] | Ioannidis NM , Rothstein JH , Pejaver V , Middha S , McDonnell SK , Baheti S , et al. REVEL: An ensemble method for predicting the pathogenicity of rare missense variants. Am J Hum Genet. (2016) ;99: (4):877–85. |
[39] | Burkman JM , Posner KL , Domino KB . Analysis of the clinical variables associated with recrudescence after malignant hyperthermia reactions. Anesthesiology. (2007) ;106: (5):901–6; quiz 1077-8. |
[40] | Butala B , Brandom B . Muscular body build and male sex are independently associated with malignant hyperthermia susceptibility. Can J Anaesth. (2017) ;64: (4):396–401. |
[41] | Fujii J , Otsu K , Zorzato F , de Leon S , Khanna VK , Weiler JE , et al. Identification of a mutation in porcine ryanodine receptor associated with malignant hyperthermia. Science. (1991) ;253: (5018):448–51. |
[42] | Jungbluth H , Lillis S , Zhou H , Abbs S , Sewry C , Swash M , et al. Late-onset axial myopathy with cores due to a novel heterozygous dominant mutation in the skeletal muscle ryanodine receptor (RYR1) gene. Neuromuscul Disord. (2009) ;19: (5):344–7. |
[43] | von Rohden L , Steinbicker V , Krebs P , Wiemann D , Köditz H . The value of ultrasound for the diagnosis of malignant hyperthermia. J Ultrasound Med. (1990) ;9: (5):291–5. |
[44] | Antognini JF , Anderson M , Cronan M , McGahan JP , Gronert GA . Ultrasonography: Not useful in detecting susceptibility to malignant hyperthermia. J Ultrasound Med. (1994) ;13: (5):371–4. |
[45] | Karczewski KJ , Francioli LC , Tiao G , Cummings BB , Alföldi J , Wang Q , et al. The mutational constraint spectrum quantified from variation in 141,456 humans. Nature. (2020) ;581: (7809):434–43. |


