
Full-Length SMN Transcript in Extracellular Vesicles as Biomarker in Individuals with Spinal Muscular Atrophy Type 2 Treated with Nusinersen
Abstract
Background:
Three therapeutic strategies have radically changed the therapeutic scenario for spinal muscular atrophy (SMA). However, therapeutic response differs between individuals. There is a need to identify biomarkers to further assess therapeutic response and to better understand which variables determine the extent of response.
Methods:
We conducted a study using an optimized digital droplet PCR-based method for the ultra-sensitive detection of SMN transcript in serum EVs from SMA 2 individuals treated with nusinersen over 14 months. In parallel, we investigated levels of serum and CSF neurofilament heavy chain (pNF-H) in the same cohort.
Results:
Expression of flSMN transcript in EVs of SMA 2 individuals prior to nusinersen was lower than in controls (0.40 vs 2.79 copies/ul; p < 0.05) and increased after 14 months of nusinersen (0.40 vs 1.11 copies/ul; p < 0.05). The increase in flSMN with nusinersen was significantly higher in younger individuals (p < 0.05). Serum pNF-h was higher in non-treated individuals with SMA 2 than in controls (230.72 vs 22.88 pg/ml; p < 0.05) and decreased with nusinersen (45.72 pg/ml at 6 months, 39.02 pg/ml at 14 months). CSF pNF-h in SMA 2 individuals also decreased with nusinersen (248.04 pg/ml prior to treatment, 197.10 pg/dl at 2 months, 104.43 pg/dl at 6 months, 131.03 pg/dl at 14 months).
Conclusions:
We identified an increase of flSMN transcript in serum EVs of SMA 2 individuals treated with nusinersen that was more pronounced in the younger individuals. Our results indicate that flSMN transcript expression in serum EVs is a possible biomarker in SMA to predict or monitor the response to treatment.
1INTRODUCTION
Spinal muscular atrophy (SMA) is an autosomal recessive neuromuscular disease resulting from the progressive degeneration of motor neurons. It is caused by the homozygous deletions of exon 7 and less frequently by point mutations in SMN1, resulting in a deficient and unstable SMN protein [1]. This deficiency leads to muscle wasting, weakness, and feeding and respiratory difficulties [2]. The paralogous gene SMN2 is present in a variable copy number and encodes an unstable and dysfunctional protein lacking exon 7 (SMNΔ7) but also a small amount of functional full-length SMN protein (flSMN) [3]. SMA is classified into three main types according to age at onset and the maximal motor ability achieved by untreated individuals: children with SMA type 1 are unable to sit unsupported and most of them die before the age of 2 years; individuals with SMA type 2 achieve the ability to sit but never walk, and individuals with SMA type 3 achieve the ability to walk [2, 4].
Three therapeutic strategies for SMA (nusinersen, risdiplam and onasemnogene abeparvovec) have showed an unequivocal efficacy when administered early in young patients [5–10], not being so easy to assess clinical response when treatments are administered in older patients with a longer disease duration [11–13], nor to compare the efficacy between the three therapies [2, 14]. Despite some observational studies has showed an overall favorable response to nusinersen in older patients [15], it is increasingly evident that patients respond differently [16]. Accurate assessment of therapeutic response using functional motor scales in elderly patients is often not possible due to the existence of a floor effect which makes it very difficult to assess individual response in patients with long-duration SMA [17]. Identifying reliable biomarkers to better measure the response of each patient to nusinersen and to better understand the variables that determine the response is highly desirable.
Apart from the SMN2 copy number and less frequent genetic modifiers [18, 19], only few laboratory biomarkers such as neurofilaments (peripheral neurofilament light chain [pNF-L] [20], peripheral neurofilament heavy chain [pNF-H]) [21, 22], microRNAs [16], and cathepsin D [23] are available for SMA [24–28]. Although protein levels of SMN and mRNA measured from blood are convenient to obtain, they do not necessarily reflect the biological mechanisms occurring at the motor neuron [29–34]. Endogenous SMN levels differed between tissue types and levels in peripheral blood are generally lower than those of motor neurons [35], which means that SMN levels measured in peripheral blood may not be sensitive enough to reflect significant changes in motor neurons.
Extracellular vesicles (EVs) play a key role in intercellular communication by transporting nucleic acids, lipids and proteins through the systemic circulation to distant organs in a stable form that is protected from degradation until they are easily taken up by target cells [36, 37]. EVs are able to cross the blood-brain barrier from the brain to the bloodstream and vice versa [38] and neuronal-derived EVs containing different proteins have proven to be useful biomarkers in neurodegenerative disorders such as Alzheimer’s disease and frontotemporal dementia [39, 40]. Although SMN protein is known to be detectable in exosomes isolated from human serum and a reduction in the amount of SMN protein in exosomes was observed in a patient with SMA Type 3 compared to a normal control [41], SMN transcripts within EVs have not been systematically investigated in individuals with SMA.
To further assess the role of SMN transcripts in EVs as biomarkers in SMA, we here conducted a study using an optimized digital droplet PCR-based method for the ultra-sensitive detection of SMN transcripts in EVs in both serum and CSF from patients with SMA 2 treated with nusinersen over a follow-up period of 14 months. In parallel, we investigated pNF-H, another promising biomarker for SMA, in the same cohort.
Our data reveals the differential expression of SMN transcripts in serum EVs in response to nusinersen treatment in individuals with SMA type 2 and highlights the potential application of SMN transcripts in serum EVs as biomarkers for SMA.
2METHODS
2.1Study design and patients
We performed a prospective study to determine possible biomarkers in serum and CSF samples of SMA patients under intrathecal treatment with nusinersen. The study was conducted at Hospital Sant Joan de Déu in Barcelona, Spain and approved by the Clinical Ethics Committee of Hospital Sant Joan de Déu (PIC-142-20). Inclusion criteria were (i) genetic diagnosis of SMA, (ii) clinical diagnosis of SMA type 2, and (iii) treatment with nusinersen.
All 14 individuals (7 females and 7 males) had a SMA type 2 (11 individuals with SMA type 2a and 4 with SMA type 2b) caused by a homozygous deletion in SMN1 gene. Eleven individuals had 3 copies of SMN2, 2 had 4 copies and the number of copies were unknown in other. The mean age of first symptoms was 8.5 months (range 4–12 months; SD: 2.5) and the mean age at which nusinersen was started was 9.5 years (range 1.5–15.7 years; SD: 3.2). Mean HFMSE and RULM at nusinersen onset were 8.4 (range 0–26; SD 8.0) and 17.5 (range 6–17; SD 6.0), respectively. A summary of the demographic and clinical features of the individuals in whom this work was performed is showed in Table 1.
Table 1
Clinical data of the individuals included in this study. Abbreviations: F: female; M: male; y: years
| Gender | SMA type | SMN2 copy number | Age of symptoms onset (months) | Maximum motor milestone achieved | Age at first dose of nusinersen = Age at collection of first samples | HFMSE pretreatment | HFMSE 8 months of treatment | HFMSE 16 months of treatment | RULM pretreatment | RULM 8 months of treatment | RULM 16 months of treatment | |
| SMA 1 | M | 2a | 3 | 12 | Sitting | 1,6y | 7 | 7 | 12 | 10 | 13 | 17 |
| SMA 2 | M | 2a | 3 | 8 | Sitting | 10 y | 0 | 2 | 1 | 10 | 13 | 11 |
| SMA 3 | M | 2b | 3 | 12 | Sitting | 12,3 y | 26 | 26 | 24 | 27 | 27 | 28 |
| SMA 4 | M | 2a | 3 | 10 | Sitting | 6 y | 19 | 21 | 21 | 19 | 23 | 22 |
| SMA 5 | M | 2b | 3 | 8 | Standing | 10,6 y | 2 | 6 | 6 | 21 | 22 | 19 |
| SMA 6 | M | 2a | 3 | 7 | Sitting | 9 y | 0 | 0 | 0 | 6 | 6 | 8 |
| SMA 7 | F | 2a | 3 | 8 | Sitting | 9 y | 8 | 8 | 8 | 23 | 18 | 23 |
| SMA 8 | M | 2a | 3 | 4 | Sitting | 7,7 y | 10 | 4 | 6 | 19 | 13 | 12 |
| SMA 9 | F | 2b | 4 | 12 | Sitting | 9,5 y | 5 | 6 | 7 | 20 | 19 | 20 |
| SMA 10 | F | 2a | 3 | 5 | Sitting | 5,7 y | 12 | 12 | 13 | 20 | 16 | 18 |
| SMA 11 | F | 2a | 3 | 8 | Sitting | 4,5 y | 10 | 15 | 13 | 14 | 19 | 16 |
| SMA 12 | F | 2a | 4 | 8 | Sitting | 6,8 y | 9 | 8 | 7 | 20 | 19 | 18 |
| SMA 13 | F | 2a | 3 | Sitting | 15,7 y | 2 | 2 | 2 | 9 | 9 | 6 | |
| SMA 14 | F | 2a | 3 | 8 | Sitting | 14,7 y | – | 19 | 16 |
The recommended dosing schedule for administration of nusinersen was followed in all the patients: An initial loading phase at days 0, 14, 28 and 60 was followed by maintenance doses every 4 months. Serum and CSF samples were obtained on a regular nusinersen-synchronized basis prior to intrathecal administration at baseline (dose 1; month 0), at 6 months of treatment (dose 5; month 6) and at 14 months of treatment (dose 7; month 14). Additionally, CSF samples were also collected at 2 months of treatment (dose 4; month 2) [42].
Motor function was measured using the Hammersmith Functional Motor Scale Expanded (HFMSE) and the Revised Upper Limb Module (RULM) every 8 months. The HFMSE scale consists of 33 items that are scored on a 3-point scoring system and results in a total score can range from 0, if all the proposed activities are failed, to 66, if all the proposed activities are achieved [43]. RULM is a scale specifically designed to assess the upper limb function in individuals with SMA. It consists of 19 items and the maximum score is 37 points [44].
CSF and serum samples from 19 healthy children who met inclusion criteria (exclusion of viral or bacterial meningitis, neurodegenerative diseases, tumoral and genetic disorders) were collected. These samples were collected at the emergency department mainly because of suspicion of meningitis and/or encephalitis. Six serum samples were used as control for EVs content analysis (2 females and 4 males; mean age: 10.3 y), two samples were used as control for nanoparticle tracking analysis of EVs (1 female and 1 male; mean age: 6 y), and six samples were used as control for serum pNF-h levels (3 females and 3 males; mean age: 12 y). Five CSF samples were used as controls (3 females and 2 males; mean age: 8 y): two samples were used for nanoparticle tracking analysis of EVs and three samples for CSF pNF-h analysis.
2.2Serum and CSF analysis
Serum was obtained from peripheral blood by centrifugation (800g, 5 min) and stored within two hours at –80°C. CSF was obtained by lumbar puncture and processed according to the current guidelines. Biobanking was conducted according to current recommendations [45]. All times between CSF collection and freezing were recorded.
2.3Isolation and characterization of extracellular vesicles
From 1 ml of serum or CSF, we isolated EVs using the exoRNeasy affinity spin column-based system (Qiagen). Serum and CSF from two individuals with SMA, as well as two serum and CSF samples from controls, were eluted in the elution buffer, buffer XE (Qiagen), and sent for nanoparticle tracking analysis. Particle size distribution and concentration measurements were assessed with a Nanosight NS300 (Particle Tracking Analysis) instrument (Malvern Panalytical, Malvern, UK). Vesicles were resuspended in 1x XE and diluted to the working range of the system (10exp6-10exp9 particles/ml). Videos were captured and analyzed with Nanosight NS300 software (version 3.4) using an sCMOS camera.
2.4Isolation of total RNA in serum, isolation of RNA in EV and absolute quantification of full-length SMN transcript (flSMN)
Serum samples from two individuals with SMA and from two healthy controls were used to extract total RNA with the miRNeasy Serum/Plasma kit (Qiagen). Briefly, total RNA was isolated from 200μl of serum according to the manufacturer’s recommendations and eluted in 14μl of RNase-free water.
From 1 ml of serum, EVs were isolated from 8 patients and 2 healthy controls and from 1 ml of CSF, EVs were isolated from 8 patients and 6 controls. This system allows the isolation of EVs and subsequent isolation of EV RNA in the same protocol following the manufacturer’s recommendations. EV isolation was performed using the exoRNeasy Midi Kit (Qiagen) affinity spin column-based system according to the manufacturer’s recommendations. This system allows isolation of EVs and subsequent isolation of RNA from EVs bound to the affinity column.
Peripheral blood mononuclear cells used as control for flSMN were isolated from a buffy coat derived from a patient with SMA, as previously described [46]. Briefly, cells were centrifuged at 350 g for 10 min, the supernatant was removed and the cells were resuspended in HBSS. RNA was isolated from fresh blood with TRIZOL (Invitrogen) and extracted with the QIAamp RNA Blood Mini kit (QIAGEN) following the manufacturer’s instructions respectively. cDNA synthesis: RNA concentration was determined using a spectrophotometer and 1μg of total RNA was used as template for the reverse transcription reaction.
Total RNA (5μL) and RNA obtained from EVs (5μL) were transcribed in a 20μL reaction (GoScript # x2122 ; Reverse Transcriptase, Promega) following the manufacturer’s instructions. Absolute quantification of flSMN was performed by droplet digital PCR (ddPCR) (Bio-Rad). Briefly, 2 ul of obtained cDNA was prepared for amplification in a 20μL reaction volume containing 10μL of 2X ddPCR Supermix for Probes (Bio-Rad), 1μL of each primer/probe set and nuclease-free water. The primers used to amplify flSMN at 5’-3’, forward primer sequence: GCTGATGCT TTGGGA AGTATGTT; reverse primer sequence CACCTTCCTTTCTTTTGATTTTGTC; Taqman probe sequence FAM-TTTCATGGTACAGTGGCTATCATAGGCTAT-MGBNFQ. [47]. TaqMan gene expression assays (probe and primers) were purchased from Invitrogen Life Technologies. The ddPCR assay mix (20μL) was loaded into the wells of a disposable DG8 cartridge (Bio-Rad) with 70μL of probe droplet generation oil (Bio-Rad). The cartridge was then placed in the QX200 droplet generator (Bio-Rad). PCR reactions were carried out on a C1000 Touch thermal cycler (Bio-Rad Laboratories) using the following standard cycling conditions: 95°C-10 minutes, 40 cycles of 94°C-30 seconds, 40 cycles of 60°C-1 minute and 98°C- 10 minutes. As a positive control for the flSMN assays, RNA extracted from lymphocytes of two SMA patients was used. After PCR, the plate was loaded into the QX200 droplet reader (Bio-Rad) for automatic reading of positive (contained target) and negative (did not contain target) droplets in each sample using the rare event detection option. Data were analysed using QuantaSoft # x2122 ; software (Bio-Rad).
2.5Quantification of phosphorylated neurofilament heavy chain (pNF-h)
Neurofilament heavy chain concentrations were measured in duplicate using the ultra-sensitive single-molecule array (Simoa) technique on the Simoa SR-X Analyzer (Quanterix, Lexington, Massachusetts). We used the pNF-heavy Discovery Kit (Quanterix) for pNfH quantification according to the manufacturer’s instructions and in accordance with published procedures [48]. CSF samples were diluted 25-fold and serum samples were diluted four-fold, as recommended by the manufacturer. The intra- and inter-assay coefficients of variation of the assay were 4.0% and 12.3%, respectively.
2.6Statistical analysis
Statistical analysis was performed using R and PRISM 8.0 software. Based on the number of patients with SMA type 2 who had been treated with nusinersen at Hospital Sant Joan de Déu between March 2018 and March 2020, a sample size of 15 individuals was expected. This sample size allowed to detect significantly a difference with an effect size of 1.0 in a bilateral statistical test to compare means with paired data with a significance level of 0.05 and a power of 0.8, which was considered to be sufficient.
All available data were included in the statistical analysis. Some measures had skewed distributions, so log transformation was used to normalise these values for parametric tests. The parametric two-tailed Student’s t-test for independent samples, with Welch’s correction, was used to compare individuals with SMA and controls. A two-tailed parametric Student’s t-test for paired samples was used to compare samples taken at different time points in the same individuals. Pearson’s correlation was used to correlate the age of individuals with SMA when they received the first dose of nusinersen with flSMN in EV, with pNF-h in serum, and with pNF-h in CSF. Pearson’s correlation was also used to compare the biomarkers described here with the functional motor scales. A p-value ≤0.05 was considered statistically significant.
3RESULTS
The mean diameter of EVs isolated from CSF was 184.8 nm in healthy controls and 214.2 nm in individuals with SMA. The mean concentration of EVs in CSF was 2.6 E10 particles/ml in healthy controls and 5.6 E10 particles/ml in individuals with SMA. In serum, the mean diameter of EVs was 230.6 nm in healthy controls and 225.6 nm in individuals with SMA. The mean concentration of EVs in serum was 1.4 E11 particles/ml in healthy controls and 1.5 E11 particles/ml in individuals with SMA. These sizes and concentrations are consistent with those previously described by Nash et al. [41].
3.1Serum EVs from individuals with SMA 2 contain flSMN transcript that increases with nusinersen treatment
We isolated RNA from EVs extracted from serum and CSF of 6 individuals with SMA type 2 prior to dose 1 of nusinersen (baseline) and prior to dose 7 (month 14) and from 6 healthy controls. By ddPCR, we tested the presence of flSMN in the RNA derived from EVs. As a positive control for both assays, RNA extracted from lymphocytes of another individual with SMA was used (data not shown).
We detected flSMN transcript in all the samples of serum EVs analysed but not in CSF-derived EVs (data not shown).
After detecting the flSMN in serum EVs, we decided to test whether SMN transcript could be amplified directly from serum or CSF, without prior extraction of the EVs. As a positive control for the flSMN transcript expression we used cDNA from lymphocytes. However, we did not detect flSMN transcript in samples from two patients and two healthy controls (data not shown).
Expression of the flSMN transcript in the EVs of individuals with SMA 2 before the start of nusinersen (prior to dose 1; month 0) was significantly lower (mean: 0.40 copies/ul; SD: 0.14; range: 0.20–0.57 copies/ul) than in controls (mean: 2.79 copies/ul; SD: 2.10; range: 0.72–6.60 copies/ul) with a 7-fold difference and a p-value of 0.001.
The expression of flSMN in the EVs of the same individuals with SMA 2 after being treated with nusinersen for 14 months (mean: 1.11 copies/ul; SD: 0.73) was more than twice as high as before starting nusinersen treatment (0.40 vs 1.11 copies/ul; p: 0.03) and approached but did not reach the values of healthy controls (1.11 vs 2.79 copies/ul; p: 0.065) (Fig. 1 and Table 2). Interim flSMN analyses in EVs were not performed between the start of nusinersen and 14 months of treatment due to insufficient serum samples.
Fig. 1
The individual value plot shows an increase in flSMN transcript expression in EVs of individuals with SMA 2 between the start of nusinersen treatment (M0: month 0) and 14 months of treatment (M14: month 14). Both are compared with the expression of the flSMN transcript in the EVs of unnafected controls. *: p≤0.05; **: p≤0.01; ***: p≤0.001.
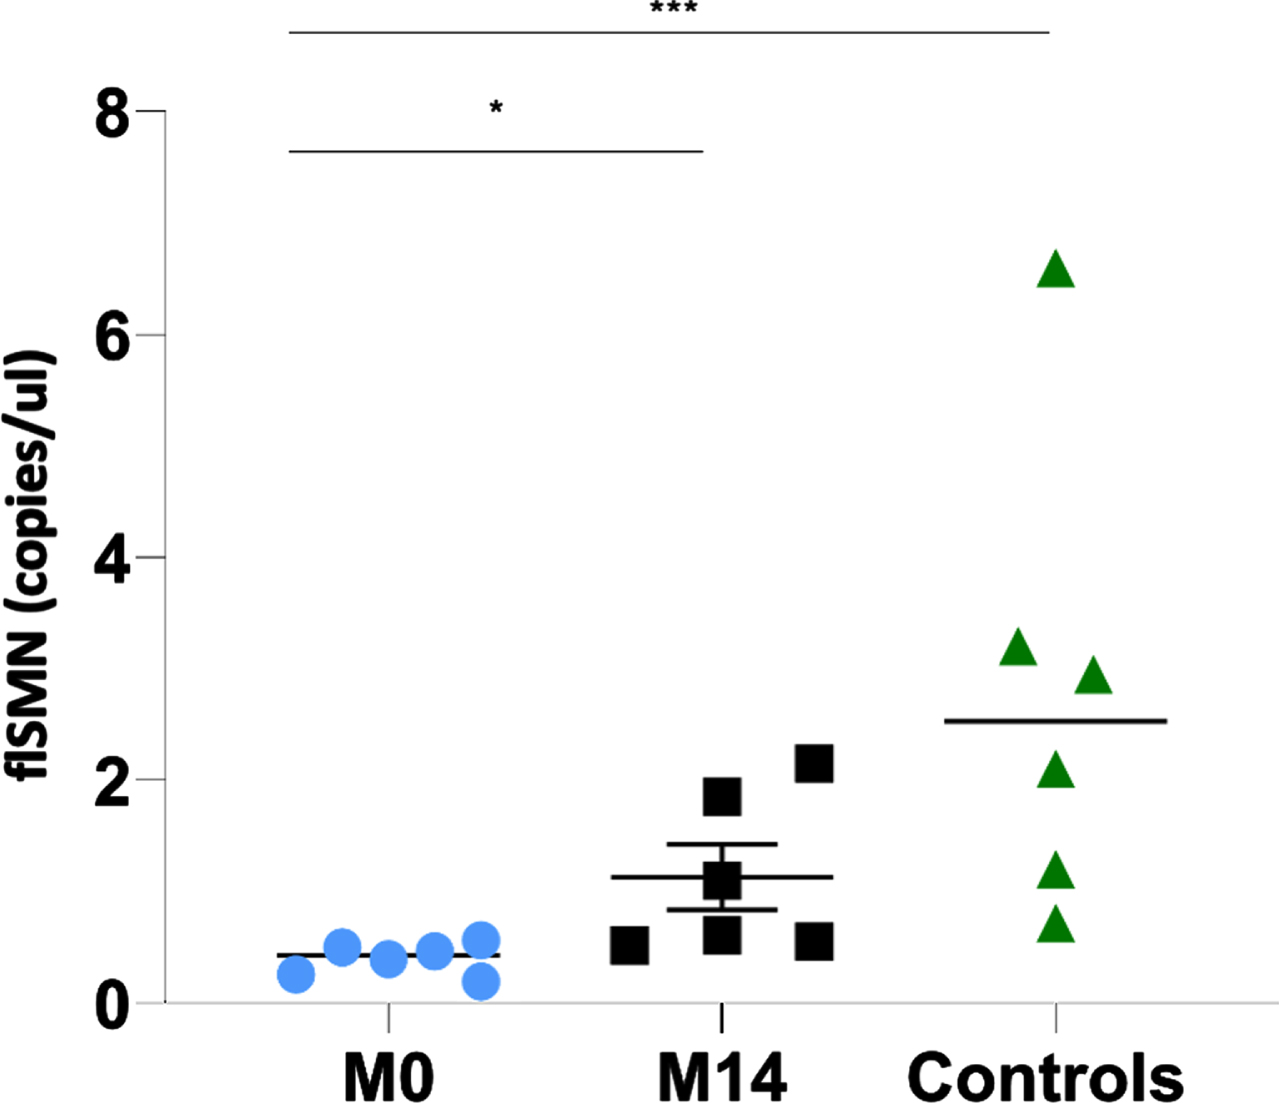
Table 2
Results of the expression of flSMN transcript in EV in serum, pNF-h levels in serum, and pNF-h levels in CSF in the individuals included in this study
| Age at sample collection (at first dose of nusinersen in individuals with SMA) | flSMN in EV prior to treatment | flSMN in EV after 14m of nusinersen | Serum pNF-h prior to treatment | Serum pNF-h after 6m of nusinersen | Serum pNF-h after 14m of nusinersen | CSF pNF-h prior to treatment | CSF pNF-h after 2m of nusinersen | CSF pNF-h after 6m of nusinersen | CSF pNF-h after 14m of nusinersen | |
| SMA 1 | 1,5 y | 339,52 | 186,64 | 97,79 | ||||||
| SMA 2 | 10 y | 0,565 | 1,1 | 165,68 | 95,92 | 84,03 | 163,71 | 135,91 | 79,52 | 107,14 |
| SMA 3 | 12,3 y | 0,195 | 0,56 | 18,64 | 17,55 | 13,57 | ||||
| SMA 4 | 6 y | 368,54 | 203,68 | 115,51 | 110,62 | |||||
| SMA 5 | 10,6 y | 0,395 | 0,52 | 48,62 | 49,92 | 172,08 | 79,13 | 195,39 | ||
| SMA 6 | 9 y | 46,77 | 25,34 | 32,29 | ||||||
| SMA 7 | 9 y | 0,26 | 1,85 | 347,37 | 198,10 | 360,43 | 95,52 | |||
| SMA 8 | 7,7 y | 0,465 | 2,15 | 639,67 | 378,01 | 151,97 | 115,82 | 99,56 | ||
| SMA 9 | 9,5 y | 72,79 | 216,78 | 212,04 | 83,99 | 122,87 | ||||
| SMA 10 | 5,7 y | 134,97 | 79,11 | 52,14 | 54,45 | |||||
| SMA 11 | 4,5 y | 339,85 | 348,94 | 73,83 | 96,98 | |||||
| SMA 12 | 6,8 y | 28,35 | 14,11 | 15,28 | 155,24 | 111,21 | 91,70 | 96,71 | ||
| SMA 13 | 15,7 y | 547,78 | 475,00 | 152,38 | ||||||
| SMA 14 | 14,7 y | 0,5 | 0,61 | 126,81 | 109,31 | |||||
| Control 1 | 7 y | 2,95 | ||||||||
| Control 2 | 11 y | 3,2 | ||||||||
| Control 3 | 12 y | 6,6 | ||||||||
| Control 4 | 13 y | 1,2 | ||||||||
| Control 5 | 9 y | 2,1 | ||||||||
| Control 6 | 10 y | 0,72 | ||||||||
| Control 7 | 14 y | 10,71 | ||||||||
| Control 8 | 10 y | 13,40 | ||||||||
| Control 9 | 12 y | 71,36 | ||||||||
| Control 10 | 12 y | 20,76 | ||||||||
| Control 11 | 14 y | 3,22 | ||||||||
| Control 12 | 10 y | 17,80 | ||||||||
| Control 13 | 8 y | 6,70 | ||||||||
| Control 14 | 7 y | 178,54 | ||||||||
| Control 15 | 9 y | 103,22 |
3.2Serum pNF-h levels are high in non-treated individuals with SMA 2 and decrease when they are treated with nusinersen
Serum pNF-h levels were available in 7 individuals with SMA 2 prior to be treated with nusinersen (prior to dose 1; month 0), in 6 individuals with SMA 2 after having received nusinersen for 6 months (prior to dose 5; month 6) and in 5 individuals with SMA 2 after having received nusinersen for 14 months (prior to dose 7; month 14). Results were compared with serum pNF-h levels from 6 control samples.
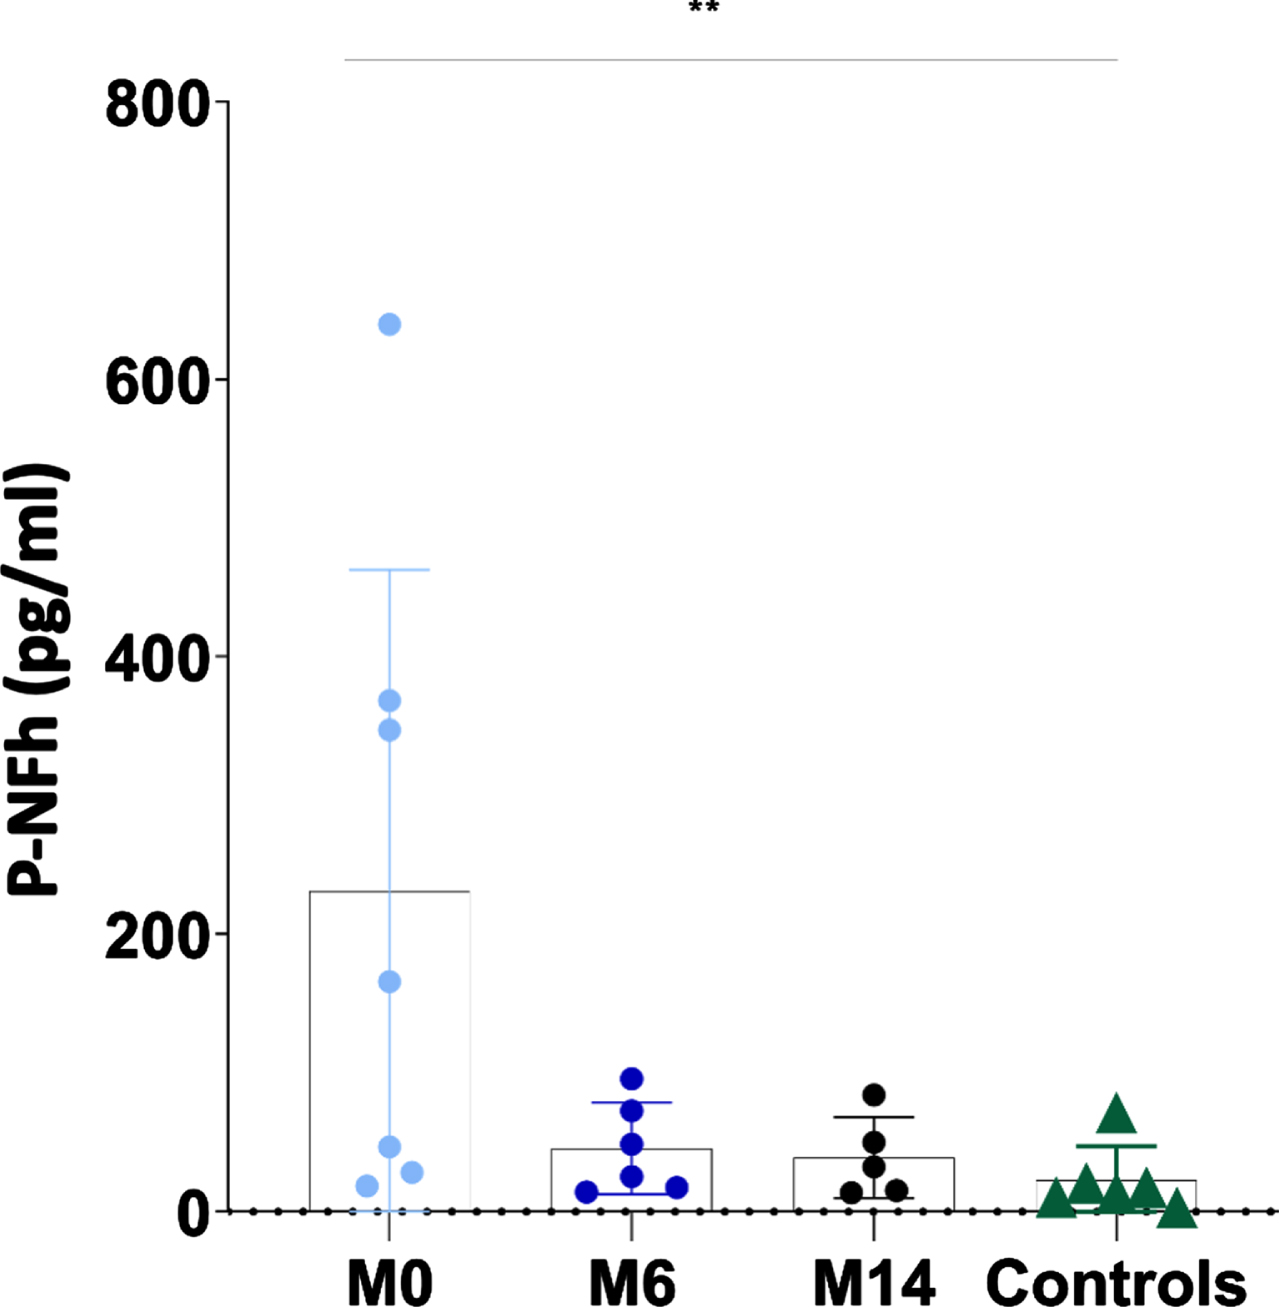
Mean pNF-h in individuals with SMA 2 prior to be treated with nusinersen was 230.72 pg/ml (range 18.64–639.67 pg/ml; SD: 232.32), after having received nusinersen for 6 months was 45.72 pg/ml (range 14.11–95.92 pg/ml; SD: 33.07) and after having received nusinersen for 14 months was 39.02 pg/ml (range 13.57–84.03 pg/ml; SD: 29.16). Mean pNF-h in healthy controls was 22.88 pg/ml (range 3.22–71.36 pg/ml; SD: 24.52). pNF-h was significantly different in healthy controls and non-treated individuals with SMA 2 (22.88 vs 230.72 pg/ml; p: 0.01) but not between non-treated individuals with SMA 2 and individuals with SMA 2 treated with nusinersen during 6 months (22.88 vs 45.72 pg/ml; p: 0.13) and 14 months (22.88 vs 39.02 pg/ml; p: 0.23). The pNF-h in patients treated with nusinersen for 6 and 14 months was respectively 5.05 and 5.91 times lower than in patients who had not started treatment (Fig. 2 and Table 2).
Fig. 2
The individual value plot shows that the serum pNF-h levels were high in non-treated individuals with SMA 2 (M0: month 0) and decreased when they are treated with nusinersen (M6: month 6; M14: month 14). *: p≤0.05; **: p≤0.01; ***: p≤0.001.
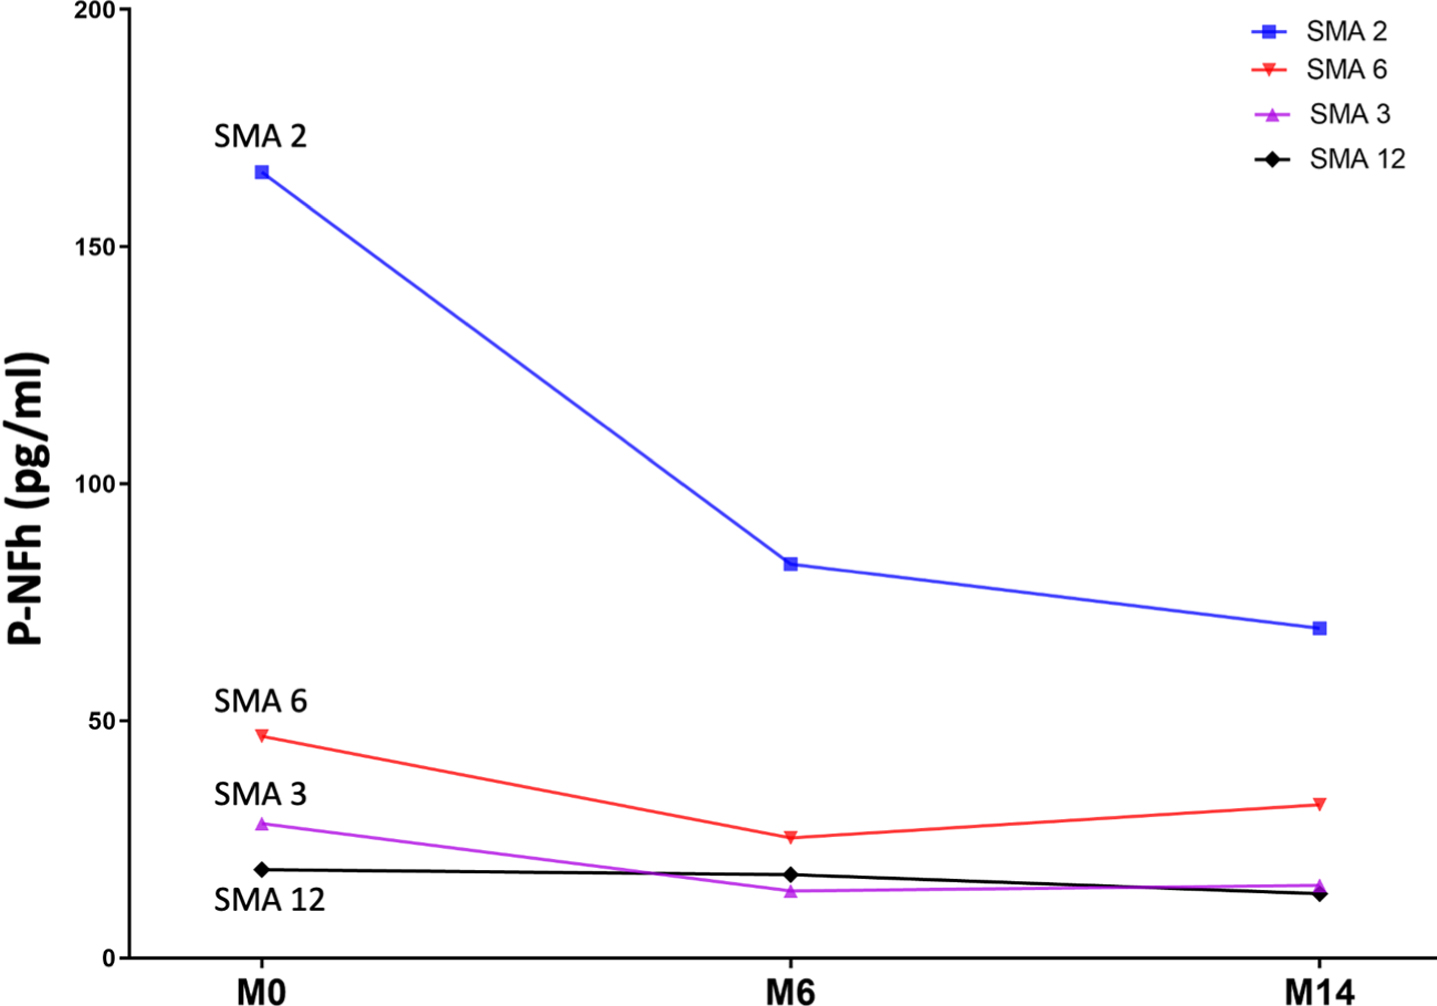
Serum pNF-h was available at all three time points for four patients. Using a paired t-test, statistically significant differences were also found between pNF-h before starting nusinersen treatment and pHF-h after 6 and 14 months of treatment (p: 0.04 and p: 0.01, respectively). The individual evolution of these levels is shown in Fig. 3 and Table 2)
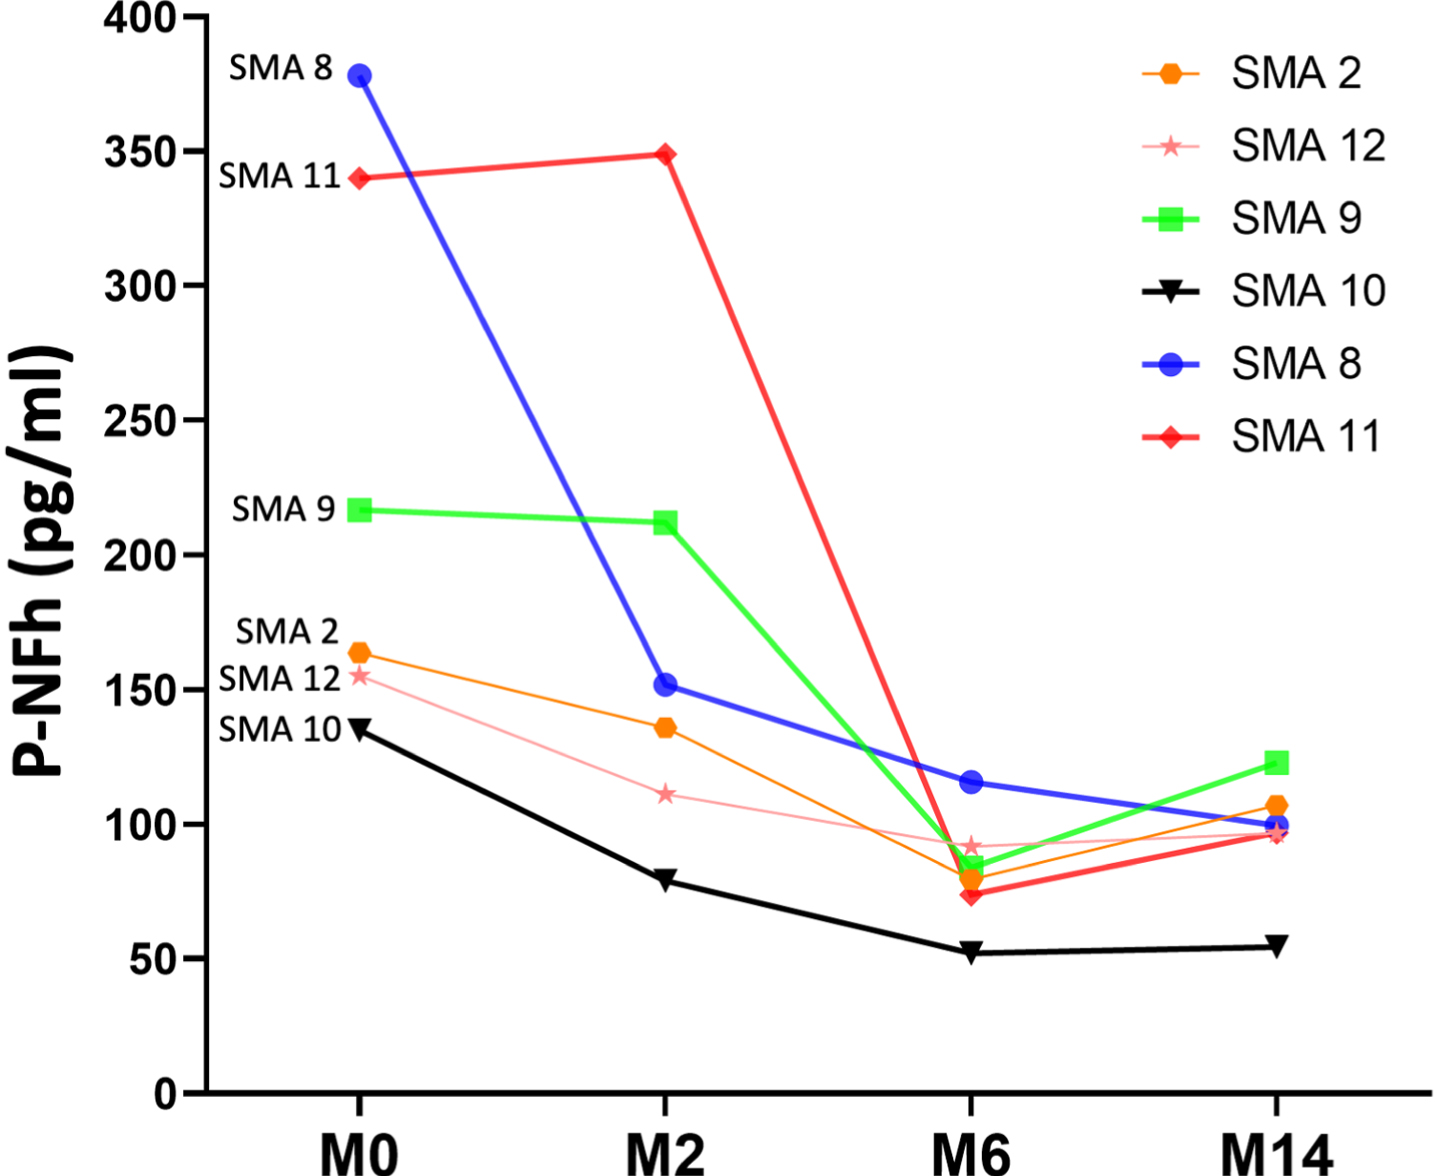
Fig. 3
Line graph shows the individual evolution of serum pNF-h in four individuals with SMA 2 prior to nusinersen (M0: month 0) and after 6 and 14 months of treatment (M6: month 6; M14: month 14).
3.3pNF-h in CSF is high in non-treated individuals with SMA 2 and decrease when they are treated with nusinersen
pNF-h levels in CSF were available in 12 individuals with SMA 2 prior to be treated with nusinersen (prior to dose 1; month 0) and after having received nusinersen for 2 months (prior to dose 4; month 2), in 11 individuals with SMA 2 after having received nusinersen for 6 months (prior to dose 5; month 6) and in 6 individuals with SMA 2 after having received nusinersen for 14 months (prior to dose 7; month 14). Results were compared with pNF-h levels in CSF from 3 control samples.
The mean values of pNF-h in CSF decreased progressively and significantly from the time of initiation of nusinersen treatment. Mean pNF-h in CSF in individuals with SMA 2 prior to receive the first administration of nusinersen was 248.04 pg/ml (range 126.81–547.78 pg/dl; SD: 127.19). After 2 months of treatment, it decreased to 197.10 pg/dl (range 79.11–475.01 pg/dl; SD: 128.86), after 6 months of treatment it decreased further to 104.43 pg/dl (range: 52.14 –195.39 pg/dl, SD: 39.67), and after 14 months it was 131.03 pg/dl (range 54.45–339.53 pg/dl; SD: 94.25) (Fig. 4 and Table 2). For 6 patients CSF samples from all time points were available. The progressive decrease of pNF-h in CSF after the initiation of nusinersen was also statistically significant using paired t-tests (p: 0.03 at 2 months, p: 0.01 at 6 months and p: 0.01 at 14 months) (Fig. 5). The mean pNF-h in healthy controls was 96.15 pg/ml (range: 6.70–178.54; SD: 86.14), which is 2.58 times lower than the mean pNF-h in individuals with SMA 2 before starting nusinersen, although the difference was not statistically significant (p: 0.057).
Fig. 4
The individual value plot shows that pNF-h in CSF were high in non-treated individuals with SMA 2 (M0: month 0) and decreased when they were treated with nusinersen (M2: month 2; M6: month 6; M14: month 14). Results were compared with pNF-h in CSF from control samples. *: p≤0.05; **: p≤0.01; ***: p≤0.001.
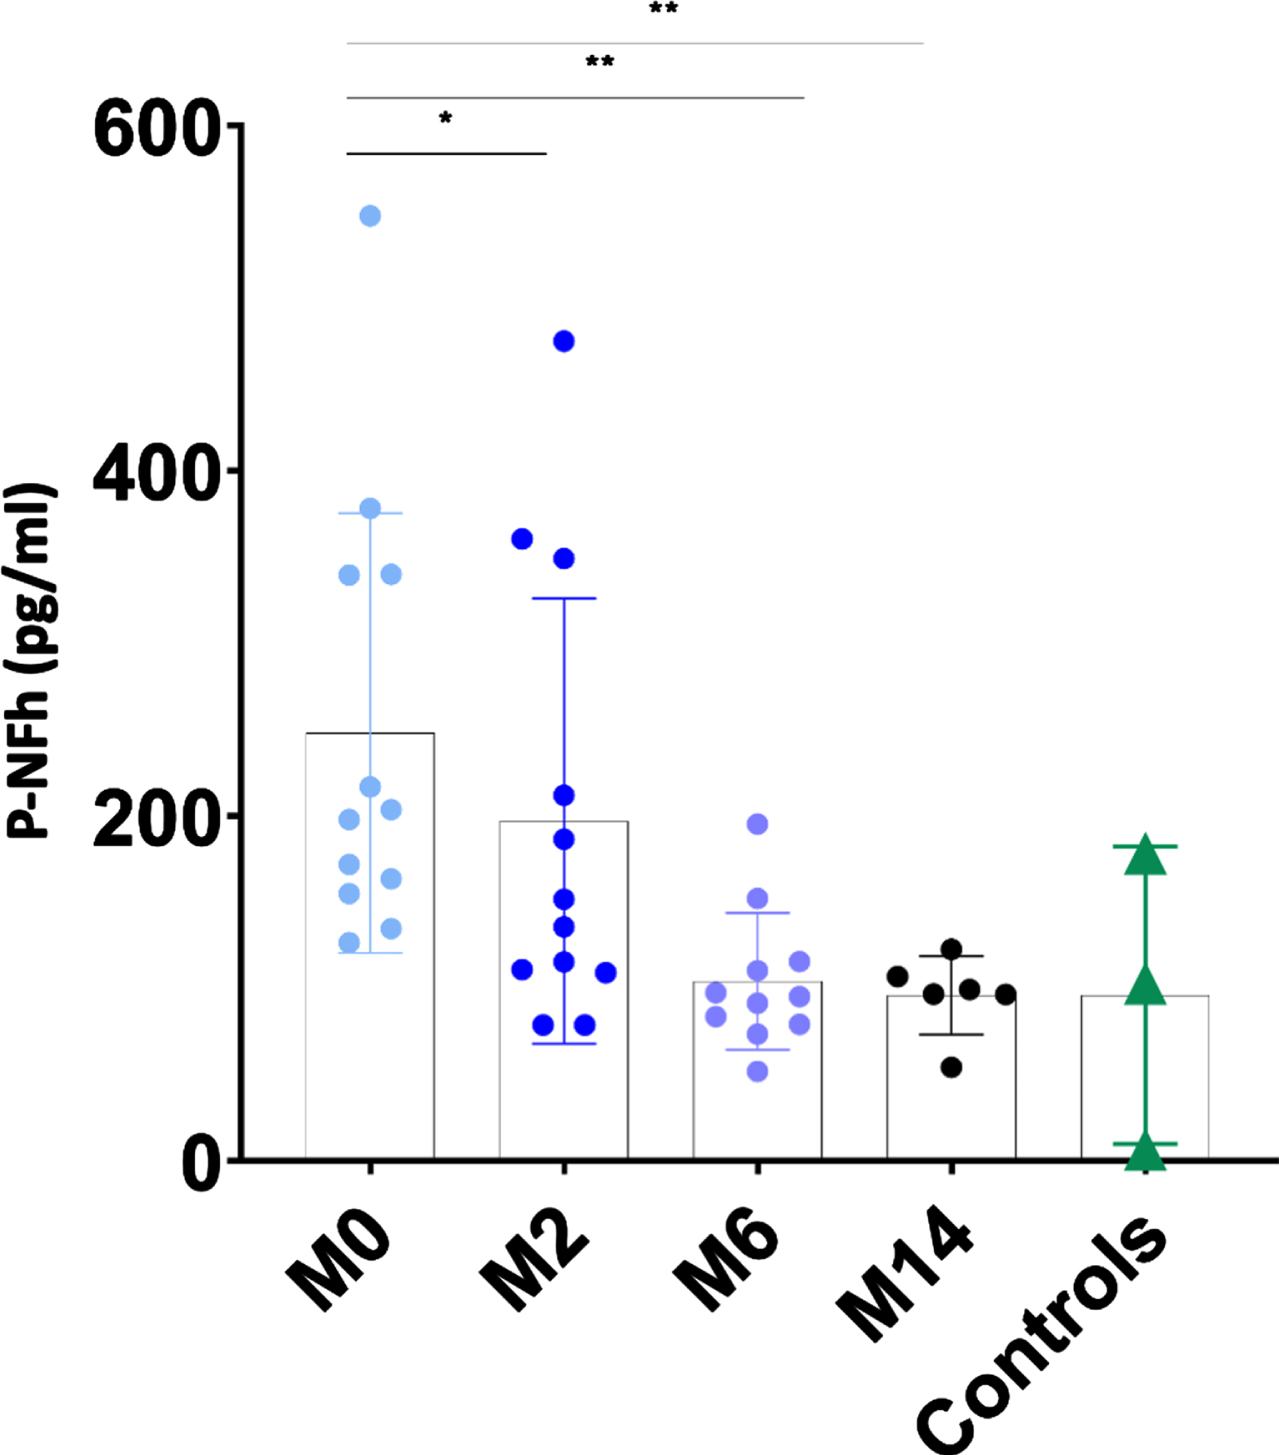
Fig. 5
Line graph shows the individual evolution of pNF-h in CSF in six individuals with SMA 2 prior to nusinersen (M0: month 0) and after 2. 6 and 14 months of treatment (M2: month 2; M6: month 6; M14: month 14).
3.4Correlation of the SMN transcript expression in serum EVs and pNF-h levels with functional outcome measures and age
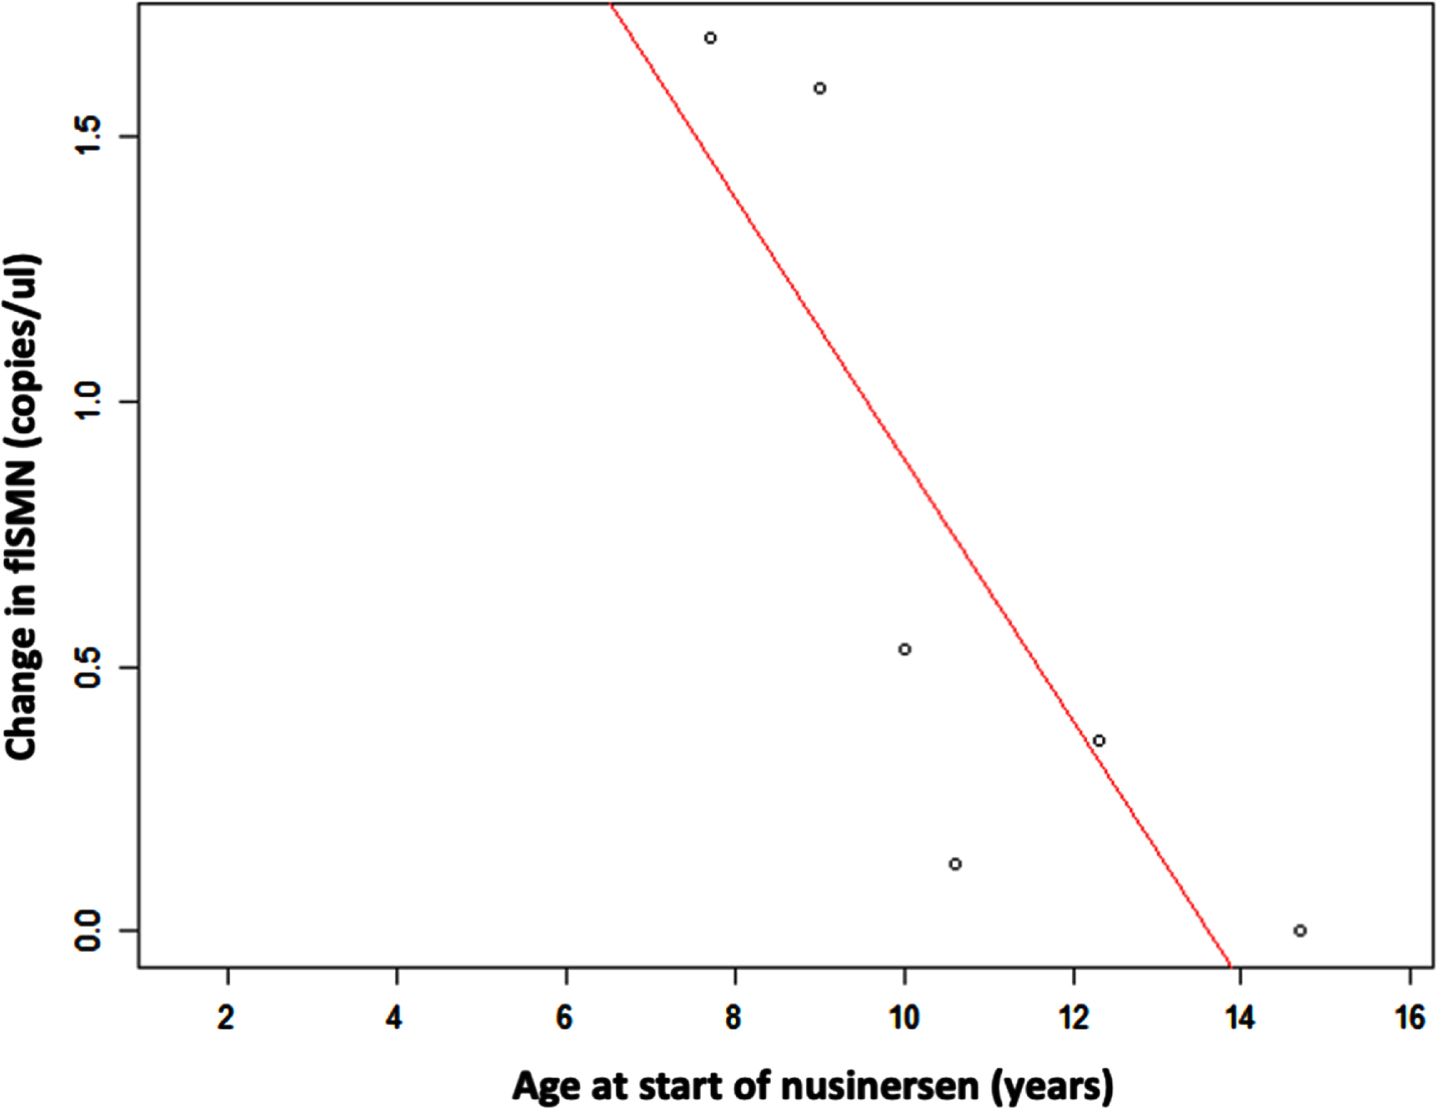
The increase in flSMN between the baseline measurement prior to the first administration of nusinersen and the 14th month of treatment was significantly higher in younger individuals, with a high and negative correlation coefficient (–0.83; p: 0.04). In contrast, the decrease in pNF-h levels, both in serum and CSF, did not correlate with the age of the patients at the time of starting nusinersen treatment (p: 0.96 and p: 0.76, respectively) (Fig. 6).
Fig. 6
Scatter plot shows the relationship between age and increase in flSMN transcript expression in serum EVs after nusinersen treatment. Increase in flSMN is significantly higher in individuals who were younger at first administration of nusinersen.
The relationship between changes in the biomarkers analysed and changes in the functional motor scales (HFMSE and RULM) were not statistically significant (correlation between change in flSMN and change in HFMSE: p:0.25; correlation between change in flSMN and change in RULM: p:0.46; correlation between change in pNF-H and change in HFMSE: p:0.18; correlation between change in pNF-H and change in RULM: p:0.82). The correlation between FL-SMN, pNF-H and motor function scores are showed in supplementary Table 1.
4DISCUSSION
Overall, individuals with SMA respond positively to nusinersen but their individual clinical response is heterogeneous and therefore biomarkers to complement functional motor scales would be highly desirable to accurately assess therapeutic response but also to understand the causes leading to this variable response. The aim of this study was to explore the applicability of SMN transcript expression in serum EVs as a biomarker of therapeutic response in SMA.
Expression of the flSMN transcript in whole blood has been shown to be able to distinguish between individuals with SMA and healthy controls and among SMA phenotypes, but may not be sensitive enough to reflect significant changes in motor neurons [27]. Since EVs are essential in intercellular communication by transporting nucleic acids and proteins, cross the blood-brain barrier, and carried other RNAs that are biomarkers for other diseases [49, 50], we preferred to explore whether the flSMN transcript expression in EVs was different between healthy controls and individuals with SMA 2 and whether it increases when patients were treated with nusinersen.
Notably, our findings show that the flSMN transcript expression in serum EVs is significantly higher in healthy individuals than in untreated individuals with SMA 2 and that when the latter are treated with nusinersen the SMN transcript expression in serum EVs approach that of healthy individuals, even though no improvement in motor ability was detected on functional motor scales. The findings of our neurofilament analyses are in line with published data [51–54] and validated the quality and validity of our cohort. We observed a consistent and significant decline of pNF-H in individuals with SMA 2 after being treated with nusinersen.
We did not identify a correlation between the increase in flSMN transcript expression in EVs in treated patients and changes in their scores on motor function scales. We also did not identify a correlation between the decrease in neurofilaments and scores in motor function scales. This is relatively expected if we take into account that changes in scores of motor function scales in individuals with SMA 2 treated with nusinersen for 1 or 2 years are small, especially if they are older than 6 years. The mean age of our cohort was relatively high (9.5 years) and the baseline motor function relatively low (HFMSE: 8.4; RULM: 17) compared to other studies, which would explain the modest mean improvement in the motor scales of the individuals included here after only 14 months of treatment with nusinersen (Table 1). It could be hypothesized that flSMN transcript expression in EVs and other biomarkers may be useful in predicting response to treatment; a response that is likely to take longer to become detectable by motor function scales, which in turn are unlikely to be ideal for measuring treatment effect.
We did not detect the flSMN transcript in free serum or CSF, probably because most of it is transported within extracellular vesicles or, alternatively, because flSMN circulating in the blood without the protection of EVs is degraded. Even though the main beneficial effect of nusinersen is secondary to the recovery of alpha motor neurons that is caused by the increase of functional SMN, it is plausible that the increase in flSMN transported by extracellular vesicles, which cross the blood-brain barrier and reach other tissues, may also lead to an additional beneficial effect.
Since flSMN transcript levels in individuals with SMA are often extremely low, use of sensitive techniques as the optimized digital droplet PCR-based method that we used in this study is required to sensitive measure the transcript expression. Also it helps to avoid or at least diminish the interlaboratory variability. Once fine-tuned, RNA isolation from EVs is a simple procedure that is feasible to implement in a clinical setting. Limitations of this study include (1) that it was performed only in children with SMA 2 and, therefore, a further study in individuals with SMA 1 and SMA 3, as well as in adults is desirable to complement our findings, (2) that the change of flSMN transcript in serum EVs between the start of nusinersen and 14 months of treatment could not be closely monitored due to insufficient serum samples between 0 and 14 months, and (3) that it will be interesting to investigate flSMN expression in EVs in individuals treated by other disease-modifying treatments such as risdiplam or onasemnogene abeparvovec.
In conclusion, we have found that the differential expression of flSMN transcript in serum EVs is a potential biomarker to predict or monitor response of individuals with SMA to nusinersen. The application of this previously undescribed biomarker could help to measure the individual response to treatment of each patient, especially in older individuals, in whom assessment using functional motor scales has proven to be insufficient. In addition, it could also be used to compare the magnitude of response to different SMA treatments, to better understand the variables that determine the response in each individual, to predict the response, and to or monitor the response to treatment at an early stage. More longitudinal long-term studies in larger cohorts will be needed to better understand the correlation of the SMN transcript expression in serum EVs to disease progression and the improvement after therapeutic interventions. Moreover, it would be insightful to investigate SMN protein levels in serum EVs and determine whether they correlate with flSMN transcript levels and/or motor function scales.
FUNDING
This work was supported with a Galicia AME grant
- Daniel Natera-de Benito is supported by the Miguel Servet program from Instituto de Salud Carlos III, Spain (CP22/00141).
- Rest of authors report no disclosures.
ACKNOWLEDGMENTS
We are grateful to the Alzheimer’s laboratory at Hospital Sant Pau for technical support.
We are grateful to José Amable Bernabé Mateos for the particle size distribution and concentration measurements carried out at ICTS NANBIOSIS-U6, CIBER-BBN.
We are grateful to the Biobanc de l’Hospital Infantil Sant Joan de Déu per a la Investigació integrated in the Spanish Biobank Network of ISCIII.
CONFLICTS OF INTEREST
The authors declare no conflict of interest. DNdB has received funding as a speaker in sponsored symposiums and educational activities by Biogen, Novartis and Roche Pharmaceuticals. AN has received funding as a speaker in a sponsored symposium and educational activities or a member of advisory boards for SMA studies for AveXis, Biogen, Ionis Pharmaceuticals, Novartis, Roche Pharmaceuticals, and Scholar Rock. AN is the principal investigator for ongoing Avexis, Ionis Pharmaceuticals/Biogen, Roche, and Scholar Rock clinical trials. D.A. participated in advisory boards from Fujirebio-Europe and Roche Diagnostics and received speaker honoraria from Fujirebio-Europe, Roche Diagnostics, Nutricia, Krka Farmacéutica S.L., Zambon S.A.U. and Esteve Pharmaceuticals S.A.
ETHICS/CONSENT TO PARTICIPATION
Data collection was carried out following the guidelines of the Clinical Ethics Committee of Hospital Sant Joan de Déu. All participation was by signed informed consent.
DATA AVAILABILITY
Any data not published within the article will be shared from the corresponding author, upon reasonable request.
SUPPLEMENTARY MATERIAL
[1] The supplementary material is available in the electronic version of this article: https://dx.doi.org/10.3233/JND-230012.
REFERENCES
[1] | Lefebvre S , Bürglen L , Reboullet S , et al. Identification and characterization of a spinal muscular atrophy-determining gene. Cell. (1995) ;80: :155–65. https://doi.org/10.1016/0092-8674(95)90460-3 |
[2] | Mercuri E , Pera MC , Scoto M , et al. Spinal muscular atrophy—insights and challenges in the treatment era. Nat Rev Neurol. (2020) ;16: :706–15. https://doi.org/10.1038/s41582-020-00413-4 |
[3] | Lorson CL , Hahnen E , Androphy EJ , Wirth B . A single nucleotide in the SMN gene regulates splicing and is responsible for spinal muscular atrophy. Proc Natl Acad Sci. (1999) ;96: :6307–11. https://doi.org/10.1073/pnas.96.11.6307 |
[4] | Baranello G , Gorni K , Daigl M , et al. Prognostic factors and treatment-effect modifiers in spinal muscular atrophy. Clin Pharmacol Ther. 2021. https://doi.org/10.1002/cpt.2247 |
[5] | Mercuri E , Darras BT , Chiriboga CA , et al. Nusinersen versus sham control in later-onset spinal muscular atrophy. N Engl J Med. (2018) ;378: :625–35. https://doi.org/10.1056/NEJMoa1710504 |
[6] | Finkel RS , Mercuri E , Darras BT , et al. Nusinersen versus sham control in infantile-onset spinal muscular atrophy. N Engl J Med. (2017) ;377: :1723–32. https://doi.org/10.1056/NEJMoa1702752 |
[7] | Baranello G , Darras BT , Day JW , et al. Risdiplam in Type 1 Spinal Muscular Atrophy. N Engl JMed. (2021) ;384: :915–23. https://doi.org/10.1056/NEJMoa2009965 |
[8] | Mercuri E , Muntoni F , Baranello G , et al. Onasemnogene abeparvovec gene therapy for symptomatic infantile-onset spinal muscular atrophy type 1 (STR1VE-EU): An open-label, single-arm, multicentre, phase 3 trial. Lancet Neurol. (2021) ;20: :832–41. https://doi.org/10.1016/S1474-4422(21)00251-9 |
[9] | Strauss KA , Farrar MA , Muntoni F , et al. Onasemno-gene abeparvovec for presymptomatic infants with two copies of SMN2 at risk for spinal muscular atrophy type 1: The Phase III SPR1NT trial. Nat Med. (2022) ;28: :1381–9. https://doi.org/10.1038/s41591-022-01866-4 |
[10] | Strauss KA , Farrar MA , Muntoni F , et al. Onasemnogene abeparvovec for presymptomatic infants with three copies of SMN2 at risk for spinal muscular atrophy: The Phase III SPR1NT trial. Nat Med. (2022) ;28: :1390–7. https://doi.org/10.1038/s41591-022-01867-3 |
[11] | Ramdas S , Servais L . New treatments in spinal muscular atrophy: An overview of currently available data. Expert Opin Pharmacother. (2020) ;21: :307–15. https://doi.org/10.1080/14656566.2019.1704732 |
[12] | Vázquez-Costa JF , Povedano M , Nascimiento-Osorio AE , et al. Nusinersen in adult patients with 5q spinal muscular atrophy: A multicenter observational cohorts’ study. Eur J Neurol. 2022. https://doi.org/10.1111/ene.15501 |
[13] | Mercuri E , Deconinck N , Mazzone ES , et al. Safety and efficacy of once-daily risdiplam in type 2 and non-ambulant type 3 spinal muscular atrophy (SUNFISH part 2): A phase 3, double-blind, randomised, placebo-controlled trial. Lancet Neurol. (2022) ;21: :42–52. https://doi.org/10.1016/S1474-4422(21)00367-7 |
[14] | Schorling DC , Pechmann A , Kirschner J . Advances in treatment of spinal muscular atrophy - new phenotypes, new challenges, new implications for care. J Neuromuscul Dis. (2020) ;7: :1–13. https://doi.org/10.3233/JND-190424 |
[15] | Gavriilaki M , Moschou M , Papaliagkas V , et al. Nusinersen in adults with 5q spinal muscular atrophy: A systematic reviewand meta-analysis. Neurotherapeutics. (2022) ;19: :464–75. https://doi.org/10.1007/s13311-022-01200-3 |
[16] | Zaharieva IT , Scoto M , Aragon-Gawinska K , et al. Response of plasma microRNAs to nusinersen treatment in patients with SMA. Ann Clin Transl Neurol. (2022) ;9: :1011–26. https://doi.org/10.1002/acn3.51579 |
[17] | Mercuri E , Lucibello S , Pera MC , et al. Long-term progression in type II spinal muscular atrophy: A retrospective observational study. Neurology. (2019) ;93: :e1241–7. https://doi.org/10.1212/WNL.0000000000008166 |
[18] | Wirth B . Spinal muscular atrophy: In the challenge lies a solution. Trends Neurosci. (2021) ;44: :306–22. https://doi.org/10.1016/j.tins.2020.11.009 |
[19] | Wirth B , Karakaya M , Kye MJ , Mendoza-Ferreira N . Twenty-five years of spinal muscular atrophy research: From phenotype to genotype to therapy, and what comes next. Annu Rev Genomics Hum Genet. (2020) ;21: :231–61. https://doi.org/10.1146/annurev-genom-102319-103602 |
[20] | Nitz E , Smitka M , Schallner J , et al. Serum neurofilament light chain in pediatric spinal muscular atrophy patients and healthy children. Ann Clin Transl Neurol. (2021) ;8: :2013–24. https://doi.org/10.1002/acn3.51449 |
[21] | Darras BT , Crawford TO , Finkel RS , et al. Neurofilament as a potential biomarker for spinal muscular atrophy. Ann Clin Transl Neurol. (2019) ;6: :932–44. https://doi.org/10.1002/acn3.779 |
[22] | De Wel B , De Schaepdryver M , Poesen K , Claeys KG . Biochemical and clinical biomarkers in adult SMA 3–4 patients treated with nusinersen for 22 months. Ann Clin Transl Neurol. 2022. https://doi.org/10.1002/acn3.51625 |
[23] | Schorling DC , Kölbel H , Hentschel A , et al. Cathepsin D as biomarker in cerebrospinal fluid of nusinersen treated patients with spinal muscular atrophy. Eur J Neurol. (2022) ;29: :2084–96. https://doi.org/10.1111/ene.15331 |
[24] | Pino MG , Rich KA , Kolb SJ . Update on biomarkers in spinal muscular atrophy. Biomark Insights. (2021) ;16: :117727192110356. https://doi.org/10.1177/11772719211035643 |
[25] | Gavriilaki M , Papaliagkas V , Stamperna A , et al. Biomarkers of therapeutic efficacy in adolescents and adults with 5q spinal muscular atrophy: A systematic review. Acta Neurol Belg. 2022. https://doi.org/10.1007/s13760-022-02028-6 |
[26] | Ramos DM , d’Ydewalle C , Gabbeta V , et al. Age-dependent SMN expression in disease-relevant tissue and implications for SMA treatment. J Clin Invest. (2019) ;129: :4817–31. https://doi.org/10.1172/JCI124120 |
[27] | Wadman RI , Stam M , Jansen MD , et al. A comparative study of SMN protein and mRNA in blood and fibroblasts in patients with spinal muscular atrophy and healthy controls. PLoS One. (2016) ;11: :1–17. https://doi.org/10.1371/journal.pone.0167087 |
[28] | Kolb SJ , Coffey CS , Yankey JW , et al. Baseline results of the Neuro NEXT spinal muscular atrophy infant biomarker study. Ann Clin Transl Neurol. (2016) ;3: :132–45. https://doi.org/10.1002/acn3.283 |
[29] | Iyer C , Wang X , Renusch SR , et al. SMN blood levels in a porcine model of spinal muscular atrophy. J Neuromuscul Dis. (2017) ;4: :59–66. https://doi.org/10.3233/JND-170209 |
[30] | Piepers S , Cobben J-M , Sodaar P , et al. Quantification of SMN protein in leucocytes from spinal muscular atrophy patients: Effects of treatment with valproic acid. J Neurol Neurosurg Psychiatry. (2011) ;82: :850–2. https://doi.org/10.1136/jnnp.2009.200253 |
[31] | Swoboda KJ , Scott CB , Reyna SP , et al. Phase II open label study of valproic acid in spinal muscular atrophy. PLoS One. (2009) ;4: :e5268. https://doi.org/10.1371/journal.pone.0005268 |
[32] | Mohseni J , Zabidi-Hussin ZAMH , Sasongko TH . Histone deacetylase inhibitors as potential treatment for spinal muscular atrophy. Genet Mol Biol. (2013) ;36: :299–307. https://doi.org/10.1590/S1415-47572013000300001 |
[33] | Strathmann EA , Peters M , Hosseinibarkooie S , et al. Evaluation of potential effects of Plastin 3 overexpression and low-dose SMN-antisense oligonucleotides on putative biomarkers in spinal muscular atrophy mice. PLoS One. (2018) ;13: :1–28. https://doi.org/10.1371/journal.pone.0203398 |
[34] | Kariyawasam DST , D’silva A , Lin C , et al. Biomarkers and the development of a personalized medicine approach in spinal muscular atrophy. Front Neurol. (2019) ;10: :1–12. https://doi.org/10.3389/fneur.2019.00898 |
[35] | Renusch SR , Harshman S , Pi H , et al. Spinal muscular atrophy biomarker measurements from blood samples in a clinical trial of valproic acid in ambulatory adults. J Neuro-muscul Dis. 2015: ;2: :119–30. https://doi.org/10.3233/JND-150081 |
[36] | Raposo G , Stoorvogel W . Extracellular vesicles: Exosomes, microvesicles, and friends. J Cell Biol. (2013) ;200: :373–83. https://doi.org/10.1083/jcb.201211138 |
[37] | Stremersch S , De Smedt SC , Raemdonck K . Therapeutic and diagnostic applications of extracellular vesicles. J Control Release. (2016) ;244: :167–83. https://doi.org/10.1016/j.jconrel.2016.07.054 |
[38] | Saint-Pol J , Gosselet F , Duban-Deweer S , et al. Targeting and crossing the blood-brain barrier with extracellular vesicles. Cells. (2020) ;9: :1–13. https://doi.org/10.3390/cells9040851 |
[39] | Eren E , Leoutsakos JM , Troncoso J , et al. Neuronal-derived EV biomarkers track cognitive decline in Alzheimer’s disease. Cells. 2022;11. https://doi.org/10.3390/cells11030436 |
[40] | Goetzl EJ , Kapogiannis D , Schwartz JB , et al. Decreased synaptic proteins in neuronal exosomes of frontotem-poral dementia and Alzheimer’s disease. FASEB J. (2016) ;30: :4141–8. https://doi.org/10.1096/fj.201600816R |
[41] | Nash LA , McFall ER , Perozzo AM , et al. Survival motor neuron protein is released from cells in exosomes: A potential biomarker for spinal muscular atrophy. Sci Rep. (2017) ;7: :1–15. https://doi.org/10.1038/s41598-017-14313-z |
[42] | Carrera-García L , Muchart J , Lazaro JJ , et al. Pediatric SMA patients with complex spinal anatomy: Implementation and evaluation of a decision-tree algorithm for administration of nusinersen. Eur J Paediatr Neurol. (2021) ;31: :92–101. https://doi.org/10.1016/j.ejpn.2021.02.009 |
[43] | Main M , Kairon H , Mercuri E , Muntoni F . The hammersmith functional motor scale for children with spinal muscular atrophy: A scale to test ability and monitor progress in children with limited ambulation. Eur J Paediatr Neurol. (2003) ;7: :155–9. https://doi.org/10.1016/S1090-3798(03)00060-6 |
[44] | Mazzone ES , Mayhew A , Montes J , et al. Revised upper limb module for spinal muscular atrophy: Development of a new module. Muscle and Nerve. (2017) ;55: :869–74. https://doi.org/10.1002/mus.25430 |
[45] | Willemse EAJ , Teunissen CE . Biobanking of Cerebrospinal Fluid for Biomarker Analysis in Neurological Diseases. 2015, pp. 79–93. |
[46] | Also-Rallo E , Alías L , Martínez-Hernández R , et al. Treatment of spinal muscular atrophy cells with drugs that upregulate SMN expression reveals inter- and intrapatient variability. Eur J Hum Genet. (2011) ;19: :1059–65. https://doi.org/10.1038/ejhg.2011.89 |
[47] | Boza-Morán MG , Martínez-Hernández R , Bernal S , et al. Decay in survival motor neuron and plastin 3 levels during differentiation of iPSC-derived human motor neurons. Sci Rep. (2015) ;5: :1–17. https://doi.org/10.1038/srep11696 |
[48] | Wilke C , Pujol-Calderón F , Barro C , et al. Correlations between serum and CSF pNfH levels in ALS, FTD and controls: A comparison of three analytical approaches. Clin Chem Lab Med. 2019. https://doi.org/10.1515/cclm-2019-0015 |
[49] | Vangoor VR , Gomes-Duarte A , Pasterkamp RJ . Long non-coding RNAs in motor neuron development and disease. J Neurochem. (2021) ;156: :777–801. https://doi.org/10.1111/jnc.15198 |
[50] | d’Ydewalle C , Ramos DM , Pyles NJ , et al. The antisense transcript SMN-AS1 regulates SMN expression and is a novel therapeutic target for spinal muscular atrophy. Neuron. (2017) ;93: :66–79. https://doi.org/10.1016/j.neuron.2016.11.033 |
[51] | Rich KA , Fox A , Yalvac M , et al. Neurofilament levels in CSF and serum in an adult SMA cohort treated with nusinersen. J Neuromuscul Dis. 2022;9. https://doi.org/10.3233/JND-210735 |
[52] | Spicer C , Lu CH , Catapano F , et al. The altered expression of neurofilament in mouse models and patients with spinal muscular atrophy. Ann Clin Transl Neurol. 2021;8. https://doi.org/10.1002/acn3.51336 |
[53] | Wurster CD , Günther R , Steinacker P , et al. Neurochemical markers in CSF of adolescent and adult SMA patients undergoing nusinersen treatment. Ther Adv Neurol Disord. 2019;12. https://doi.org/10.1177/1756286419846058 |
[54] | Olsson B , Alberg L , Cullen NC , et al. NFL is a marker of treatment response in children withSMAtreated with nusinersen. J Neurol. 2019;266. https://doi.org/10.1007/s00415-019-09389-8 |


