
Towards the Identification of Biomarkers for Muscle Function Improvement in Myotonic Dystrophy Type 1
Abstract
Background:
Myotonic dystrophy type 1 (DM1) is the most common muscular dystrophy in adults. In DM1 patients, skeletal muscle is severely impaired, even atrophied and patients experience a progressive decrease in maximum strength. Strength training for these individuals can improve their muscle function and mass, however, the biological processes involved in these improvements remain unknown.
Objective:
This exploratory study aims at identifying the proteomic biomarkers and variables associated with the muscle proteome changes induced by training in DM1 individuals.
Methods:
An ion library was developed from liquid chromatography-tandem mass spectrometry proteomic analyses of Vastus Lateralis muscle biopsies collected in 11 individuals with DM1 pre-and post-training.
Results:
The proteomic analysis showed that the levels of 44 proteins were significantly modulated. A literature review (PubMed, UniProt, PANTHER, REACTOME) classified these proteins into biological sub-classes linked to training-induced response, including immunity, energy metabolism, apoptosis, insulin signaling, myogenesis and muscle contraction. Linear models identified key variables explaining the proteome modulation, including atrophy and hypertrophy factors. Finally, six proteins of interest involved in myogenesis, muscle contraction and insulin signaling were identified: calpain-3 (CAN3; Muscle development, positive regulation of satellite cell activation), 14-3-3 protein epsilon (1433E; Insulin/Insulin-like growth factor, PI3K/Akt signaling), myosin-binding protein H (MYBPH; Regulation of striated muscle contraction), four and a half LIM domains protein 3 (FHL3; Muscle organ development), filamin-C (FLNC; Muscle fiber development) and Cysteine and glycine-rich protein 3 (CSRP3).
Conclusion:
These findings may lead to the identification for DM1 individuals of novel muscle biomarkers for clinical improvement induced by rehabilitation, which could eventually be used in combination with a targeted pharmaceutical approach to improving muscle function, but further studies are needed to confirm those results.
ABBREVIATIONS
AF | atrophy factor |
CAN3 | calpain-3 |
CISY | citrate synthase, mitochondrial |
ABEC2 | C->U- editing enzyme APOBEC-2 |
CTG | cytosine-thymine-guanine |
DDA | data-dependent acquisition |
DTT | dithiothreitol |
DMPK | dystrophy myotonic protein kinase |
EFTU | elongation factor Tu mitochondrial |
FHL3 | four and a half LIM domains protein 3 |
FoxO | forkhead box transcription factor |
HF | hypertrophy factor |
IGF-1 | insulin growth factor |
LC-MS/MS | liquid chromatography-tandem mass spectrometry |
mTOR | mammalian target of rapamycin |
MFD | minimal Feret’s diameter |
MAFbx | muscle atrophy F-box gene |
MBNL1 | musclebind-like 1 |
MuRF1 | muscle ring finger-1 |
DM1 | myotonic dystrophy type 1 |
MYBPH | myosin-binding protein H |
NDUS2 | NADH dehydrogenase [ubiquinone] iron-sulfur protein 2, mitochondrial |
RyR1 | ryanodin receptor 1 |
SERCA1 | sarcoplasmic/endoplasmic reticulum calcium-ATPase 1 |
SUCB1 | succinate–CoA ligase [ADP-forming] subunit beta, mitochondrial |
Var co | variability coefficient |
1433E | 14-3-3 protein epsilon |
CH10 | 10 kDa heat shock protein, mitochondrial |
INTRODUCTION
Myotonic dystrophy type 1 (DM1) is the most prevalent muscular dystrophy in adults worldwide. DM1 is caused by the expansion of unstable cytosine-thymine-guanine (CTG) trinucleotide repetitions in the non-coding 3’ region of the dystrophy myotonic protein kinase (DMPK) gene, located on chromosome 19 [1]. The pathogenic mechanism that leads to DM1 is the RNA toxic gain of function leading to aberrant alternative splicing. Many signaling pathways are dysregulated in DM1 due to the CTG expansion such as the anabolic/catabolic pathways [2, 3] involved in the maintenance of muscle mass as well as cellular mechanisms responsible for the preservation and functionality of muscle proteome such as autophagy, among others [4]. Aberrant gene splicing of two sarcoplasmic proteins regulating intracellular calcium levels, the ryanodin receptor 1 (RyR1) and the sarcoplasmic/endoplasmic reticulum calcium-ATPase 1 (SERCA1), has been documented [5]. Aberrant insulin receptor expression has also been documented in DM1 and was associated with insulin resistance and skeletal muscle atrophy [6, 7]. More precisely, skeletal muscle exhibits a lower expression of the insulin receptor which can contribute to the defective activation of the insulin pathway. The subsequent lower activation of mammalian target of rapamycin (mTOR) and the upregulation of the transcription factors muscle ring finger-1 (MuRF1) and muscle atrophy F-box gene (MAFbx) can partially explain the muscle fiber atrophy observed in DM1 [7].
This multisystemic disease is classified into five clinical phenotypes (congenital, childhood, juvenile, adult and late-onset) and primarily affects skeletal muscle, causing myotonia, muscle atrophy [8] and is characterized by an abnormal variation in the size of their muscle fibers [10]. DM1 also results in a progressive reduction in maximal muscle strength [9], as well as other clinical manifestations include cataracts, cognitive impairments and respiratory insufficiency [8]. Muscle weakness in DM individuals is associated with important physical limitations [11] and is a strong predictor of severely disrupted social participation [12]. Despite the significant impact of DM1, no treatment options are currently available. Encouraging studies have recently shown that chronic exercise mitigated downstream primary disease mechanisms including RNA toxicity, musclebind-like 1 (MBNL1) loss-of-function and alternative mRNA splicing, resulting in improved muscle function in DM1 mice [13, 14]. Strength training is a safe and effective rehabilitation intervention [15] for improving muscle function and inducing muscle growth in individuals with DM1 having abnormal hypertrophy factor of type I and II myofibers at baseline [16]. Indeed, after a 12-week strength training program in men with DM1 improved their maximal knee extensor strength, their performance at the 30-second sit-to-stand test and their walking speed. They also improved their muscle strength evaluated with the one repetition maximum method for leg extension, leg press, hip abduction and squat [16]. The training also reduced their fatigue, daytime sleepiness, and apathy [17]. However, the underlying biological processes involved in these clinical and fundamental gains remain unknown. This exploratory study aims to identify proteins associated with the beneficial effect of strength training in men with DM1 and determine the variables that best explain the modulation of the muscle proteome. While including women and controls participants in the strength training program as well as DM1 participants that did not participate in the strength training would provide valuable data, the recruitment was limited by the fact that DM1 is a rare disease and by the strict criteria that were established to avoid any health issues. Nevertheless, this exploratory study is unique for the field and will help to identify potential biomarkers associated with strength training-induced muscle gains in DM1.
MATERIAL AND METHODS
Experimental Design
This study is a secondary analysis of a larger study in which eleven men with DM1 underwent a 12-week, supervised lower limb strength training program previously reported in Roussel et al. [16]. Inclusion and exclusion criteria can be found in Supplementary material 1. This present study used muscle biopsies collected before and after the training program along with clinical measurements. The second biopsy (post-training) was done one cm above or below the first biopsy on the same leg. Because DM1 is a rare disease, it is important to consider the difficulty to recruit many participants [18] for this type of protocol which includes muscle biopsies collection and a 12-week rehabilitation program. To limit the heterogeneity of this disease, only men were recruited for the training program and to reduce interindividual variability, such as age, each patient was compared to himself.
Participants description
Participants’ characteristics and morphological muscle biopsy characteristics, previously reported by Roussel et al. [16], are presented in Supplementary Tables 1 and 2 respectively. Participants had, on average, 293± 330 CTG repeats and were 48± 11 years old.
Protein Identification and Quantification by Liquid Chromatography-tandem Mass Spectrometry
Sample Preparation
Muscle samples were prepared for liquid chromatography-tandem mass spectrometry (LC-MS/MS) as follows: forty micrograms of each sample were reduced for 15 minutes at 65°C with 10 mM dithiothreitol (DTT) and alkylated for 30 minutes at room temperature in the dark with 15 mM iodoacetamide. Proteins were precipitated with 8 volumes of ice-cold acetone and 1 volume of ice-cold methanol overnight at -80°C. Precipitated proteins were pelleted by centrifugation for 5 minutes at 13,000RPM, at 4°C. The pellets were then washed 3 times with 250μl of cold methanol. Protein pellets were resolubilized in 100μl of 50 mM Tris pH 8.0 with 0.75M urea and pre-digested with 1.33μg of Trypsin/LysC for 3 hours at 37°C with agitation. Another 1.33μg of Trypsin/LysC was added to the proteins and digestion was continued overnight at 37°C with agitation. Samples were then acidified with 2% formic acid and peptides were purified by reversed-phase solid-phase extraction. For the ion library, equal amounts of proteins from each group were pooled (200μg total) and separated on a 4–12% SDS PAGE. After Coomassie blue staining, the gel lanes were cut into 12 bands for each condition, which were then subjected to in-gel digestion with Trypsin/LysC over night at 37°C. After digestion, peptides were extracted by sonication and vortexing and purified using reversed phase solid-phase extraction.
In-house library generation and protein quantification
An in-house ion library was generated with a TripleTOF 5600 controlled by Analyst 1.7 (ABSciex, Foster City, CA, USA) equipped with an electrospray interface, a 25μm iD capillary and coupled to an Eksigent μUHPLC (Eksigent, Redwood City, CA, USA). For the ion library, the acquisition was performed in data-dependent acquisition (DDA). Sample acquisition was performed with a TripleTOF 6600 (ABSciex, Foster City, CA, USA) equipped with an electrospray interface with a 25μm iD capillary and coupled to an Eksigent μUHPLC (eksigent, Redwood City, CA, USA) using SWATH (or data-independent acquisition [DIA]) and gas phase fractionation (350–800 m/z and 800–1250 m/z). Analyst TF 1.8 software was used to control the instrument and for data processing and acquisition. The source voltage was set to 5.5 kV and maintained at 325°C, curtain gas was set at 45 psi, gas one at 25 psi and gas two at 25 psi. Separation was performed on a reversed-phase Kinetex XB column 0.3μm i.d., 2.6μm particles, 150 mm long (Phenomenex) which was maintained at 60°C. Samples were injected by loop overfilling into a 5 μL loop. For the 60 minutes LC gradient, the mobile phase consisted of the following solvent A (0.2% v/v formic acid and 3% DMSO v/v in water) and solvent B (0.2% v/v formic acid and 3% DMSO in EtOH) at a flow rate of 3μL/min. SWATH samples were analyzed on our in-house library using the SWATH 2.0 application of the Peakview software (ABSciex, Foster City, CA, USA) with the following parameters for peptide integration: 4 MS/MS transition per peptide, 10 peptides per protein, 12.5 retention time extraction window, XIC width 25 ppm. The reported quantification for a given protein represents the sum of each peptide that passes the false discovery rate cutoff of 5%, for both gas-phase fractionations. Total protein content of each sample was normalized before injection. The signal has also been normalized following the injection using the total signal of each sample.
Data Analysis
Identification and classification of the significant proteins
Pre- and post-training group comparisons were made by paired t-test and the results presenting a p-value < 0.05 and confirmed after 1,000 permutations were considered significant (permutations threshold of 0.05). The protein level changes were presented as fold changes. The UniProt database (https://uniprot.org), PANTHER Class Information (http://www.pantherdb.org) and the REACTOME database (https://reactome.org) were the bioinformatics tools used to identify the main functional activity of each protein. A literature search in the PubMed database was performed to determine whether the identified proteins were associated with DM1 and/or resistance training. If no publication was located, an association with any other disorder was investigated.
Identification of key variables with linear models
Additional statistical analyses were performed using a linear model to find possible associations between the differences in protein levels, pre- and post-training program, and muscular histomorphological variables presented by the individuals included in the study. The choice of those key variables mostly relied primarily on upon morphological characteristics of the muscle fibers observed at baseline (pre-training) in this cohort of participants and on the reported positive effect of exercise on muscle fiber growth. More precisely, it was previously shown that the distribution of type 1 and/or type 2 muscle fiber size was considered abnormal at baseline in some of the DM1 patients included in this study by presenting abnormal values of variability coefficient of muscle fiber size as well as hypertrophy and atrophy factors (Supplementary Table 2) [16]. Those variables at baseline (pre-training) were then considered in the analyses. The difference in minimal Feret’s diameter (MFD) measured pre- and post-training was also selected as a variable of interest since it is an indicator of the training-induced muscle fiber growth (Supplementary Table 2). Statistical analyses focused on linear models with the difference in protein levels as the dependent variable and included selected explanatory variables described above for type 1 and type 2 fibers. DM1 being described as a progressive disease, each model was tested with or without age as a covariate. The F stat is the ratio of the variation between groups and the variation within the group. A high F stat value means that variation between the groups is highest that variation within the group. However, when the model is complex the model can still be significant with a lower F stat value. Analyses were performed using R version 3.5.1.
Hierarchical clustering of the participants and proteins
A hierarchical clustering analysis grouped the 11 participants based on the difference in levels of the proteins significantly modulated by the training. To determine the clusters, the Euclidian distance between every pair of participants was calculated and Ward’s method was used to calculate similarity and agglomerate individuals into clusters. Analyses were performed using R version 3.5.1.
Data Availability
Anonymized data that support the findings of this study are available from the corresponding author upon reasonable request from qualified investigators and according to local IRB approval.
RESULTS
Proteins differentially expressed in muscle homogenates pre- vs post-training
A total of 624 proteins were identified in the in-house ion library, and among them, 572 proteins were quantified in at least one sample from DM1 muscle biopsies pre- and post-training with LC-MS/MS. Out of the 572 proteins quantified, 44 (7.7%) were significantly affected by the training regime (paired t-test p < 0.05) and validated by the permutation tests (permutations threshold < 0.05). From these 44 proteins, 42 were upregulated and two were downregulated (C->U- editing enzyme APOBEC-2 [ABEC2] and four and a half LIM domains protein 3 [FHL3]) by the training program, (Table 1 and Fig. 1A). Interestingly, eight proteins (Cysteine and glycine-rich protein 3 [CSRP3], myosin-binding protein H [MYBPH],Vacuolar protein-sorting-associated protein 25 [VPS25], Ubiquitin carboxyl-terminal hydrolase 14 [UBP14], immunoglobulin heavy constant gamma 2 [IGHG2], Aldehyde dehydrogenase X, mitochondrial [AL1B1], Heat shock protein HSP 90-alpha [HS90A] and Protein S100-A6 [S10A6]) showed a statistically significant large magnitude fold change (fold change> |1.5| and p < 0.05), while two others (calpain-3 [CAN3] and Carbonyl reductase [NADPH] 1 [CBR1]) presented with a significant fold change close to 1.5 (p < 0.05).
Table 1
List of the proteins significantly modulated by exercise as identified by LC-MS/MS
| Protein | Protein full name | Gene | p-value | Fold change |
| IDH3A | Isocitrate dehydrogenase 3, alpha subunit | IDH3A | 0.000200 | 1.43 |
| SUCA | Succinate–CoA ligase [ADP/GDP-forming] subunit alpha, mitochondrial | SUCLG1 | 0.000200 | 1.35 |
| UGPA | UTP–glucose-1-phosphate uridylyltransferase | UGP2 | 0.000700 | 1.24 |
| PHB2 | Prohibitin-2 | PHB2 | 0.001200 | 1.34 |
| SRCA | Sarcalumenin | SRL | 0.004200 | 1.14 |
| CISY | Citrate synthase, mitochondrial | CS | 0.005500 | 1.19 |
| FLNC | Filamin-C | FLNC | 0.008000 | 1.39 |
| DUS3 | Dual specificity protein phosphatase 3 | DUSP3 | 0.008500 | 1.21 |
| CSRP3 | Cysteine and glycine-rich protein 3 | CSRP3 | 0.008600 | 1.53 |
| KLH41 | Kelch-like protein 41 | KLHL41 | 0.010400 | 1.28 |
| MYBPH | Myosin-binding protein H | MYBPH | 0.011300 | 3.83 |
| 14-3-3E | 14-3-3 protein epsilon | YWHAE | 0.011700 | 1.31 |
| SUCB1 | Succinate–CoA ligase [ADP-forming] subunit beta, mitochondrial | SUCLA2 | 0.012200 | 1.27 |
| LMOD3 | Leiomodin-3 | LMOD3 | 0.012600 | 1.22 |
| GDIB | Rab GDP dissociation inhibitor beta | GDI2 | 0.012700 | 1.20 |
| VPS25 | Vacuolar protein-sorting-associated protein 25 | VPS25 | 0.017100 | 1.69 |
| ANXA6 | Annexin A6 | ANXA6 | 0.019600 | 1.12 |
| CBR1 | Carbonyl reductase [NADPH] 1 | CBR1 | 0.020100 | 1.49 |
| PSB2 | Proteasome subunit beta type-2 | PSMB2 | 0.021400 | 1.41 |
| NIPS2 | Protein NipSnap homolog 2 | NIPSNAP2 | 0.022100 | 1.33 |
| NDUS8 | NADH dehydrogenase [ubiquinone] iron-sulfur protein 8, mitochondrial | NDUFS8 | 0.024200 | 1.31 |
| UBP14 | Ubiquitin carboxyl-terminal hydrolase 14 | USP14 | 0.024400 | 1.69 |
| PRDX5 | Peroxiredoxin-5, mitochondrial | PRDX5 | 0.024700 | 1.38 |
| CH60 | 60 kDa heat shock protein, mitochondrial | HSPD1 | 0.025300 | 1.30 |
| EFTU | Elongation factor Tu, mitochondrial | TUFM | 0.027300 | 1.24 |
| CH10 | 10 kDa heat shock protein, mitochondrial | HSPE1 | 0.027500 | 1.29 |
| IGHG2 | immunoglobulin heavy constant gamma 2 | IGHG2 | 0.028100 | 1.62 |
| ABEC2 | C->U-editing enzyme APOBEC-2 | APOBEC2 | 0.029100 | 0.86 |
| CALU | Calumenin | CALU | 0.030000 | 1.23 |
| LRC39 | Leucine-rich repeat-containing protein 39 | LRRC39 | 0,031600 | 1.24 |
| DECR | 2,4-dienoyl-CoA reductase, mitochondrial | DECR1 | 0.034000 | 1.18 |
| DESM | Desmin | DES | 0.035600 | 1.17 |
| AL1B1 | Aldehyde dehydrogenase X, mitochondrial | ALDH1B1 | 0.037200 | 2.82 |
| HS90A | Heat shock protein HSP 90-alpha | HSP90AA1 | 0.037600 | 1.52 |
| 14-3-3G | 14-3-3 protein gamma | YWHAG | 0.039800 | 1.17 |
| NDUS2 | NADH dehydrogenase [ubiquinone] iron-sulfur protein 2, mitochondrial | NDUFS2 | 0.039900 | 1.21 |
| NDUS5 | NADH dehydrogenase [ubiquinone] iron-sulfur protein 5 | NDUFS5 | 0.041400 | 1.33 |
| FHL3 | Four and a half LIM domains protein 3 | FHL3 | 0.041900 | 0.78 |
| RS10 | 40S ribosomal protein S10 | RPS10 | 0.041900 | 1.32 |
| HSPB7 | Heat shock protein beta-7 | HSPB7 | 0.043700 | 1.35 |
| S10A6 | Protein S100-A6 | S100A6 | 0.047500 | 2.31 |
| CAN3 | Calpain-3 | CAPN3 | 0.047700 | 1.48 |
| CYC | Cytochrome c | CYCS | 0.049989 | 1.29 |
| EF1A2 | Elongation factor 1-alpha 2 | EEF1A2 | 0.049998 | 1.29 |
P-values represent pre- and post-training group comparisons made with paired t-tests. Fold changes above 1 indicate protein levels increased by the training and fold changes below 1 indicate protein levels decreased by the training.
Fig. 1
A) Quantified protein level changes following a twelve-week training program. The volcano plot shows log2-transformed fold changes calculated using mean pre- and post-training values from 11 individuals for the 572 proteins measured according to their -log10 p-values. The horizontal dashed line indicates significance p-value cut-off of 0.05 and the vertical dashed lines indicate log2-transformed – 1.5 and 1.5 fold change cut-offs. Proteins with p-values < 0.05 are shown with blue dots, those with log2-transformed – 1.5- and 1.5-fold change are shown with green dots and those fulfilling both criteria are shown with pink dots. Protein names are indicated for all proteins with p-values < 0.05 that pass permutation tests (blue or pink dots). Proteins in bold with bigger dots are those selected according to subsequent analysis steps (classification by fold-change and linear regression models). B) Proteome modulation classification. Overview of the biological sub-classes identified with Uniprot, Pubmed, REACTOME and PANTHER databases in which the 44 proteins significantly modulated by the exercise are involved. NS: non-significant, FC: Fold change.
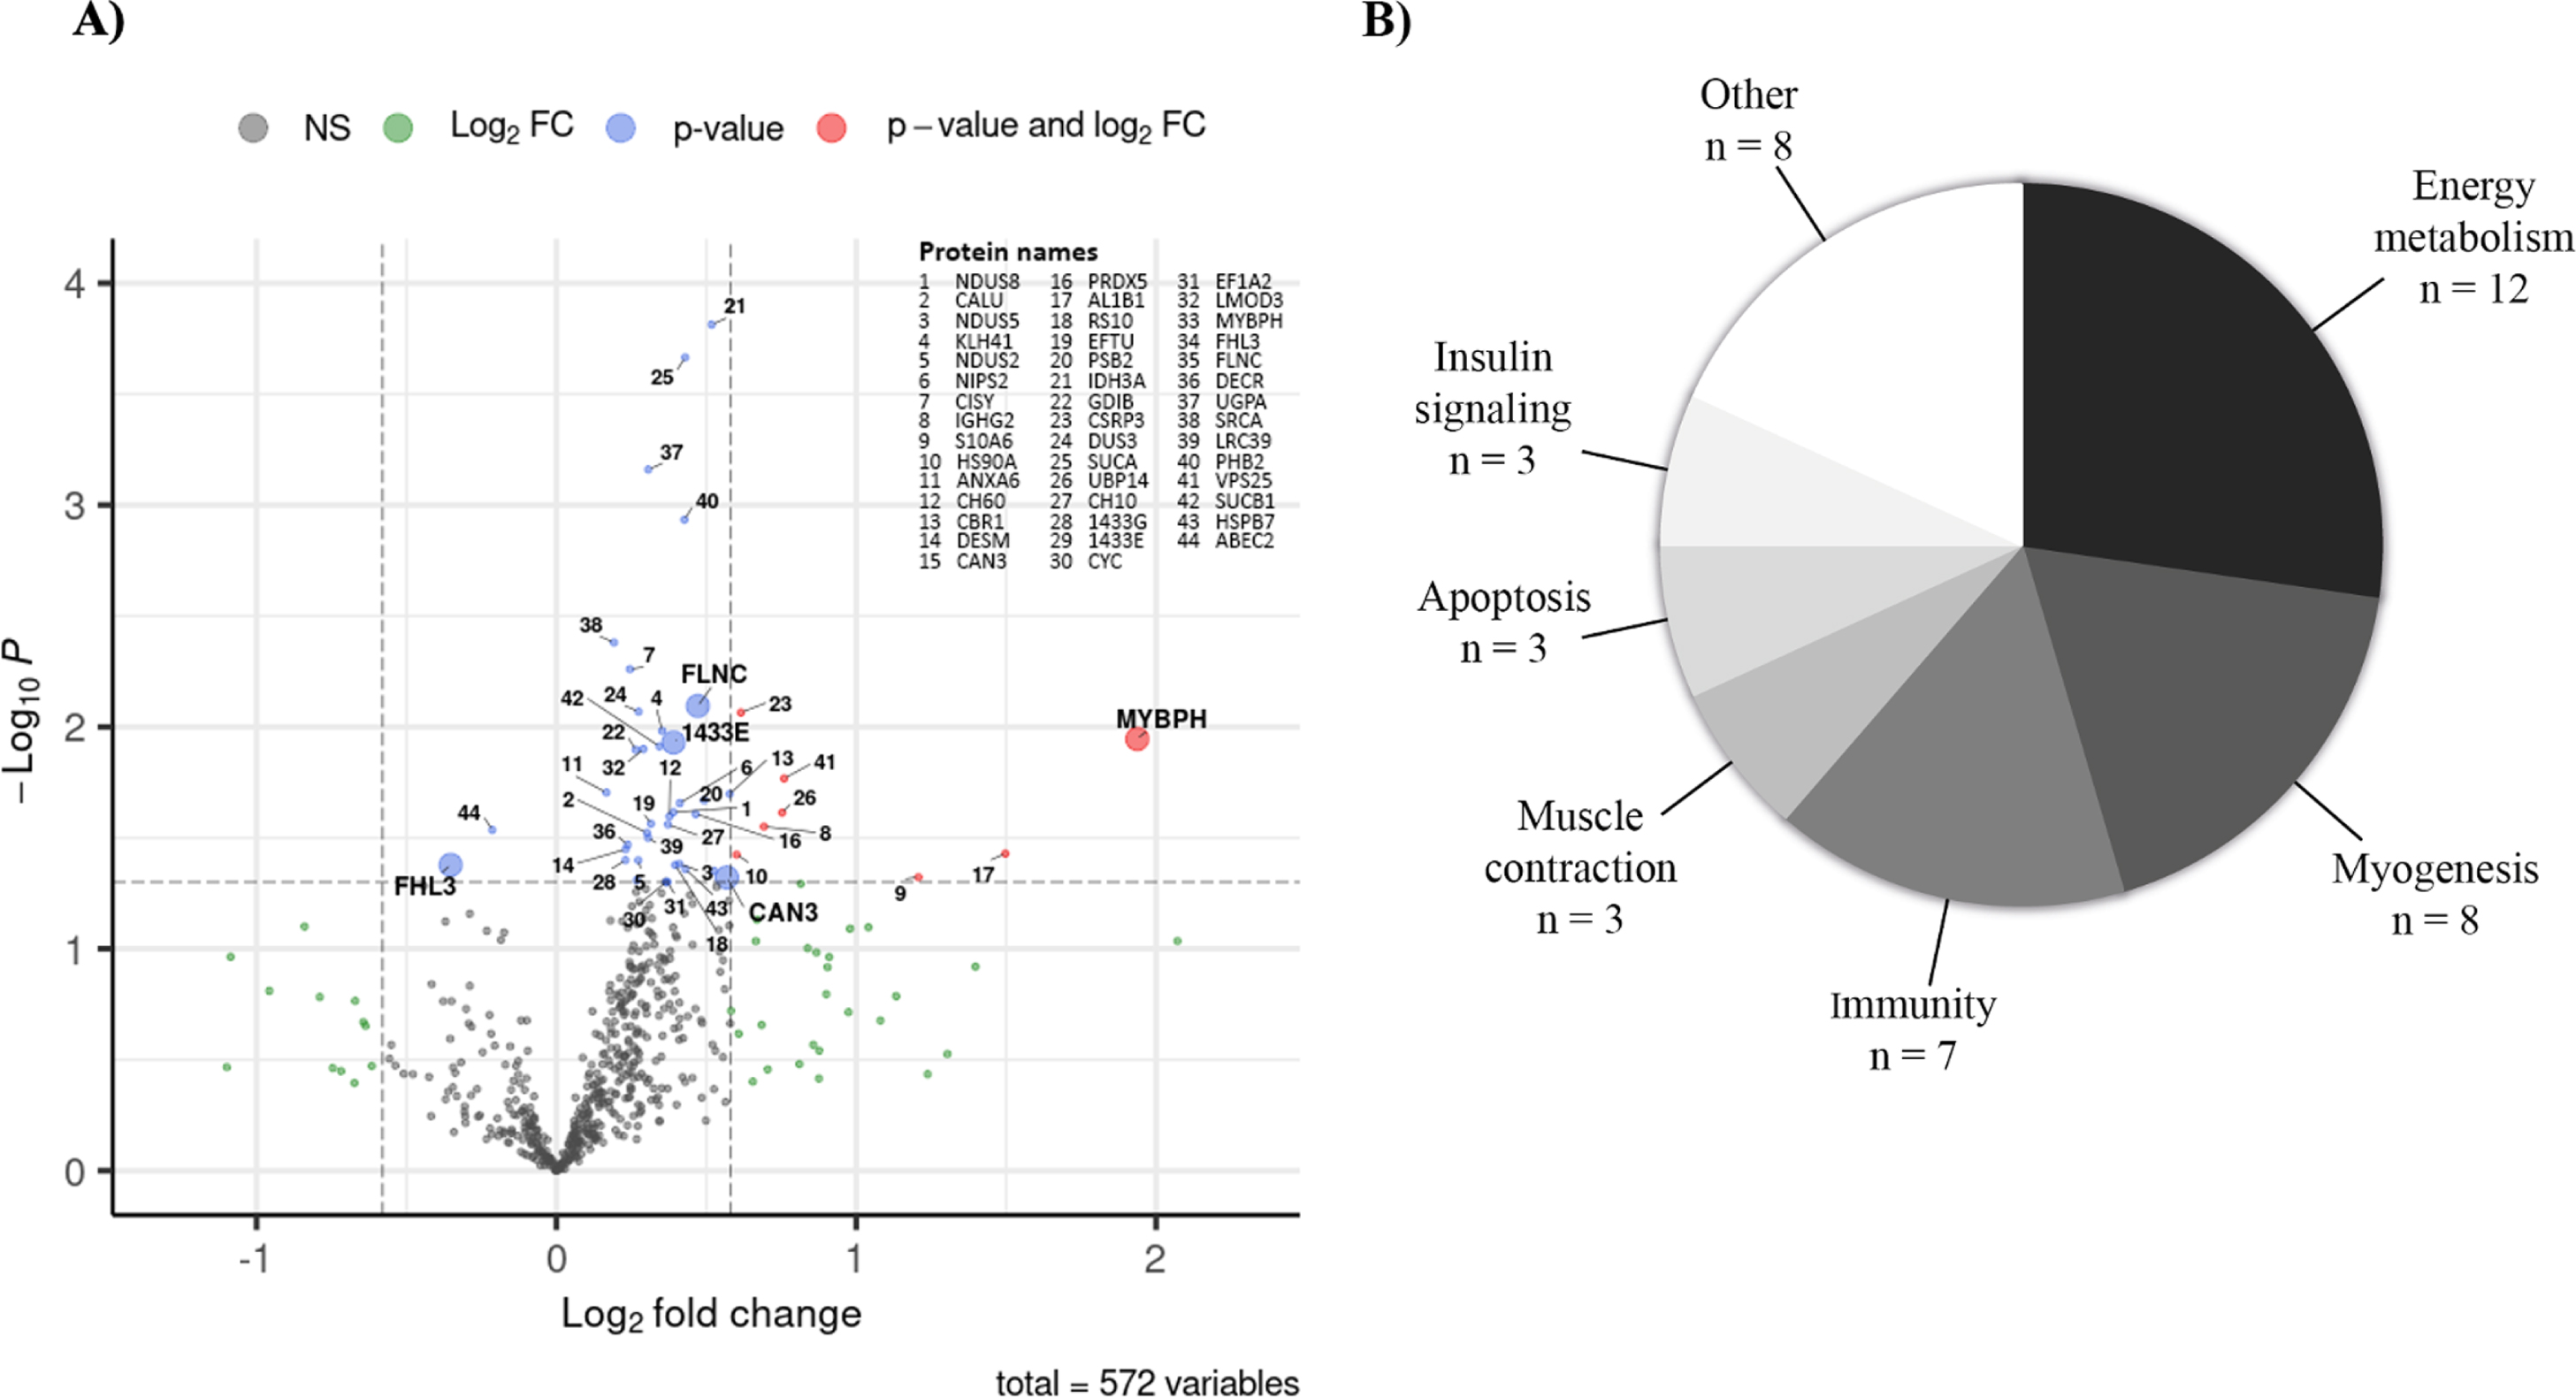
Functional classification of the differentially expressed proteins
The 44 differentially expressed proteins were classified according to their function using the UniProt, PubMed, PANTHER and REACTOME databases and categorized into biological sub-classes (Fig. 1B). For more details about molecular functions and biological processes involved see Supplementary Table 3. The main functional categories in which at least seven proteins out of 44 are involved are energy metabolism (n = 12), myogenesis (n = 8) and immunity (n = 7). Muscle contraction, insulin signaling, and apoptosis sub-classes included three proteins of interest. The last functional category gathered all the other biological sub-classes, each having only one protein significantly modulated by training.
Associations between key variables and the differentially expressed proteins
The proteome modulation was associated with key variables related either to participant characteristics (age), morphological muscle biopsy characteristics at baseline (variability coefficient, hypertrophy, and atrophy factors) or muscle adaptation induced by the training program (difference in MFD measured pre- and post-training). To identify the variables that best explain the modulation of muscle proteome by training, a statistical model was created for each key variable, with age as a covariate. Both type 1 and type 2 fibers were considered for each variable. Table 2 and Supplementary Table 4 reports the significant proteins identified in each statistical model, while the Venn diagram in Fig. 2A shows the number of proteins significantly modulated by training in each model and the intersection of these models. The models that explain part of the variability in protein level differences for the larger number of exclusive proteins (not included in any other model) were the hypertrophy factor (HF) and age (5 exclusive proteins from a total of 7 proteins) as well as the atrophy factor (AF) and age (4 exclusive proteins from a total of 9 proteins). These models shared only one protein in common while sharing other protein changes with the variability coefficient (Var co) and age model (n = 1 and n = 4 respectively). The variability coefficient (Var co) and age model explained only one exclusive protein but shared proteins with the other models, while the MFD and age model explained three exclusive proteins and shared only one with the variability coefficient (Var co) and age model. These results suggest that the atrophy and hypertrophy factors represent key variables of interest in explaining the proteome modulation by training. As shown in Fig. 2B and 2C, the main biological subclass for atrophy and hypertrophy factors is energy metabolism. Other interesting biological classes are related to myogenesis, insulin signaling, muscle contraction and apoptosis. Figure 2D presents the regression models for the difference in the expression of four proteins after training and the factors that explain those differences. Among the significant proteins identified in the atrophy factor (AF) and age as well as hypertrophy factor (HF) and age models, four identified proteins were of particular interest due to their known functions linked to DM1 and their regression model is presented in Fig. 2D: 1433E and MYBPH (atrophy factor + age model) as well as FHL3 and FLNC (hypertrophy factor + age model).
Fig. 2
Association between key variables and proteome modulation in DM1. A) Venn Diagram showing the number of proteins whose changes in expression level are partly explained by each model or each combination of models. B) Pie chart representing the distribution of the proteins amongst the 44 associated proteins that were identified in the atrophy + age (n = 9 proteins) and C) hypertrophy + age models (n = 7 proteins) according to their biological functions. D) Regression models showing the interaction between variables of the atrophy + age model with 1433E and MYBPH proteins as well as between variables of the hypertrophy + age model with FHL3 and FLNC proteins. Each graph includes Pearsons’ correlation coefficient between the variable and the protein level as well as the regression coefficient and p-value for this variable within the regression model. AF: Atrophy factor; AFT1: Atrophy factor for type 1 fibers; AFT2: Atrophy factor for type 2 fibers; Diff: Difference; HF: Hypertrophy factor; HFT1: Hypertrophy factor for type 1 fibers; HFT2: Hypertrophy factor for type 2 fibers; MFD: Minimal Feret’s diameter; Var co: Variability coefficient.
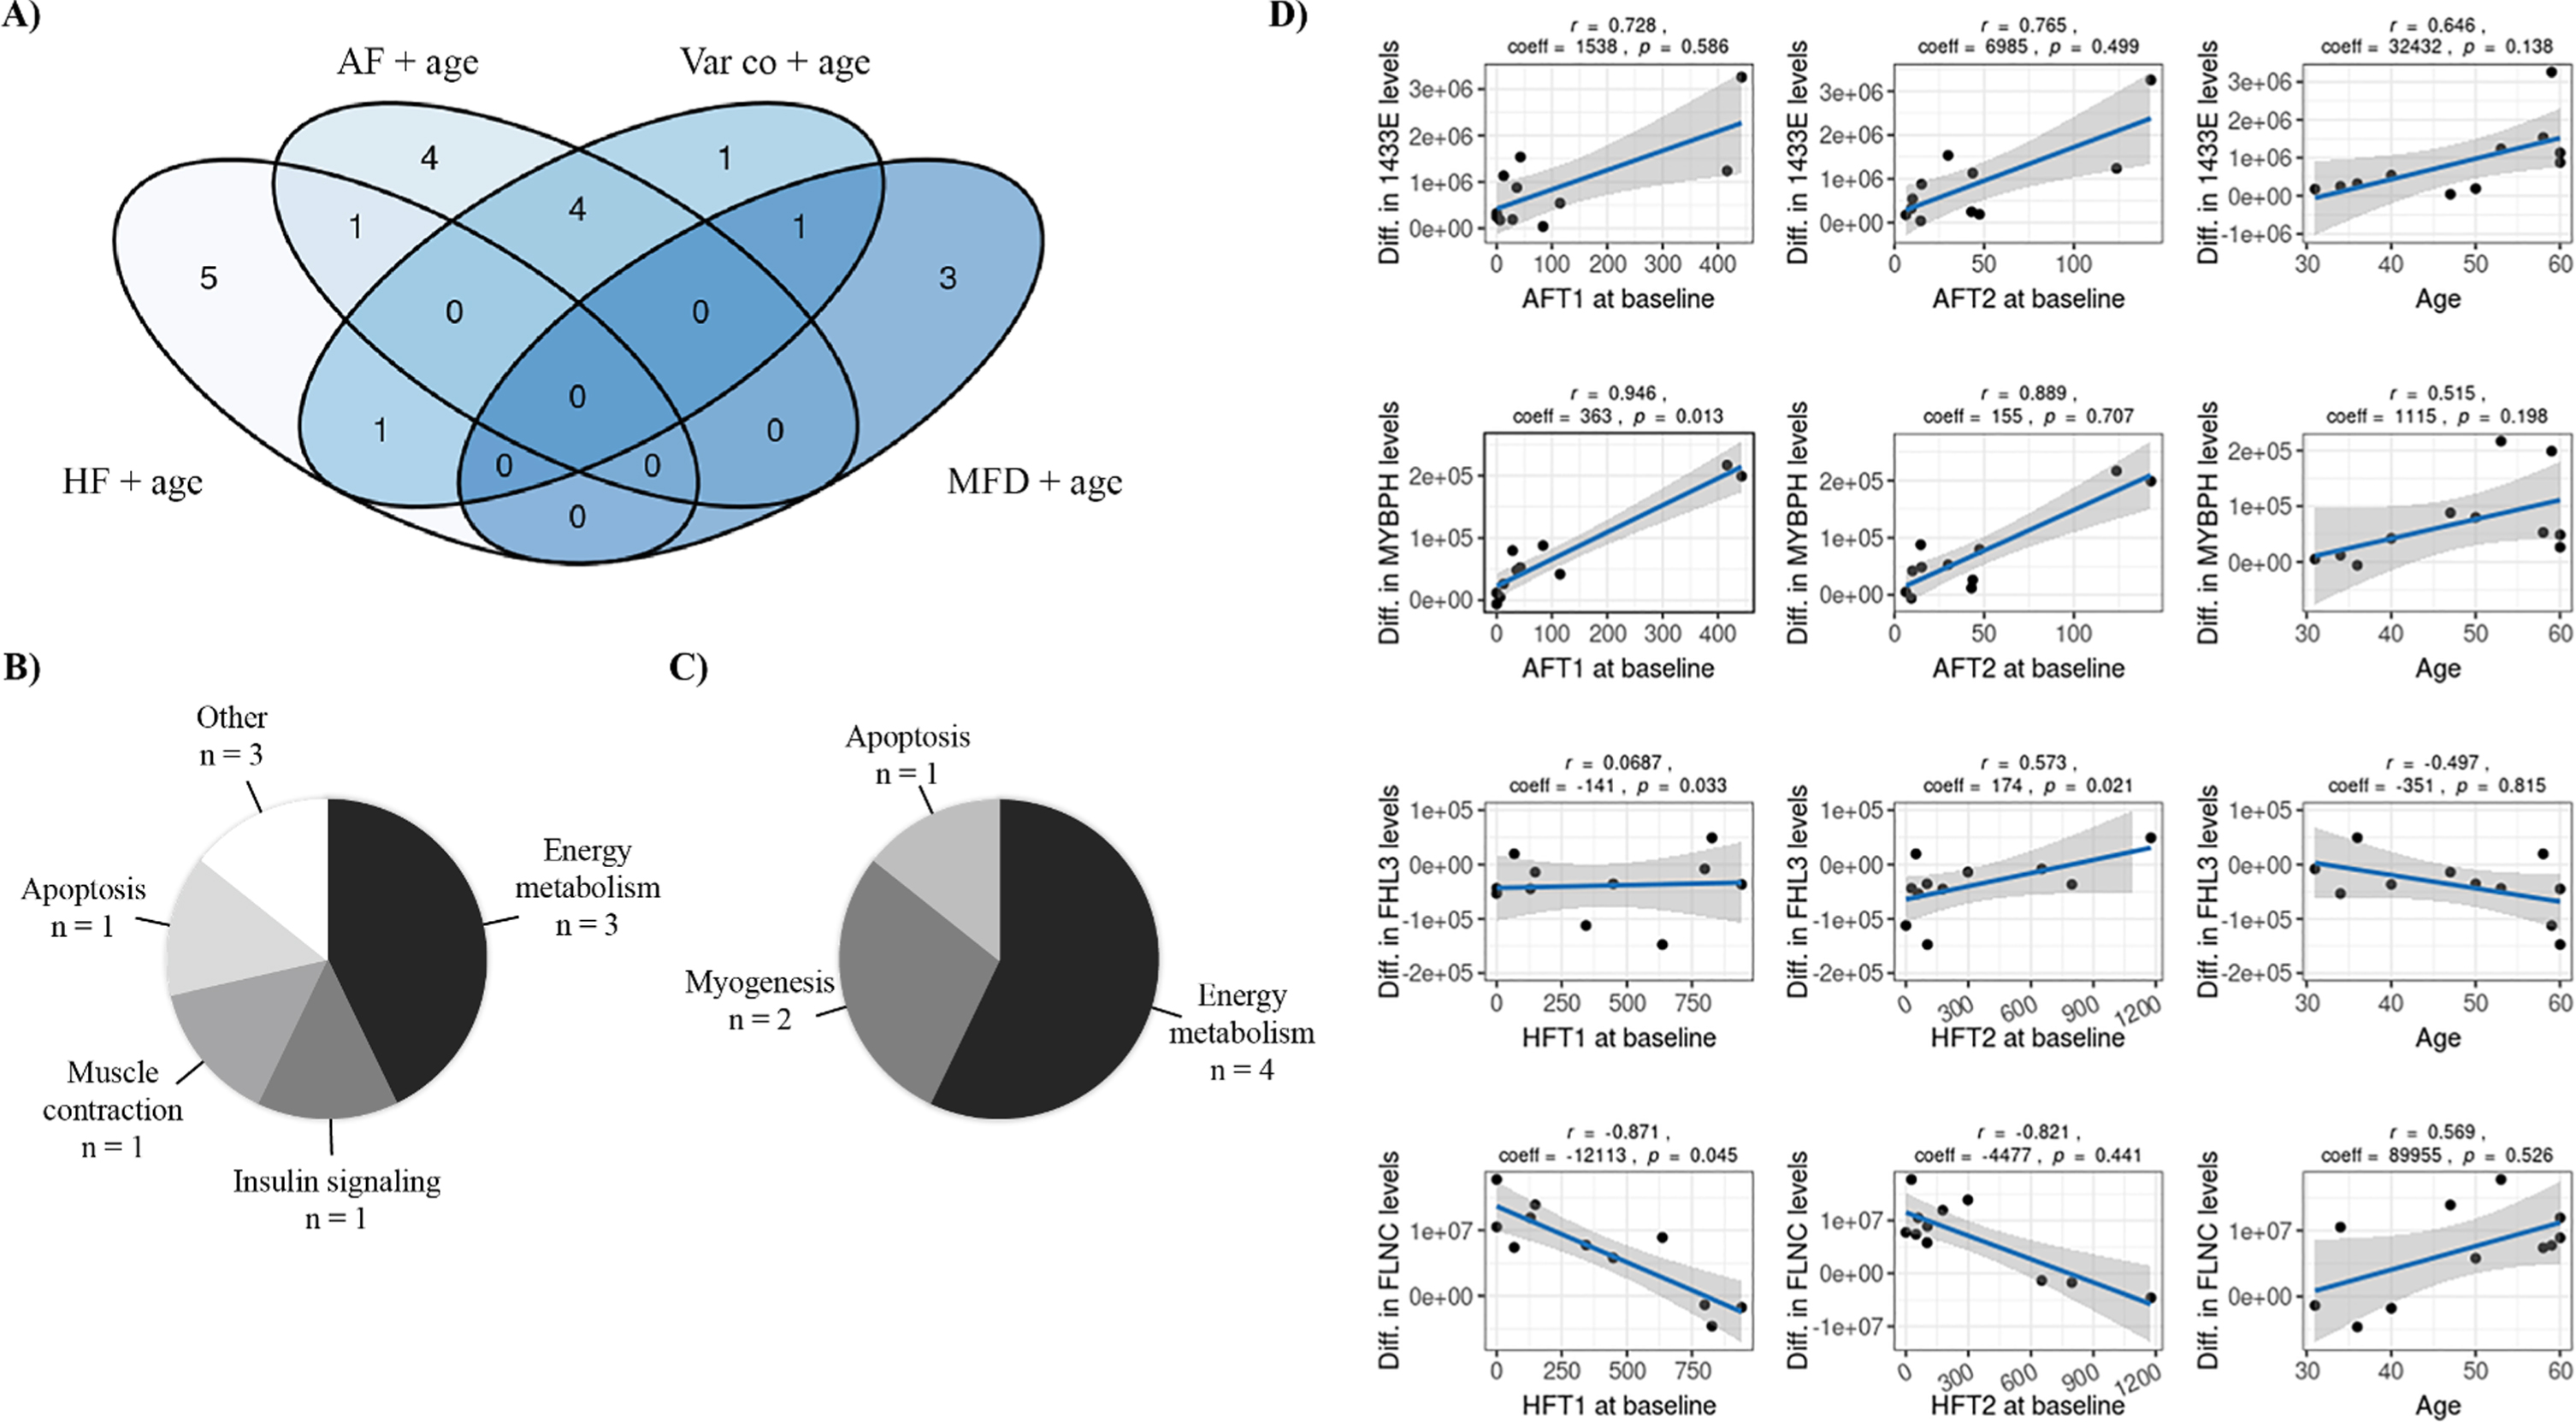
Table 2
List of the proteins significantly modulated by exercise identified with the hypertrophy and atrophy factors statistical models
| Proteins | Hypertrophy Factor | Atrophy Factor | ||||||
| Simple | + Age | Simple | + Age | |||||
| F Stat | p-value | F Stat | p-value | F Stat | p-value | F Stat | p-value | |
| NDUS8 | 0.7555 | 0.5006 | 4.6640 | 0.0429* | 2.4574 | 0.1472 | 5.3535 | 0.0313* |
| NDUS5 | 0.7137 | 0.5186 | 5.5674 | 0.0286* | 0.9243 | 0.4354 | 2.9297 | 0.1092 |
| NDUS2 | 0.4866 | 0.6318 | 0.5979 | 0.6364 | 6.8960 | 0.0182* | 4.3007 | 0.0512 |
| NIPS2 | 0.0160 | 0.9841 | 1.1744 | 0.3856 | 1.6166 | 0.2572 | 7.4581 | 0.0139* |
| CISY | 6.3797 | 0.0221* | 3.7338 | 0.0687 | 3.4294 | 0.0840 | 2.3517 | 0.1585 |
| S10A6 | 0.7939 | 0.4847 | 0.4633 | 0.7168 | 7.5485 | 0.0144* | 4.6545 | 0.0431* |
| CH60 | 3.9512 | 0.0640 | 3.3115 | 0.0870 | 3.0226 | 0.1053 | 1.8177 | 0.2317 |
| DESM | 0.5769 | 0.5834 | 1.7731 | 0.2396 | 0.9096 | 0.4406 | 1.7793 | 0.2385 |
| PRDX5 | 1.3202 | 0.3195 | 4.8103 | 0.0400* | 1.2916 | 0.3265 | 0.8420 | 0.5128 |
| AL1B1 | 0.1721 | 0.8449 | 0.2354 | 0.8690 | 24.700 | 0.0004* | 14.438 | 0.0022* |
| RS10 | 0.9173 | 0.4379 | 1.9087 | 0.2166 | 5.1537 | 0.0365* | 6.2524 | 0.0216* |
| PSB2 | 2.3918 | 0.1534 | 1.4134 | 0.3169 | 2.0649 | 0.1892 | 1.2311 | 0.3678 |
| IDH3A | 3.0843 | 0.1016 | 5.3126 | 0.0319* | 1.1804 | 0.3555 | 1.2246 | 0.3698 |
| GDIB | 2.6698 | 0.1294 | 1.7081 | 0.2517 | 4.9265 | 0.0403* | 3.4961 | 0.0783 |
| CSRP3 | 0.5969 | 0.5733 | 1.0988 | 0.4109 | 0.3736 | 0.6997 | 1.0944 | 0.4125 |
| SUCA | 0.0203 | 0.9799 | 0.1228 | 0.9437 | 14.476 | 0.0022* | 9.1692 | 0.0080* |
| CH10 | 0.9682 | 0.4202 | 1.6582 | 0.2615 | 2.1081 | 0.1839 | 1.2301 | 0.3681 |
| 1433G | 0.9682 | 0.4215 | 1.5769 | 0.2785 | 4.7147 | 0.0444* | 3.5716 | 0.0751 |
| 1433E | 1.3037 | 0.3235 | 1.7920 | 0.2362 | 5.8405 | 0.0273* | 5.7030 | 0.0270* |
| EF1A2 | 1.7272 | 0.2379 | 1.6081 | 0.2718 | 6.6273 | 0.0201* | 5.3622 | 0.0312* |
| MYBPH | 1.6152 | 0.2575 | 1.2104 | 0.3742 | 37.303 | 0.0001* | 28.736 | 0.0003* |
| FHL3 | 8.2589 | 0.0113* | 4.8782 | 0.0388* | 2.0701 | 0.1886 | 1.6612 | 0.2609 |
| FLNC | 17.3961 | 0.0012* | 10.9429 | 0.0049* | 1.2790 | 0.3296 | 1.4935 | 0.2973 |
| SUCB1 | 9.2700 | 0.0083* | 7.4067 | 0.0141* | 1.5213 | 0.2755 | 3.4582 | 0.0800 |
| HSPB7 | 0.0163 | 0.9839 | 0.8787 | 0.4966 | 0.2049 | 0.2755 | 0.5429 | 0.6682 |
*Significantly modulated. F Stat = F statistic.
Hierarchical clustering of the participants by the expression level of the 44 proteins
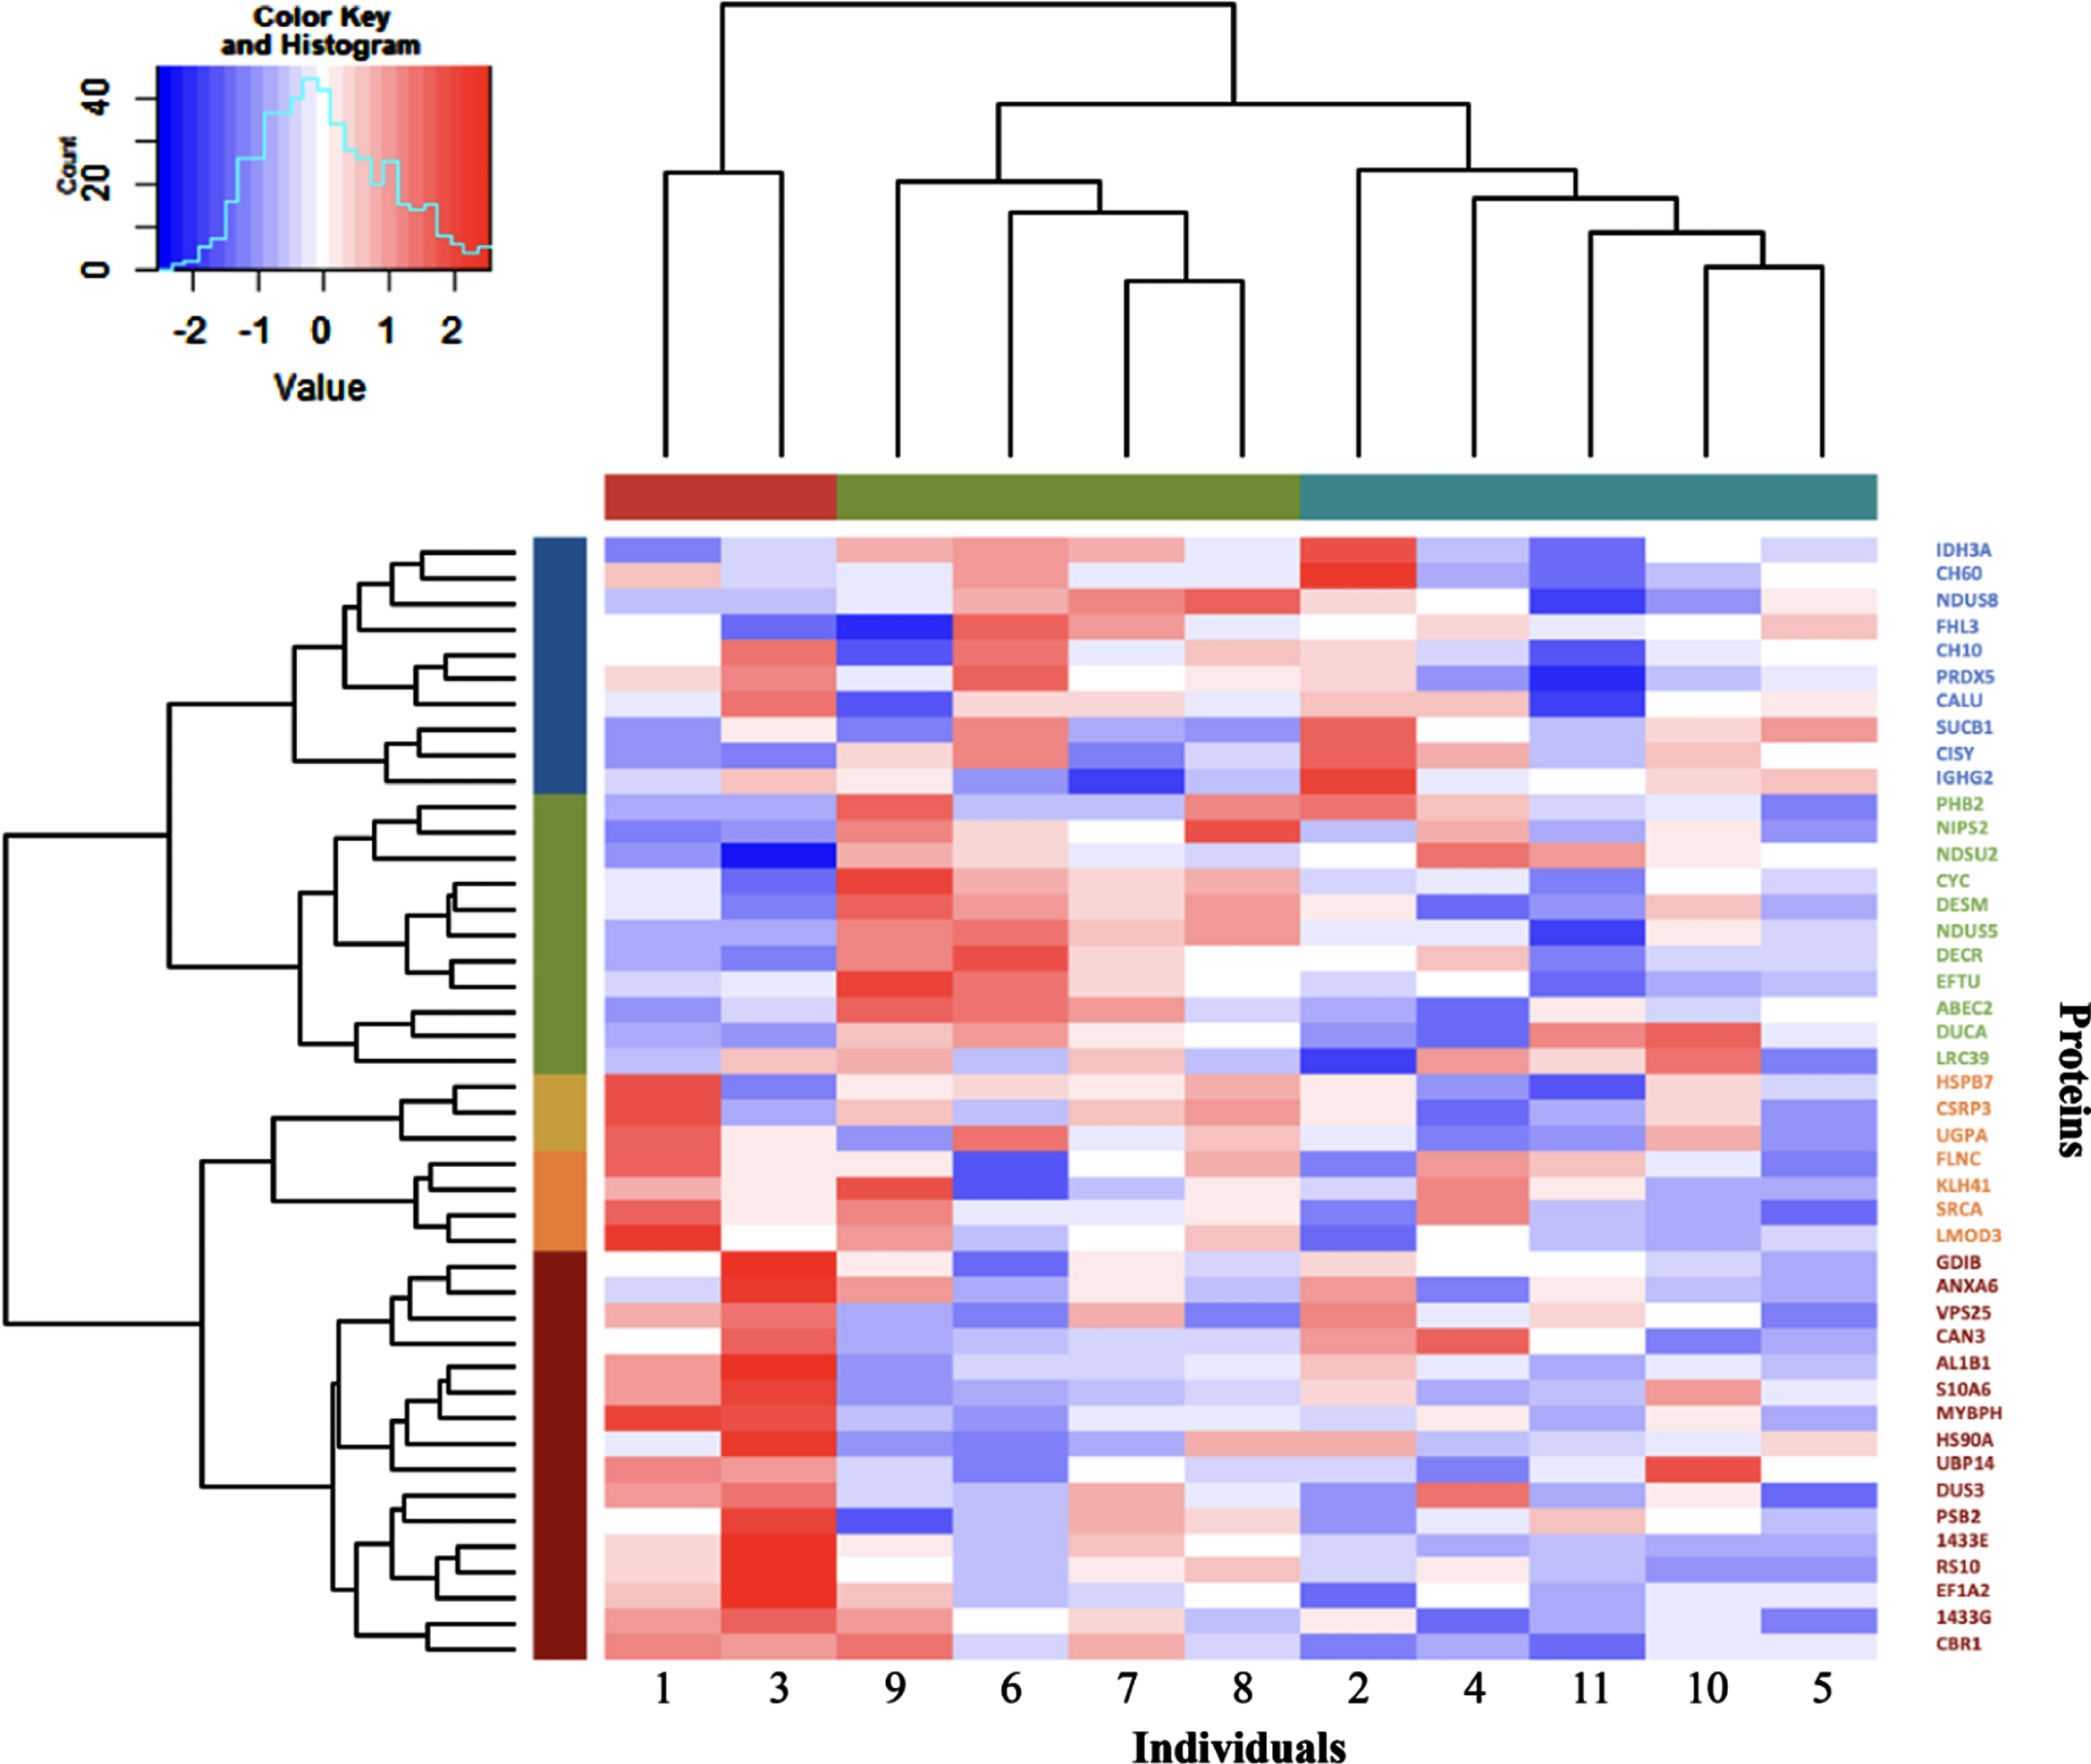
The expression level of the 44 significantly expressed proteins was used in Hierarchical Cluster Analysis to separate participants in different clusters, as depicted in Fig. 3. Participants were classified into three groups: one with only two patients (represented in red, #1 and #3) and two other larger groups with four (represented in green, #9, #6, #7 and #8) and five patients (represented in blue, #2, #4, #11, #10 and #5). Interestingly, some of the proteins modulations induced by training appear to be driven by a few participants. For example, MYBPH which is the protein showing the higher fold change induced by training showed a large upregulation for participants 1 and 3, a modest downregulation for participants 9, 6, 2, 11 and 5 and only small changes for participants 7, 8, 4 and 10. A similar pattern can be seen for the other proteins as well where only a few participants showed large changes in proteins expression following training. We also confirmed the association between MYBPH levels differences induced by training and atrophy factor for muscle fiber types 1 and 2 (Supplemental Fig. 1) with participants 1 and 3 again driving the associations.
Fig. 3
Hierarchical clustering of the 11 DM1 participants and the 44 proteins significantly modulated by exercise. In the dendrogram, the columns represent the 11 participants, and the rows indicate the 44 significantly associated proteins. The participants were categorized into hierarchical groups by similarity using values of protein level differences between pre- and post-training. Groups of participants and proteins are shown with different colours below the top dendrogram for the individuals and beside the left dendrogram for the proteins. Colours in the heatmap represent the increase (red colour) or decrease (blue colour) of protein levels after training (from -2 blue to 2 red coloring). The analysis identified three groups of participants.
DISCUSSION
Progressive muscle weakness is a hallmark of DM1 with a significant impact on patient’s lives yet there is currently no cure available for this disease. As an accessible, low-cost, and non-pharmacological intervention, strength training is promising therapeutic strategy to counter muscle weakness among DM1 patients. We recently conducted a study showing immediate and long-term muscular and functional gains following a 12-week strength training program in DM1, suggesting a hypertrophic response [16]. To identify the molecular signature of the clinical improvement induced by acute exercise and chronic training, proteomics analyses can be a useful tool. Proteins that change immediately after acute exercise are mainly involved in supporting muscle activity or the processes of recovery and adaptation [19]. The current study focused on protein differences between trained and untrained muscles which may be related more closely to differences in muscle function [19]. This study is the first to examine the muscle response to strength training in the DM1 population. In this study, we reported that 44 proteins (about 7%) of the 572 proteins identified in our ion library were significantly modulated in DM1 patients by training. These proteins are involved in various molecular and biological functions including energy metabolism, myogenesis, muscle contraction, insulin signaling and apoptosis. Age as well as atrophy and hypertrophy factors were the best variables to explain the modulation of proteins induced by this training.
Interestingly, some of the molecular and biological functions modulated by training in DM1 (energy metabolism and myogenesis) were also positively impacted by exercise in healthy individuals. Indeed, using physically active healthy individuals, Ubaida-Mohien et al. conducted a proteomic study that showed metabolism and inflammatory responses are boosted by exercise with significant upregulations in the energy machinery, the mobilization of immune cells, the regulation of myogenesis and protein synthesis [20]. Other proteomic analyses of exercise-trained skeletal muscle demonstrated improvements in mitochondrial metabolism, calcium signaling, lipid and glucose metabolism, and transcription [19, 21–23]. In our study, 11% of the proteins modulated by training (5 out of the 44) have been previously shown to be modulated by training in healthy subjects. Indeed, Egan et al found that both elongation factor Tu mitochondrial (EFTU) and 10 kDa heat shock protein, mitochondrial (CH10), both proteins significantly modulated in our study, were upregulated following two weeks of daily cycling [23]. Additionally, Schild et al. showed that succinate-CoA ligase [ADP-forming] subunit beta, mitochondrial (SUCB1), citrate synthase, mitochondrial (CISY) and NADH dehydrogenase [ubiquinone] iron-sulfur protein 2, mitochondrial (NDUS2) levels were increased in a study including trained participants (>5 hours per week of endurance exercise for five years prior to the study) compared to untrained participants [24], which agrees with the finding of our study. Taken together these results are encouraging in that despite the genetic defects of DM1, the muscular response induced by training in the DM1 population triggered similar molecular and biological functions and involved similar proteins as the ones reported in the healthy population.
Interestingly CSRP3, one of the ten proteins that were associated with training in DM1 and presented a significant high fold change may have an implication in the disease. Indeed, Rashid et al showed that CSRP3 was involved in the autophagy process in mouse myoblast and myotubes [25]. And another study demonstrated that CSRP3 regulates autophagy in chickens [26]. As autophagy is necessary for muscle development and maintenance, the upregulation of CSRP3 following training may improve muscle integrity. Autophagy regulators have been shown to be upregulated in a mouse model of DM1 mice (HSA-LR) with a single session of exercise able to bring autophagy regulator levels to normal levels [27]. Another protein of interest from our study is CAN3, a structural constituent of the muscle involved in myogenesis through its regulation of satellite cell activation. This protein, encoded by the gene CAPN3, was upregulated by our training program, which may induce a positive effect on myogenesis. Interestingly, splicing of CAPN3 is affected in DM1 (exclusion of exon 16) and is associated with reduced protease activity thus resulting in muscle weakness [28]. Further studies are needed to clarify CAPN3’s molecular mechanism and physiological implications in DM1 and strength training. While both CSRP3 and CAPN3 have implications for DM1, a direct role of the other eight proteins in DM1 is currently unknown.
The linear models in this study highlighted four proteins of interest: 1433E, MYBPH, FHL3 and FLNC, which are all upregulated by the training except FHL3. Though the biological role of the 1433/insulin growth factor (IGF-1) receptor kinase interaction remains to be fully understood, the interaction of 1433 proteins with IGF-1 receptor is thought to be involved in modulating a variety of processes such as the recruitment of IGF-1 signaling components to the receptor [29]. Under physiological conditions, the activation of Akt leads to forkhead-box transcription factor (FoxO) protein phosphorylation and their cytosolic export which is mediated by the 1433 proteins [30–33]. PI3K/Akt signaling is inactivated in muscle wasting, which causes FoxO3 dephosphorylation by the protein phosphatase 2A causing the dissociation of the FoxO-14-3-3 complex. FoxO3 is subsequently translocated to the nucleus and its transcriptional functions are activated, where it can carry out its proteolytic functions [31, 33–36]. Therefore, upregulation of 1433 proteins, as observed in our DM1 patients following training, would help to stabilize FoxO3 phosphorylation and keep it in the cytosol, thus limiting proteolysis. Similar to 1433E, the functional role of MYBPH, a structural constituent of the muscle that regulates striated muscle contraction; is still unclear [37]. Mouton et al. demonstrated that MYBPH and its cardiac isomer MYBPC play an important role in cardiac contractility, suggesting that MYBPH plays a similar role in the skeletal muscle [38]. In line with this, our results could suggest that MYBPH would make an interesting biomarker in DM1, but as the results were mainly driven by two participants and we don’t want to overinterpret the data, further studies will be needed to confirm that. FHL3, one of the two proteins that were downregulated by training, is a member of four and a half LIM family proteins, which are transcriptional regulators of actin and cytoskeleton involved in skeletal myogenesis. Its overexpression affects myoblast differentiation and fusion by negatively regulating murine myotube formation [39]. As such it is possible that FHL3’s downregulation by strength training could limit its negative impact on myogenesis. Finally, FLNC is an actin-binding protein involved directly in the myogenic process. Dalkilic et al. revealed that loss of FLNC in murine muscle leads to altered primary myogenesis with FLNC-deficient mice exhibiting impaired muscle differentiation [40]. Thus, upregulation of FLNC by strength training may have a protective impact on myogenesis.
The large heterogeneity of DM1 can be seen in the hierarchical clustering of the proteomics data, which identifies characteristics shared by the same cluster of individuals based on their protein expression levels and indicates a similar response to training. In another study by our group that studied the transcriptomic changes following the training of the same cohort of participants [41], we also found that most of the significant changes were lost in grouped analyses and concluded that individual analyses were a more accurate way to represent the data. More precisely, we found no common rescued alternative splicing event and little to no changes in gene expression in grouped analyses but considerable variability when splicing and gene expression were looking at on an individual level. This individual variability in DM1, both in transcriptomics and proteomics needs to be considered in any future studies aimed at discovery biomarkers. Indeed, the variability may mean that one biomarker may be suitable for one participant but not another so multiple overlapping biomarkers may need to be examined across individuals. In this study, we were able to identify the source of some of the variability as deriving from histomorphological data of the muscle biopsies, which explains the first grouping of the hierarchical clustering (#1, #3). When looking at the muscle characteristics of these two participants, we noticed that before the training program, they were the only two participants to present abnormal factors of atrophy compared to other participants classified in the two other groups. While the factors that driving the other two clusters of individuals remain elusive, our data confirm that the atrophy factor is a variable of interest.
Strengths and limitations
Knowing clinical and genetic heterogeneity is present in DM1, the first limitation of the present study is the small number of participants and the absence of women among the recruited individuals. However, considering the rare feature of the disease and our restrictive exclusion criteria, the current study size represents a suitable number of participants. There is a risk of overinterpretation of the data when using a less than 1.5-fold-change threshold which is generally used in the field. However, to minimized this type of error, additional methods beyond the p-value (<0.05) were used to identify the proteins of interest such as their establishing their interaction with key histomorphological variables or their biological relevance with DM1 following literature search. Furthermore, the results reported herein provide a proof-of-concept that will help researchers to design more important larger multicentric studies in the future. Also, the analysis of muscle proteome changes must be further studied to verify if our proteomic findings are replicable in DM1 women. The absence of healthy subjects (controls) represents another limitation since the effects of training in the current study cannot be readily dissociated from those of DM1. However, the biological sub-classes obtained from our analysis are similar to those observed in studies with healthy populations. This overlap would imply that muscular functional improvement is possible in DM1. Despite these limitations, our study derives its strength from the highly standardized training program carried out by the participants. Another strong point is the quality of the biological material, muscle samples, over other potential biomarker sources, such as serum. The identification of muscle-specific factors modulated by the training allows the study to target more specific biological pathways, which in turn may opening the way to the identification of other biological biomarkers in less invasive samples like serum or urine. From our analysis, further detailed studies should be conducted across a variety of DM1 patients in order to confirm which muscular biomarker candidates will be the most suitable biomarkers for monitoring DM1 treatment.
CONCLUSION
This exploratory study indicates that strength training in DM1 patients can modulate the expression of multiple muscle proteins involved in essential biological functions that are directly linked to the regulation of muscle mass, including energy metabolism, myogenic and muscle contraction processes, immunity, and insulin signaling. Our findings offer new avenues for future DM1 research such as proteomic investigation of the different biological processes and molecular functions associated with clinical gains from exercise. This exploratory study, in combination with future validating studies, may lay the foundation for a precision medicine approach to improve future therapeutic treatments in DM1.
ACKNOWLEDGMENTS
We want to thank Jean-Philippe Couture from PhenoSwitch Bioscience for his precious help with LC-MS/MS analyses. We want to recognise John Douglas Cleary for the English revision of this manuscript.
CONFLICT OF INTEREST
The authors have no conflict of interest to report.
FUNDING
ED is supported by a Chercheur-boursier Junior 1 salary award from the Fonds de recherche du Québec-santé (FRQS-311186). M-P R holds a Ph.D. study grant from the FRQS. ED and CLaprise are scientific members of the CERMO-FC (www.cermofc.uqam.ca/). CLaprise is the director of the Centre intersectoriel en santé durable de l’UQAC and the chair holder of the Canada Research Chair tier 1 in the Genomics of asthma and allergic diseases (www.chairs.gc.ca). MCM is a Junior 2 Scholar of the Quebec Research Funds – Health. CLégaré is a recipient of a postdoctoral fellowship from the Fonds de la recherche du Québec en santé (FRQS) and from AFM-Telethon.
SUPPLEMENTARY MATERIAL
[1] The supplementary material is available in the electronic version of this article: https://dx.doi.org/10.3233/JND-221645.
REFERENCES
[1] | Fu YH , Pizzuti A , Fenwick RG Jr , King J , Rajnarayan S , Dunne PW , et al, An unstable triplet repeat in a gene related to myotonic muscular dystrophy. Science (New York, NY). (1992) ;255: (5049):1256–8. |
[2] | Vignaud A , Ferry A , Huguet A , Baraibar M , Trollet C , Hyzewicz J , et al. Progressive skeletal muscle weakness in transgenic mice expressing CTG expansions is associated with the activation of the ubiquitin-proteasome pathway, Neuromuscul Disord. (2010) ;20: (5):319–25. |
[3] | Griggs RC , Rennie MJ Muscle wasting in muscular dystrophy: Decreased protein synthesis or increased degradation? Ann Neurol. (1983) ;13: (2):125–32. |
[4] | Beffy P , Del Carratore R , Masini M , Furling D , Puymirat J , Masiello P , et al. Altered signal transduction pathways and induction of autophagy in human myotonic dystrophy type 1 myoblasts, Int J Biochem Cell Biol. (2010) ;42: (12):1973–83. |
[5] | Kimura T , Nakamori M , Lueck JD , Pouliquin P , Aoike F , Fujimura H , et al. Altered mRNA splicing of the skeletal muscle ryanodine receptor and sarcoplasmic/endoplasmic reticulum Ca2+-ATPase in myotonic dystrophy type 1, Hum Mol Genet. (2005) ;14: (15):2189–200. |
[6] | Renna LV , Bosè F , Brigonzi E , Fossati B , Meola G , Cardani R Aberrant insulin receptor expression is associated with insulin resistance and skeletal muscle atrophy in myotonic dystrophies, PLoS One. (2019) ;14: (3):e0214254. |
[7] | Nieuwenhuis S , Okkersen K , Widomska J , Blom P , t Hoen PAC , van Engelen B , et al. Insulin Signaling as a Key Moderator in Myotonic Dystrophy Type 1, Front Neurol. (2019) ;10: :1229. |
[8] | Harper PS . Myotonic Dystrophy. 3rd edition ed(2001) . pp. 436. |
[9] | Petitclerc E , Hebert LJ , Mathieu J , Desrosiers J , Gagnon C Lower limb muscle strength impairment in late-onset and adult myotonic dystrophy type 1 phenotypes, Muscle & Nerve. (2017) ;56: (1):57–63. |
[10] | Vihola A , Bassez G , Meola G , Zhang S , Haapasalo H , Paetau A , et al. Histopathological differences of myotonic dystrophy type 1 (DM1) and PROMM/DM2, Neurology. (2003) ;60: (11):1854–7. |
[11] | Raymond K , Levasseur M , Mathieu J , Gagnon C Progressive Decline in Daily and Social Activities: A 9-year Longitudinal Study of Participation in Myotonic Dystrophy Type 1, Arch Phys Med Rehabil. (2019) ;100: (9):1629–39. |
[12] | Gagnon C , Mathieu J , Jean S , Laberge L , Perron M , Veillette S , et al. Predictors of disrupted social participation in myotonic dystrophy type 1, Arch Phys Med Rehabil. (2008) ;89: (7):1246–55. |
[13] | Ravel-Chapuis A , Al-Rewashdy A , Bélanger G , Jasmin BJ Pharmacological and physiological activation of AMPK improves the spliceopathy in DM1 mouse muscles, Hum Mol Genet. (2018) ;27: (19):3361–76. |
[14] | Manta A , Stouth DW , Xhuti D , Chi L , Rebalka IA , Kalmar JM , et al. Chronic exercise mitigates disease mechanisms and improves muscle function in myotonic dystrophy type 1 mice, J Physiol. (2019) ;597: (5):1361–81. |
[15] | Voet NB , van der Kooi EL , Riphagen II , Lindeman E , van Engelen BG , Geurts AC Strength training and aerobic exercise training for muscle disease, Cochrane Database Syst Rev. (2013) ;7:Cd003907. |
[16] | Roussel MP , Hébert LJ , Duchesne E Strength-training effectively alleviates skeletal muscle impairments in myotonic dystrophy type 1, Neuromuscul Disord. (2020) ;30: (4):283–93. |
[17] | Gallais B , Roussel MP , Laberge L , Hébert LJ , Duchesne E Impact of a 12-week Strength Training Program on Fatigue, Daytime Sleepiness, and Apathy in Men with Myotonic Dystrophy Type 1, J Neuromuscul Dis. (2022) ;9: (5):629–39. |
[18] | Gagne JJ , Thompson L , O’Keefe K , Kesselheim AS Innovative research methods for studying treatments for rare diseases: Methodological review, Bmj. (2014) ;349: :g6802. |
[19] | Burniston JG , Hoffman EP Proteomic responses of skeletal and cardiac muscle to exercise, Expert Rev Proteomics. (2011) ;8: (3):361–77. |
[20] | Ubaida-Mohien C , Gonzalez-Freire M , Lyashkov A , Moaddel R , Chia CW , Simonsick EM , et al. Physical Activity Associated Proteomics of Skeletal Muscle: Being Physically Active in Daily Life May Protect Skeletal Muscle From Aging, Front Physiol. (2019) ;10: :312. |
[21] | Gonzalez-Franquesa A , Stocks B , Chubanava S , Hattel HB , Moreno-Justicia R , Peijs L , et al. Mass-spectrometry-based proteomics reveals mitochondrial supercomplexome plasticity, Cell Rep. (2021) ;35: (8):109180. |
[22] | Deshmukh AS , Steenberg DE , Hostrup M , Birk JB , Larsen JK , Santos A , et al. Deep muscle-proteomic analysis of freeze-dried human muscle biopsies reveals fiber type-specific adaptations to exercise training, Nat Commun. (2021) ;12: (1):304. |
[23] | Cho Y , Ross RS A mini review: Proteomics approaches to understand disused vs, exercised human skeletal muscle. Physiol Genomics. (2018) ;50: (9):746–57. |
[24] | Schild M , Ruhs A , Beiter T , Zügel M , Hudemann J , Reimer A , et al. Basal and exercise induced label-free quantitative protein profiling of m. vastus lateralis in trained and untrained individuals. J Proteomics. (2015) ;122: :119–32. |
[25] | Rashid MM , Runci A , Polletta L , Carnevale I , Morgante E , Foglio E , et al. Muscle LIM protein/CSRP A mechanosensor with a role in autophagy, Cell Death Discov. (2015) ;1: :15014. |
[26] | Cui C , Han S , Tang S , He H , Shen X , Zhao J , et al. The Autophagy Regulatory Molecule CSRP3 Interacts with LC3 and Protects Against Muscular Dystrophy, Int J Mol Sci. (2020) ;21: (3). |
[27] | Mikhail AI , Manta A , Ng SY , Osborne AK , Mattina SR , Mackie MR , et al. A single dose of exercise stimulates skeletal muscle mitochondrial plasticity in myotonic dystrophy type 1, Acta Physiol (Oxf). (2023) ;e13943. |
[28] | Lin X , Miller JW , Mankodi A , Kanadia RN , Yuan Y , Moxley RT , et al. Failure of MBNL1-dependent post-natal splicing transitions in myotonic dystrophy, Hum Mol Genet. (2006) ;15: (13):2087–97. |
[29] | Parvaresch S , Yesilkaya T , Baer K , Al-Hasani H , Klein HW 14-3-3 binding to the IGF-1 receptor is mediated by serine autophosphorylation, FEBS Lett. (2002) ;532: (3):357–62. |
[30] | Brunet A , Bonni A , Zigmond MJ , Lin MZ , Juo P , Hu LS , et al. Akt promotes cell survival by phosphorylating and inhibiting a Forkhead transcription factor, Cell. (1999) ;96: (6):857–68. |
[31] | Cahill CM , Tzivion G , Nasrin N , Ogg S , Dore J , Ruvkun G , et al. Phosphatidylinositol 3-kinase signaling inhibits DAF-16 DNA binding and function via 14-3-3-dependent and 14-3-3-independent pathways, J Biol Chem. (2001) ;276: (16):13402–10. |
[32] | Brunet A , Kanai F , Stehn J , Xu J , Sarbassova D , Frangioni JV , et al. 14-3-3 transits to the nucleus and participates in dynamic nucleocytoplasmic transport, J Cell Biol. (2002) ;156: (5):817–28. |
[33] | Tzivion G , Dobson M , Ramakrishnan G FoxO transcription factors; Regulation by AKT and 14-3-3 proteins, Biochim Biophys Acta. (2011) ;1813: (11):1938–45. |
[34] | Sandri M , Sandri C , Gilbert A , Skurk C , Calabria E , Picard A , et al. Foxo transcription factors induce the atrophy-related ubiquitin ligase atrogin-1 and cause skeletal muscle atrophy, Cell. (2004) ;117: (3):399–412. |
[35] | Singh A , Ye M , Bucur O , Zhu S , Tanya Santos M , Rabinovitz I , et al. Protein phosphatase 2A reactivates FOXO3a through a dynamic interplay with 14-3-3 and AKT, Mol Biol Cell. (2010) ;21: (6):1140–52. |
[36] | Dobson M , Ramakrishnan G , Ma S , Kaplun L , Balan V , Fridman R , et al. Bimodal regulation of FoxO3 by AKT and 14-3-3, Biochim Biophys Acta. (2011) ;1813: (8):1453–64. |
[37] | Vaughan KT , Weber FE , Ried T , Ward DC , Reinach FC , Fischman DA Human myosin-binding protein H (MyBP-H): Complete primary sequence, genomic organization, and chromosomal localization, Genomics. (1993) ;16: (1):34–40. |
[38] | Mouton J , Loos B , Moolman-Smook JC , Kinnear CJ Ascribing novel functions to the sarcomeric protein, myosin binding protein H (MyBPH) in cardiac sarcomere contraction, Exp Cell Res. (2015) ;331: (2):338–51. |
[39] | Cottle DL , McGrath MJ , Cowling BS , Coghill ID , Brown S , Mitchell CA FHL3 binds MyoD and negatively regulates myotube formation, J Cell Sci. (2007) ;120: (Pt 8):1423–35. |
[40] | Dalkilic I , Schienda J , Thompson TG , Kunkel LM Loss of FilaminC (FLNc) results in severe defects in myogenesis and myotube structure, Mol Cell Biol. (2006) ;26: (17):6522–34. |
[41] | Davey EE , Légaré C , Planco L , Shaughnessy S , Lennon CD , Roussel MP , et al. Individual transcriptomic response to strength training for myotonic dystrophy type 1 patients, JCI Insight. (2023) . |
[42] | Dubowitz VS , CA , Lane RJM 3rd ed. Muscle biopsy: A practical approach, xiii. Philadelphia: Saunders Elsevier; (2007) . |


