
Muscle Specific Promotors for Gene Therapy – A Comparative Study in Proliferating and Differentiated Cells
Abstract
Background:
Depending on the therapy approach and disease background, the heterogeneity of muscular tissues complicates the development of targeted gene therapy, where either expression in all muscle types or restriction to only one muscle type is warranted. Muscle specificity can be achieved using promotors mediating tissue specific and sustained physiological expression in the desired muscle types but limited activity in non-targeted tissue. Several muscle specific promotors have been described, but direct comparisons between them are lacking.
Objective:
Here we present a direct comparison of muscle specific Desmin-, MHCK7, microRNA206- and Calpain3 promotor.
Methods:
To directly compare these muscle specific promotors we utilized transfection of reporter plasmids using an in vitro model based on electrical pulse stimulation (EPS) to provoke sarcomere formation in 2D cell culture for quantification of promotor activities in far differentiated mouse and human myotubes.
Results:
We found that Desmin- and MHCK7 promotors showed stronger reporter gene expression levels in proliferating and differentiated myogenic cell lines than miR206 and CAPN3 promotor. However, Desmin and MHCK7 promotor promoted gene expression also cardiac cells whereas miR206 and CAPN3 promotor expression was restricted to skeletal muscle.
Conclusions:
Our results provides direct comparison of muscle specific promotors with regard to expression strengths and specificity as this is important feature to avoid undesired transgene expression in non-target muscle cells for a desired therapy approach.
INTRODUCTION
Gene therapy is a promising strategy to treat genetic diseases including muscular disorders, which are diagnosed with a prevalence of 20–25 per 100.000 births per year [1]. Limb-girdle muscular dystrophies (LGMD) are a subgroup among those hereditary myopathies. Their genetic background is heterogenous with about 30 different loci known to cause the disease. Autosomal recessive LGMDR1 (in previous classification LGMD 2A) is one of the most frequent LGMD forms, caused by genetic variants in the calpain3 (CAPN3) gene. Most LGMDR1 patients have no detectable CAPN3 protein in the affected skeletal muscle which makes gene replacement therapy a principal therapeutical option for the disease. Muscles are on the one hand, a convenient target for gene therapy due to the long lifespan of muscle fibers, high protein synthesis capacity and easy access for intramuscular injections [2]. On the other hand, muscles make up to 30–40% of body weight, therefore, high doses of gene therapy drugs are required [3]. Additionally, muscle tissue is structurally heterogenous and is subdivided in cardiac, skeletal and smooth muscles. This complicates the development of gene therapy that would be either equally effective in different types of muscles or, restricted to one of these muscle tissues [4, 5]. Therefore, targeted gene expression is based on the vector used for the gene transfer and on the regulatory elements for tissue specific regulation of transgene expression. The usage of viral vectors, such as adeno-associated virus (AAV) are considered to be the most promising and safe for in vivo delivery of therapeutic genes [6]. Naturally occurring AAV serotypes such as AAV9, AAV8, AAV6, AAVrh74 and AAV1 have an intrinsic tropism for muscles and allow for better targeting of affected tissues [7–10]. However, this popularity of AAV for gene transfer makes a reduction of the promotor size necessary because of the limited packaging capacity of these viruses (4.7 kb) [6]. It has been reported that AAV mediated Calpain3 (CAPN3) gene transfer under control of a Desmin promotor variant [11] provoke cardiac toxicity related to unregulated proteolytic activity of calpain 3 in mouse model [5] but not in nonhuman primates (NHPs) [12]. Hence, it might be necessary to adjust promotor-transgene combinations with restricted gene expression in the heart, but unlimited skeletal muscle gene expression. Furthermore, it seems to be essential to analyse those promotor-transgene combinations not only in murine muscle tissue but also in human muscle tissue. Therefore, here we present a comparative in vitro study on murine and human proliferating as well as far differentiated/developed muscle cells.
Successful gene therapy relies on a properly selected promotor for transgene expression. This promotor should exhibit limited activity in non-targeted tissue, while conferring long-term sustained, physiological expression in the specific muscle types affected by the disease. We performed an in vitro study of different muscle specific promotors compared to ubiquitous cytomegalovirus CMV-promotor as potential regulatory elements for gene replacement therapy. Promotors based on both, Desmin (DES) as well as muscle creatine kinase (MCK) genes are known to induce gene expression in skeletal and cardiac muscle tissue. Desmin is a muscle-specific cytoskeletal protein belonging to the intermediate filament family, encoded by the Desmin Gene (DES) gene and one of the earliest myogenic markers [13]. This protein is unique in that it is expressed in satellite cells and dividing myoblasts, while its abundance in differentiated muscle cells is several times higher [14]. The transcription of m-type muscle creatine kinase (MCK) is activated when myoblasts differentiate into myocytes leading to strong increase of the MCK-mRNA [15]. Both, DES and MCK gene-based promotors have been well characterized in vitro and in vivo, and large number of variants have been developed so far [4]. One of these variants is the chimeric MHCK7 promotor, which is composed of MCK promotor variant CK7 and a 188-bp enhancer from the mouse α-myosin heavy chain gene (α-Mhc), which ensures a high expression level in the heart [16, 17]. Since Desmin (DES and myosin heavy chain-creatine kinase promotor (MHCK7) are known to induce gene expression in both, skeletal- and cardiac-myocytes [18], we also wanted to test microRNA206 (miR206) and CAPN3 promotors, which are described to promote gene expression restricted to skeletal myocytes [5, 19]. We chose four well-studied immortalized cell lines for our study. While murine C2C12 [20, 21] and human HSKM-Ab1167 [22] myoblasts were used as cell culture model for skeletal muscle tissue, H9C2 rat cardiomyocytes [23] served as cardiac muscle cell culture model. For non-muscular reference, we used HEK293 cell line.
RESULTS
Construction of dual reporter plasmids for quantification of promotor strength
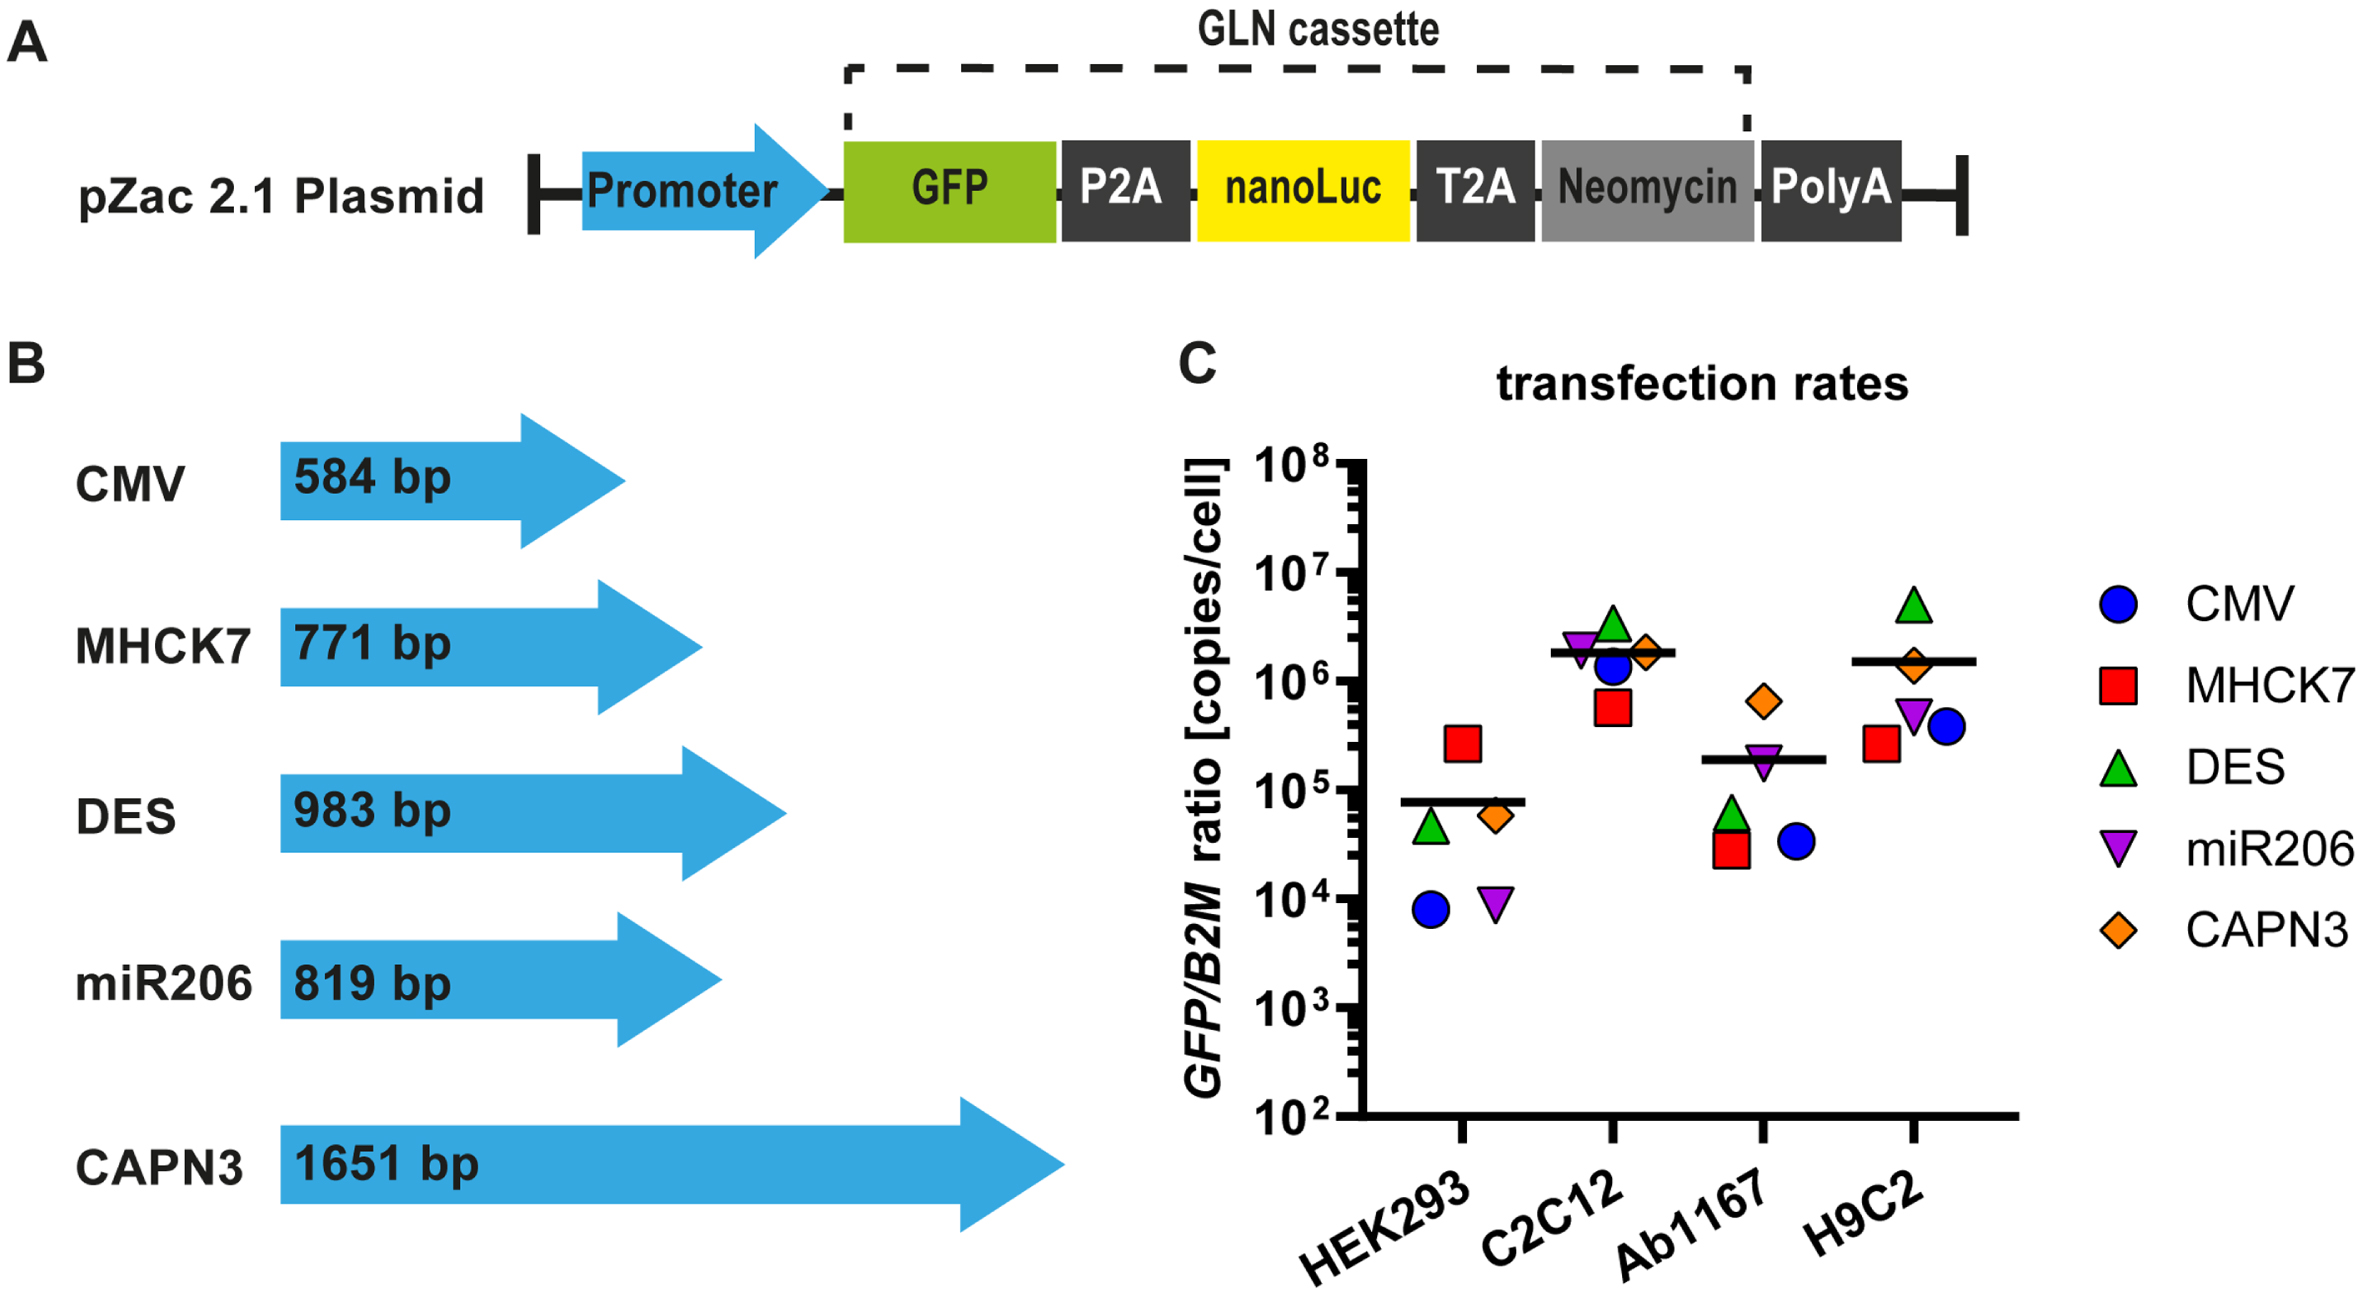
To construct reporter plasmids containing different promotors, we inserted a reporter gene expression cassette, consisting of a GFP-P2A-NanoLuciferase-T2A-neomycin coding region (GLN) and a SV40polyA signal downstream of the promotor sequences present in pZac2.1 plasmid (Fig. 1A). Plasmid transfection protocols were adjusted for the given cell lines (see Material and Methods). To exclude variations in promotor expression rates provoked by unequal plasmid copy numbers due to plasmid size (Fig. 1B), promotor plasmid DNA was spiked with noncoding puc19 plasmid DNA to ensure that each cell line was not only transfected with equal amount of DNA, but also transfected with equal promotor plasmid copy numbers. Transfection rates for each cell type were determined by tEGFP-specific qPCR for in relation to B2M housekeeping gene. Data revealed similar reporter plasmid transfection rates in all four cell lines with no significant difference (Fig. 1C). The overall mean for each cell line was calculated from the respective reporter plasmid transfection rates and is represented by the black line in the graph (Fig. 1C). The lowest transfection rate was measured in HEK293 cells (7.8±4.8×10⁴ copies/cell), followed by Ab1167 (1.9±1.2×10⁵ copies/cell) and H9C2 (1.5±0.9×10⁶ copies/cell). Mouse myocyte cell culture reached the highest transfection rate with 1.8±0.5×10⁶ copies/cell (Fig. 1C).
Fig. 1
Muscle specific promotors and plasmid transfection ratios. (A) The pZac2.1 plasmid containing the respective promotor sequence and the GLN expression cassette. (B) Four muscle specific promotors (MHCK7, DES, miR206 and CAPN3) were tested and compared to a ubiquitous promotor (CMV). Blue arrows represent the relative lengths of promotor sequences. (C) Plasmid transfection protocols were adjusted for HEK293, C2C12, HSKM-Ab1167 and H9C2 cell types and transfection ratios were measured by qPCR for tEGFP in relation to B2M housekeeping gene. Scatter dot plot shows mean GFP/B2M ratios of the respective reporter plasmids in the given cell types (n = 4). Black lines indicate the overall mean of reporter plasmid transfection rates in each cell line.
Quantification of promotor dependent GFP-expression in proliferating cells
To quantify promotor related reporter gene expression level and duration in proliferating cells, the GFP expression mediated by the respective promotors was documented by fluorescence microscopy on four consecutive days post transfection using life cell imaging.
In HEK293 cells the constitutive CMV promotor showed the highest GFP expression. Over four days, of the number of GFP positive cells increased from 36% to 62% (Fig. 2A). In comparison, the muscle-specific promotors showed significantly lower activity. GFP expression under transcriptional control of the MHCK7 promotor increased from 4% on day 1 to a maximum of 10% on day 3. The GFP expression under control of the DES promotor reached a maximum of 11% GFP positive cells on day 2 and decreased to 4 % on day 4. The miR206 and CAPN3 promotors showed the lowest activity in HEK293 cells, with a slight increase in GFP positive cells over 4 days. The miR206 and the CAPN3 promotor induced GFP expression in 2.7% cells on day 4 and 3.2% on day 3 respectively (Fig. 2A).
Fig. 2
Promotor dependent GFP-expression in proliferating cells. Proliferating HEK293 (A), C2C12 (B), HSKM-Ab1167 (C) and H9C2 (D) were transfected with either CMV, MHCK7, DES, miR206 or CAPN3 promotor plasmids. Promotor activity was measured by GFP expression on four consecutive days. Percentage of GFP positive cells is given by number of GFP positive cells/total cell number. Datapoints represent mean values±SEMs (*p < 0.05; **p < 0.01; ***p < 0,001). (E) Representative overview of GFP expression in the given cell types under CMV, MHCK7, DES, miR206 and CAPN3 promotor at post transfection day 1. NT represents non GFP transfected controls, cells were transfected with equal amounts of puc19 spike plasmid. Left panel in each cell type column shows the GFP signal (green) only and right panel shows an overlay of GFP positive cells (green), Hoechst stained nuclei (blue) and whole cells in phase contrast (grey). Scale bar = 100μm.
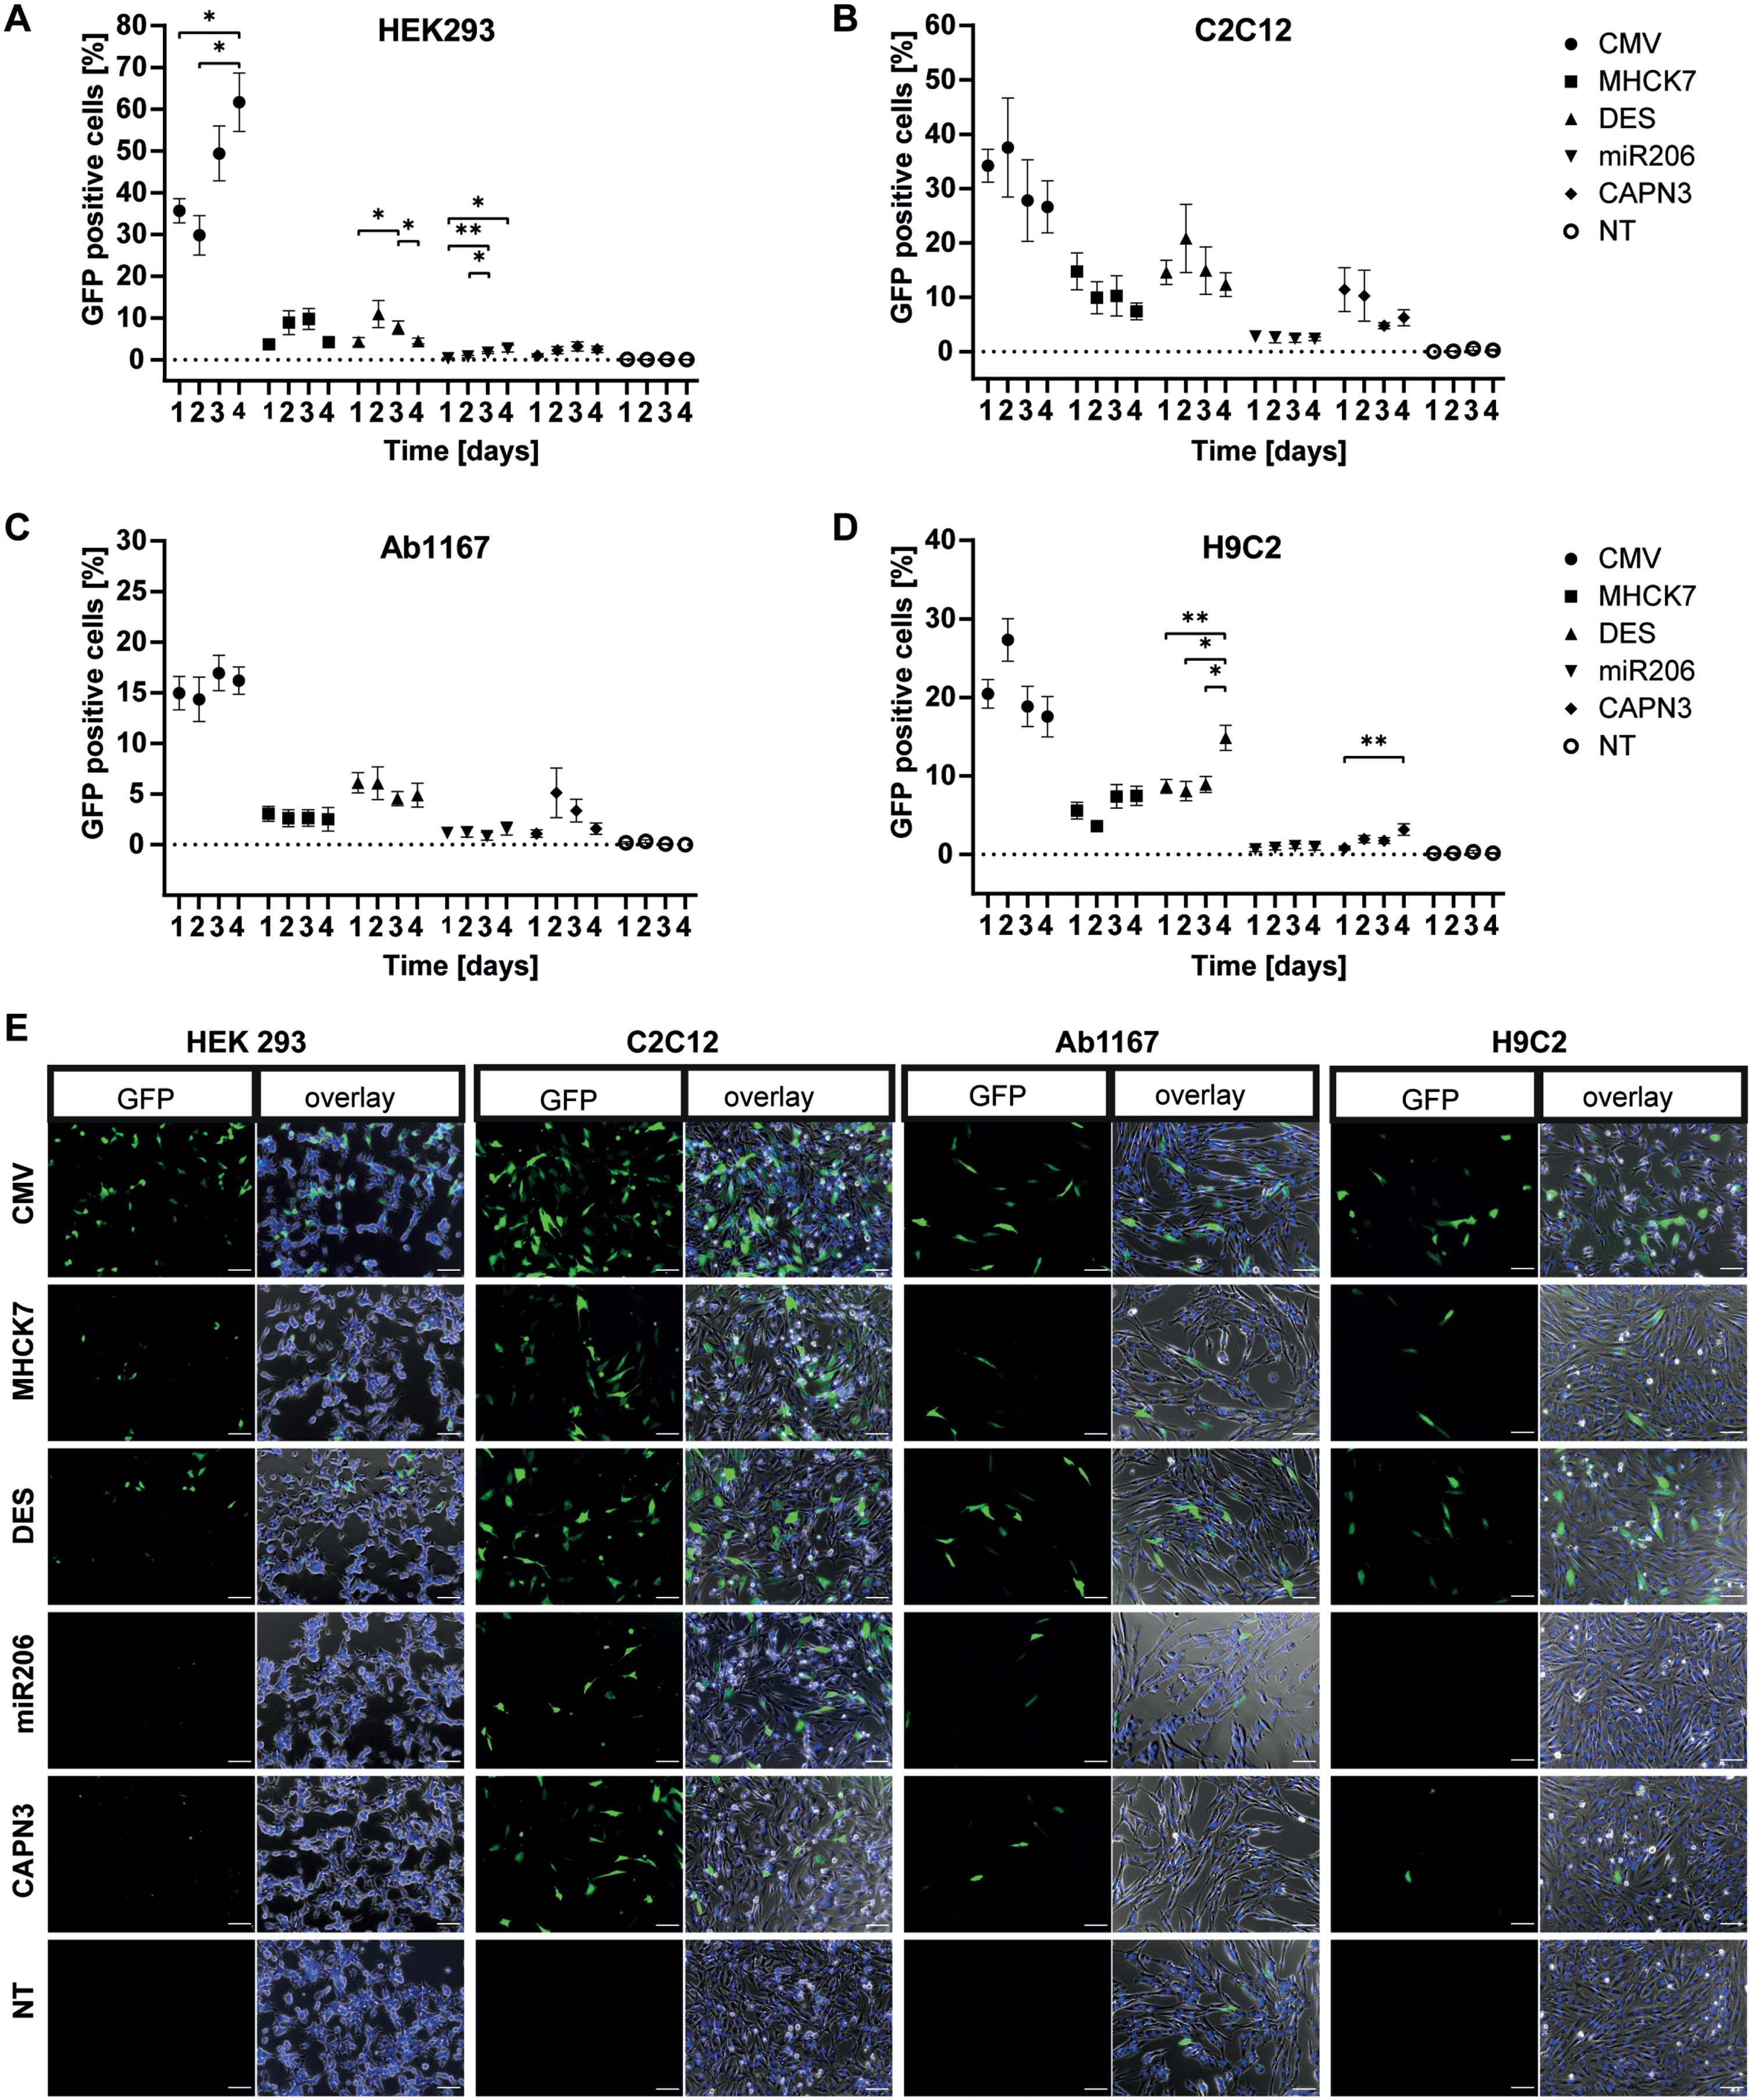
In murine C2C12 myoblasts the CMV promotor showed 37% GFP expressing cells on day 2 post-transfection (decreasing to 27% on day 4. For MHCK7 and DES promotor, a value of 15% GFP positive cells was measured at day 1, respectively. While the activity of the MHCK7 promotor decreased to 7.4% on day 4, the DES promotor reached a peak value of 21% GFP positive cells on day 2 post transfection. In C2C12 myoblasts, the miR206 promotor showed the lowest GFP expression levels with approximately 2.5% GFP positive cells over all 4 days. For the CAPN3 promotor, 11.6% GFP expressing cells were counted on day 1, but the numbers decreased to 6% on day 4 post transfection(Fig. 2B).
Regarding the number of GFP positive cells, the CMV promotor showed lower activity in human Ab1167 skeletal myoblasts cell line compared to HEK293 and C2C12 cells (Fig. 2A–C). On day 1 post transfection, 15% GFP positive cells were observed for the CMV promotor and a slightly increasing to 17% on day 3. The MHCK7 promotor showed a low but stable GFP expression with 3% GFP positive cells in human myoblasts over four consecutive days. Compared to this, the activity of the DES promotor was slightly higher, with a maximum of 6.1 % GFP expressing cells on day 1, slightly decreasing to 5% on day 4. In skeletal myoblasts the miR206 promotor reached a maximum of 1.6% GFP-positive cells on day 4, showing the lowest activity. GFP expression under the CAPN3 promotor showed highest number of GFP positive cells on day 2 (5.1%) but decreased to 1.6% day 4 (Fig. 2C).
In H9C2 cardiomyocytes, the CMV promotor showed the highest number of GFP positive cells (27%) on day 2 post transfection, decreasing to 17.5% on day 4. GFP expression induced by MHCK7 slightly increased from 5.6% positive cells on day 1 to a maximum of 7.5% on day 4. The DES promotor showed a slightly higher activity than the MHCK7 promotor, with 8.5% GFP positive cells on days 1–3, increasing to 15% on day 4. The miR206 and CAPN3 promotors exhibited the lowest activity in H9C2 cardiomyocytes. The miR206 promotor reached a maximum of 1 % GFP-positive cells at day 4 and the CAPN3 promotor showed a maximum number of green cells of 3.2% at day 3 (Fig. 2D).
The ubiquitous CMV promotor showed high rates of GFP positive cells in all four cell lines, compared to the GFP expression induced by muscle specific promotors. However, MHCK7 and DES promotor showed a higher activity than the miR206 and CAPN3 promotors, which exhibited even lower activity in H9C2 cardiomyocytes. These data were consistent with the representative overview of GFP expression in the given cell types under CMV, MHCK7, DES, miR206 and CAPN3 promotor 1 day post transfection from the microscopic pictures (Fig. 2E).
Quantification of promotor mediated luciferase activity in proliferating cells
Further quantification of promotor related reporter gene expression level and duration in proliferating cells was conducted using luciferase assay as this is more sensitive than GFP fluorescence and allows to quantify also low expression levels. Therefore, after fluorescence microscopy documentation, the transfected HEK293, C2C12, HSKM-Ab1167 and H9C2 cells were harvested on 4 consecutive days post transfection. To compensate differences during sample collection and processing, the total protein amount for the luciferase assay was determined using a micro-BCA assay and equal amounts of protein were used for the subsequent quantification of luciferase activity.
In HEK293 cells the constitutive CMV promotor showed the highest activity of the five promotors tested. It reached the highest value of 5.1±1.1×10⁶ RLU/μg total protein on day 2 post transfection, but the activity decreased to a 2.2±0.4×10⁶ RLU/μg total protein at day 4. In HEK 293 cells, the highest luciferase activity mediated by the muscle-specific promotors MHCK7 and DES was 4.9±2.1×10⁴ and 6.3±2.2×10⁴ RLU/μg total protein, on day 2 respectively. Activity decreased slightly on subsequent days to a minimum of 1.0±0.3×10⁴ RLU/μg total protein on day 3 for MHCK7 and 2.4±0.5×10⁴ RLU/μg total protein for DES promotor (Fig. 3A). A similar trend was observed for the miR206 and CAPN3 promotor. HEK293 cells transfected with the miR206 promotor or CAPN3 promotor construct showed the highest activity on day 2 with 1.0±0.3×10⁴ RLU/μg total protein and 2.4±0.5×10⁴ RLU/μg total protein respectively. Mir206 promotor showed a minimum value of 2.8±0.7×10³ RLU/μg total protein on day 4 and CAPN3 promotor activity was significantly decreased with 5.7±1.8×10³ RLU/μg total protein on day 3 (Fig. 3A). The CMV promotor induced luciferase activity of 5×10⁶ to 2×10⁶ RLU/μg total protein on four consecutive days was significantly higher than the luciferase activity induced by the muscle-specific promotors showing 2×10³ to 6×10⁴ RLU/μg total protein respectively (Fig. 3A, E).
Fig. 3
Promotor activity and specificity measured by luciferase assay in different proliferating cell types. (A–D) Proliferating HEK293 (A), C2C12 (B), HSKM-Ab1167 (C) and H9C2 (D) were transfected with the constructs encoding luciferase under control of respective promotors. Luciferase activity was measured on day 1, 2, 3 and 4 post transfection. All samples were normalized to 1μg total protein and datapoints represent mean values±SEMs using a log10 scale (n = 4). Asterisks represent significant differences over 1–4 days within each promotor group (*p < 0.05; **p < 0.01; ***p < 0,001). (E) Overview of all significant differences (*p < 0.05; **p < 0.01; ***p < 0,001; ****p < 0,0001; ns = not significant) derived by the promotor driven luciferase activity at day 1, 2, 3 and 4, respectively.
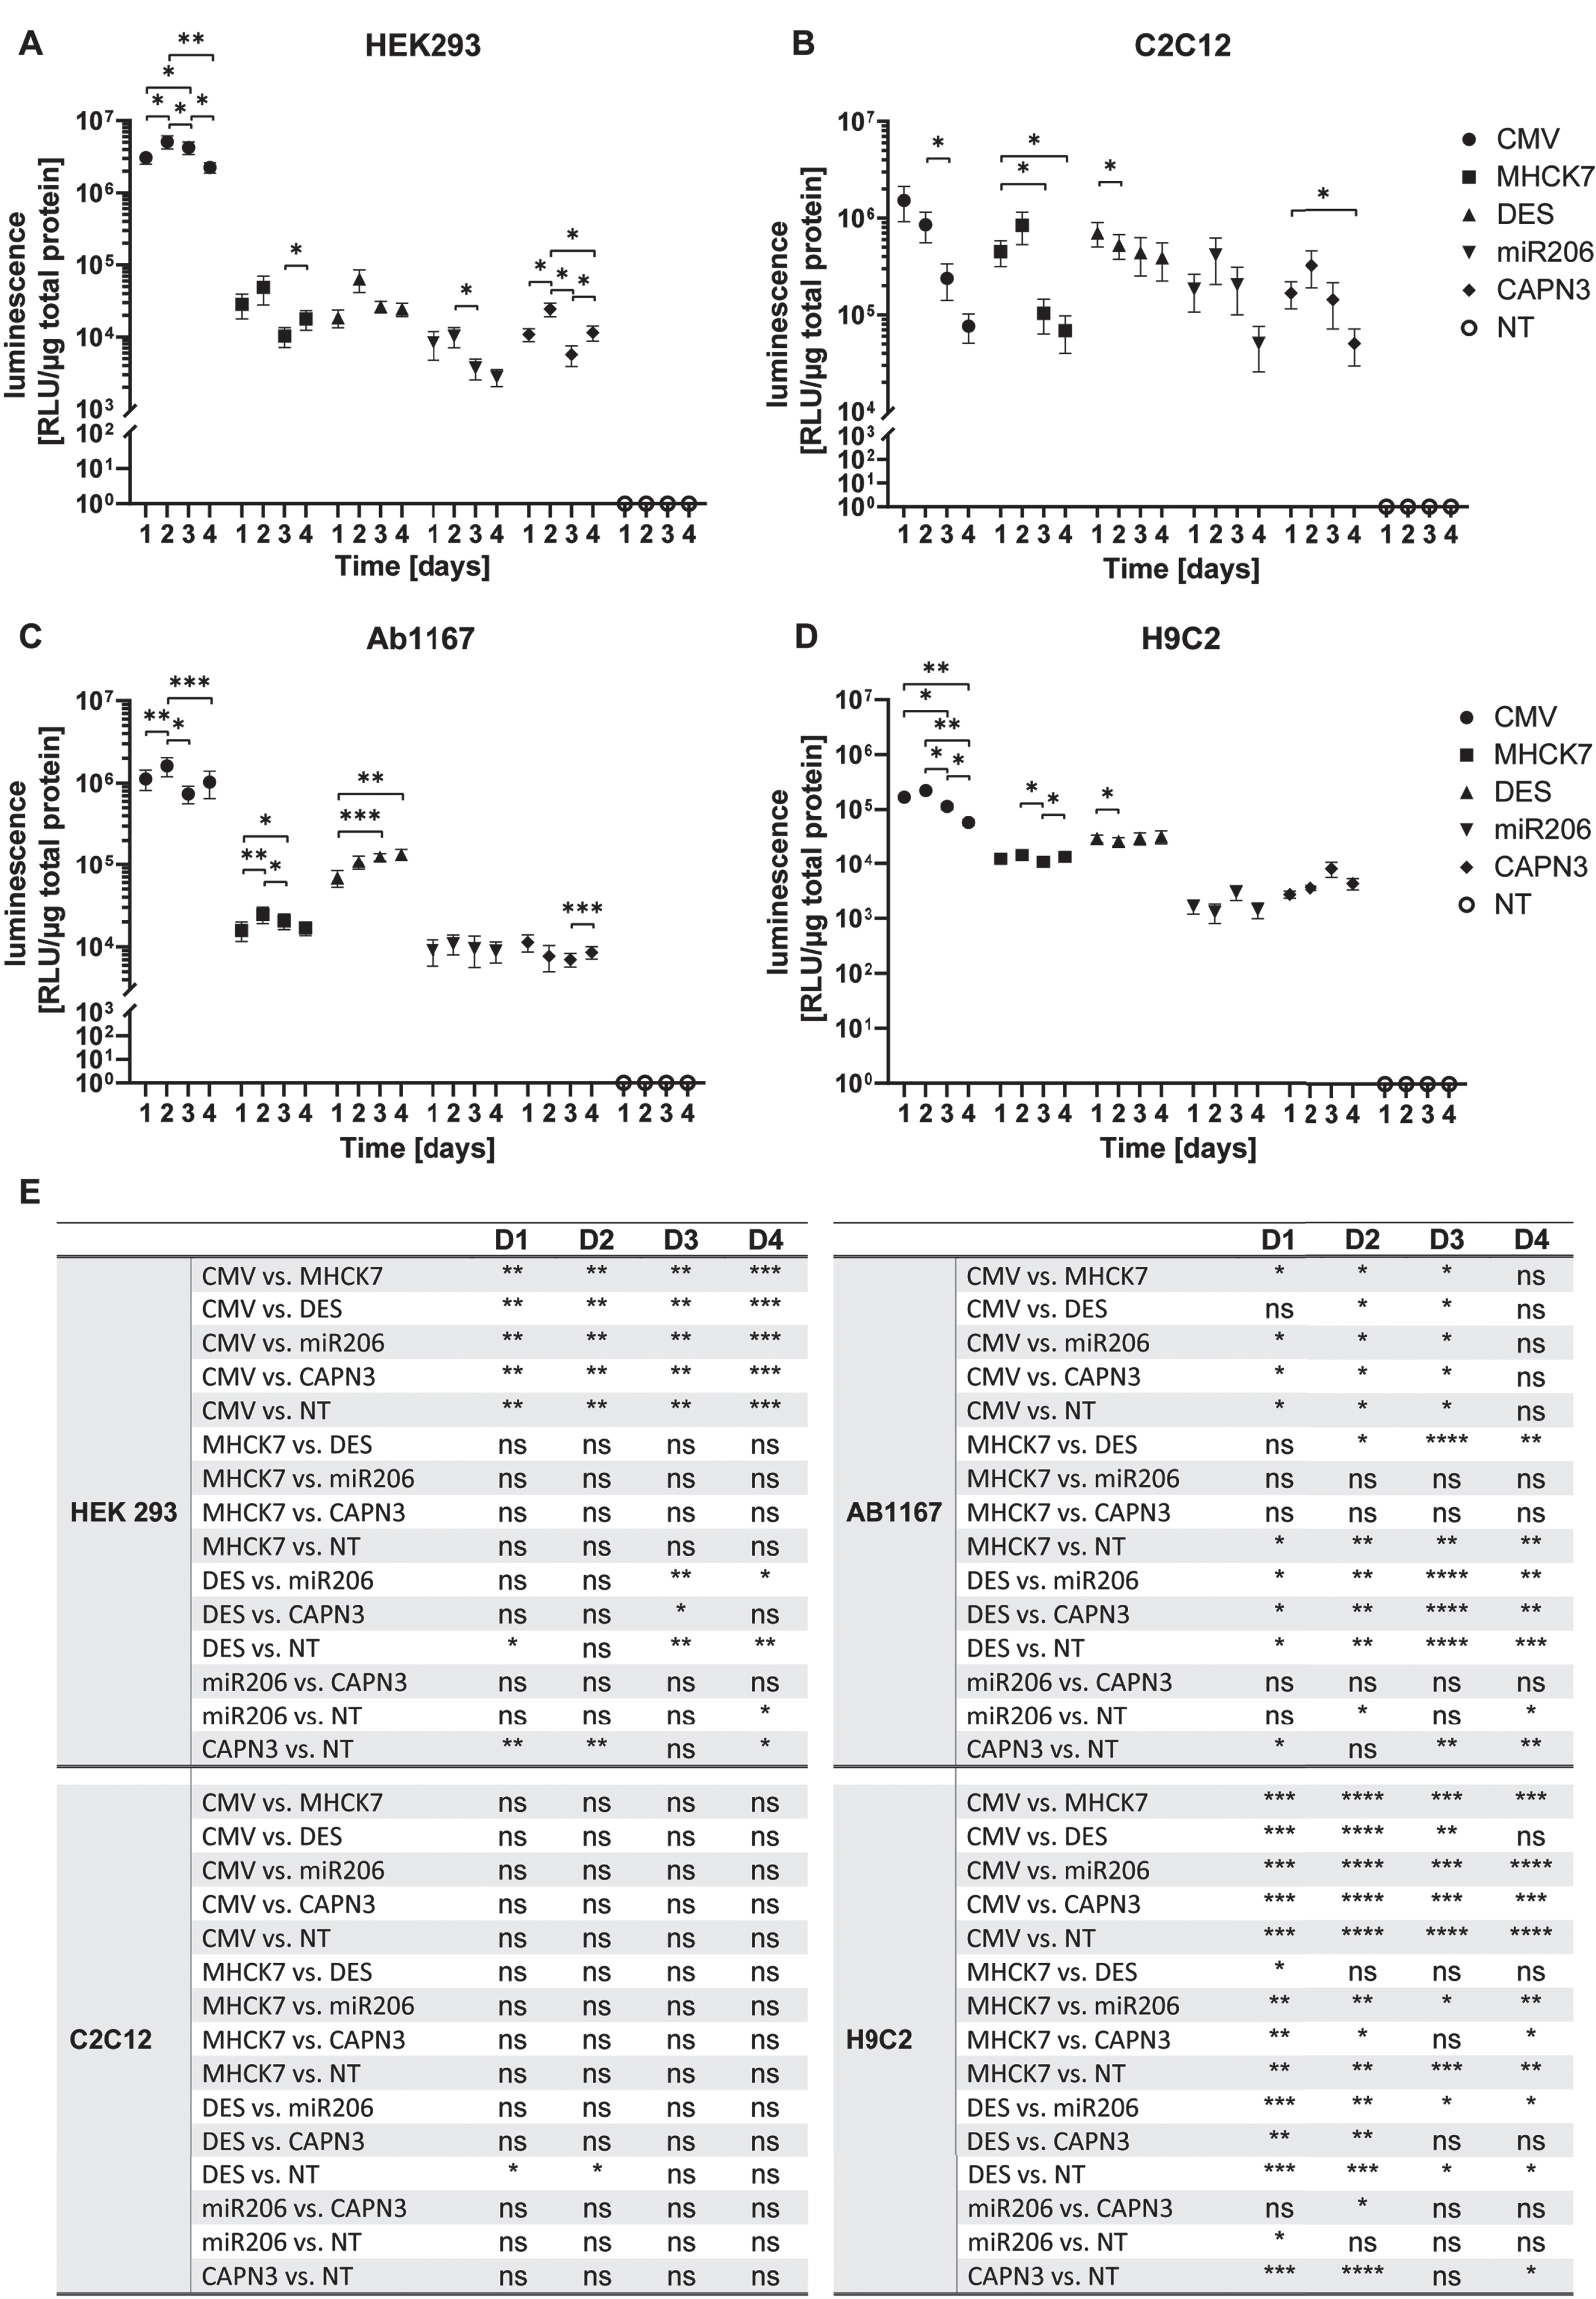
In C2C12 myoblasts luciferase activity mediated the CMV promotor reached 1.5±0.6×10⁶ RLU/μg total protein 1 day post transfection), decreasing significantly 7.7±2.6×10⁴ RLU/μg total protein on day 4 post transfection(Fig. 3B, E). Luciferase expression under control of the MHCK7 promotor reached a maximum of 8.4±3.1×10⁵ RLU/μg total protein on day 2 and decreased to a value of 6.9±2.8×10⁴ RLU/μg total protein on day 4 post transfection. Luciferase activity mediated by the DES promotor reached 7.0±2.0×10⁵ RLU/μg total protein on day 1 post transfection and decreased slightly to 3.9±1.7×10⁵ RLU/μg total protein on day 4. Compared to MHCK7 and DES promotor, the miR206 and CAPN3 promotor showed similar overall luciferase activity in C2C12 myoblasts, reaching highest values of 4.2±2.1×10⁵ RLU/μg total protein and 3.2±1.3×10⁵ RLU/μg total protein on day 2, respectively. Luciferase activity then decreased to 5.1±2.5×10⁴ RLU/μg total protein for miR206 and 5.0±2.1×10⁴ RLU/μg total protein for CAPN3 promotor (Fig. 3B).
In HSKM-Ab1167 myoblasts, the CMV promotor mediated the highest luciferase activity of 1.6±0.4×10⁶ RLU/μg total protein at 2 days post transfection, with decreasing luciferase activity on subsequent days. The luciferase activity induced by the MHCK7 promotor reached a maximum of 2.5±0.6×10⁴ RLU/μg total protein on day 2, indicating a significant lower expression compared to CMV promotor 1, 2 and 3 days post transfection (Fig. 3C, E). The DES promotor exhibited significantly higher activity than the MHCK7 promotor, with luciferase activity of 6.8±1.5×10⁴ RLU/μg total protein on day1 increasing to 1.3±0.2×10⁵ RLU/μg total protein on day 4. DES promotor mediated luciferase expression was significantly higher than that of the MHCK7 promotor on day 3 post transfection (Fig. 3C, E). The skeletal muscle specific promotors miR206 and CAPN3 exhibited the lowest activity in Ab1167 cell line. The miR206 promotor mediated luciferase activity reached a maximum of 1.1±0.3×10⁴ RLU/μg total protein on day 2, and the CAPN3 promotor reached the highest value of 1.1±0.3×10⁴ RLU/μg total protein 1 day post transfection. Compared to CMV promotor, miR206 and CAPN3s mediated luciferase activity was significantly reduced, respectively (Fig. 3C, E).
In H9C2 cardiomyocytes, CMV promotor mediated luciferase activity exhibited 2.2±1.8×10⁵ RLU/μg total protein on day 2 post transfection, decreasing on subsequent days to 5.8±0.7×10⁴ RLU/μg total protein on day 4 post transduction. The luciferase activity induced by MHCK7 promotor fluctuated slightly over 4 days, reaching a maximum value of 1.4±0.3×10⁴ RLU/μg total protein on day 2. The DES promotor showed significantly higher activity than the MHCK7 promotor 1 day post transfection (Fig. 3E) reaching a maximum of 3.2±0.9×10⁴ RLU/μg total protein. The miR206 and CAPN3 promotors induced the lowest luciferase activity in H9C2 cardiomyocytes reaching a maximum luciferase activity of 3.0±0.9×10³ RLU/μg total protein and 8.2±2.5×10³ RLU/μg total protein respectively on day 3 post transfection. On day 4, luciferase activity activity induced by both promotors decreased to 1.4±0.4×10³ RLU/μg total protein for miR206 and 4.4±1.0×10³ RLU/μg total protein for CAPN3 promotor. The activity of all five promotors tested in Ab1167 myoblasts and in H9C2 cardiomyocytes was more constant over 4 days than in the HEK 293 and C2C12 cell lines.
Quantification of promotor activity in differentiated skeletal muscle cells
To investigate the long-term promotor activity, we quantified the promotor related reporter gene expression level and duration in differentiated murine C2C12 and human Ab1167 myotubes by luciferase assay and RT-qPCR.
In differentiated C2C12 myotubes the muscle-specific MHCK7 and DES promotor promotors induced a luciferase activity of 6.3±1.5×10⁴ RLU/μg total protein and 6.1±1.4×10⁴ RLU/μg total protein respectively. Both promotors revealed significantly higher luciferase activity levels than constitutive CMV promotor that mediated a luciferase activity of 1.0±0.3×10⁴ RLU/μg total protein. The skeletal muscle specific promotors miR206 and CAPN3 exhibited the lowest luciferase activity in differentiated C2C12 cells. The luciferase activity induced by the miR206 and CAPN3 promotor reached 6.4±2.5×10³ RLU/μg total protein, and 7.2±2.7×10⁴ RLU/μg total protein res (Fig. 4A). Regarding the relative gene expression of GFP encoded by promotor constructs analysed by RT-qPCR, the CMV promotor showed the lowest activity after 10 days of differentiation in C2C12 myotubes (10.0±0.9 fold change) compared to non-transfected cells (NTC). The highest relative gene expression was measured for DES promotor (57.8±8.6 fold change), followed by miR206 (33.4±3.1 fold change) and MHCK7 promotor (24.5±3.1 fold change). The CAPN3 promotor showed the lowest gene expression rate among the muscle specific promotors (19.3±2.8 fold change), but still almost 2-fold higher relative gene expression compared to CMV promotor (Fig. 4B).
Fig. 4
Long-term promotor activity in mouse and human differentiated myotubes. (A–C) Promotor activity in C2C12 mouse myotubes after 10 days of differentiation. (D–F) Promotor activity in human Ab1167 myotubes after 7 days of differentiation. (A,D) Luciferase expression under control of respective promotors, based on luminescence normalized to 1μg total protein. (B,E) Relative normalized gene expression of tEGFP encoded by promotor constructs was analysed by RT-PCR. Datapoints represent mean values±SEMs (n = 3). Asterisks represent significant differences (*p < 0.05; **p < 0.01; ***p < 0.001; ****p < 0.0001). (C,F) Representative pictures of GFP expressing myotubes under control of respective promotors. (C) C2C12 myotubes, treated with EPS ten days post differentiation and (F) human Ab1167 myotubes without any EPS treatment after 7 days of differentiation. GFP expressing myotubes (green) were immunostained with anti-titin antibody (red). NT = non transfected control. Scale bars = 50μm.
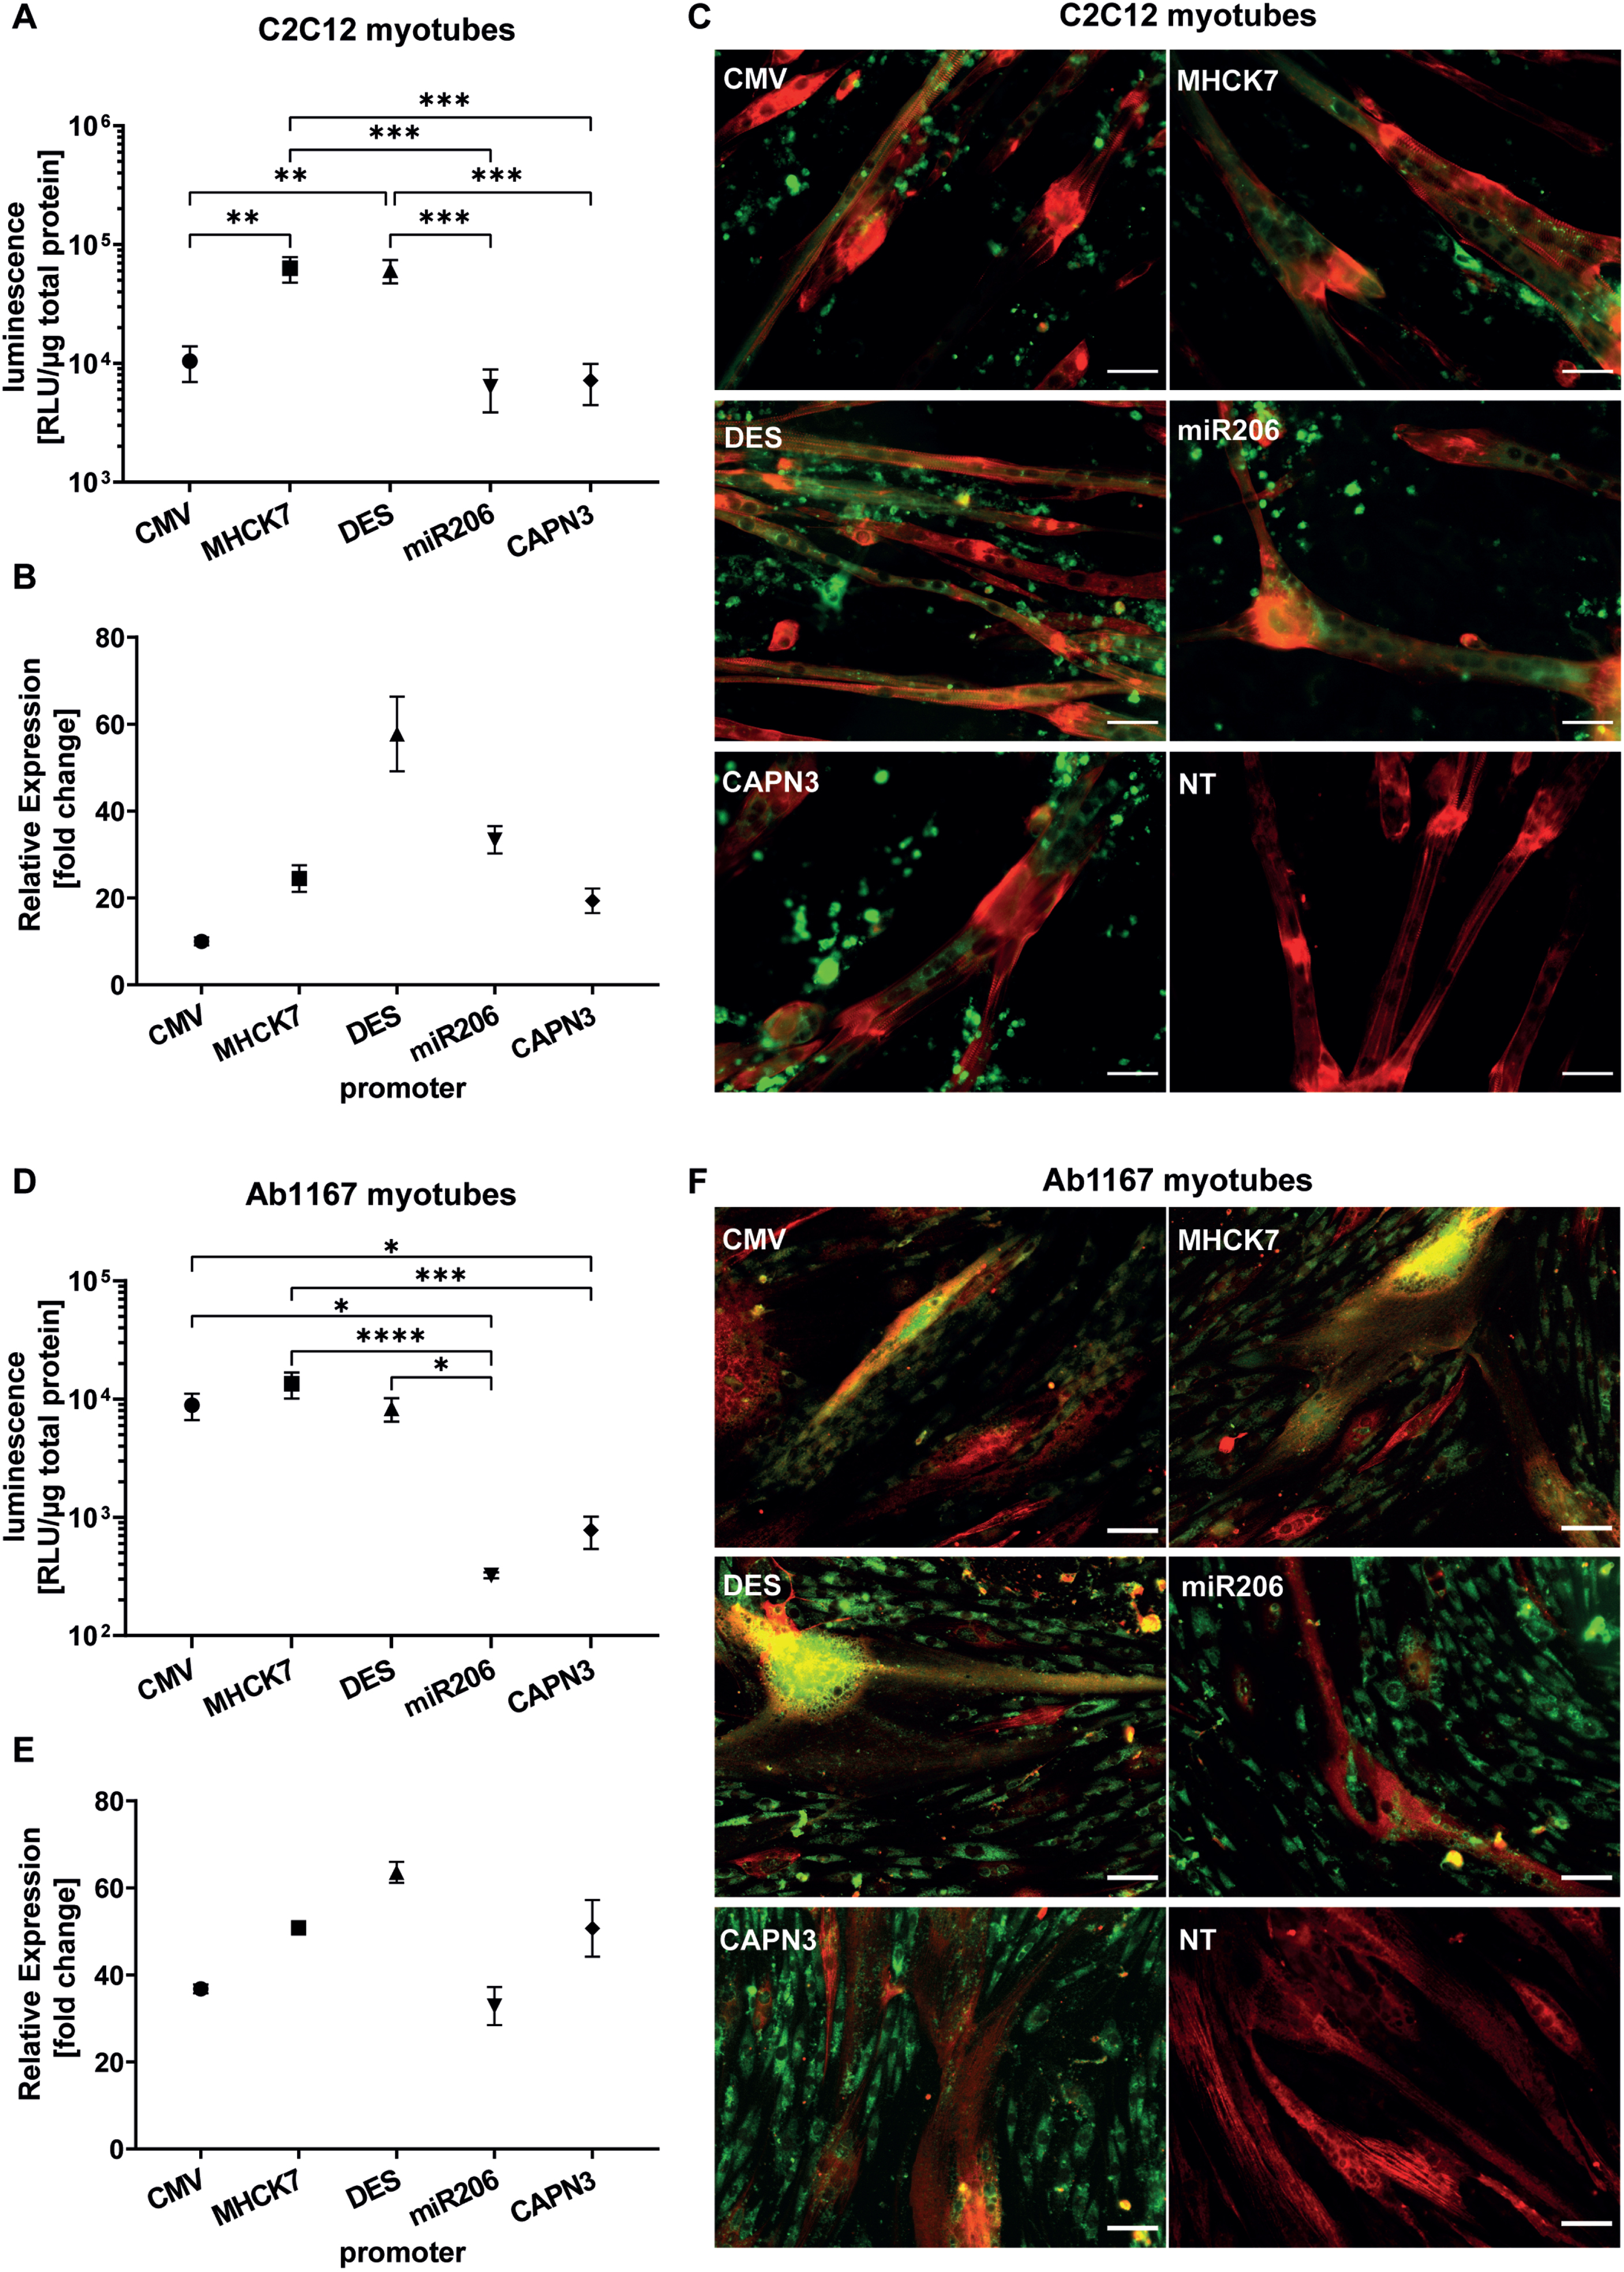
In differentiated human Ab1167 myotubes, constitutive CMV promotor as well as muscle cell specific MHCK7 and Desmin promotors showed similar luciferase activity levels. MHCK7 promotor exhibited the highest luciferase activity of 1.3±3.3×10⁴ RLU/μg total protein, followed by CMV (8.9±2.2×10³ RLU/μg total protein) and DES promotor (8.3±1.9×10³ RLU/μg total protein). Luciferase activity of the miR206 promotor (3.2±0.2×10² RLU/μg total protein) and CAPN3 promotor (7.8±2.4×10³ RLU/μg total protein) was significantly lower than activity levels of CMV, MHCK7 and DES (Fig. 4D). In differentiated human Ab1167 myotubes the relative GFP expression induced by the different promotor constructs, revealed the highest relative gene expression for DES promotor (63.6±2.4 fold change), followed by MHCK7 (50.8±1.4 fold change) and CAPN3 promotor (50.7±6.5 fold change) compared to non-transfected cells. The activity of DES promotor in human myotubes was 2-fold higher than the activity of CMV promotor. The lowest activity was detected for the CMV promotor (36.8±1.0 fold change) and miR206 promotor (32.8±4.4 fold change) compared to non-transfected cells (Fig. 4E).
To investigate the long term GFP-expression among the various promotors in myotubes, HSKM-Ab1167 myotubes were processed for immunocytochemistry after 7 days of differentiation (Fig. 4C) and C2C12 myotubes after a total of 11 days post application of the EPS protocol (Fig. 4F). Electrical pulse stimulation (EPS) was applied to C2C12 cells to induce sarcomere formation in 2D-cell culture differentiation assay and titin antibody staining revealed straited C2C12 myotubes, expressing GFP under the respective promotors (Fig. 4C). The promotor related GFP expression in human myotubes is shown in the representative pictures (Fig. 4F). In differentiated Ab1167 cells, titin antibody staining confirmed successful differentiation and myotube formation. Compared to C2C12 myotubes, the Ab1167 myotubes exhibited less striation than C2C12 (Fig. 4C, F).
DISCUSSION
The right choice of the regulatory elements promoting the expression of therapeutic transgenes for targeted gene therapy approaches is crucial to achieve treatment success and to avoid unwanted side effects. When it comes to muscle gene therapy this becomes challenging with regard to promotor size and activity and tissue specificity. Constitutive promotors, such as the promotors of the respiratory syncytial virus (RSV), cytomegalovirus (CMV), or elongation factor 1a (EF1a), are compact in size and achieve high expression levels in a variety of tissues [24, 25]. However, it has been demonstrated that expression in non-target tissues induced cytotoxicity resulting from an immune response to the transgene. Moreover, CMV promotor driven Calpain 3 transgene expression has been shown to induce cytoskeleton damage by transgene overexpression in non-myogenic cells [26, 27]. To overcome such phenomena for muscle gene therapeutic approaches muscle specific promotors have been investigated to allow more physiological and targeted gene expression [15–17, 19, 27]. In the present study, we therefore focused on the comparison of the DES, MHCK7, miR206 and CAPN3 promotor as potential regulatory elements for efficient muscle gene therapy [5, 14, 17]. There are a number of further muscle-specific promotors or variants thereof. An expansion of this panel with further muscle specific promotors would be desirable, but patents or interests of the developers impede a fair comparison with other systems. To compare the available muscle promotors with non-specific promotors we included constitutive CMV promotor, one of the most commonly used ubiquitous promotors [4].
For the study we used HEK293 cells as non-muscular control as well as the well-studied immortalized murine C2C12 skeletal muscle cells [20, 21] and human HSKM-Ab1167 skeletal myoblasts [22, 23]. To include also a cardiac cell line we included H9C2 rat cardiomyocytes. Rats are frequently used to study heart disease. H9C2 cell have good transfection properties compared to other cardiac cells. Alternative cell lines would have been a good contribution to the study, but availability of alternatives was limited as we couldn’t find partners who could provide such cells. Commercial providers do not guarantee stability after serial passaging and but charge extraordinarily high prices for these cells. Therefore it seemed reasonable for us to include ratcells here.
As a comparison of promotor mediated reporter gene expression efficiencies in different cells can be difficult to accomplish we optimized transfection protocols for each plasmid and cell line with regard to DNA amount, transfected plasmid copy numbers and ratios of DNA to transfection reagent to obtain as similar transfection efficiencies as possible. We achieved robust transfection rates in all 4 cell lines with no significant difference from one experiment to another, allowing us to compare promotor related reporter gene expression and duration in several cell types by assessing GFP and luciferase expression [28, 29] (Fig. 1C). Even though transfection rates were similar it will never be completely identical. Therefore we tried to avoid comparisons between cell lines.
Compared to the number of GFP positive cells, the results from luciferase assay revealed much higher signals for the respective promotors in all 4 cell types. This is mostly due to a higher sensitivity of the luciferase assay compared to fluorescence microscopy allowing us to detect even small differences at low expression levels. Nevertheless, the trend of promotors driven GFP and luciferase expression of each promotor was comparable for both assays in each cell line (Figs. 2, 3).
The constitutive CMV promotor showed highest numbers of GFP positive cells in all four undifferentiated cell lines. In HEK293 cell transfected with DES or MHCK7 promotor driven reporter plasmids revealed low but detectable numbers of GFP positive cells, whereas cells transfected with miR206 or CAPN3 promotor plasmids showed even less no GFP positive cells (Fig. 2A). Luciferase assays confirmed very strong CMV promotor activity in HEK293 cells, whereas muscle specific promotors displayed 100-fold to 500-fold lower, but not completely absent reporter gene expression (Fig. 3A, E). In myogenic cell lines analysed here muscle specific promotors promoted higher reporter gene expression than in HEK293 cells indicating some degree of muscle specificity.
The choice of the right promotor is not only dependent on the desired target tissue/muscle type. It should also be considered in the context of the therapeutic approach. Gene replacement/addition requires a long-lasting, physiological expression level, whereas for gene editing a rather short but strong expression would be desired. Therefore, we tried to investigate promotor activity over time as far as this is feasible in a cell culture setup. All promotors showed highest luciferase signals on days 1 and 2 followed by a decrease on day 3 and 4 or some fluctuation over time that were not really significant within each promotor group (Fig. 3B). Whether this is due to promotor properties, decreasing cell viability over time or a dilution effect due to cell division remains undetermined. To address this we cultured the cells under reduced serum conditions/supplementation following transfection to avoid overgrowth and contact inhibition or fusion. Therefore, one could speculate that the effects seen here were at least partially related to the respective promotor properties.
Since the therapeutic effect of muscle gene therapy requires long-term expression in differentiated muscle tissue, we aimed to comparing the promotor activity in myotubes. We differentiated human and mouse myoblasts applying electrical pulse stimulation (EPS) in our 2D-cell culture differentiation protocol to provoke sarcomere and myotube formation. Using immunocytochemical staining for Z-disc titin T12 on human and murine myogenic cells, we could visualize striation and monitor myotubes formation, as well as GFP expression under control of the respective promotors (Fig. 4C) [30–34]. Compared to mouse myotubes, the human myotubes exhibited only slight striation, likely evoked by spontaneous contraction (Fig. 4F) [22]. Fluorescence microscopy did not only show the GFP expressing myotubes, but also accumulated GFP outside the myotubes (Fig. 4C, D), probably as a result of the in vitro differentiation process and several days in myotube cell culture. Therefore, we analysed the promotor activities in myotubes also on mRNA levels, to compare relative GFP expression under the respective promotors. In human AB1167 derived myotubes the MHCK7 and DES promotors induced equal or even higher signals than the CMV promotor, whereas the miR206 and CAPN3 promotors exhibited the lower activity comparable to CMV (Fig. 4A). In C2-mouse myotubes miR206 promotor induced the second highest m-RNA transcription but lowest luciferase activity. These inconsistent observations might be due to aberrant translation of mRNA expressed by one of the promotors or posttranslational processing as GFP and luciferase are encoded on the same plasmid as the same expression cassette separated by p2A. In this experiment cells underwent differentiation protocol inducing a dynamic processes leading to significant changes such as cell fusion and death of some myoblasts possibly influencing quality of sample material and assay results. Differentiation efficiency or speed of the two cell lines might contribute to lower CMV activity compared to myogenic promotors while less differentiation and higher number of undifferentiated cells in Ab1167 leads to higher relative activity from CMV versus muscle promotors. This is partially supported by the different intensity of titin striation in AB1167 and C2C12 after completing the differentiation protocol. So the timing of the measurement could also impact the results of the measurements. Therefore this observation has to be regarded in the context of the dynamically changing environment within the differentiating culture, making it difficult to obtain a clearer picture here. Nevertheless, the overall trend shows that all myogenic promotors showed increased activity relative to CMV promotor driven expression after differentiation. This supports their usefulness to drive gene transgene expression in differentiated muscle tissue. It will be interesting to investigate whether our in vitro result can be recapitulated in preclinical animal models to get more information on the in vivo performance of the different regulating elements.
It has been shown that viral promotors, such as the CMV promotor are prone to transcriptional silencing due to methylation [35]. In accordance with this, our results demonstrate that compared to superior short-term CMV promotor activity in proliferating myoblasts cells, it shows decreased activity in differentiated myotubes (Figs. 3, 4). Whether this is due to methylation or other mechanisms such as changes in transcription factor setup of differentiated myotubes requires further investigation.
The DES promotor is one of the most prominent muscle specific promotors offering robust muscle specific gene expression. A DES promotor variant was used in preclinical studies to develop gene therapy for patients with the Barth syndrome [36, 37]. Desmin promotors also were used in a number of studies focussing on Pompe disease, one of them (rAAV9.DES.hGAA) is so far successfully undergoing clinical trials [38]. In preclinical studies to treat LGMD 2A (Calpain 3 deficiency) using the DES promotor to regulate Calpain 3 expression described cardiac toxicity related to unregulated proteolytic activity of Calpain 3 in mouse model for LGMD 2A [5], but not in non-human primates (NHPs) [12]. In this study the DES promotor showed highest reporter gene expression in proliferating skeletal and cardiac cells, as well as in human and mouse myotubes compared to the other muscle specific promotors analysed here. For the MHCK7 promotor we saw comparable but slightly lower reporter gene expression compared to DES promotor. However, it showed more consistent transgene expression in proliferating myoblasts as well as in far differentiated myotubes. Due to its specificity and activity, promotors based on the MCK gene are also widely used in gene therapy and underwent extensive preclinical and clinical testing. Clinical studies to treat Duchenne Muscular Dystrophy patients with rAAVrh74.MHCK7.micro-dystrophin have shown to be well tolerated with minimal adverse events and showed robust expression of micro-dystrophin accompanied by functional improvement [39]. Clinical trials to treat LGMD type E (β-sarcoglycan deficiency) and B (dysferlin deficiency), where a functional copy of either β-sarcoglycan or dysferlin under the control of MHCK7 promotor is delivered to the patients, are currently in progress [8, 40]. Furthermore, the MHCK7 promotor is included in a vector undergoing preclinical studies for the treatment of Pompe disease [41]. In contrast to Desmin promotor the MCK promotor variant tMCK did not provoke any cardiotoxicity in LGMDR1/2A mouse model [9], indicating that it can serve as a valuable alternative to the Des promotor for gene therapy of Calpainopathies.
However, although our data have shown that the CAPN3 promotor is less active compared to DES or MHCK7 promotors, it could be assumed that Calpain 3 expression from its natural promotor (CAPN3) better reflects the expression levels found in the human body. Therefore, it could play a role in gene therapy aiming at Calpain 3 gene addition, especially as its activity is more restricted to skeletal muscle, which might be beneficial to avoid cardiac complications. Unfortunately, the CAPN3 promotor is relatively large compared to the other promotors in this study, so that it does not fit into an AAV genome when combined with the Calpain 3 coding sequence. Hence, other delivery platforms such as adenoviral vectors have to be used, that might be limited with regard to muscle transduction efficiencies. Nevertheless, our study showed that the CAPN3 promotor activity were very similar to the miR206 promotor with regard to expression strength and skeletal muscle specificity as described before [5, 42]. Being significantly shorter than the CAPN3 promotor the miR206 promotor offers the opportunity to be combined with the Calpain 3 coding sequence for gene replacement therapy using the AAV vector system. Therefore, the miR206 promotor might be another promising candidate to regulate Calpain 3 gene expression since it is specifically expressed in skeletal muscle and functions in proliferating cells and differentiated muscle in mouse, chicken and human [42–44]. Some promising studies using microRNA206 promotors have shown to slow Amyotrophic lateral sclerosis (ALS) progression in an ALS mouse model and their involvement in the regeneration and maturation of skeletal muscle fibers in mdx mouse and CXMD(J) dog model of Duchenne muscular dystrophy (DMD) [5, 45, 46]. Despite relatively low activity compared to MHCK7 and DES promotors the Mir206 and CAPN3 promotors could provide functional improvements for gene addition approaches as it was shown that already low levels of transgene products can lead to beneficial effects as shown in animal models for DMD [47–50].
Efforts to develop optimal muscle specific promotors started more than 30 years ago and are still ongoing. Up to now there is no universal promotor that could be used to develop gene therapy vectors intended for the treatment due to the heterogeneity of genetic muscular disorders. This is largely related to the differences in the pathogenesis and the related deficiencies or dysfunctions such as differences affected muscle groups or fiber types. Unfortunately, effective treatment for such genetic muscle disorders does not exist so far [51].
The in vitro data presented here, might be further investigated by vector mediated in vivo studies to gain more information of the cell type specificity and long-term efficacy of the here tested promotors. However, comparing myogenic promotor activities in vivo is also challenging. Simple plasmid transfection is not feasible in vivo, so that gene transfer vectors have to be produced. Difficulties may arise from limitation through vector cargo capacity. For example, AAV Vectors are too small to carry the Calpain 3 promotor together with the reporter gene expression cassette used in this study. Furthermore, undesired tissue tropism of the vector or inadequate administration routes can bias the results. Species specific restrictions could also influence experimental results, since both the activity of human promotors and the complexity of protein related physiological processes may differ between mouse, dogs, pigs, non-human primates and the human organism. Therefore, experimental results obtained in different species cannot necessarily be translated to the human situation and have to be regarded with caution. However, carefully planned animal studies comparing different myogenic promotors could provide more detailed insight into promotor activity in terminally differentiated muscle and cardiac tissue. Our in vitro data supports the necessity of such experiments.
Nevertheless, the development of muscle specific promotors, such as naturally occurring [14], chimeric or hybrid promotors [10, 17], as well as synthetic promotors [52, 53] provides hope that further research eventually brings up constructs that mimic the unique expression profile, to efficiently restore the function of affected muscle proteins. Noteworthy it should be considered that the expression of therapeutic genes not only depends on promotor activity but also on other factors. Many factors influence transgene expression at the post-transcriptional level. Expression of the target gene can be enhanced due to the presence of an intron in the vector, which increases the RNA stability in the nucleus [53] or post-transcriptional regulatory elements such as the woodchuck hepatitis virus (WPRE), that promotes mRNA export from the nucleus and prevents post-translational gene silencing [54, 55]. The right choice of viral vector also plays an important role in the delivery of the transgene. In addition to the naturally occurring AAV serotypes, new capsids were developed to improve muscle transduction [56, 57]. Finally an elaborate combination of the a proper choice of the vector, promotor, and further regulatory elements in the transgene expression cassette and an optimal delivery route into the body can significantly improve muscle gene therapy approaches in terms of transgene expression strength, duration and tissue-specificity.
MATERIAL & METHODS
Cells
The AB1167 immortalized human skeletal myoblast cell line was received from Vincent Mouly (Institut de Myologie, Paris, France) AB1167 human skeletal myoblast were established as described previously [22]. Ab1167 were cultured in Skeletal Muscle Cell Growth Medium (PromoCell, Heidelberg, Germany). HEK293, murine myoblast C2C12 and rat cardiomyocyte H9C2 cell lines were cultured in DMEM with high glucose (4.5 g/L glucose; PAN Biotec, Aidenbach, Germany). HEK293 and rat cardiomyocyte H9C2 were supplemented with 10 % FBS (PAN Biotec) and C2C12 with 15% FBS and 100μg/μl non-essential amino acids (NEAA; PAA, Cölbe, Germany). All cells were cultured at 37°C and 5% CO2 in a humidified atmosphere. Medium was changed every second day.
Construction of reporter plasmids
To construct reporter plasmids containing different promotor we inserted a reporter gene expression cassette consisting of a GFP-P2A-NanoLuciferase-T2A-neomycin coding region (GLN) and a SV40polyA signal downstream of the CMV promotor present in pZac2.1 using In-Fusion cloning (Takara, Saint-Germain-en-Laye, France). Briefly pZac2.1 plasmid containing CMV promotor was linearized by PCR (5’-TGTTTCAGGTTCAGGGGGAGATGTG-3’ and 3’-TGTCAGAAGCACTGACTGCGTT-5’) and GLN-SV40pA sequence was amplified from original plasmid pR6K-hyg-GLN [29] using primers 5’-TCAGTGCTTCTGACATTCTGTGGCTGCGT GAAAGC-3’ and 3’-CCTGAACCTGA AACATATTCGCACCGTGCACGAAT-5’, generating overlaps to the terminal base pairs of linearized plasmid, followed by annealing the homologous ends of plasmid and insert in an In-Fusion cloning reaction, resulting in pZac2.1-CMV-GLN-SV40pA. Further plasmids were prepared by exchanging the CMV promotor from pZac2.1-CMV-GLN-SV40pA with specific promotors of choice as follows. The MhCK7 promotor was amplified by PCR from pRRL-MHCK7-GCaMP6 plasmid, using primers 5’-AGCTAGCCTAGAGCTTGCATGTCTAAGCTA GACCC-3’, 3’-GCAGGTACCTCGAGGCTGGCT GGCTCCTG-5’. pRRL-MHCK7-GCaMP6 was a gift from Nenad Bursac (Addgene plasmid # 65042; http://n2t.net/addgene:65042; RRID: Addgene_65042) [18]. The resulting PCR product was inserted into pJET1.2/blunt plasmid (CloneJet PCR Cloning Kit; Thermo Fisher Scientific, Waltham, MA, USA) resulting in pJET1.2-MHCK7. The MHCK7 promotor was amplified by PCR from pJET1.2-MHCK7 using primers 5’-GTCCAATATGACCGCCCCTTCAGATTAAAAA TAACTGAGGTAAGGGC-3’ and 3’-ACGGTTCACTAAACGGCTGGCTGGCTCCTGA-5’. The pZac2.1-CMV-GLN-SV40pA was linearised using primers 5’-CGTTTAGTGAACCGTCAGATCACTAG-3’ and 3’-GCGGTCATATTGGACATGAGCC-5’ excluding the CMV promotor and generating homologous terminal regions for subsequent In-Fusion reaction.
pZac2.1-DES-GLN, pZac2.1-CAPN3-GLN and pZac2.1-miR206-GLN plasmids were prepared by eliminating the CMV promotor from pZac2.1-CMV-GLN-SV40pA using BsrGI and HindIII restriction enzymes (NEB, Frankfurt/M, Germany) to linearize the plasmid backbone. Promotor sequences were amplified by PCR using primers generating homologous ends to BsrGI and HindIII restriction sites of the linearized pZac2.1-GLN-SV40pA. The sequence encoding Desmin promotor (DES) was synthesized (GeneScript, Leiden, Netherlands) and subsequently amplified using primers 5’-TATCATAATATGTACAACCTTGCTTCCTAGCT GG-3’ and 3’-CTACCGCAATAAAGCTTGGTGGC-5. The Calpain3 promotor (CAPN3) was amplified from the pGG16_6Fi_MuSeAP_pG3-12561 plasmid using primers 5’-TATCATAA TATGTACACTCACTAAAGGGAACAAAAGCTG G-3’, 3’-TACCGCAATAAAGCTTCCTTGATACTTACAGA TCTGGCAAGTGG-5’. The miR206 promotor (miR206) was amplified from the pCRII_Promhmir206FL plasmid using primers 5’-TATCATAATATGTACAGCTATGCATCAAGCTTG GTACCC-3’, 3’-TACCGCAATAAAGCTTCGACA AGCCCAGTTTCTATTGG-5’. pGG16_6Fi_ MuSeAP_pG3-12561 and pCRII_Promhmir206FL plasmids were kindly provided by Isabelle Richard [5].
Homologous ends of linearized pZac2.1-GLN-SV40pA and amplified promotor sequences were annealed in an In-Fusion cloning reaction (Takara), followed by transformation and amplification in StellarTM chemically competent E. coli HST08 strain (Takara Bio, Saint-Germain-en-Laye, France) using ampicillin (100μg/ml) for selection. Plasmids were purified following manufacturer’s instructions using ZymoPURE II Plasmid Midiprep Kit (Zymo Research, Freiburg, Germany).
Transient transfection
Prior to transfection proliferating cells were plated and cultivated until 60–80% confluence was reached. Cells were transfected using jetOPTIMUS® transfection reagent (Polyplus, Illkirch, France) according to the manufacturer’s instructions as described below.
To overcome variations caused by cell-size, growth rates and cell type specific susceptibility, plasmid transfection protocols were adjusted for the given cell lines. Therefore, HEK293 (45.000 cells / cm2), murine myoblast C2C12 (25.000 cells / cm2), human skeletal myoblast Ab1167 (35.000 cells / cm2) were plated on a 24-well plate and rat cardiomyocyte H9C2 cells (25.000 cells / cm2) were plated on a 12-well plate, 24 hours prior to transfection. To exclude variations in promotor expression rates provoked by unequal plasmid copy numbers due to reporter plasmid size (pZac2.1-CMV-GLN: 6984 bp; pZac2.1-MHCK7-GLN: 7165 bp; pZac2.1-DES-GLN: 7321 bp; pZac2.1-miR206-GLN: 7228 bp; pZac2.1-CAPN3-GLN: 8038 bp) we transfected all cell lines with equal reporter plasmid copy numbers (6.63×10⁶ copies/μl) and spiked the reporter plasmid DNA with noncoding puc19 plasmid DNA to ensure that each cell line was also transfected with equal amounts of DNA. The following DNA:JetOPTIMUS® ratios were used for transfection 1:1.5 for HEK293 and C2C12 and 1:1 for Ab1167 and H9C2. After promotor plasmid DNA was diluted in jetOPTIMUS® buffer corresponding amounts of jetOPTIMUS® reagent were added. After 10 min incubation at room temperature (RT), jetOPTIMUS® complexes were added dropwise to the cells. Medium was exchanged 4 hrs after transfection. To diminish further cell proliferation, growth medium with reduced Serum (2% FBS) was applied to HEK293, C2C12 and H9C2 cells. For Ab1167 cells Skeletal Muscle Cell Growth Medium SupplementMix was reduced to 25% in Skeletal Muscle Cell Growth Medium (PromoCell).
To assess promotor efficiency in differentiated muscle cells, C2C12 cells (25.000 cells / cm2) were plated on 35 mm glass-bottom dishes (μ-Dish 35 mm; ibidi, Gräfelfing, Germany). Cells were cultivated in proliferation medium for 24 hours until 60–80% confluence was reached and transfected using jetOPTIMUS® transfection reagent (Polyplus) as described above. Once, cultured cells reached 95% confluency, proliferation medium was replaced by C2C12-differentiation medium, consisting of DMEM high glucose (4.5 g/L glucose; PAN Biotec) supplemented with 2 % horse serum (Sigma, Taufkirchen, Germany) as well as 1% NEAA (PAA) and were differentiated to myotubes for 10 days until further processing.
For human skeletal muscle myotube formation Ab1167 cells (35.000 cells / cm2) were seeded on 35 mm glass-bottom dishes (μ-Dish 35 mm; ibidi) with Matrigel precoating (Matrigel® Basement Membrane Matrix; Corning, Kaiserslautern, Germany) diluted in Serum free Medium (DMEM/F12; PAN Biotec) and cultured in Skeletal Muscle Cell Growth Medium (PromoCell). Once, 95% confluency was reached proliferation medium was replaced by Skeletal Muscle Cell Differentiation Medium (PromoCell). On day three of HSKM differentiation, evolving pe-myofibrils were transfected in Skeletal Muscle Cell Differentiation Medium (PromoCell) as described above. After transfection, Skeletal Muscle Cell Growth Medium (PromoCell) was added to the cells for 24 hours. To obtain far evolved HSKM-Ab1167 myotubes, cells were cultured for three more days in a Skeletal Muscle Cell Differentiation Medium (PromoCell) until further processing.
Electrical pulse stimulation
Electrical pulse stimulation (EPS) was applied to C2C12 cells to provoke sarcomere formation in 2D-cell culture differentiation assay. Ten days post transfection, the differentiated C2C12 myotubes were placed in a C-Dish chamber for electrical stimulation (C-Dish, IonOptix, Amsterdam, Netherlands). Electrical stimulation was applied using a C-pace pulse generator (C-Pace 100, IonOptix). Two consecutive stimulation protocols were applied. The overnight stimulation protocol (12 hrs; 4.0 ms/10 V/0.5 Hz) was used to induce an equal differentiation status in all myotubes, followed by a 4 h twitching protocol (10 ms/10 V/1 Hz) to provoke sarcomere assembly.
Cell harvest and processing
To quantify promotor related reporter gene expression level and duration in proliferating cells, the transfected HEK 293, C2C12, Ab1167 and H9C2 cells were harvested on 4 consecutive days post transfection. Before harvesting, the nuclei were visualized by Hoechst 33342 (Thermo Fisher Scientific, Waltham, MA, USA; 1:1000) staining and the GFP expression among the respective promotors was documented by fluorescence microscopy (IX83 microscope, Olympus, Tokyo, Japan). To maintain cell viability, the cells were analysed using life cell imaging microscope incubator (OKOLAB USA Inc.; Ambridge, PA, USA) at 37°C and 5% CO2.
For cell harvesting the medium was removed, cells were washed with PBS, detached in PBS using a cell scraper and the cells were divided into three fractions. Cells were pelleted by centrifugation (300×G/3 min) and cell pellets were snap frozen in liquid nitrogen and stored at –20°C until further use. C2C12 and Ab1167 myotubes were either harvested as described above or directly processed on the 35 mm glass-bottom dishes (μ-Dish 35 mm; ibidi) for further immunocytochemical staining, see below.
Fluorescence microscopy and Immunocytochemistry
To investigate the long term GFP-expression among the various promotors in Myotubes, HSKM-Ab1167 myotubes were processed for immunocytochemistry (ICC) after 7 days of differentiation and C2C12 myotubes after a total of 11 days post application of the EPS protocol. Cells were washed in PBS and fixed for 10 min in ice-cold acetone. After blocking using 5% BSA in PBS for 1 h at RT and incubation with an Z-disk titin antibody (mouse-anti T12), kindly provided by Peter van der Ven and Dieter O. Fürst [33, 34] diluted 1:25 in 5% BSA/PBS at 4°C over night, an incubation with a corresponding secondary antibody (Alexa fluor 594 anti-mouse; 1:500; Jackson ImmunoResearch Europe Ltd., Ely, Cambridgeshire, UK) followed in 5% BSA/PBS at RT for 1 h. Between each antibody treatment cells were washed with PBS three times to remove previous antibody solutions. Imaging was performed on a fluorescence microscope (IX83 microscope, Olympus, Tokyo, Japan).
Quantification of Luciferase activity
For the luciferase assay, snap frozen cells were thawed and resuspended in 200μl RIPA-lysis buffer (pH8. 50 mM Tris; 150 mM NaCl; 0,5% DOC; 1% NP-40; 0,1% SDS) supplemented with protease inhibitors (cOmplete Tablets, Mini EDTA-free, Roche, Basel, Switzerland) and cell debris was pelleted by centrifugation (300×G/3 min). Total protein amount from the aqueous phase of lysed samples were determined using Micro BCA Protein Assay Kit (Thermo Fisher Scientific) following manufacturer’s protocol. Absorbance was measured at 562 nm in a ELX808 Ultra microplate reader (Agilent Technologies, Santa Clara, CA, USA) and total protein amount was calculated using a standard curve.
The total amount of protein in the individual samples was used to equalize the amount of protein from each sample for subsequent luciferase assay (Nano-Glo® Luciferase Assay System; Promega GmbH, Walldorf, Germany). Individual samples were diluted in water to yield a total protein concentration of 0.5μg/μl. Diluted samples were transferred to 96-well flat-bottom luminometer-compatible plates (costar®, Corning Incorporated, Kennebunk, ME, USA), followed by addition of Nano-Glo® Luciferase Assay Substrate mixed with Nano-Glo® Luciferase Assay buffer (dilution: 1:50). After incubation for 10 min at RT the relative light units (RLU) were measured using a 96 microplate Luminometer (Orion Microplate Luminometer; Berthold Technologies, Bad Wildbad, Germany) and normalized to the total protein amount of the corresponding sample.
Real-time qPCR
To determine the plasmid transfection rates in the respective cell lines, a fraction from the samples of one day post transfection was lysed using a qPCR-Lysis buffer (3M KCl; 1M Tris ph8.5; 0.45 % Tween-20; 0.45% NP40) and cell debris was pelleted by centrifugation (300×G/3 min). Aqueous phase of lysed samples was diluted 1:25 in water and RT-qPCR was performed using of 0.3μM each primer and my-Budged 5x Eva-Green qPCR-Mix (Bio-Budged Technologies, Krefeld, Germany) accordingly to manufacturer’s instructions in a RT-PCR cycler (CFX96 Touch Real-Time PCR Detection System; Bio-Rad, Hercules, CA, USA). Plasmid DNA transfection rates in each cell line were measured by the ratio of tEGFP plasmid copies to B2M housekeeping genes using specific primers (tEgfp: 5’-GTACTTCTCGATGCGGGTGT-3’, 3’-GCCGCATGACCAACAAGATG-5’; B2M: 5’- GGAATTGATTTGGGAGAGCATC-3’, 3’- CAGGTCCTGGCTCTACAATTTACTAA-5’). Standard curves using 101–107 copies of a Plasmid carrying either GFP or B2M DNA sequence were used to determine starting quantities of respective GOI’s. To assess promotor efficiency regarding to the relative gene expression of tEGFP encoded by promotor constructs in Ab1167 and C2C12 myotubes, a fraction of the snap frozen cells was thawed to analyse the samples on mRNA levels. Total RNA was isolated with the Quick-RNATM MiniPrep Plus Kit (Zymo Research, Irvine, CA, USA) with a DNase digestion step and equal amounts of RNA (200 ng) of each sample were reverse-transcribed into cDNA using High-Capacity cDNA Reverse Transcription Kit (Applied-Biosystems by Thermo Fisher Scientific). The mRNA levels of tEGFP and GAPDH were measured using specific primers (tEgfp: 5’-GTACTTCTCGATGCGGGTGT-3’, 3’- GCCGCATGACCAACAAGATG-5’; gapdh: 5’-AGCCACATCGCTCAGACAC-3’, 3’-GCCCAATACGACCAAATCC-5’). Real-time qPCR was performed using 0.3μM of each primer and iTaq Universal SYBR® Green Supermix (Bio-Rad) accordingly to manufacturer’s instructions in a CFX96 Touch Real-Time PCR Detection System light cycler (Bio-Rad). The relative expression of tEGFP to GAPDH was calculated using CFX MaestroTM Software.
Statistical analysis
Statistical analysis was performed with GraphPad Prism software. For all in vitro experiments in proliferating cells the activity of each construct was measured with four independent experiments and at least 3 technical replicates each. For in vitro experiments in myotubes the activity of each construct was measured with 3 independent biological and 3 technical replicates each. Mean values with SEM were calculated and are presented on graphs. To calculate statistical significance either One-way ANOVA test or Two-way ANOVA, mixed effects analysis with the Greenhouse-Geisser correction and Tukey’s test for multiple comparison was used, depending on particular experimental data distribution.
ACKNOWLEDGMENTS
We thank Isabelle Richard for kindly providing pGG16_6Fi_MuSeAP_pG3-12561 and pCRII_Promhmir206FL plasmids and Nenad Bursac for sharing the pRRL-MHCK7-GCaMP6 plasmid. We thank Kornelia Jaquet for providing H9C2 cells. We further acknowledge the platform for immortalization of human cells from the Institut de Myologie, Paris, where of AB1167 immortalized human skeletal myoblast cell line was generated. We thank Peter van der Ven for kindly providing titin T12 antibody and EPS advices. J.D was supported by the PhD program at Witten/Herdecke University and Heimer Foundation. E.E-S. received funding from the German Duchenne Foundation.
DECLARATION OF COMPLIANCE
Compliance with guidelines on human or animal experimentation do not apply for this study.
DECLARATION OF INTERESTS
The authors have no conflict of interest to report.
REFERENCES
[1] | Theadom A , Rodrigues M , Poke G , O’Grady G , Love D , Hammond-Tooke G , et al. A nationwide, population-based prevalence study of genetic muscle disorders. Neuroepidemiology. (2019) ;52: (3-4):128–3510.1159/000494115. |
[2] | Marshall DJ , Leiden JM . Recent advances in skeletal-muscle-based gene therapy. Curr Opin Genet Dev. (1998) ;8: (3):360–510.1016/s0959-437x(98)80094–4. |
[3] | Janssen I , Heymsfield SB , Wang ZM , Ross R . Skeletal muscle mass and distribution in 468 men and women aged 18-88 yr. J Appl Physiol (1985). (2000) ;89: (1):81–810.1152/jappl.2000.89.1.81. |
[4] | Skopenkova VV , Egorova TV , Bardina MV . Muscle-specific promotors for gene therapy. Acta Naturae. (2021) ;13: (1):47–5810.32607/actanaturae.11063. |
[5] | Roudaut C , Le Roy F , Suel L , Poupiot J , Karine C , Bartoli M , et al. Restriction of calpain3 expression to the skeletal muscle prevents cardiac toxicity and corrects pathology in a murine model of limb-girdle muscular dystrophy. Circulation. (2013) ;12810.1161/CIRCULATIONAHA.113.001340. |
[6] | Anguela XM , High KA . Entering the modern era of gene therapy. Annu Rev Med. (2019) ;70: :273–8810.1146/annurev-med-012017-043332. |
[7] | Wang B , Li J , Fu FH , Chen C , Zhu X , Zhou L , et al. Construction and analysis of compact muscle-specific promotors for AAV vectors. Gene Ther. (2008) ;15: (22):1489–9910.1038/gt.2008.104. |
[8] | Pozsgai ER , Griffin DA , Heller KN , Mendell JR , Rodino-Klapac LR . Systemic AAV-mediated β-sarcoglycan delivery targeting cardiac and skeletal muscle ameliorates histological and functional deficits in LGMD2E mice. Mol Ther. (2017) ;25: (4):855–6910.1016/j.ymthe.2017.02.013. |
[9] | Sahenk Z , Ozes B , Murrey D , Myers M , Moss K , Yalvac ME , et al. Systemic delivery of AAVrh74. tMCK.hCAPN3 rescues the phenotype in a mouse model for LGMD2A/R1. Mol Ther Methods Clin Dev. (2021) ;22: :401–1410.1016/j.omtm.2021.06.010. |
[10] | Piekarowicz K , Bertrand AT , Azibani F , Beuvin M , Julien L , Machowska M , et al. A muscle hybrid promotor as a novel tool for gene therapy. Mol Ther Methods Clin Dev. (2019) ;15: :157–6910.1016/j.omtm.2019.09.001. |
[11] | Li ZL , Paulin D . High level desmin expression depends on a muscle-specific enhancer. Journal of Biological Chemistry. (1991) ;266: (10):6562–70. |
[12] | Lostal W , Roudaut C , Faivre M , Charton K , Suel L , Bourg N , et al. Titin splicing regulates cardiotoxicity associated with calpain 3 gene therapy for limb-girdle muscular dystrophy type 2A. Sci Transl Med. (2019) ;11: (520):eaat607210.1126/scitranslmed.aat6072. |
[13] | Buckingham M . Making muscle in mammals. Trends Genet. (1992) ;8: (4):144–810.1016/0168-9525(92)90373-c. |
[14] | Raguz S , Hobbs C , Yagüe E , Ioannou PA , Walsh FS , Antoniou M . Muscle-specific locus control region activity associated with the human desmin gene. Dev Biol. (1998) ;201: (1):26–4210.1006/dbio.1998.8964. |
[15] | Jaynes JB , Chamberlain JS , Buskin JN , Johnson JE , Hauschka SD . Transcriptional regulation of the muscle creatine kinase gene and regulated expression in transfected mouse myoblasts. Mol Cell Biol. (1986) ;6: (8):2855–6410.1128/mcb.6.8.2855-2864.1986. |
[16] | Molkentin JD , Jobe SM , Markham BE . Alpha-myosin heavy chain gene regulation: Delineation and characterization of the cardiac muscle-specific enhancer and muscle-specific promotor. J Mol Cell Cardiol. (1996) ;28: (6):1211–2510.1006/jmcc.1996.0112. |
[17] | Salva MZ , Himeda CL , Tai PWL , Nishiuchi E , Gregorevic P , Allen JM , et al. Design of tissue-specific regulatory cassettes for high-level rAAV-mediated expression in skeletal and cardiac muscle. Molecular Therapy. (2007) ;15: (2):320–910.1038/sj.mt.6300027. |
[18] | Madden L , Juhas M , Kraus WE , Truskey GA , Bursac N . Bioengineered human myobundles mimic clinical responses of skeletal muscle to drugs. Elife. (2015) ;4: :e0488510.7554/eLife.04885.04885. |
[19] | Sempere LF , Freemantle S , Pitha-Rowe I , Moss E , Dmitrovsky E , Ambros V . Expression profiling of mammalian microRNAs uncovers a subset of brain-expressed microRNAs with possible roles in murine and human neuronal differentiation. Genome Biol. (2004) ;5: (3):R1310.1186/gb-2004-5-3-r13. |
[20] | Yaffe D , Saxel O . Serial passaging and differentiation of myogenic cells isolated from dystrophic mouse muscle. Nature. (1977) ;270: (5639):725–710.1038/270725a0. |
[21] | Blau HM , Pavlath GK , Hardeman EC , Chiu CP , Silberstein L , Webster SG , et al. Plasticity of the differentiated state. Science. (1985) ;230: (4727):758–6610.1126/science.2414846. |
[22] | Mamchaoui K , Trollet C , Bigot A , Negroni E , Chaouch S , Wolff A , et al. Immortalized pathological human myoblasts: Towards a universal tool for the study of neuromuscular disorders. Skelet Muscle. (2011) ;1: :3410.1186/2044-5040-1-34. |
[23] | Kimes BW , Brandt BL . Properties of a clonal muscle cell line from rat heart. Exp Cell Res. (1976) ;98: (2):367–8110.1016/0014-4827(76)90447-x. |
[24] | Norrman K , Fischer Y , Bonnamy B , Wolfhagen Sand F , Ravassard P , Semb H . Quantitative comparison of constitutive promotors in human ES cells. PLoS One. (2010) ;5: (8):e1241310.1371/journal.pone.0012413. |
[25] | Qin JY , Zhang L , Clift KL , Hulur I , Xiang AP , Ren BZ , et al. Systematic comparison of constitutive promotors and the doxycycline-inducible promotor. PLoS One. (2010) ;5: (5):e1061110.1371/journal.pone.0010611. |
[26] | Shirley JL , de Jong YP , Terhorst C , Herzog RW . Immune responses to viral gene therapy vectors. Mol Ther. (2020) ;28: (3):709–2210.1016/j.ymthe.2020.01.001. |
[27] | Bartoli M , Roudaut C , Martin S , Fougerousse F , Suel L , Poupiot J , et al. Safety and efficacy of AAV-mediated calpain 3 gene transfer in a mouse model of limb-girdle muscular dystrophy type 2A. Molecular Therapy. (2006) ;13: (2):250–9. |
[28] | Zhang W , Solanki M , Müther N , Ebel M , Wang J , Sun C , et al. Hybrid adeno-associated viral vectors utilizing transposase-mediated somatic integration for stable transgene expression in human cells. PLoS One. (2013) ;8: (10):e7677110.1371/journal.pone.0076771. |
[29] | Zhang W , Fu J , Liu J , Wang H , Schiwon M , Janz S , et al. An engineered virus library as a resource for the spectrum-wide exploration of virus and vector diversity. Cell Rep. (2017) ;19: (8):1698–70910.1016/j.celrep.2017.05.008. |
[30] | Orfanos Z , Gödderz MP , Soroka E , Gödderz T , Rumyantseva A , van der Ven PF , et al. Breaking sarcomeres by in vitroexercise. Sci Rep. (2016) ;6: :1961410.1038/srep19614. |
[31] | Lee IH , Lee YJ , Seo H , Kim YS , Nam JO , Jeon BD , et al. Study of muscle contraction induced by electrical pulse stimulation and nitric oxide in C2C12 myotube cells. J Exerc Nutrition Biochem. (2018) ;22: (1):22–810.20463/jenb.2018.0004. |
[32] | Fujita H , Nedachi T , Kanzaki M . Accelerated de novo sarcomere assembly by electric pulse stimulation in C2C12 myotubes. Experimental Cell Research. (2007) ;313: (9):1853–65. |
[33] | Fürst DO , Osborn M , Nave R , Weber K . The organization of titin filaments in the half-sarcomere revealed by monoclonal antibodies in immunoelectron microscopy: A map of ten nonrepetitive epitopes starting at the Z line extends close to the M line. J Cell Biol. (1988) ;106: (5):1563–7210.1083/jcb.106.5.1563. |
[34] | van der Ven PF , Fürst DO . Assembly of titin, myomesin and M-protein into the sarcomeric M band in differentiating human skeletal muscle cells in vitro . Cell Struct Funct. (1999) ;22: (1):163–7110.1247/csf.22.163. |
[35] | Duan B , Cheng L , Gao Y , Yin FX , Su GH , Shen QY , et al. Silencing of fat-1 transgene expression in sheep may result from hypermethylation of its driven cytomegalovirus (CMV) promotor. Theriogenology. (2012) ;78: (4):793–802. |
[36] | Suzuki-Hatano S , Saha M , Soustek MS , Kang PB , Byrne BJ , Cade WT , et al. AAV9-TAZ gene replacement ameliorates cardiac TMT proteomic profiles in a mouse model of barth syndrome. Mol Ther Methods Clin Dev. (2019) ;13: :167–7910.1016/j.omtm.2019.01.007. |
[37] | Pacak CA , Sakai Y , Thattaliyath BD , Mah CS , Byrne BJ . Tissue specific promotors improve specificity of AAV9 mediated transgene expression following intra-vascular gene delivery in neonatal mice. Genet Vaccines Ther. (2008) ;6: :1310.1186/1479-0556-6-13. |
[38] | Salabarria SM , Nair J , Clement N , Smith BK , Raben N , Fuller DD , et al. Advancements in AAV-mediated gene therapy for pompe disease. J Neuromuscul Dis. (2020) ;7: (1):15–3110.3233/jnd-190426. |
[39] | Mendell JR , Sahenk Z , Lehman K , Nease C , Lowes LP , Miller NF , et al. Assessment of systemic delivery of rAAVrh74. MHCK7.micro-dystrophin in children with duchenne muscular dystrophy: A nonrandomized controlled trial. JAMA Neurology. (2020) ;77: (9):1122–3110.1001/jamaneurol.2020.1484. |
[40] | Potter RA , Griffin DA , Sondergaard PC , Johnson RW , Pozsgai ER , Heller KN , et al. Systemic delivery of dysferlin overlap vectors provides long-term gene expression and functional improvement for dysferlinopathy. Hum Gene Ther. (2018) ;29: (7):749–6210.1089/hum.2017.062. |
[41] | Han SO , Li S , Bird A , Koeberl D . Synergistic efficacy from gene therapy with coreceptor blockade and a β2-agonist in murine pompe disease. Hum Gene Ther. (2015) ;26: (11):743–5010.1089/hum.2015.033. |
[42] | Jia X , Lin H , Abdalla BA , Nie Q . Characterization of miR-206 promotor and its association with birthweight in chicken. Int J Mol Sci. (2016) ;17: (4):55910.3390/ijms17040559. |
[43] | Koutsoulidou A , Mastroyiannopoulos NP , Furling D , Uney JB , Phylactou LA . Expression of miR-1, miR-133a, miR-133b and miR-206 increases during development of human skeletal muscle. BMC Developmental Biology. (2011) ;11: (1):3410.1186/1471-213X-11-34. |
[44] | Kim HK , Lee YS , Sivaprasad U , Malhotra A , Dutta A . Muscle-specific microRNA miR-206 promotes muscle differentiation. J Cell Biol. (2006) ;174: (5):677–8710.1083/jcb.200603008. |
[45] | Williams AH , Valdez G , Moresi V , Qi X , McAnally J , Elliott JL , et al. MicroRNA-206 delays ALS progression and promotes regeneration of neuromuscular synapses in mice. Science. (2009) ;326: (5959):1549–5410.1126/science.1181046. |
[46] | Yuasa K , Hagiwara Y , Ando M , Nakamura A , Takeda S , Hijikata T . MicroRNA-206 is highly expressed in newly formed muscle fibers: Implications regarding potential for muscle regeneration and maturation in muscular dystrophy. Cell Struct Funct. (2008) ;33: (2):163–910.1247/csf.08022. |
[47] | Shin JH , Pan X , Hakim CH , Yang HT , Yue Y , Zhang K , et al. Microdystrophin ameliorates muscular dystrophy in the canine model of duchenne muscular dystrophy. Molecular Therapy: The Journal of the American Society of Gene Therapy. (2013) ;21: (4):750–710.1038/mt.2012.283. |
[48] | Potter RA , Griffin DA , Heller KN , Peterson EL , Clark EK , Mendell JR , et al. Dose-escalation study of systemically delivered rAAVrh74.MHCK7.micro-dystrophin in the mdx mouse model of duchenne muscular dystrophy. Human gene therapy. (2021) ;32: (7-8):375–8910.1089/hum.2019.255. |
[49] | Kodippili K , Hakim CH , Pan X , Yang HT , Yue Y , Zhang Y , et al. dual AAV gene therapy for duchenne muscular dystrophy with a 7-kb mini-dystrophin gene in the canine model. Human Gene Therapy. (2018) ;29: (3):299–31110.1089/hum.2017.095. |
[50] | Hakim CH , Clement N , Wasala LP , Yang HT , Yue Y , Zhang K , et al. Micro-dystrophin AAV vectors made by transient transfection and herpesvirus system are equally potent in treating mdx mouse muscle disease. Mol Ther Methods Clin Dev. (2020) ;18: :664–7810.1016/j.omtm.2020.07.004. |
[51] | Shieh PB . Muscular dystrophies and other genetic myopathies. Neurol Clin. (2013) ;31: (4):1009–2910.1016/j.ncl.2013.04.004. |
[52] | Aysha J , Noman M , Wang F , Liu W , Zhou Y , Li H , et al. Synthetic promotors: Designing the cis regulatory modules for controlled gene expression. Mol Biotechnol. (2018) ;60: (8):608–2010.1007/s12033-018-0089-0. |
[53] | Domenger C , Grimm D . Next-generation AAV vectors-do not judge a virus (only) by its cover. Hum Mol Genet. (2019) ;28: (R1):R3–r1410.1093/hmg/ddz148. |
[54] | Wang L , Wang Z , Zhang F , Zhu R , Bi J , Wu J , et al. Enhancing transgene expression from recombinant AAV8 vectors in different tissues using woodchuck hepatitis virus post-transcriptional regulatory element. Int J Med Sci. (2016) ;13: (4):286–9110.7150/ijms.14152. |
[55] | Powell SK , Rivera-Soto R , Gray SJ . Viral expression cassette elements to enhance transgene target specificity and expression in gene therapy. Discov Med. (2015) ;19: (102), 49–57. |
[56] | Büning H , Srivastava A . Capsid modifications for targeting and improving the efficacy of AAV vectors. Mol Ther Methods Clin Dev. (2019) ;12: :248–6510.1016/j.omtm.2019.01.008. |
[57] | Weinmann J , Weis S , Sippel J , Tulalamba W , Remes A , El Andari J , et al. Identification of a myotropic AAV by massively parallel in vivo evaluation of barcoded capsid variants. Nat Commun. (2020) ;11: (1):543210.1038/s41467-020-19230-w. |


