
Characterization of Phenotypic Variability in Becker Muscular Dystrophy for Clinical Practice and Towards Trial Readiness: A Two-Years Follow up Study
Abstract
Background:
Becker muscular dystrophy (BMD) is a dystrophinopathy due to in-frame mutations in the dystrophin gene (DMD) which determines a reduction of dystrophin at muscle level. BMD has a wide spectrum of clinical variability with different degrees of disability. Studies of natural history are needed also in view of up-coming clinical trials.
Objectives:
From an initial cohort of 32 BMD adult subjects, we present a detailed phenotypic characterization of 28 patients, then providing a description of their clinical natural history over the course of 12 months for 18 and 24 months for 13 of them.
Methods:
Each patient has been genetically characterized. Baseline, and 1-year and 2 years assessments included North Star Ambulatory Assessment (NSAA), timed function tests (time to climb and descend four stairs), 6-minute walk test (6MWT), Walton and Gardner-Medwin Scale and Medical Research Council (MRC) scale. Muscle magnetic resonance imaging (MRI) was acquired at baseline and in a subgroup of 9 patients after 24 months. Data on cardiac function (electrocardiogram, echocardiogram, and cardiac MRI) were also collected.
Results and conclusions:
Among the clinical heterogeneity, a more severe involvement is often observed in patients with 45-X del, with a disease progression over two years. The 6MWT appears sensitive to detect modification from baseline during follow up while no variation was observed by MRC testing. Muscle MRI of the lower limbs correlates with clinical parameters.
Our study further highlights how the phenotypic variability of BMD adult patients makes it difficult to describe an uniform course and substantiates the need to identify predictive parameters and biomarkers to stratify patients.
INTRODUCTION
Becker muscular dystrophy (BMD), along with Duchenne muscular dystrophy (DMD), is a dystrophinopathy due to in-frame mutations in the dystrophin gene (DMD) which determines a reduction (in BMD) or absence (in DMD) of dystrophin. BMD is the mildest phenotype that however has a wide spectrum of clinical variability with different degrees of disability due to muscle fatty substitution [1]. Deletions represent the most frequent (70%) type of causative mutation and clinical severity tends to correlate to the type of deletion [2]. The muscular involvement is typically proximal at limb girdle, the lower limbs are more frequently affected than the upper limbs, and the anterior loggia of the thighs presents a greater involvement than the posterior loggia [3, 4]. Dilated cardiomyopathy from dystrophin depletion is relatively uncommon in patients younger than 16 years while on the contrary cardiac involvement is found in more than 70% of patients from the age of 40 [5].The onset is in juvenile age [6], the rate of progression of the disease is variable and many patients can lose ambulation in adult age [7]. A wide variability of clinical expression and disease severity in BMD is well known in clinical practice, however few systematic and standardized studies of its natural history have been reported so far. Previous studies highlighted different clinical courses between deletions starting from exon 45, causing more typical and severe phenotypes, and deletions involving exons 48 and 51, associated to milder forms [8; 5]. Measurement tools to quantify the degree of motor impairment are standardized motor scales (6-minute walking test, North Star Ambulatory Assessment, and timed motor tests) that are used for monitoring patients during follow-up [9]. In the last decade muscle magnetic resonance has become a useful non-invasive tool in clinical practice that allows to characterize and determine the degree of fibroadipose substitution in skeletal muscles [3, 4].
MATERIALS AND METHODS
The study started in May 2017 We initially recruited a cohort of 32 patients from 30 unrelated families with confirmed genetic diagnosis of BMD, referring to the Neurology Unit of Azienda Ospedaliero-Universitaria of Pisa (see Fig. 1 for study protocol). The clinical protocol was approved by the Local Ethics Committee (study ID 17831) and was carried out in accordance with the Helsinki Declaration and its amendments.
Fig. 1
The figure shows a 10x image of immunohistochemistry for dystrophin C-terminus in muscle biopsy of the patient harboring a nonsense point mutation (c.12G>A) in exon 1.

A baseline detailed clinical evaluation was performed in 28 patients, subsequently after 12 months in 18 subjects and every 12 months for a total period of 24 months in other 13 patients. Twenty-seven patients underwent baseline muscle MRI of the pelvis, thighs, and legs, and in 9 of them the MRI was repeated after 24 months; it was not possible to perform follow-up of muscle MRI in the other subjects due to the ongoing SARS Cov-2 pandemic. Demographic and genetic data, along with clinical and radiological procedures performed for each patient, are summarized in Table 1 and Table 2. The following standardized motor scales were used: Six Minute Walking Test (6MWT), North Star Ambulatory Assessment (NSAA) score, Walton & Gardner-Medwin (W&GM) scale and Medical Research Council (MRC) scale. The 6MWT consists of a timed motor task in which the ambulant patient is asked to walk up to 6 minutes along a flat, straight corridor for 25 m long laps; registered parameters include completion of the task (or duration if the total of 6 minutes is not reached), the number of laps completed, and the additional distance covered and the inter-lap walking time. This represents one of the most useful and valued timed function tests in cardio-pulmonary and neuromuscular diseases follow-up evaluations and clinical trials outcome measures [10]. The NSAA score is a functional scale specifically developed for dystrophynopathies, considering the upper body, trunk, and inferior limbs [9]. Although developed for pediatric populations, the NSAA has been widely used in adult BMD patients [5, 9, 11, 12]. The MRC scale consists of a clinician-evaluated measurement of single muscles strength with score ranging from 0 (no visible muscle contraction) to 5 (normal contraction against examiner’s full resistance). In our cohort the evaluated muscles were the deltoid, biceps brachialis, triceps, ileo-psoas, thigh abductors and adductors, gluteal muscles, biceps femoris, quadriceps, gastrocnemius, and tibialis anterior. All patients have been undergoing routine cardiological assessment and follow-up evaluation according to the standard of care [5]. They annually performed electrocardiogram, echocardiogram and NT-proBNP blood level dosage. In 16 patients cardiac MRI was also carried out. Muscle MRIs were performed with an MR 1.5 T scanner (Signa Horizon 1,5 GE Healthcare). The whole protocol includes axial Spin Echo T1-weighted images (slice thickness 5 mm; echo time 14 ms; repetition time 540 ms; field of view for pelvis and thigs: 40x58,3 cm, field of view for lower leg: 32x46,6 cm; acquisition matrix 256x256) and WATER (InPhase and outPhase) and FAT (InPhase and outPhase) IDEAL FSE T1 weighted images (slice thickness 5 mm; echo time 12,88 ms; repetition time 540 ms; field of view for pelvis and thigs 40x58,3 cm, field of view for lower leg: 32x46,6 cm; acquisition matrix 256 x256). Nine of these 27 patients underwent a follow-up muscle MRI at pelvis, thighs, and legs at 36 months with the same protocol; T1 w images were scored according to Mercuri scale.
Table 1
Cohort of BMD patients
| Patient ID | Age at baseline evaluation | Age at onset of motor impairment | CK level | DMD mutation | Ambulant | Age at ambulation loss | EF (%) | NT-proBNP level | 6MWT | W&G | NSAA |
| P1* | 62 | 15 | 2X | Del 45-47 | Yes | 62 | 21 | 275 | 3 | 18 | |
| P2* | 49 | 15 | 4X | Del 45-47 | Yes | 64 | 21 | 365 | 3 | 19 | |
| P3 | 25 | 10 | 2X | Del 45-48 | Yes | 50 | 14 | 497 | 3 | 27 | |
| P4 | 57 | // | 2X | Del 48 | Yes | 35 | 163 | 711 | 0 | 34 | |
| P5 | 35 | // | 4X | Del 45-48 | Yes | 58 | 650 | 3 | 22 | ||
| P6 | 34 | // | 4X | Del 49-51 | Yes | 60 | 625 | 0 | 34 | ||
| P7 | 32 | 5 | 2X | Del 49-51 | Yes | 65 | 381 | 3 | 22 | ||
| P8 | 34 | 13 | 4X | Del 48-56 | Yes | 50 | 40 | 475 | 1 | 28 | |
| P9 | 43 | 25 | 4X | Del es 13-intr 13 | Yes | 65 | 383 | 3 | 18 | ||
| P10 | 58 | 30 | 4X | Del 45-52 | Yes | 50 | 450 | 6 | 23 | ||
| P11 | 21 | 10 | 2X | Del 48-51 | Yes | 50 | 525 | 0 | 34 | ||
| P12 | 38 | 25 | 4X | Del 45-47 | Yes | 40 | 32 | 475 | 3 | 16 | |
| P13 | 26 | 25 | 4X | Del 45-47 | Yes | 43 | 460 | 1 | 27 | ||
| P14 | 34 | // | 4X | Del 48 | Yes | 62 | 34 | 600 | 3 | 34 | |
| P15 | 23 | 10 | 4X | Del 45-48 | Yes | 59 | 25 | 575 | 0 | 34 | |
| P16 | 46 | 30 | 4X | Del 4 | Yes | 63 | 288 | 4 | 14 | ||
| P17 | 70 | 20 | 4X | c.5287C > T | No | 25 | 57 | 304 | n.e. | 8 | 1 |
| P18 | 38 | 25 | 4X | Del 48-49 | Yes | 30 | 412 | 6 | 34 | ||
| P19 | 56 | 25 | 4X | Del 48-49 | Yes | 63 | 99 | 285 | 6 | 17 | |
| P20 | 32 | 15 | 4X | Del 48-49 | Yes | 58 | 235 | 6 | 14 | ||
| P21* | 21 | // | 4X | Del 45-51 | Yes | 55 | 31 | 662 | 0 | 34 | |
| P22* | 21 | // | 4X | Del 45-51 | Yes | 45 | 35 | 705 | 0 | 34 | |
| P23 | 21 | 15 | 4X | Del 45-51 | Yes | 53 | 650 | 2 | 34 | ||
| P24 | 70 | 25 | 2X | Del 45-52 | No | 30 | 60 | n.e. | 7 | 8 | |
| P25 | 24 | 10 | 4X | Del 3-4 | Yes | 48 | 20 | 344 | 3 | 20 | |
| P26 | 36 | 10 | 2X | Del 45-47 | Yes | 55 | 500 | 3 | 16 | ||
| P27 | 35 | 12 | 4X | Del 45-47 | Yes | 57 | |||||
| P28 | 23 | 10 | 4X | Del 48-51 | Yes | 60 | |||||
| P29 | 38 | 35 | 4X | c.12 G>A, p.TRP4* | Yes | 63 | |||||
| P30 | 45 | 6 | 4X | Del 45-47 | No | 25 | 58 | n.e. | 7 | 34 | |
| P31 | 52 | 13 | 4X | Del 34 | Yes | 55 | 600 | 1 | 34 | ||
| P32 | 28 | 10 | 2X | Del 45-47 | Yes | 70 | 475 | 1 | 27 |
Table 2
The table displays the evaluations performed for each patient
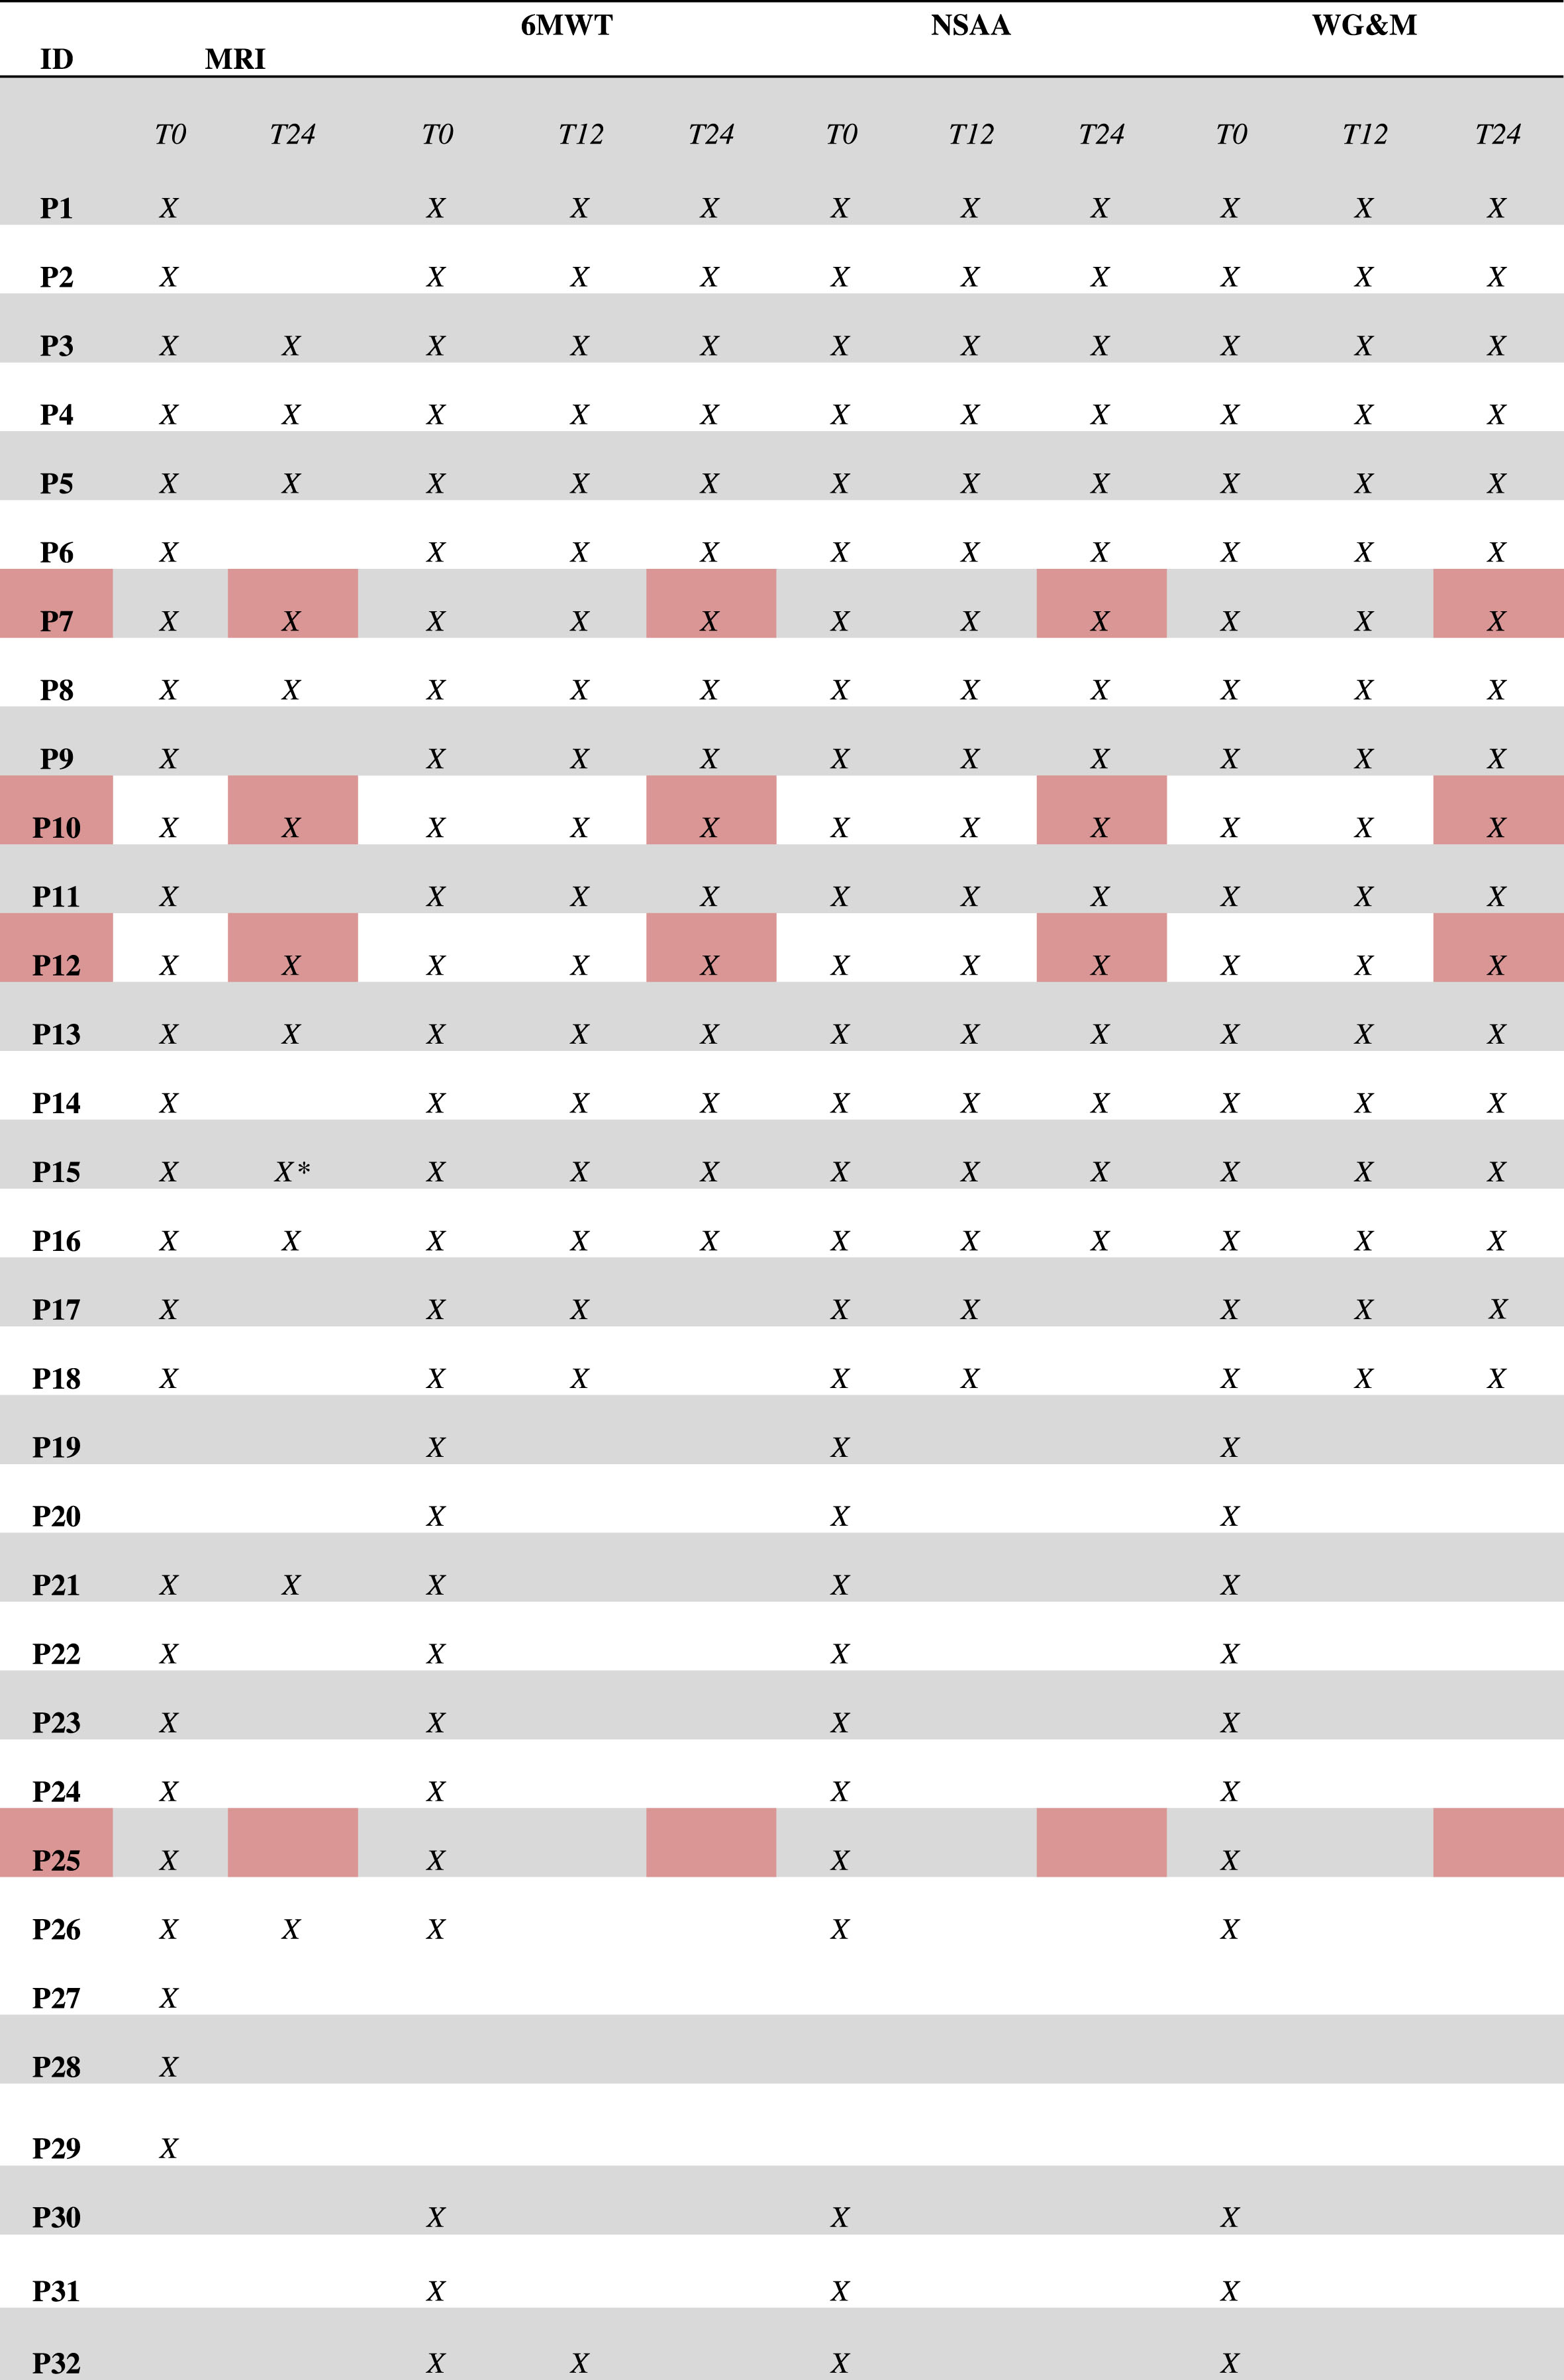 |
*: Musculoskeletal MRI follow-up is of 6 years instead of two. Patients that were enrolled in a clinical trial following baseline evaluation are marked in red.
Statistical analysis
The sample size corresponds to the number of patients in follow-up at the reference Centre for Neuromuscular Diseases in Pisa (Italy). Continuous variables were reported as mean±standard deviation (SD) or median and interquartile range, as appropriate. Normality of distributions was visually inspected by box-plot representation and formally assessed with the Shapiro-Wilk test.
Between-group comparisons were carried out by means of Student t-test. To evaluate the impact of age and time of disease on NSAA and the 6MWT scale evolution, respectively, we conducted two independent linear mixed-effects models (LMM). Variables with skewed distribution were log-transformed for use in parametric analyses. Statistically significant differences were assumed at 5% level of probability (adjusted for multiple comparison, if required), and all statistical tests were two-tailed. All analyses were performed with Stata version 17 (StataCorp LLC, Texas USA), and GraphPad Prism version 5 (GraphPad Software Inc, La Jolla, CA USA) for MacOs.
RESULTS
Our initial cohort included 32 BMD patients, aged at first evaluation between 21 and 70 years, mean age of 39.0±15.0 years, and with time disease duration of 21.3±11.7 years.
Genetic characterization
Most of the mutations found were deletions, while three patients carried compound heterozygous point mutations (see Table 1). The 47% (15/32) of patients showed deletions starting with exon 45 (identified as 45-X, Subgroup A, mean age 34,7±16,2), 7 patients starting with exon 48 (identified as 48-x, Subgroup B, mean age 38,8±21,3), 2 patient carry a point deletion of ex 48 and one patient carries a nonsense point mutation in exon 1 (c.12 G>A) not previously described, that, despite generating a premature stop codon, allows the translation of a shorter protein (60 Kda) through an alternative start site located further downstream at exon 6 (see Fig. 1 muscle biopsy showing normal immunohistochemistry for dystrophyn C-terminus, patient n. 29).
Baseline clinical characterization
In our series we found a wide clinical variability. The mean age of symptoms’ onset was 18 ±9 years, with most patients displaying motor symptoms before the age of 30, especially in Subgroup A (Fig. 2). Six patients aged between 21–57 did not show functional motor impairment. Only three patients lost ambulation, respectively at age 25, 30 and 51.
Fig. 2
Age at motor onset (in the vertical axis) in Subgroups A and B and in patients with other DMD mutations.
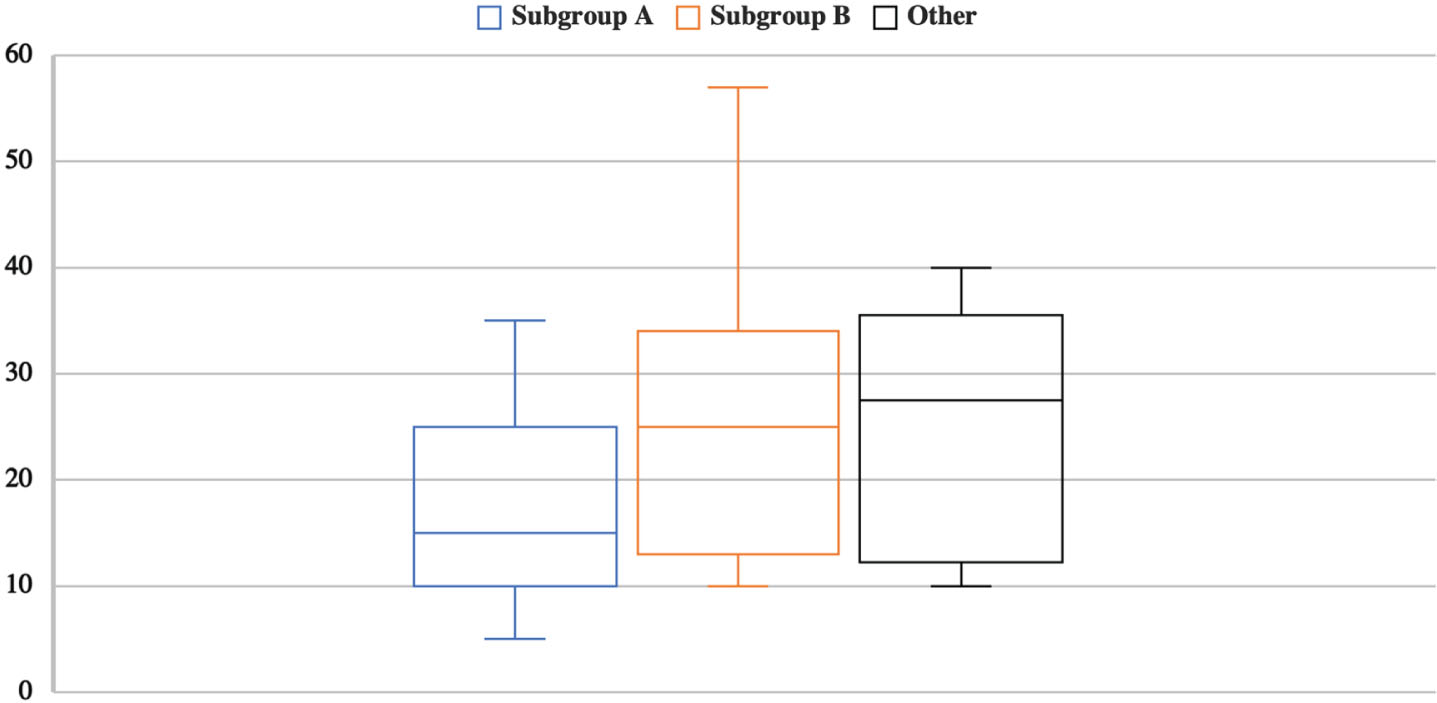
Individuals of Subgroup A aged 35.3 ± 15.7 years, the age of symptoms’ onset was 14.2 ± 6.1 years, and the time of disease 21.8 ± 14.3 years; individuals of Subgroup B aged 39.1 ± 13.0 years, the age of symptoms’ onset was 18.2 ± 7.9 years, and the time of disease 18.6 ± 6.5 years. The mean age at onset did not statistically differ between the two subgroups.
Subgroup A presented with a typical BMD phenotype characterized by pelvic girdle involvement and early prominent quadriceps femoris impairment of variable moderate-severe degree, while patients of subgroup B showed a milder phenotype. Indeed, the mean performance in 6MWT was 421.8 m ± 227.4 in subgroup A and 501.3 ± 148.1 in subgroup B.
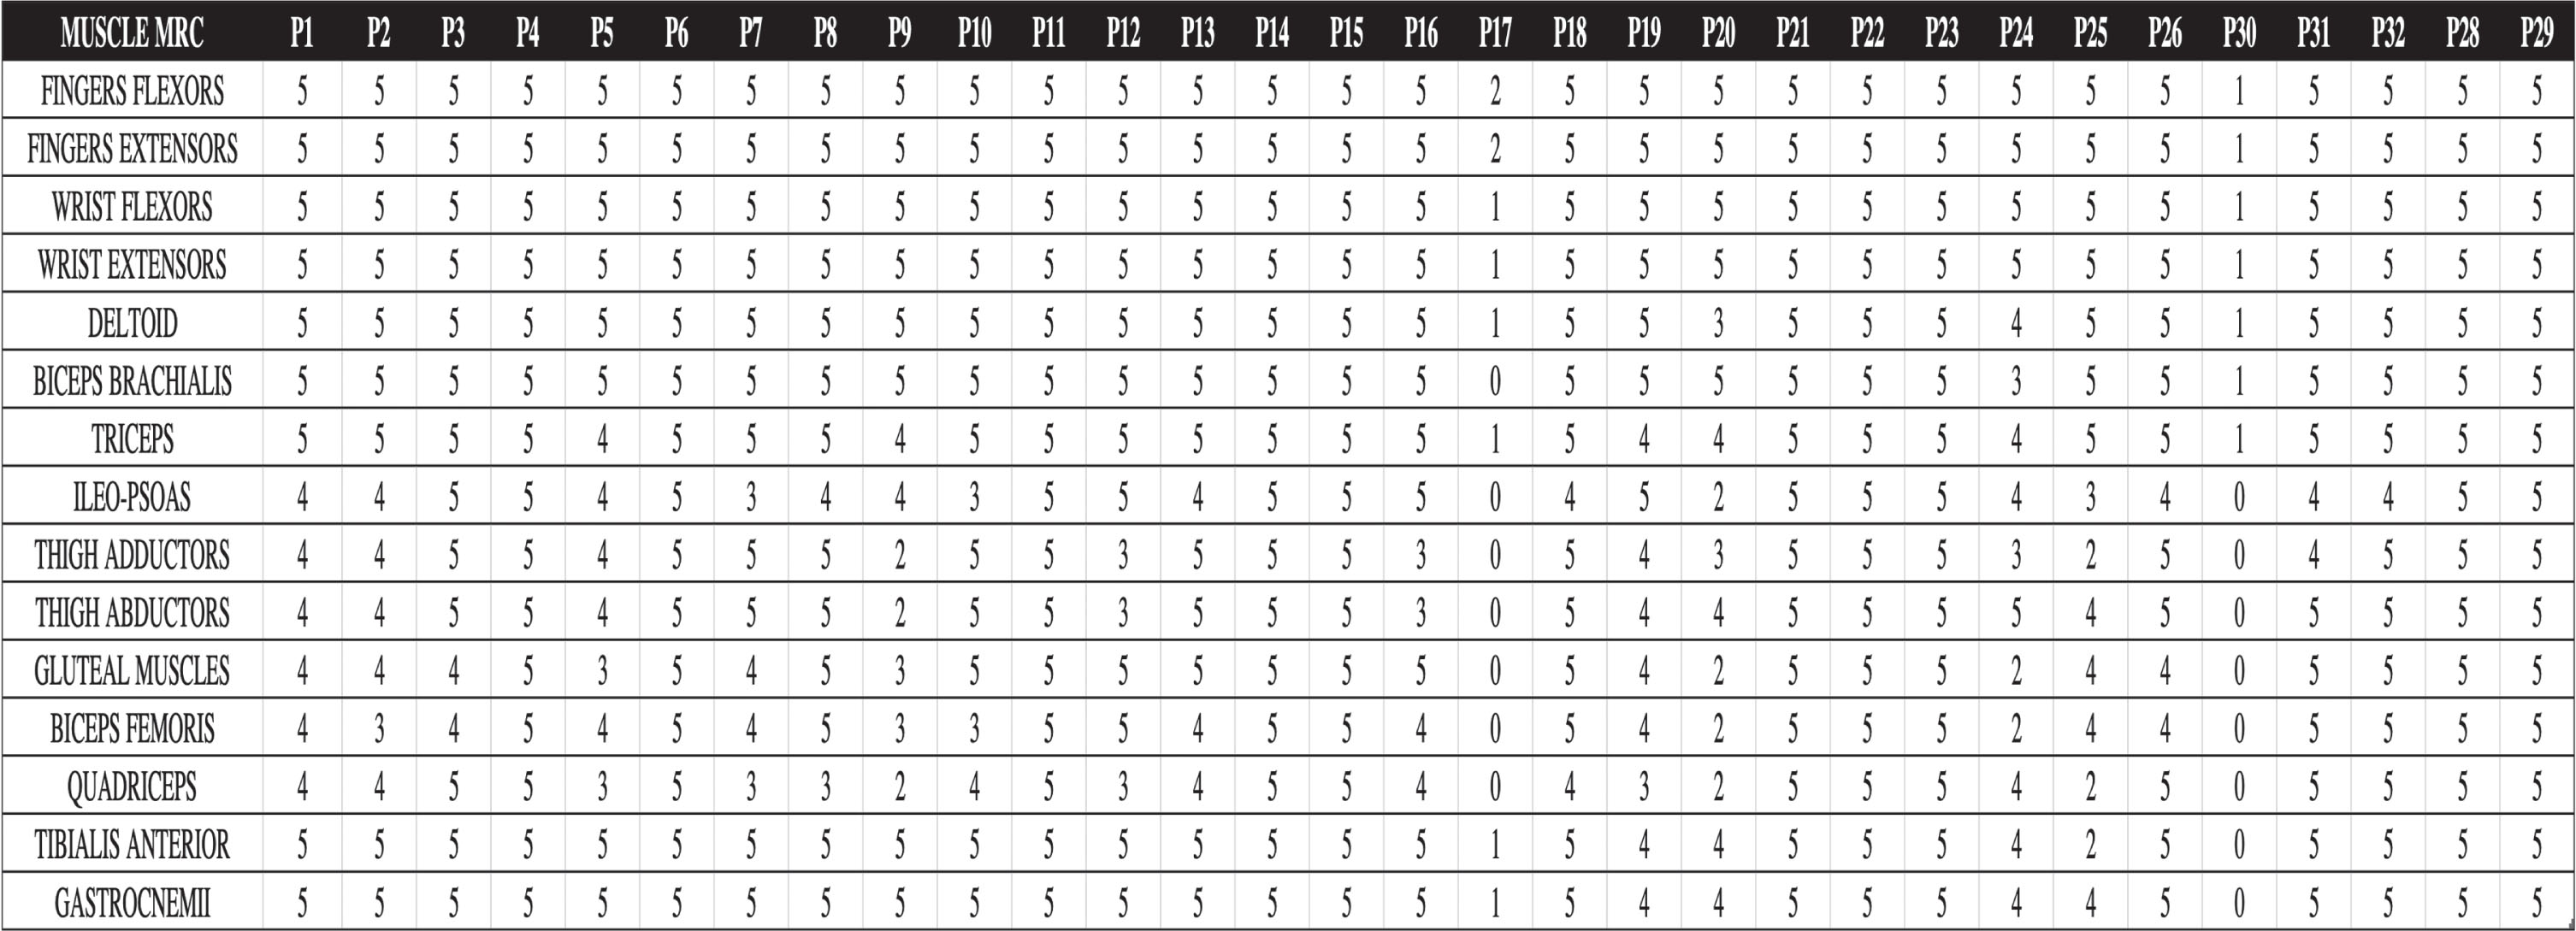
Of the three non-ambulant patients, two of them carry a 45–47 ex deletion and the other one has the nonsense point mutation c.5287 C>T (p.Arg1763Ter); although nonsense mutations are generally associated with DMD phenotype, in this case the residing mechanism explained by the in-frame skipping of exon 37 led to BMD phenotype as previously described [15]. As to NSAA, 21,5 ±9,9 were the mean value and standard deviation in patients harboring 45-x compared to 30,2 ±6,9 in patients with 48-x, thus correlating with the 6MWT performance. In our cohort, time from symptoms presentation was positively associated with reduced performance at 6MWT (p < 0,001). At strength measurement with the MRC system, the most affected muscles were the quadriceps, biceps femoris, the gluteal muscles and the thigh adductors, as expected. Two severely affected, non-ambulant patients (P17 and P30, see Tab. 1), also showed severe weakness of the upper limbs’ muscles, including wrist flexors and extensor muscles and intrinsic hand muscles, and dysphagia. Extensive description of MRC in the complete cohort is reported in Fig. 3.
Fig. 3
Baseline evaluation muscle strength evaluated by MRC. Patients 17 and 30, severely affected, wheelchair-bound, are characterized also by a severe distal upper limb involvement.
Follow-up Clinical Data. We collected the clinical evaluation through the scales NSAA, Walton and Gardner-Medwin Scale and 6MWT for a follow up period until 24 months (12 months for 18 subjects, and 24 months for 13 patients). Among the 32 patients initially recruited, we had to not consider follow up data of 4 patients due to their participation to a clinical trial.
In one-year follow up, we did not observe significant modifications at any motor scale (NSAA; 23.7±9.4 versus 22.6±9,8; 6MWT: 438.3±191.5 versus 431.4±7.2; W&GM values did not deteriorate in any subject).
Regarding the longer follow up of 24 months, overall we found that the NSAA did not decline between baseline and end of follow-up: 23.7±9.4 versus 22.6±7.3, respectively. Similarly, at two years monitoring, we did not find significant modifications in meters walked at the 6MWT: 438.3±191.5 versus 429.8±144.2 m, respectively. At the Walton and Gardner-Medwin Scale, we noticed a stability in the score overtime too, on the whole sample.
Notably, when we performed a post hoc elaboration, after subdividing the sample into two sets of less than and above 34 years of age (level corresponding to median and mode), we found a significant effect of age on NSAA and 6MWT value, regardless duration of disease. In particular, the subjects over 34 years of age showed lower NSAA values, in all time points considered (at baseline: 30.4±6.2 vs. 18.3±9.7, p < 0.01; at 1-year follow-up: 30.7±4.2 vs. 16.6±9.6, p < 0.01; at 2-year follow-up: 29.4±4.5 vs. 19.0±8.5, p < 0.05); on 6MWT, subjects above 34 years showed lower values in all time points (at baseline: 559.9±133.5 vs. 347.6±244.8 m, p < 0.01; at 1-year follow-up: 533.2±104.3 vs. 310.0±181.0 m, p < 0.01; at 2-year follow-up: 547.1±109.6 vs. 373.0±149.4 m, p < 0.05). Moreover, for W&GM, higher values (1.3±1.8 vs. 4.1±2.4, p = 0.001) were present in patients above 34 years in all time points and when we split the sample into two sets of less than and above 17 years of time of disease (level corresponding to median and mode), the subjects over 17 years of disease duration revealed higher scores (1.7±2.3 vs. 3.8±2.4, p = 0.035), in all timepoints.
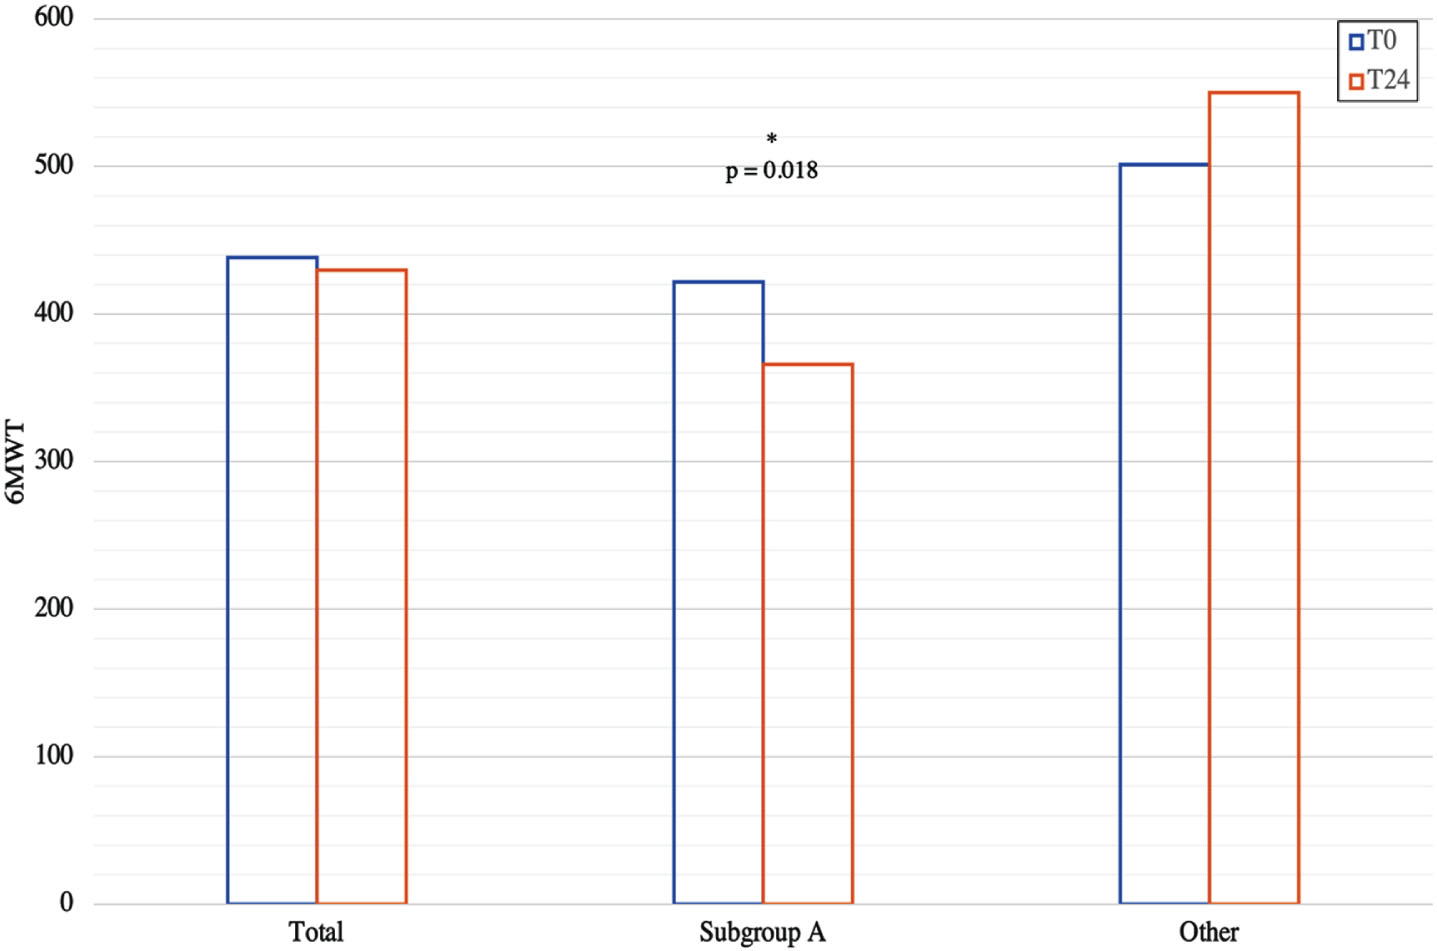
The clinical trend was slightly worse in the group of patients carrying a 45-x deletion: in fact, the results show a statistically significant difference between subgroup A and the rest of the patients, at the end of follow-up, for 6MWT: 365.9±97.0 vs. 550.2±153.0, p = 0.018 (Fig. 4), and NSAA: 19.1±4.7 vs. 28.8±8.3 (p = 0.027), although starting from comparable values. Also, the Walton and Gardner-Medwin Scale values were significantly different between the two subgroups both at baseline and at the end of 24 months follow-up (both: 3.1±1.5 vs. 0.8±1.3, p = 0.017). Notably, statistical analysis highlighted positive correlation between patient’s age at baseline evaluation and: age at motor onset (r = 0.59; p = 0.003); 6MWT at baseline (–0.60; p < 0.001) but not at the end of follow-up; basal NSAA (–0.65; p < 0.001) but not NSAA at the end of follow-up. Changes in 6MWT total distance also did not correlate with baseline results in our follow-up cohort (p = 0,599). Muscle strength of individual muscles was similar in all patients between baseline and the end of follow-up period, except for patient n. 3, that showed worsening of the quadriceps and biceps femoris (respectively MRC 4 and 3, compared to 5 and 4 at the previous neurological examination).
Fig. 4
Variation at 6MWT performance at the 24 months follow-up period in Subgroup A and the other patients.
Cardiac phenotype
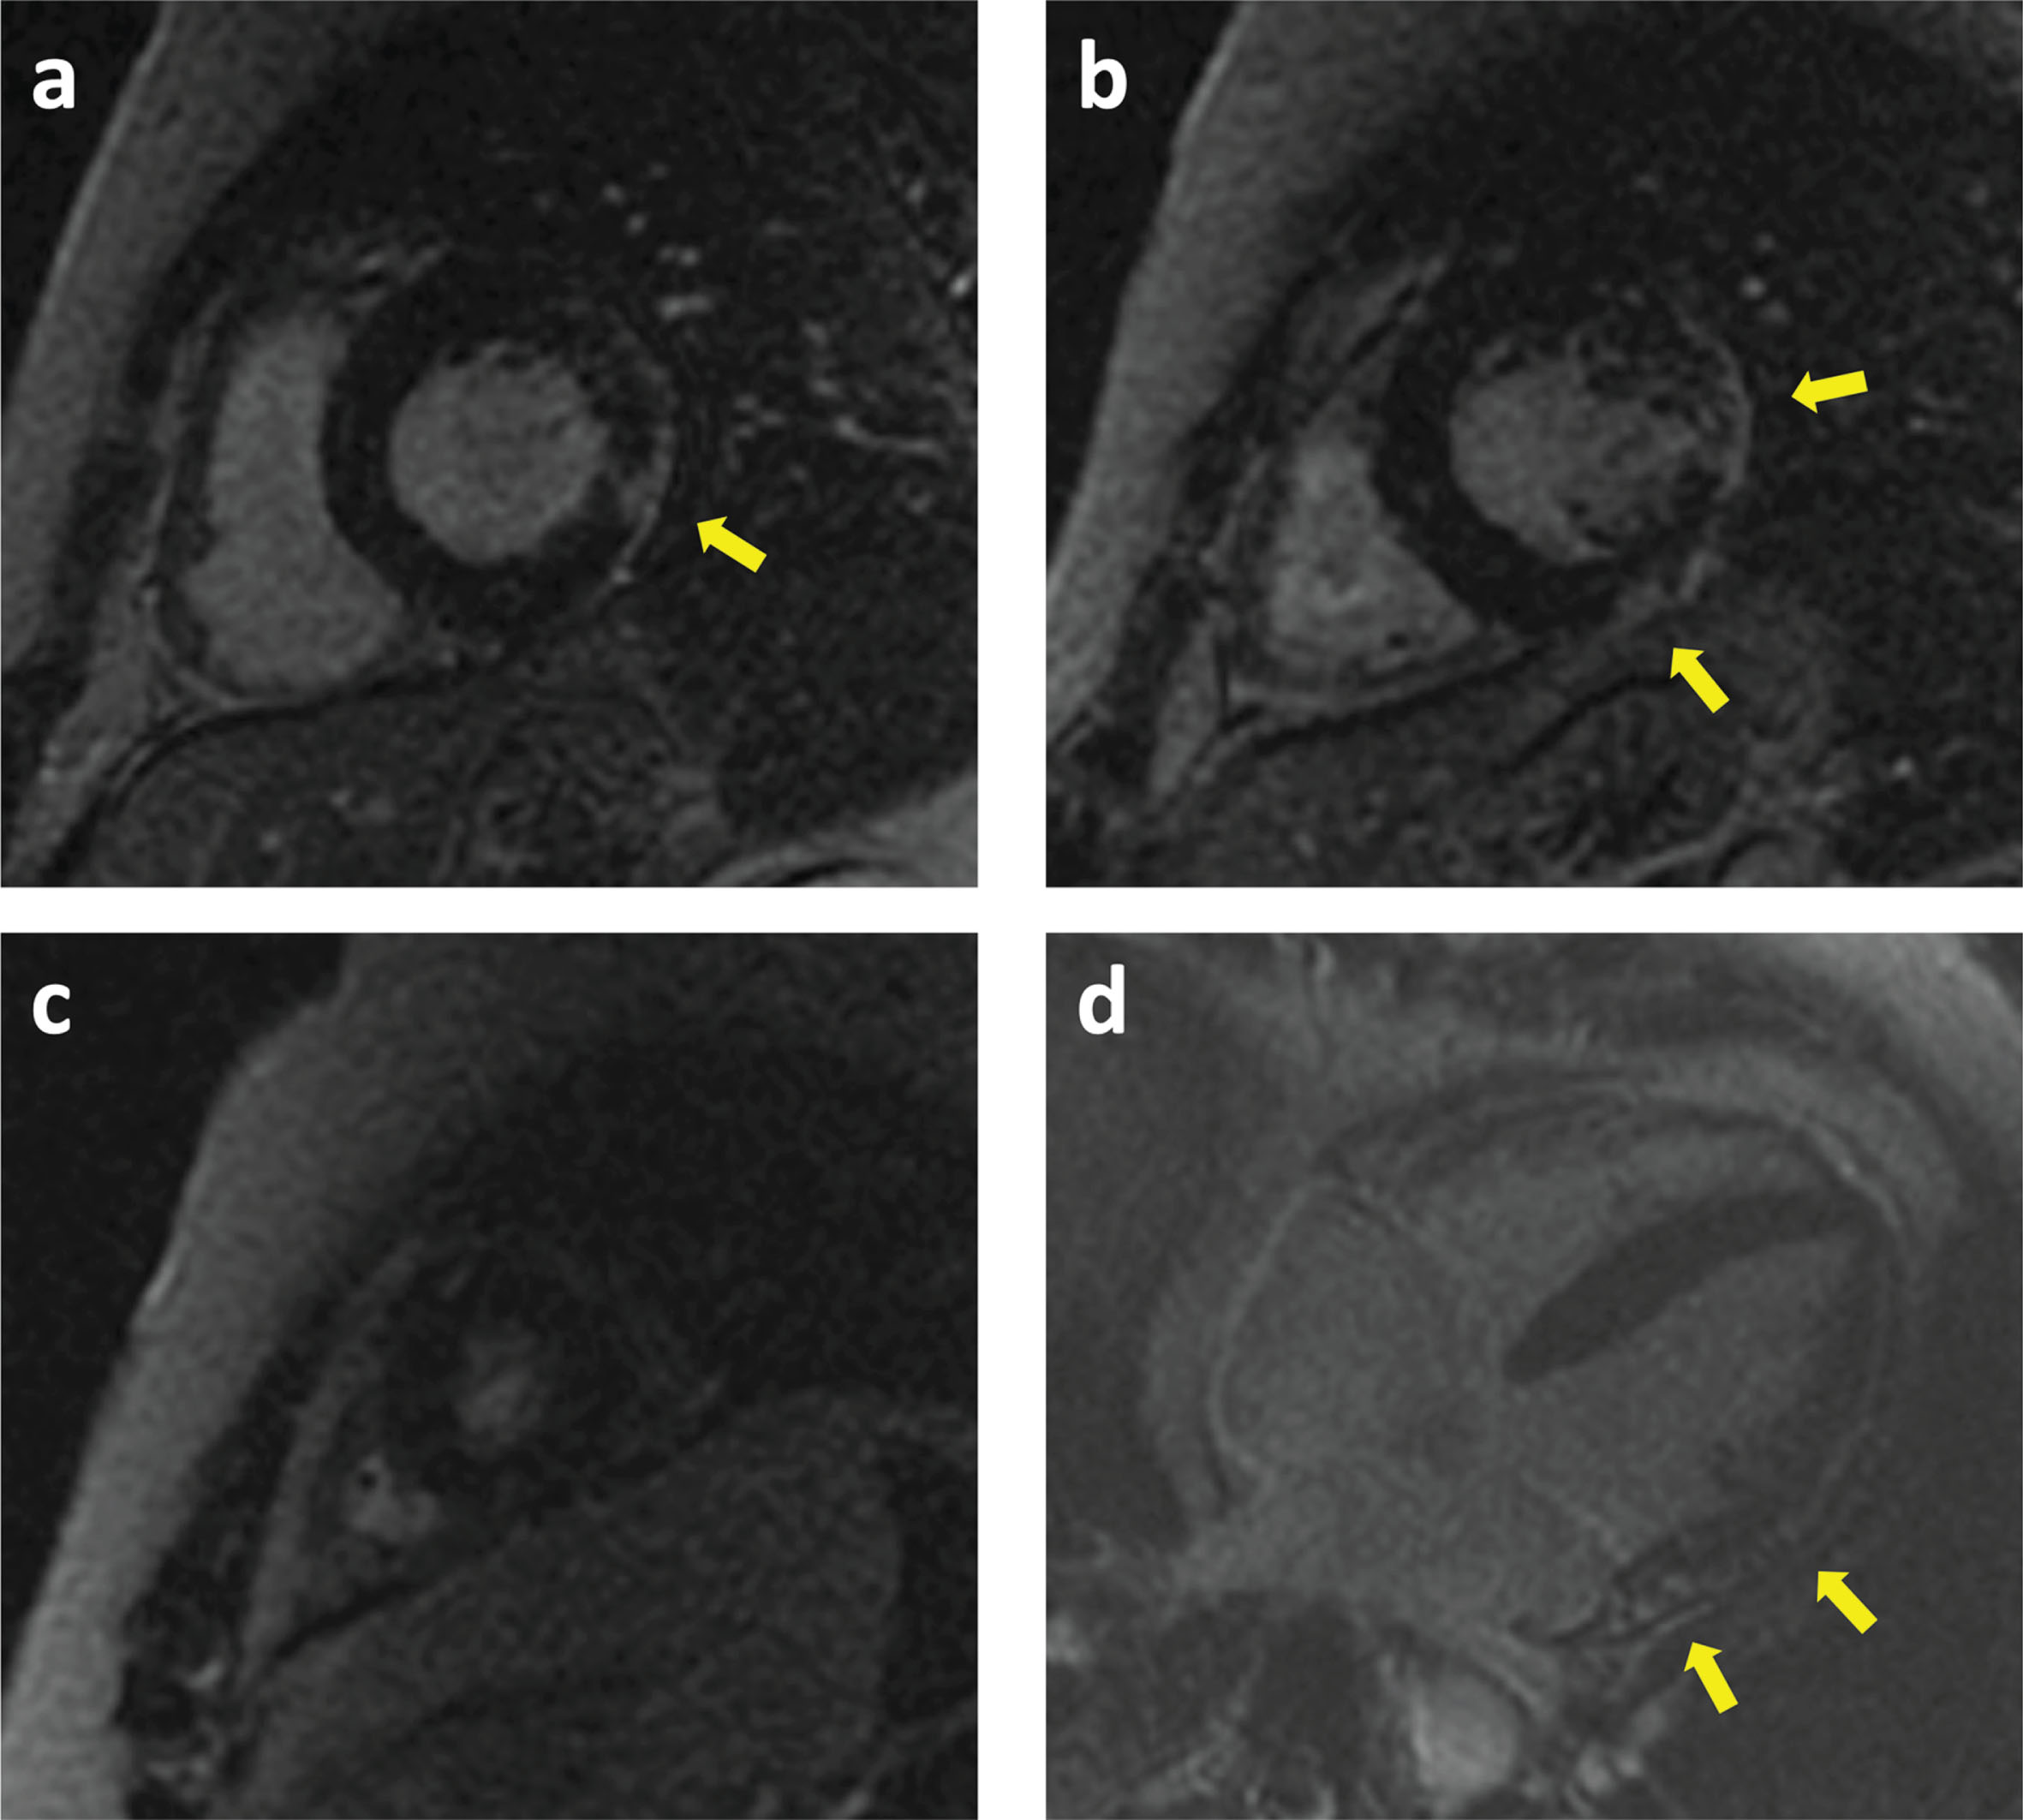
All the patients underwent baseline cardiological examination and echocardiography as part of the standard clinical practice. In a subgroup of 16 patients a cardiac MRI was performed. Two patients (P4, del48; P18, del48-49) were affected by dilated cardiomyopathy with impaired ejection fraction (EF), but showed no signs of motor impairment. Cardiac MRI showed non-ischaemic patterned gadolinium enhancement in 10 patients, with midwall distribution in 3 patients and subepicardial involvement in the other 7 subjects. The two patients with dilated cardiomyopathy showed diffuse midwall and sub-epicardial involvement; one of them had a cardioverter defibrillator implant for primary prevention. In the patient with the nonsense point mutation in exon 1 (c.12 G>A), cardiological investigations revealed an initial dilation of the left ventricle. Two-years follow-up data are available for nine patients with echocardiography, that shows a decrease in ejection fraction in three patients (P. 17, from 57% to 50%, P. 13, from 45% to 40% and patient 7, from 65% to 50%); one patient developed diastolic dysfunction (P. 4). Three patients underwent 36-months follow-up cMRI, without significant variations (P. 5, 7 and 13). Cardiac MRI of patient 13 is provided in Fig. 5.
Fig. 5
Cardiac MRI of patient 12. Basal (a), mid (b), apical (c) and four chamber (d) views showing Late Gadolinium Enhancement (LGE) in the anterolateral and inferolateral walls (arrows) with a subepicardial pattern.
Baseline muscle MRI
Among the clinically characterized 28 patients, 24 patients underwent muscle MRI at baseline; we also reported MRI results of additional three BMD patients (P27, P28 and P29, see table 2). As for previous analysis, patients were further divided into 2 subgroups according to the gene variants: the first subgroup of patients presented deletions starting with exon 45 (identified as 45-X, subgroup A) and the second subgroup of patients presented an exon 48 deletion (subgroup B). In the entire sample, the evaluation of pattern of fat distribution at baseline confirms the involvement previously reported in literature with the highest degree of fat substitution in maximus gluteus, quadriceps, hamstring, semimembranosus, and gastrocnemius muscles presenting. Ileopsoas, external obturator, abdominal recti, tibialis posterior and popliteus are preserved in almost patients. Subgroup A included 13/27 patients’ imaging (48% of the total sample), with age range 21–70 years (medium age: 38.15±16.9 and median 34); a deletion of exons 45-47 was found in 5 patients and a deletion ex 45-48 in 4 patients; 2 patients carried ex 45-51 and 2 subjects the ex 45-52 deletion. Most of the patients had fat substitution of gluteus maximus (84%), gluteus medium (61%), quadriceps except for rectus femoris (vastus lateralis, intermedius and medialis on 76%), biceps femoris, (84%), semimembranosus (76%), adductor magnus (69%), medial gastrocnemius (69%) and lateral gastrocnemius (61%). Involvement of the iliopsoas, tensor fascia lata and tibialis posterior muscles was absent. In two patients carrying a deletion of exons 45-51 (21 years old) all muscles were preserved (Fig. 6). The medium Mercuri score of the muscles analysed at baseline in this subgroup was 1,35. Subgroup B included 7/27 patients (26% of the total sample). The patient’s age range was from 19 to 56 years (medium age 34.71±11.04 years and median 34 years). Five patients carried exons 48-X deletion, while two patients the point deletion in exon 48. Most of the patients showed none or mild involvement at MRI. Nearly half (42%) of the sample showed an involvement of vastus lateralis, biceps femoris and medial gastrocnemius. Only 28% of the sample presented an involvement in the maximum gluteus, vastus intermedius, adductor magnus, semimembranosus and lateral gastrocnemius. Four out of 7 patients presented a score of 0 in all the muscles analyzed. Three of these patients carried a deletion of exons 48-51 while one subject a single deletion of exon 48. The patient with a deletion of exons 48-49 presented the worst phenotype of this group having a score of three in 3 muscles (Fig. 6). In the patient P29 with exon 1 nonsense mutation, muscle MRI study did not show pathological findings. The medium Mercuri score of the muscles at baseline in this sample was 0,21. Examples of baseline muscle MRIs are provided in Fig. 7.
Fig. 6
Baseline lower limb muscle MRI graded by Mercuri score for each muscle.
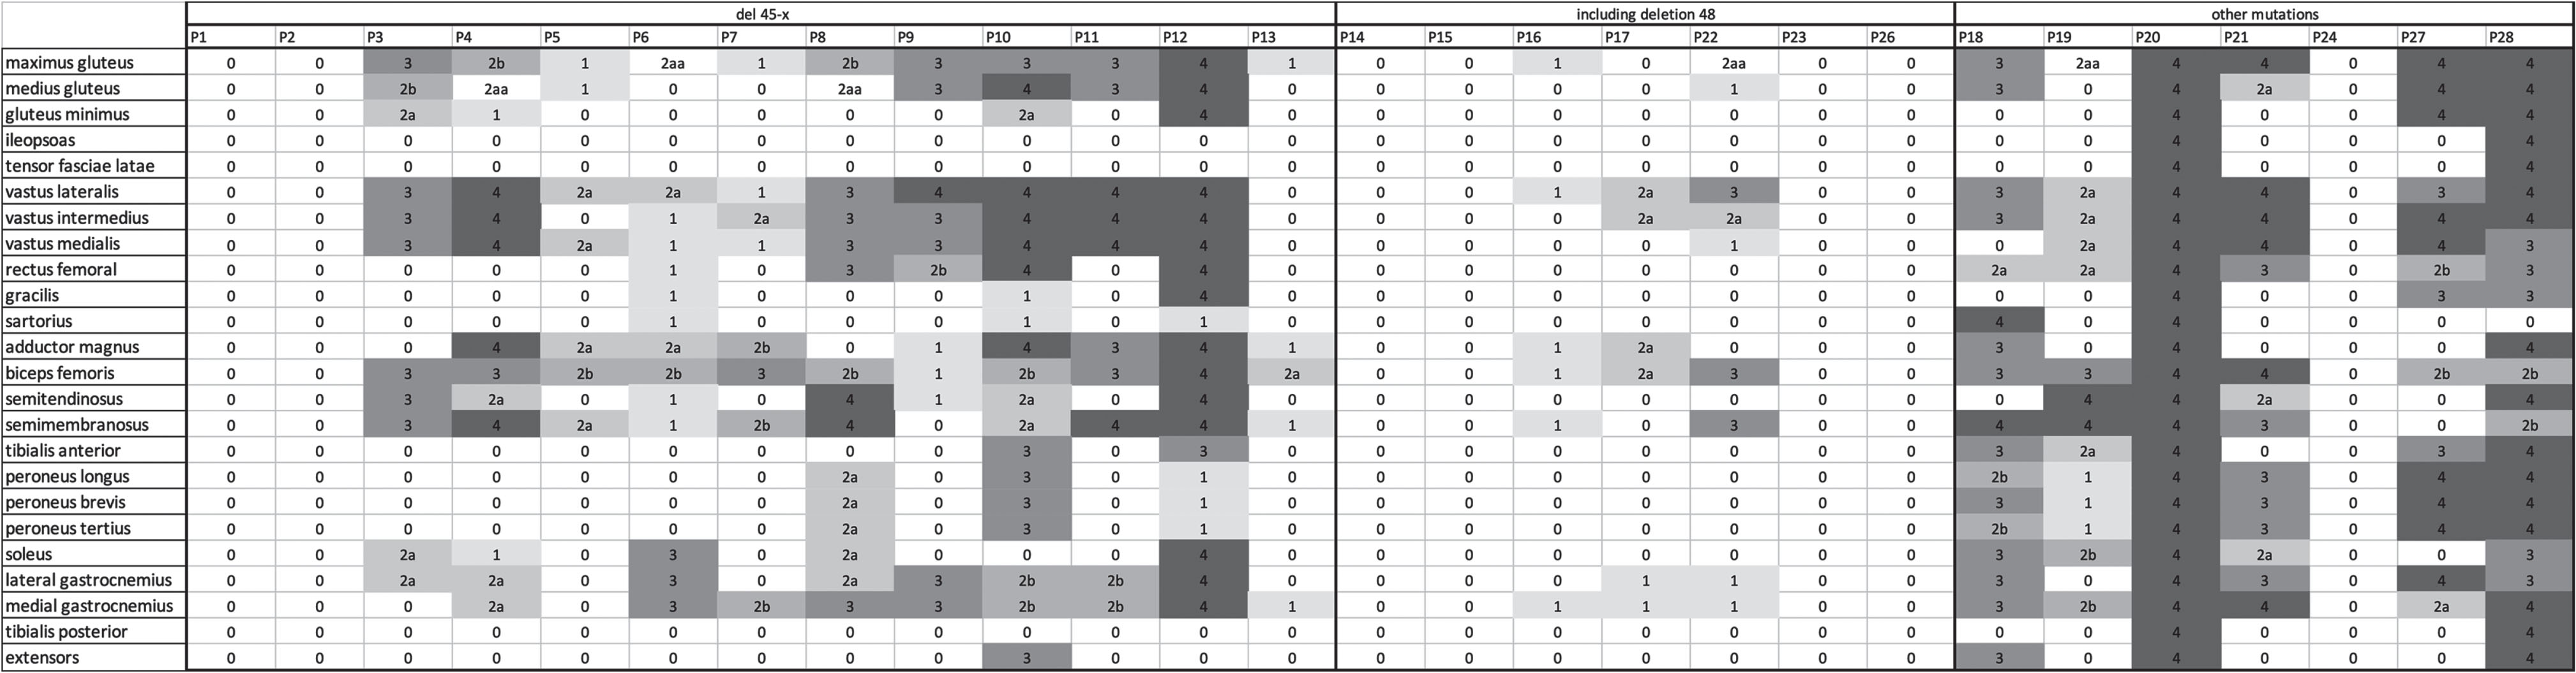
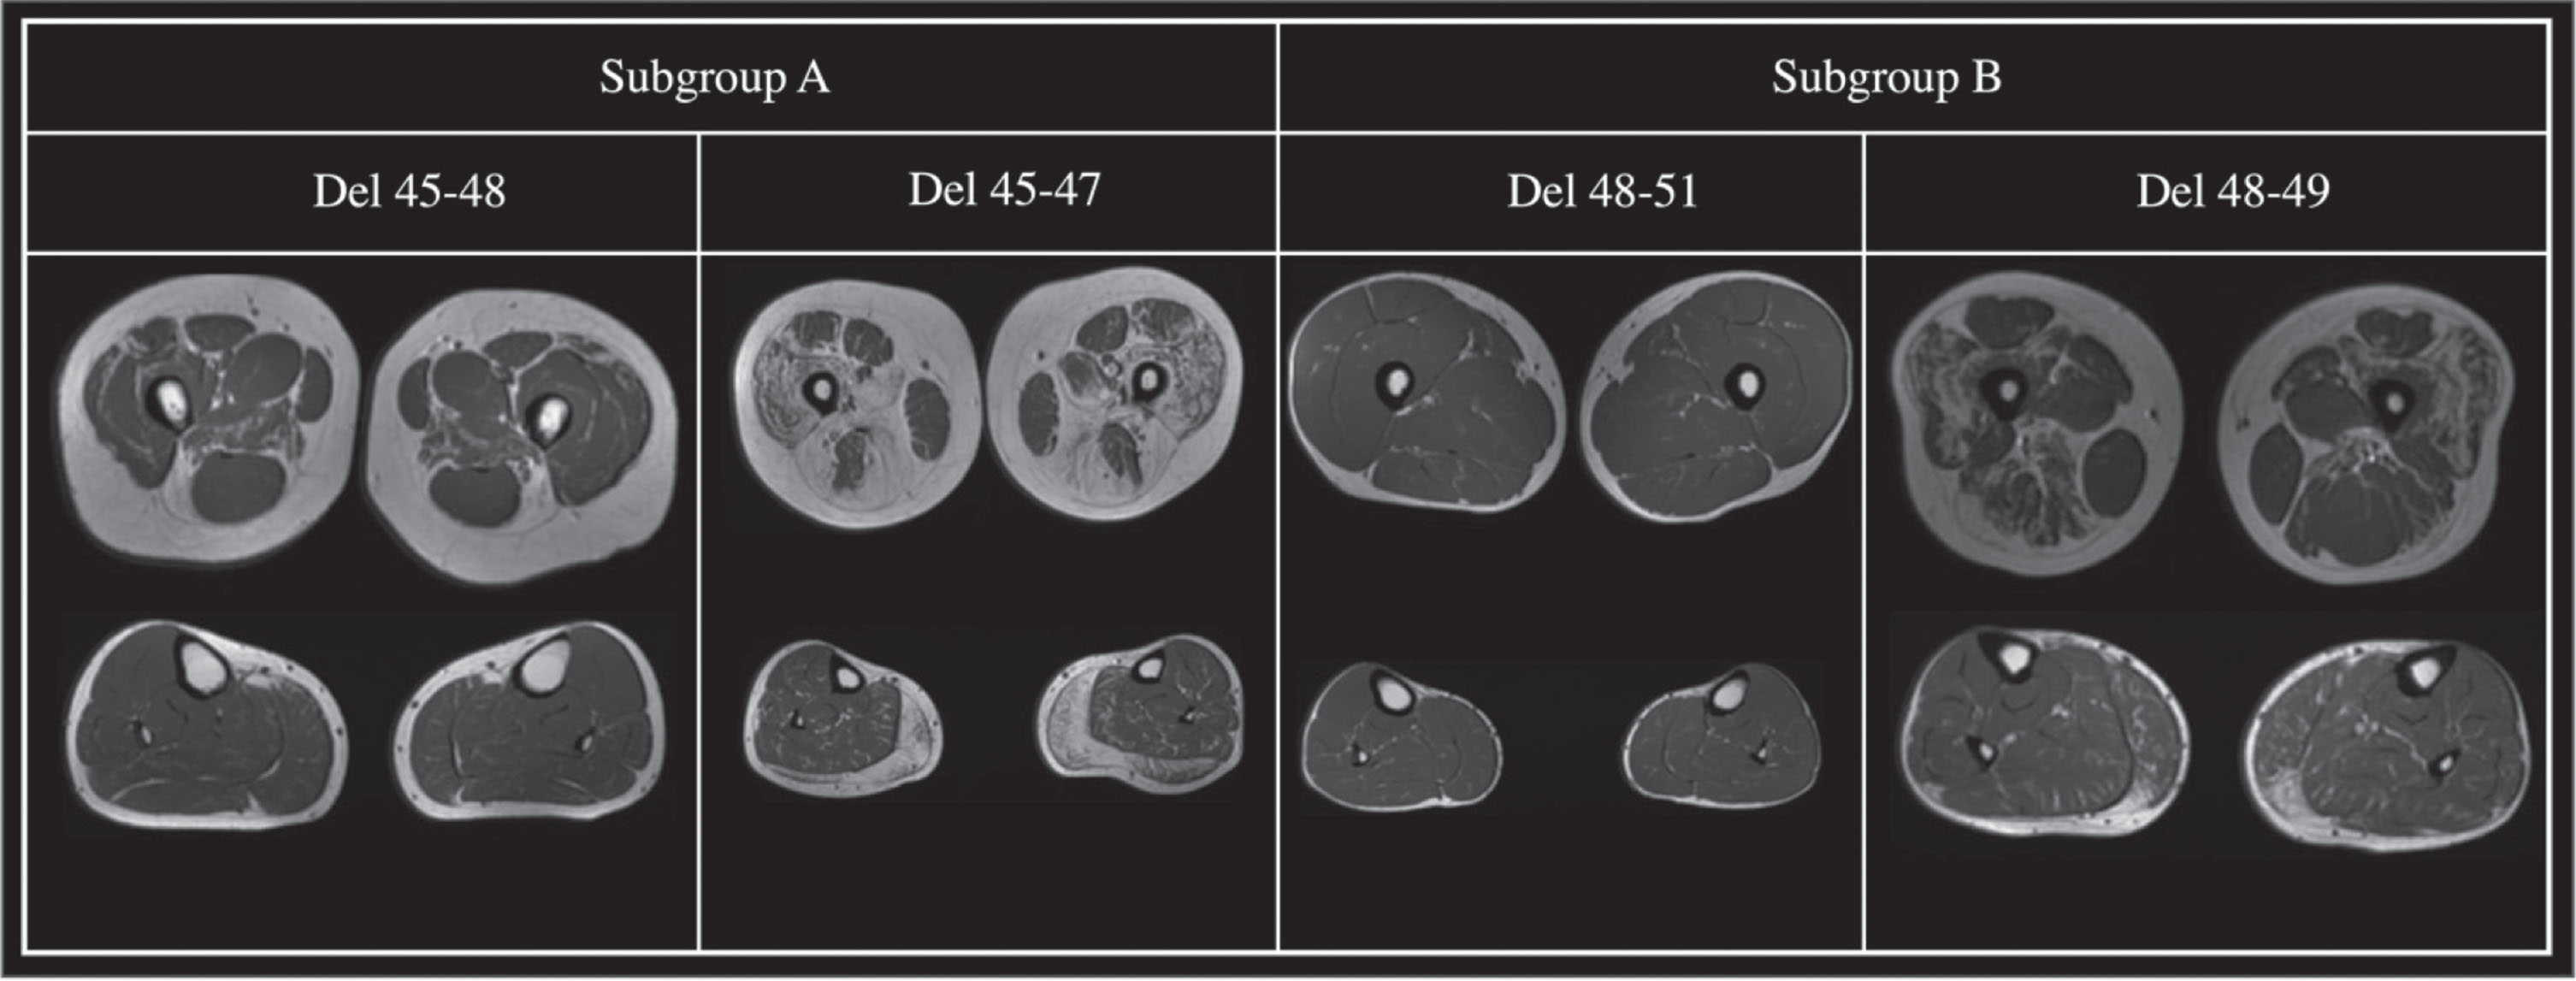
Fig. 7
The Figure shows the variable involvement patterns of the thighs and legs based on mutation type (subgroup A, del45-x; subgroup B, del48-x).
Follow-up muscle MRI
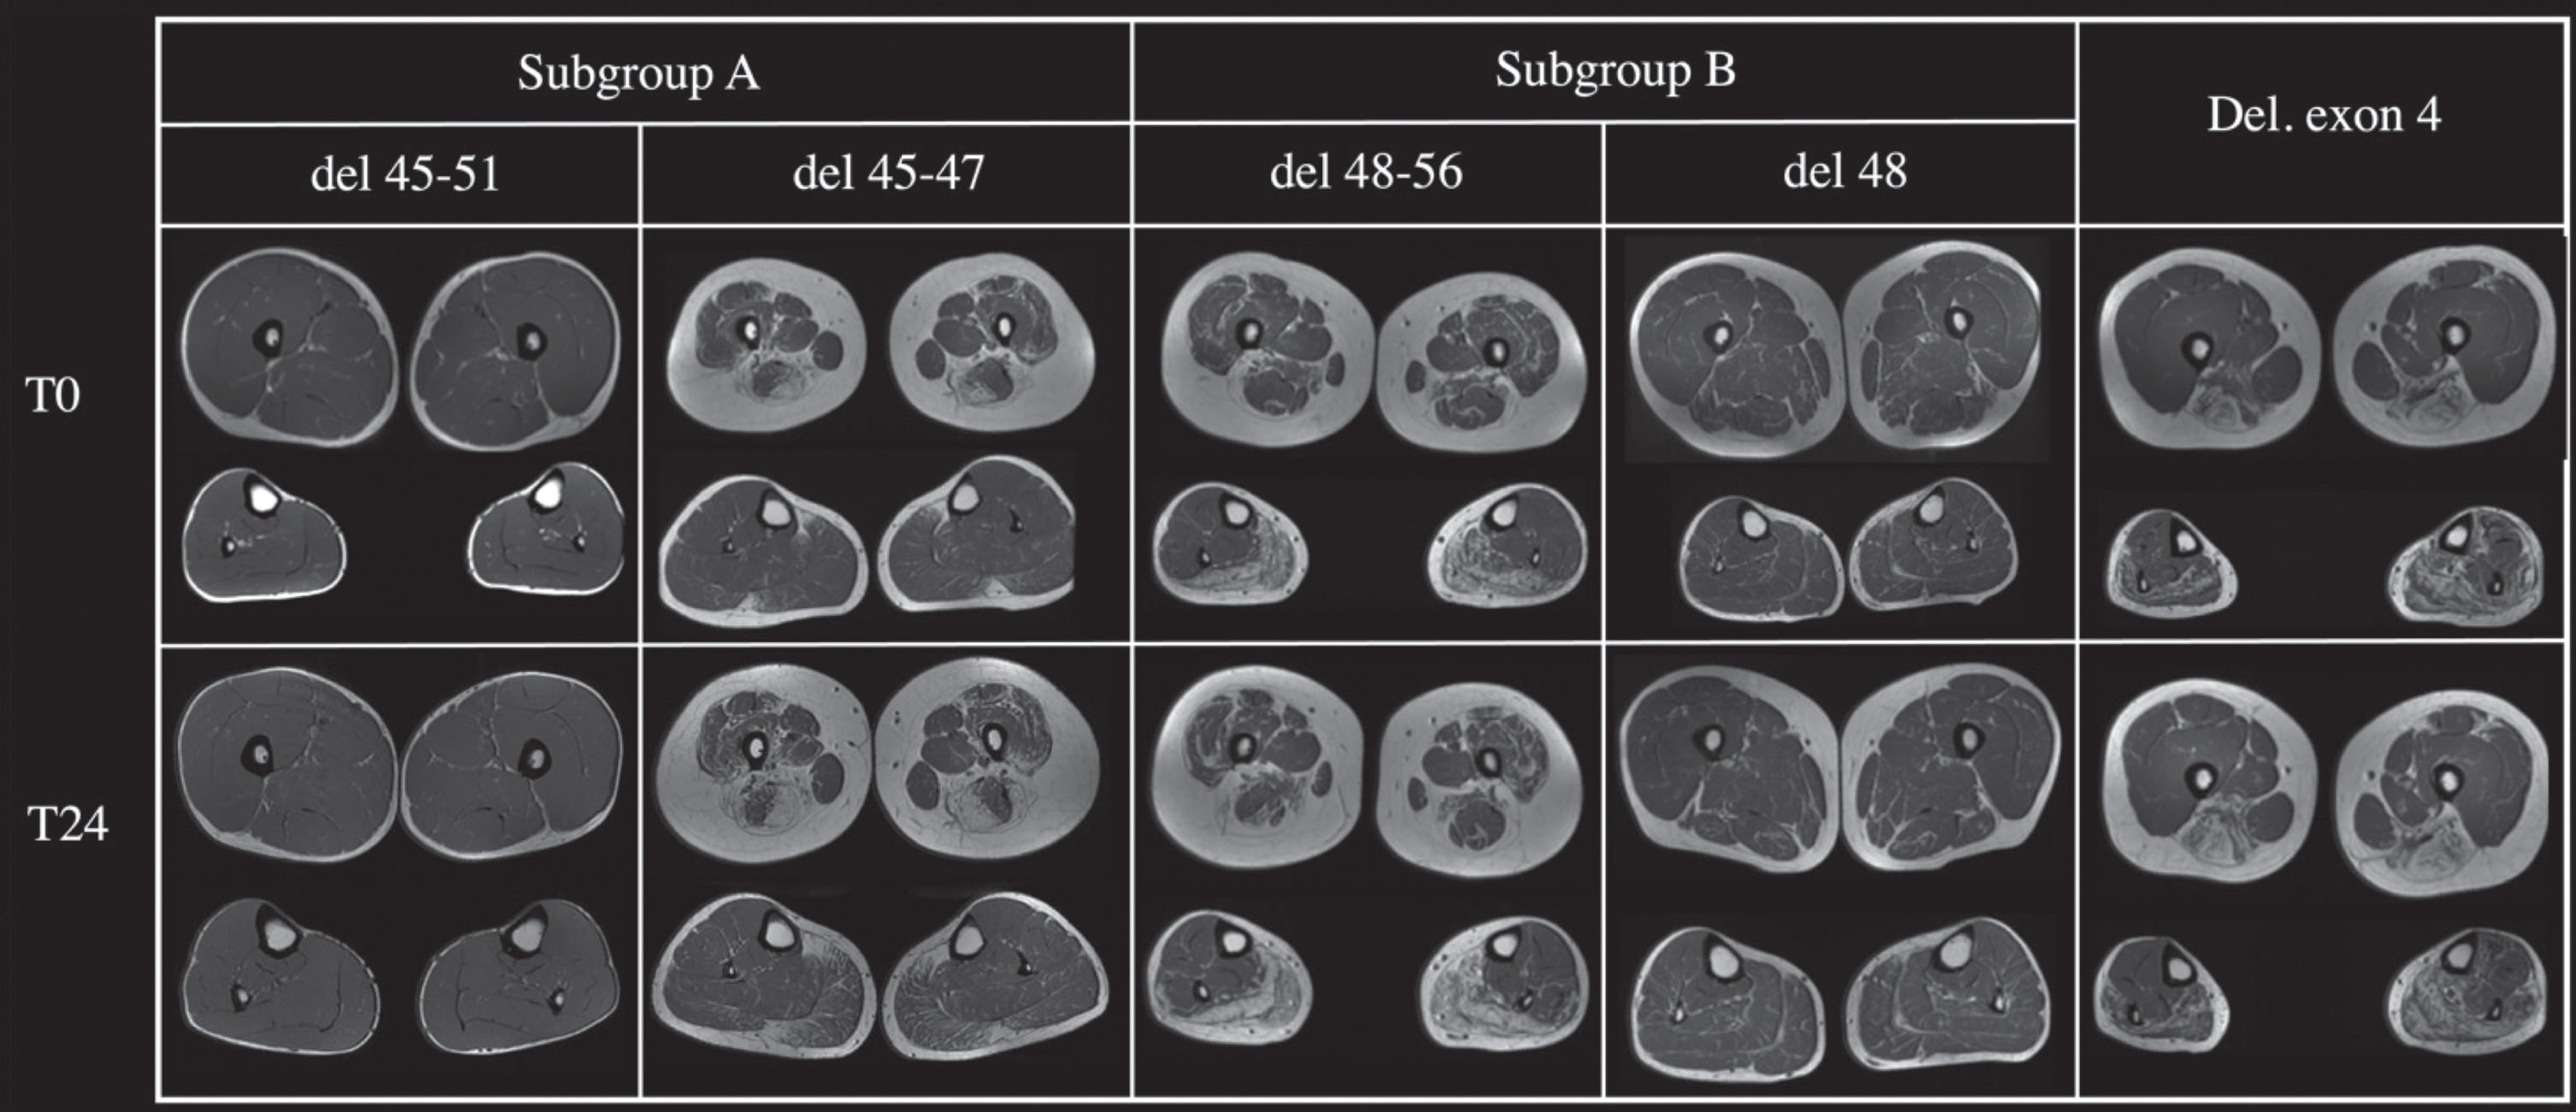
The 24-months follow-up sample was composed of 6 patients of subgroup A (del 45-x), 2 patients of subgroup B and a patient with a deletion in exon 4, for a total of 9 patients. In subgroup A, 3 patients presented a deletion 45-47, two a deletion including 45-48 and one a deletion of exon 45-51. A mean progression of 1 point on the Mercuri scale, both proximal and distal, was observed. Two patients carrying a 45-51del and 48del, did not worsen at all (Fig. 8). One patient with a 45-48del, 25 years old, showed the most important increase of progression in the sample, having an increase of 2 points in the Mercuri Score in vastus lateralis and hamstrings (Fig. 8). The patient with a deletion of exon 4 showed an increase of 1 point in the Mercuri Score mostly in the lower leg muscles comparing to the thigh and the pelvis. In subgroup A 4 out of 6 patients showed an increase of two points in most muscles except for the rectus femoris and soleus. In subgroup two one patient, carrying a deletion 48-56, showed a two-points increase in the Mercuri Score from baseline to follow-up, while the other remained stable overtime. In subgroup A the disease progression was evident in most of the muscles except for the rectus femoris and soleus, while in subgroup B the muscles that showed a major deterioration were rectus femoris and soleus. A six-year follow-up was performed in one patient (aged 28, del45-47). A progression of two points was found in the following muscles: gluteus maximus, vastus lateralis, intermedius and medialis, rectus femoral, lateral and medial gastrocnemius and soleus, while a minor progression was shown in gluteus minimus, tensor fasciae latae, sartorius, pectineus, gracilis, adductor magnus, hamstring, peroneus muscles and tibialis anterior. Examples of follow-up MRIs from the considered subgroups are shown in Fig. 9.
Fig. 8
Muscle MRI data: for each muscle delta of Mercuri score from baseline to follow-up is provided.
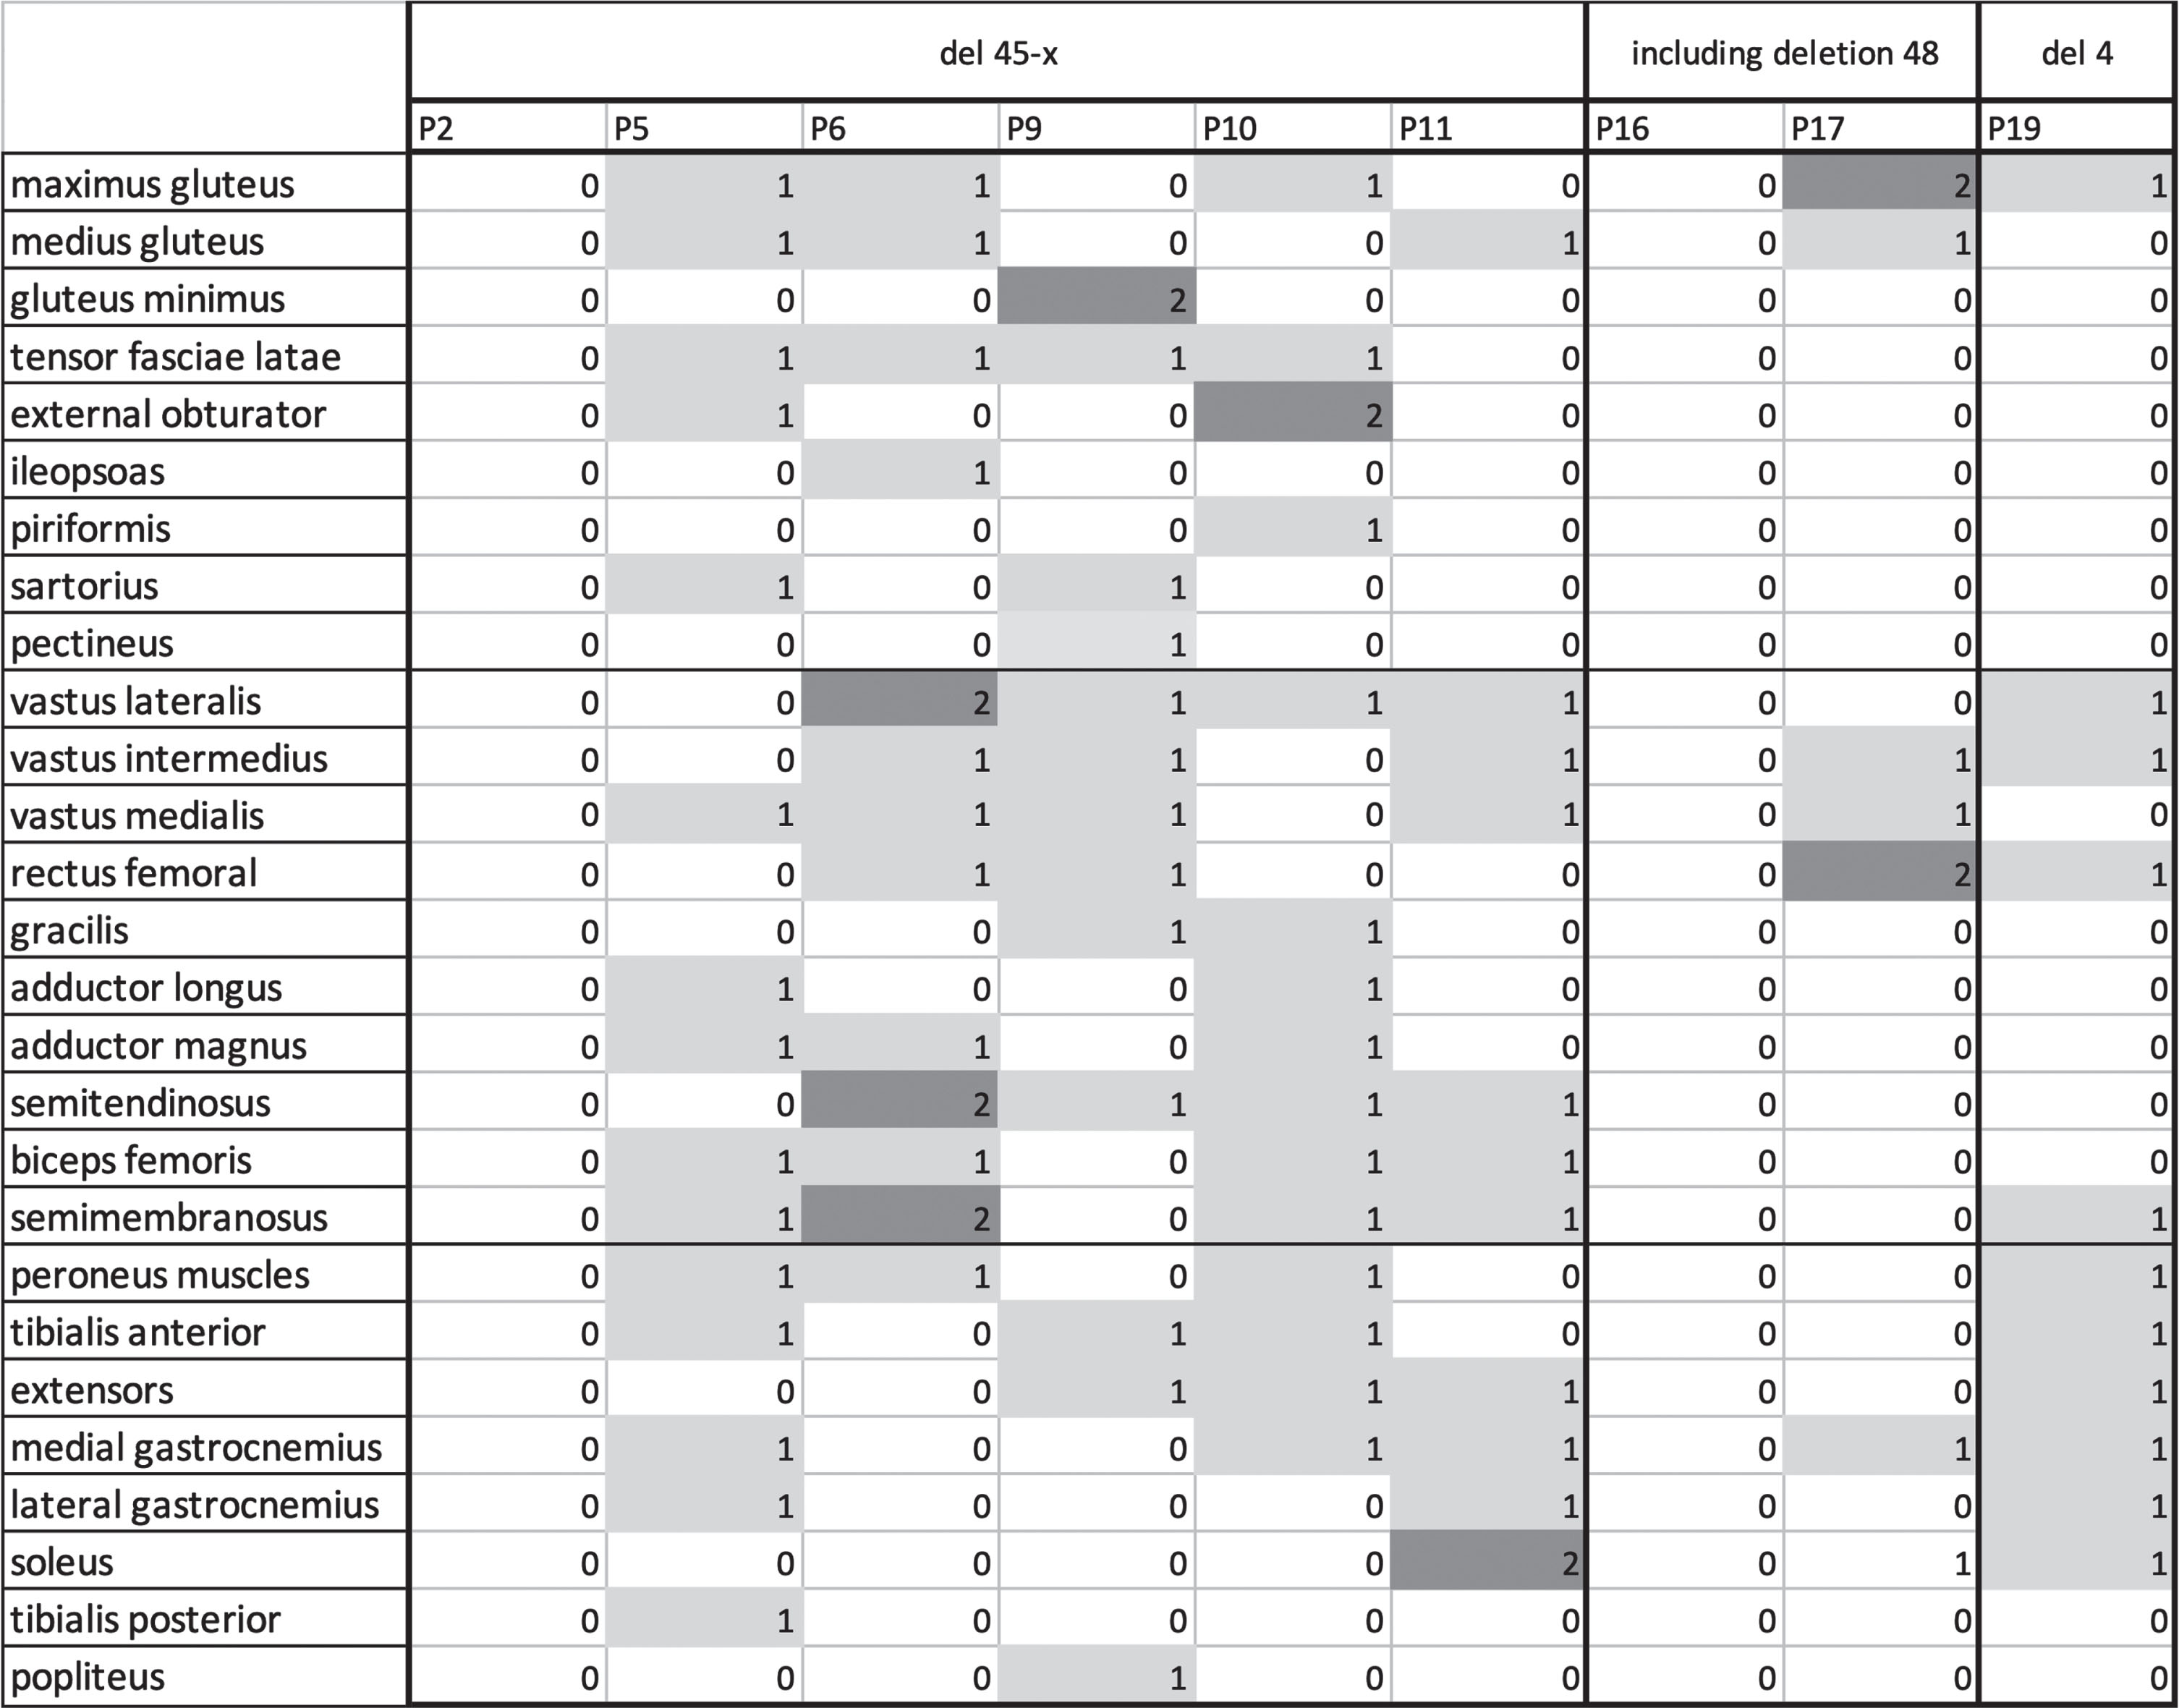
Fig. 9
The Figure shows muscle thighs and legs MRI at baseline (T0) and after two years follow up (T24) of five patients with different mutations.
Overall, we found statistically significant correlation between baseline quadriceps Mercuri score at muscle MRI and both time from motor symptoms onset and baseline 6MWT (p < 0,001). The patient with 6-years follow-up lost 15 meters at 6MWT (575 vs 560 mt) while the NSAA did not deteriorate (34/34). The patient with deletion of exon 4 showed a decrease in 6MWT from 288 to 250 mt. All patients from subgroup A showed a reduction in 6MWT (545,5±84,5 vs 457,5±76,4). In subgroup B, one patient did not deteriorate at 6MWT (474 vs 471 mt) and the other one lost 71 mt (711 vs 640 mt).
DISCUSSION
Although representing the milder form of dystrophinopathy, BMD carries a potentially elevated burden on patients’ motor capabilities, heart involvement and overall degree of disability. A considerable amount of clinical variability is known in this disease, ranging from asymptomatic hyperCKemia to severe muscular impairment along with cardiomyopathy – the so called intermediate DMD-BMD phenotypes. Previuos genotype-phenotype correlations had documented the weight of DMD gene mutations in predicting the disease’s clinical expression, as patients sharing the same genetic defect tend to show quite homogeneous involvement; nevertheless, clinical variability can be found also in carriers of identical mutations and within families [16, 17]. With a growing number of therapeutic intervention possibilities and clinical trials targeting both mutation-specific mechanisms and not, may they be pharmacologic or of other nature, detailed clinical characterization and profound understanding of the mechanisms underlying genotype-phenotype correlations is mandatory, to optimize the choice of suitable outcome measures, ameliorate prognosis estimation and progress in the path of personalized medicine. To data, studies of BMD natural history are few, often involving a small number of patients with no long term follow up. The variability of clinical picture raises the need of stratification of patients to search potential prognostic factors and identify the more informative outcome measures. Our analysis offers further evidences about medium-long term follow up data in adult BMD subjects. In this study, for both clinical and muscle MRI evaluation, we subdivided our cohort between a first subgroup of patients carrying a 45-X deletion – generally associated with a more classic BMD phenotype – and a second one including patients with a 48-X deletion, according to previously reported data [7]. Globally considered, our cohort presents a clinical heterogeneity, but a moderate- severe involvement with faster progression is more common in patients with 45-X del, accordingly to previous one-year longitudinal follow-up study by Bello et al [7]. The progressive course of motor impairment agrees with the observation that a greater time from motor symptoms onset is linked to a reduction in 6MWT at baseline. A slight but significant disease progression at the 2 years follow-up is evident in the 45-Xdel subgroup in each scale (6MWT, NSAA and W&G), while it is not present when patients are considered overall. Moreover, changes in 6MWT performances are apparently not correlated with baseline results, suggesting variability in disease progression with disregard to initial conditions. Stability of the MRC testing, even of the most compromised muscles, in our follow-up group indicates that this may not be a sufficiently sensitive measure to consider in BMD also in the medium-long period. Interestingly, the statistical analysis highlights the role of age on motor function in NSAA, regardless the disease duration, which was true also for 6MWT values, suggesting that in the modeling of clinical trials these variables should be considered differently. Cardiomyopathy is documented by cMRI abnormalities in 10 out of 16 patients – carriers of different mutations as 45-Xdel, 48-Xdel, 3-4del and others – with variable extent and different correlation with motor impairment, thus demonstrating heterogeneity also in the myocardial involvement – adding another source of clinical variability [14]. Muscle MRI of the lower limbs confirms the clinical data: baseline MRIs show a greater involvement in patients carrying a 45-Xdel compared to 48-Xdel, although remarkable exceptions are present, as two siblings carrying a 45-51del with no involvement and a 48-49del patient with a moderate- severe fatty tissue infiltration level. In particular, gluteus maximus, vastus intermedius, adductor magnus, semimembranosus and lateral gastrocnemius are less severely affected in the 48-Xdel subgroup, although patients with normal or only slightly altered MRIs are present in both subgroups. Considering the clinical-radiological correlation findings, muscle MRI data corroborates the 6MWT results, as expected, thus proving as a sound functional – and not only morphological – parameter to evaluate when estimating disease progression andprognosis. Nonetheless, the radiological follow-up shows that the progression of muscle involvement is very slow, both in the proximal and distal segments, as the patient with a six-years follow-up clearly demonstrates with a mild increase in the Mercuri Score, albeit with the limitation of qualitative acquisitions only. Alongside, although with the limitation of a small sample, it is still possible to note variability both in fatty infiltration distribution among muscles and rate of progression. Such differences appear to be moderately correlated with the mutation in our sample, as in each subgroup both patients with normal, stable MRIs and subjects with considerable progression were found. Interestingly, the patient carrying an exon 4 del presented a greater involvement of the distal muscles and displays mild involvement with clinical onset around 30 years, while deletions of exon 4 are known to be associated with severe, DMD phenotypes [18].
In conclusion, the clinical variability of patients with BMD makes it difficult to describe a uniform course. Identifying a sensitive biomarker for slight changes in slowly progressive diseases such as BMD is of main importance. Our data confirm an overall slow BMD progression, both at neurological evaluations with motor scales and qualitative muscle MRI, in a follow-up period of 24 months. The combination with muscle quantitative MRI (qMRI) techniques in disease monitoring and follow up could provide a further sensitive description of tissue alterations, detecting early signs of muscle involvement before the appearance of fatty infiltration [19, 20]. The cardiac involvement can be another prognostic parameter to be characterized and strictly correlated with other clinical biomarkers. The stratification of patients based on phenotypic features in association with the identification of ad hoc outcome measures are crucial in designing clinical trials towards trial readiness.
ACKNOWLEDGMENTS
We are indebted to all patients for participating in this study. The study has been supported by patients’ association Parent Project Italy. We also thank the patients’ association Unione Italiana Lotta alla Distrofia Muscolare (UILDM). Three of the authors of this publication (Giulia Ricci, Francesca Torri, Gabriele Siciliano) are members of the European Reference Network for Neuromuscular Diseases.
CONFLICT OF INTEREST
The authors have no conflict of interest to report.
REFERENCES
[1] | Angelini C , et al. Clinical-molecular correlation in 104 mild X- linked muscular dystrophy patients: Characterization of sub-clinical phenotypes. Neuromuscul. Disord. (1994) ;4: :349–58. |
[2] | Hoffman EP , et al. Improved diagnosis of Becker muscular dystrophy by dystrophin testing. Neurology. (1989) ;39: :1011–7. |
[3] | Faridian-Aragh N , Wagner KR , Leung DG , Carrino JA . Magnetic resonance imaging phenotyping of Becker muscular dystrophy. Muscle Nerve. (2014) ;50: (6):962–7. doi: 10.1002/mus.24246. Epub 2014 Oct 30. |
[4] | Sheikh AM , Rudolf K , Witting N , Vissing J . Quantitative Muscle MRI as Outcome Measure in Patients With Becker Muscular Dystrophy-A 1-Year Follow-Up Study. Front Neurol. (2021) ;11: :613489. |
[5] | Kamdar F , Garry DJ . Dystrophin-Deficient Cardiomyopathy. Journal of the American College of Cardiology. (2016) ;67: (21):2533–46. https://doi.org/10.1016/j.jacc.2016.02.081 |
[6] | Angelini C , Marozzo R , Pegoraro V . Current and emerging therapies in Becker muscular dystrophy (BMD). Acta Myol. (2019) ;38: (3):172–9. PMID: 31788661; PMCID: PMC6859412. |
[7] | Bello L , Campadello P , Barp A , Fanin M , Semplicini C , Soraruù G , Caumo L , Calore C , Angelini C , Pegoraro E . Functional changes in Becker muscular dystrophy: implications for clinical trials in dystrophinopathies. Sci Rep. (2016) ;6: :32439. doi: 10.1038/srep32439. |
[8] | Anthony K , Cirak S , Torelli S , Tasca G , Feng L , Arechavala-Gomeza V , Armaroli A , Guglieri M , Straathof CS , Verschuuren JJ , Aartsma-Rus A , Helderman-van den Enden P , Bushby K , Straub V , Sewry C , Ferlini A , Ricci E , Morgan JE , Muntoni F . Dystrophin quantification and clinical correlations in Becker muscular dystrophy: implications for clinical trials. Brain. (2011) ;134: (Pt 12):3547–59. doi: 10.1093/brain/awr291. Epub 2011 Nov 18. Erratum in: Brain. 2016;139(Pt 4):e27. PMID: 22102647; PMCID: PMC3235564. |
[9] | L , Carlesi A , Bonetti AM , Zucchini E , De Sanctis R , Scutifero M , Bianco F , Rossi F , Motta MC , Sacco A , Donati MA , Mongini T , Pini A , Battini R , Pegoraro E , Pane M , Pasquini E , Bruno C , Vita G , de Waure C , Bertini E , Mercuri E . North Star Ambulatory Assessment, 6-minute walk test and timed items in ambulant boys with Duchenne muscular dystrophy. Neuromuscul Disord. (2010) ;20: (11):712–6. https://doi: 10.1016/j.nmd.2010.06.014 |
[10] | McDonald CM , Henricson EK , Abresch RT , Florence J , Eagle M , Gappmaier E , Glanzman AM , PTC124-GD-007-DMD Study Group, Spiegel R , Barth J , Elfring G , Reha A , Peltz SW . The 6-minute walk test and other clinical endpoints in duchenne muscular dystrophy: reliability, concurrent validity, and minimal clinically important differences from a multicenter study. Muscle & Nerve. (2013) ;48: (3):357–68. https://doi.org/10.1002/mus.23905 |
[11] | Maggi L , Moscatelli M , Frangiamore R , Mazzi F , Verri M , De Luca A , Pasanisi MB , Baranello G , Tramacere I , Chiapparini L , Bruzzone MG , Mantegazza R , Aquino D . Quantitative Muscle MRI Protocol as Possible Biomarker in Becker Muscular Dystrophy. Clinical Neuroradiology. (2021) ;31: (1):257–66. https://doi.org/10.1007/s00062-019-00875-0 |
[12] | Nienke M van de Velde, Melissa T Hooijmans, Aashley SD Sardjoe Mishre, Kevin R Keene, Zaïda Koeks, Thom TJ Veeger, Iris Alleman, Erik W van Zwet, Jan-Willem M Beenakker, Jan JGM Verschuuren, Hermien E Kan, Erik H Niks. Neurology. 2021;97(5):e513-e522; DOI: 10.1212/WNL.0000000000012233 |
[13] | James MK , Alfano LN , Muni-Lofra R , Reash NF , Sodhi J , Iammarino MA , Moat D , Shannon K , McCallum M , Richardson M , Eagle M , Straub V , Marini-Bettolo C , Lowes LP , Mayhew AG . Validation of the North Star Assessment for Limb-Girdle Type Muscular Dystrophies. Physical Therapy. (2022) ;102: (10):pzac113. https://doi.org/10.1093/ptj/pzac113 |
[14] | Johnston TP , Cripe LH , Mah ML , Moore-Clingenpeel M , Young C , Flanigan KM , Mendell J , Hor KN . Young Becker Muscular Dystrophy Patients Demonstrate Fibrosis Associated With Abnormal Left Ventricular Ejection Fraction on Cardiac Magnetic Resonance Imaging. Circulation. Cardiovascular Imaging. (2019) ;12: (7):e008919. https://doi.org/10.1161/CIRCIMAGING.119.008919 |
[15] | Hoffman EP . Causes of clinical variability in Duchenne and Becker muscular dystrophies and implications for exon skipping therapies. Acta Myol. (2020) ;39: (4):179–86. doi: 10.36185/2532-1900-020. PMID: 33458572; PMCID: PMC7783439. |
[16] | Deburgrave N , Daoud F , Llense S , Barbot JC , Récan D , Peccate C , Burghes AH , Béroud C , Garcia L , Kaplan JC , Chelly J , Leturcq F . Protein- and mRNA-based phenotype-genotype correlations in DMD/BMD with point mutations and molecular basis for BMD with nonsense and frameshift mutations in the DMD gene. Human Mutation. (2007) ;28: (2):183–95. https://doi.org/10.1002/humu.20422 |
[17] | Juan-Mateu J , González-Quereda L , Rodríguez MJ , Verdura E , Lázaro K , Jou C , Nascimento A , Jiménez-Mallebrera C , Colomer J , Monges S , Lubieniecki F , Foncuberta ME , Pascual-Pascual SI , Molano J , Baiget M , Gallano P . Interplay between DMD point mutations and splicing signals in Dystrophinopathy phenotypes. PloS One. (2013) ;8: (3):e59916. https://doi.org/10.1371/journal.pone.0059916 |
[18] | Torella A , Zanobio M , Zeuli R , Del Vecchio Blanco F , Savarese M , Giugliano T , Garofalo A , Piluso G , Politano L , Nigro V . The position of nonsense mutations can predict the phenotype severity: A survey on the DMD gene. PloS One. (2020) ;15: (8):e0237803. https://doi.org/10.1371/journal.pone.0237803 |
[19] | Wren TAL , Bluml S , Tseng-Ong L , Gilsanz V . Three-point technique of fat quantification of muscle tissue as a marker of disease progression in Duchenne muscular dystrophy: preliminary study. AJR Am J Roentgenol. (2008) ;190: :W8–12. |
[20] | Gaeta M , Scribano E , Mileto A , Mazziotti S , Rodolico C , Toscano A , Settineri N , Ascenti G , Blandino A . Muscle fat fraction in neuromuscular disorders: dual-echo dual-flip-angle spoiled gradient recalled MR imaging technique for quantification—a feasibility study. Radiology. (2011) ;259: :487–94. |


