
Disease Burden of Spinal Muscular Atrophy: A Comparative Cohort Study Using Insurance Claims Data in the USA
Abstract
Background:
Spinal muscular atrophy (SMA) is a neuromuscular disease caused by homozygous deletion or loss-of-function mutations of the survival of motor neuron 1 (SMN1) gene, resulting in reduced levels of SMN protein throughout the body. Patients with SMA may have multiple tissue defects, which could present prior to neuromuscular symptoms.
Objective:
To assess the signs, comorbidities and potential extraneural manifestations associated with SMA in treatment-naïve patients.
Methods:
This observational, retrospective and matched-cohort study used secondary insurance claims data from the US IBM® MarketScan® Commercial, Medicaid and Medicare Supplemental databases between 01/01/2000 and 12/31/2013. Treatment-naïve individuals aged≤65 years with≥2 International Classification of Diseases, Ninth Revision (ICD-9) SMA codes were stratified into four groups (A–D), according to age at index (date of first SMA code recorded) and type of ICD-9 code used, and matched with non-SMA controls. The occurrence of ICD-9 codes, which were converted to various classifications (phecodes and system classes), were compared between groups in pre- and post-index periods.
Results:
A total of 1,457 individuals with SMA were included and matched to 13,362 controls. Increasing numbers of SMA-associated phecodes and system classes were generally observed from pre- to post-index across all groups. The strongest associations were observed in the post-index period for the youngest age groups. Endocrine/metabolic disorders were associated with SMA in almost all groups and across time periods.
Conclusions:
This exploratory study confirmed the considerable disease burden in patients with SMA and identified 305 unique phecodes associated with SMA, providing a rationale for further research into the natural history and progression of SMA, including extraneural manifestations of the disease.
INTRODUCTION
Spinal muscular atrophy (SMA) is a genetic neuromuscular disorder characterized by progressive motor neuron degeneration, leading to skeletal muscle weakness and atrophy [1, 2]. It is an autosomal recessive disorder caused by loss-of-function mutations in both alleles of the survival of motor neuron 1 (SMN1) gene, with subsequent loss of SMN protein expression [3]. SMN2, a paralog of SMN1, also produces SMN protein, but only approximately 5% is functional due to a point mutation [4–8]. Accordingly, the low levels of functional SMN protein produced by SMN2 are insufficient to fully compensate for the loss of SMN1, giving rise to SMA pathology [5]. SMA has a heterogeneous clinical phenotype, ranging from severe to mild. It is typically classified into five types (0–4), based on age of onset and severity of disease [9, 10]. Type 0 SMA is a very severe form with a prenatal onset, characterized by absence of any motor function [10, 11]. Type 1 SMA is also characterized by the absence of motor function (though patients can sit upright with support) and an age of onset of 0–6 months [9]. Patients with Type 2 SMA have an age of onset typically between 6 and 18 months of age, and are able to sit independently but never walk independently [9]. Type 3 SMA is characterized by an age of onset of > 18 months, with patients able to stand and walk [9]. Finally, Type 4 SMA normally manifests in adulthood (in the second or third decade of life), with patients able to walk during adulthood [9].
To date, three disease-modifying therapies have been approved for the treatment of SMA in the USA and EU, all of which aim to increase levels of functional SMN protein: nusinersen (SPINRAZA®, Biogen [12, 13]), an SMN2-targeting antisense oligonucleotide delivered intrathecally; onasemnogene abeparvovec (ZOLGENSMA®, AveXis [14, 15]), a gene therapy designed to deliver a functional copy of the SMN1 gene via intravenous administration; and risdiplam (EVRYSDI®, Genentech, Inc [16, 17]), an SMN2 pre-mRNA splicing modifier that is taken orally and is systemically distributed.
While SMN protein plays a critical role in the maintenance and function of motor neurons, it is ubiquitously expressed throughout the body, and research has demonstrated that in animal models SMN has a broader function across cell types and tissues [18]. SMA may therefore, potentially, be considered a multisystemic disease, though the role of reduced levels of SMN protein throughout the body in disease pathophysiology is not clear [19]. Although the clinical manifestations are not always apparent, particularly in milder cases, clinical case reports have highlighted that tissues beyond the central nervous system may be involved in the overall phenotype, such as the autonomic nervous system, immune system, spleen, skeletal muscle tissue, liver, pancreas, gastrointestinal tract and cardiac tissue [19–21]. A recent study based on insurance claims data of 1,038 cases in the USA showed that patients with SMA have multiple tissue defects (e.g. cardiovascular, gastrointestinal and male reproductive defects), some of which present prior to detectable neuromuscular symptoms and are not likely to be attributable to neuromuscular deterioration [22]. To date, this is the only real-world retrospective observational study showing this association.
To strengthen the current knowledge on the burden of SMA, we conducted a retrospective matched-cohort study aimed at assessing signs, comorbidities and potential extraneural manifestations that may be associated with SMA in treatment-naïve patients, by using a large US insurance claims database.
MATERIALS AND METHODS
Design
This is an observational, retrospective and matched-cohort study using secondary data from insurance claims in the USA.
Data source
Data were derived from the IBM® MarketScan® Commercial, Medicaid and Medicare Supplemental databases. These databases form a combined database that contains healthcare data for more than 43.6 million enrolled individuals, allowing the creation of a broadly representative data sample of Americans with employer-provided health insurance. The size of the database helps to maintain analytically sufficient cohort sizes when deep segmentation of patients is required, particularly for rare diseases [23]. MarketScan® covers both employees and their dependents, and the data comprise service-level claims for inpatient and outpatient services, and outpatient prescription drugs. Diagnoses are standardized by using International Classification of Diseases, Ninth Revision (ICD-9) codes, a diagnostic tool designed to promote international comparability in the collection, processing, classification and presentation of mortality statistics. The ICD-9 contains a list of codes corresponding to diagnoses and procedures associated with inpatient, outpatient and physician office utilization in the USA. In the MarketScan® claims database, a unique enrollee identifier is assigned to each individual, which provides strong longitudinal tracking, as long as the individual is still covered by this insurance plan. The MarketScan® data source fully complies with the Health Insurance Portability and Accountability Act of 1996.
Study period
To select only treatment-naïve individuals with SMA, the study period was between January 1, 2000 and December 31, 2013; the latter date was chosen as no large sample of individuals with SMA could have been exposed to any investigational SMA disease-modifying therapy before that date (i.e. nusinersen, onasemnogene abeparvovec or risdiplam).
Study population
SMA cases
The target population was any treatment-naïve individual aged≤65 years with≥2 ICD-9 codes of SMA at least 30 days apart. Eligible individuals with SMA were stratified into four groups (A, B, C and D) according to age at the index date (defined as the date of the first SMA code recorded in MarketScan®), and the ICD-9 SMA-related codes recorded in MarketScan®, which were both used as proxies to classify individuals according to SMA subtype (Table 1). Individuals were required to have a minimal period of continuous enrollment for medical benefits in the database after the SMA diagnosis (i.e. first recorded code). For Groups C and D,≥6 months were required for this minimal period, whereas≥2 months were required for Groups A and B, whose life expectancy, when untreated, may not exceed 2 years for some individuals with Type 1 SMA [24]. In addition, imposing a minimal period of 2 months for Group A reduced the risk of SMA subtype misclassification, by excluding individuals who potentially had Type 0 SMA. Continuous enrollment allowed for individual gaps of up to 10 days for Groups A and B and 30 days for Groups C and D. To ensure the SMA diagnosis date was accurately reflected by the first ICD-9 code occurrence in the current insurance plan, the older individuals (aged ≥ 2 years - Groups C and D) were required to have a pre-index continuous enrollment of ≥180 days before the first recorded code of SMA. This inclusion criterion was not applied to the youngest individuals (i.e. Groups A and B) as some of these individuals may have their first SMA code before the age of 6 months. Individuals with pregnancy codes or pregnancy-related complication codes within 12 months before SMA diagnosis were excluded to avoid including women who were undergoing prenatal genetic testing, or receiving care for pregnancies with a high risk of SMA and who may have been assigned an SMA diagnosis code for billing purposes only; therefore, they may have received an SMA code whilst undergoing a high-risk pregnancy without actually having had SMA themselves.
Table 1
Proxies to estimate the SMA type and patient groups
| Age at first SMA code (years) | Type of ICD-9 code | SMA type classification | Patient group |
| [0–1] | 335 Anterior horn cell disease | Likely Types 1/2 | Group A |
| 335.0 Werdnig–Hoffmann disease | Likely Type 1 | Group A | |
| 335.1 SMA | Likely Types 1/2 | Group A | |
| 335.10 SMA, unspecified | Likely Types 1/2 | Group A | |
| 335.11 Kugelberg–Welander disease | Likely Types 1/2 (supposedly wrong code recorded) | Group A | |
| 335.19 Other (Adult SMA) | Likely Types 1/2 (supposedly wrong code recorded) | Group A | |
| [1–2] | 335 Anterior horn cell disease | Likely Type 2 | Group B |
| 335.0 Werdnig–Hoffmann disease | Likely Type 1 | Group A | |
| 335.1 SMA | Likely Type 2 | Group B | |
| 335.10 SMA, unspecified | Likely Type 2 | Group B | |
| 335.11 Kugelberg–Welander disease | Likely Type 3 | Group C | |
| 335.19 Other (Adult SMA) | Likely Types 2/3 (supposedly wrong code recorded) | Group B | |
| [2–21] | 335 Anterior horn cell disease | Likely Type 3 | Group C |
| 335.0 Werdnig–Hoffmann disease | Likely Types 2/3 (supposedly wrong code recorded) | Group C | |
| 335.1 SMA | Likely Type 3 | Group C | |
| 335.10 SMA, unspecified | Likely Type 3 | Group C | |
| 335.11 Kugelberg–Welander disease | Likely Type 3 | Group C | |
| 335.19 Other (Adult SMA) | Likely Type 4 | Group D | |
| [21–65] | 335 Anterior horn cell disease | Likely Types 2/3/4 | Group D |
| 335.0 Werdnig–Hoffmann disease | Likely Type 4 (supposedly wrong code recorded) | Group D | |
| 335.1 SMA | Likely Types 2/3/4 | Group D | |
| 335.10 SMA, unspecified | Likely Types 2/3/4 | Group D | |
| 335.11 Kugelberg–Welander disease | Likely Type 3 | Group C | |
| 335.19 Other (Adult SMA) | Likely Type 4 | Group D |
Patients aged > 2 years with a code of 335 (anterior horn cell disease) were excluded as they could potentially be patients with ALS. ALS: amyotrophic lateral sclerosis; SMA: spinal muscular atrophy.
Non-SMA controls
A comparator group of non-SMA controls included individuals with one medical claim (not SMA related) in the index year. For non-SMA controls, one of the claims from all control claims recorded in the same index year as the SMA cases was randomly selected to serve as the index date. Controls were selected by automatic matching based on age at index (birth year), gender, length of insurance coverage and insurance plan type (i.e. Commercial, Medicaid, Medicare). Controls aged < 2 years at index were required to have a continuous enrollment of ≥2 months within the post-index period, with allowable gaps of up to 10 days. Controls aged 2–65 years at index were required to have a continuous enrollment of ≥6 months within the pre- and post-index periods, with allowable gaps of up to 30 days. The desired control:case ratio was 10:1. This ratio was employed to mitigate the risk of having a biased comparison, in case there were either very similar comparators (as is often seen in cancer trials with a 1:1 or 1:2 ratio) or atypical comparators (typically seen in trials with a ratio with a greater number of cases than controls).
Outcomes
Study outcomes were the occurrence of the ICD-9 codes, which were converted according to three different classifications.
• Single ICD-9 codes converted into ∼1,600 phenome-wide-association (PheWAS) diagnosis groups (i.e. ‘phecodes’) to reduce the number of disorders to investigate and to group similar diseases. Mapping was completed automatically [25].
• Phecodes grouped into 17 system groups (e.g. neurologic, circulatory, respiratory, etc.).
• Phecodes grouped into the following three categories based on expert classification (discussed further below):
– motor neuron disease related ⟶ presumed ‘symptom’ of SMA (e.g. phecode 728.87, ‘Muscle weakness’)
– unrelated to SMA ⟶ presumed ‘comorbidities’ (e.g. phecode 8, ‘Cholera’)
– extraneural, potentially SMA related ⟶ presumed ‘systemic effects’ of SMA (e.g. phecode 427, ‘Cardiac dysrhythmias’).
The expert classification was performed by Maryam Oskoui and Basil T. Darras (independently of one another), and was based on their clinical judgment. Both experts reviewed each associated event and assigned it to a category independently. Then the two classifications were compared, and resolution of conflicts was managed through discussions, and by seeking additional opinions from clinical experts. Study outcomes were required to be recorded either in the pre- or post-index period. Only outcomes of interest with a prevalence of at least 1% in the SMA or control groups were selected.
Data analysis
Descriptive analyses of baseline characteristics for the two cohorts (SMA cases vs. controls) were performed. For each period of interest (i.e. pre- and post-index), descriptive statistics including count and percentage of individuals with SMA and controls with each phecode were computed. In order to test whether study outcomes were diagnosed at significantly different rates between SMA and control groups, logistic regression was used to calculate odds ratios (ORs), 95% confidence intervals (CIs) and p-values. The false discovery rate was controlled at 5% and therefore corrected the p-values for multiple testing, using the Benjamin–Hochberg procedure [26]. The adjusted ORs were interpreted as the strength of association between the study outcome and SMA diagnosis.
For study outcomes significantly associated with SMA in the pre-index period, the median time between the occurrence of these events grouped into larger PheWAS categories and the diagnosis of SMA (i.e. first code) were computed. To better understand the temporal trajectories of the comorbidities and early signs of the disease, the trajectories were investigated by plotting median days prior to index for each group. For this analysis, only phecodes with > 5% prevalence and an adjusted p-value of < 0.05 were considered.
RESULTS
A total of 1,457 individuals with SMA were eligible to be included (Table 2) and matched to 13,362 controls. Baseline demographics of the eligible individuals with SMA are shown in Table 3. Gender was generally well balanced across groups, with a slight male overrepresentation (i.e. 55%) for the whole cohort. The mean (standard deviation) pre-index enrollment duration ranged from 3.8 (3.8) months for Group A to 30.7 (27.2) months for Group D. Post-index periods were longer, at 19.4 (25.1) months for Group A and 34.5 (28.2) months for Group D (Table 3).
Table 2
Study attrition
| Patient inclusion criteria | Total | |
| Patients included, n (%) | Patients excluded, n (%) | |
| 1. ≥ 2 claims for SMA on different days (> 30 days apart) | 3,726 (100) | 0 (0) |
| 2. Patients aged < 65 years at index date | 3,426 (91.95) | 300 (8.05) |
| 3. Pre-index period: | ||
| •Patients from Groups C and D with continuous enrollment* for medical benefits in the 180-day period | 1,653 (44.36) | 1,773 (47.58) |
| •All patients from Groups A and B | ||
| 4. Post-index period: | ||
| •Patients with continuous enrollment† for medical benefits in the 60-day (Groups A and B) and 180-day (Groups C and D) periods | 1,468 (39.4) | 185 (4.97) |
| 5. No pregnancy or pregnancy-related complication codes before SMA diagnosis | 1,457 (39.10) | 11 (0.30) |
Patients aged > 2 years with a code of 335 (anterior horn cell disease) were excluded as they could potentially be patients with ALS. *Continuous enrollment allows for individual gaps of up to 30 days. †Continuous enrollment allows for individual gaps of up to 10 days (Group A) or 30 days (Group B). ALS: amyotrophic lateral sclerosis; SMA: spinal muscular atrophy.
Table 3
Baseline demographics of individuals with SMA
| Group A | Group B | Group C | Group D | Total | ||||||
| Cases | Controls | Cases | Controls | Cases | Controls | Cases | Controls | Cases | Controls | |
| (N = 154) | (N = 1,400) | (N = 94) | (N = 800) | (N = 356) | (N = 3,230) | (N = 853) | (N = 7,932) | (N = 1,457) | (N = 13,362) | |
| Gender at index date, n (%) | ||||||||||
| Male, n (%) | 74 (48.1) | 650 (46.4) | 46 (48.9) | 370 (46.2) | 189 (53.1) | 1,750 (54.2) | 493 (57.8) | 4,594 (57.9) | 802 (55.0) | 7,364 (55.1) |
| Female, n (%) | 80 (51.9) | 750 (53.6) | 48 (51.1) | 430 (53.8) | 167 (46.9) | 1,480 (45.8) | 360 (42.2) | 3,338 (42.1) | 655 (45.0) | 5,998 (44.9) |
| Age at index date (years) | ||||||||||
| Mean (SD) | 0.331 (0.472) | 0.336 (0.472) | 1.00 (0) | 1.00 (0) | 15.8 (14.4) | 16.1 (14.9) | 46.3 (13.0) | 46.3 (12.7) | 31.1 (22.4) | 31.5 (22.3) |
| Median [Min, Max] | 0 [0, 1.00] | 0 [0, 1.00] | 1.00 [1.00, 1.00] | 1.00 [1.00, 1.00] | 12.0 [1.00, 65.0] | 12.0 [1.00, 65.0] | 49.0 [2.00, 65.0] | 49.0 [2.00, 65.0] | 34.0 [0, 65.0] | 35.0 [0, 65.0] |
| Age groups, n (%) | ||||||||||
| < 1 year | 103 (66.9) | 930 (66.4) | 0 (0) | 0 (0) | 0 (0) | 0 (0) | 0 (0) | 0 (0) | 103 (7.1) | 930 (7.0) |
| 1–2 years | 51 (33.1) | 470 (33.6) | 94 (100) | 800 (100) | 4 (1.1) | 40 (1.2) | 0 (0) | 0 (0) | 149 (10.2) | 1,310 (9.8) |
| 2–21 years | 0 (0) | 0 (0) | 0 (0) | 0 (0) | 286 (80.3) | 2,591 (80.2) | 17 (2.0) | 150 (1.9) | 303 (20.8) | 2,741 (20.5) |
| 21–65 years | 0 (0) | 0 (0) | 0 (0) | 0 (0) | 66 (18.5) | 599 (18.5) | 836 (98.0) | 7,782 (98.1) | 902 (61.9) | 8,381 (62.7) |
| Enrollment months (pre-index) | ||||||||||
| Mean (SD) | 3.76 (3.81) | 4.59 (3.63) | 6.04 (5.30) | 7.46 (4.65) | 22.1 (19.9) | 26.2 (21.1) | 30.7 (27.2) | 32.0 (26.2) | 24.2 (25.0) | 26.3 (24.7) |
| Median [Min, Max] | 2.00 [0, 20.0] | 4.00 [1.00, 23.0] | 5.00 [0, 20.0] | 6.00 [1.00, 24.0] | 15.0 [6.00, 124] | 19.0 [1.00, 129] | 21.0 [6.00, 158] | 24.0 [6.00, 162] | 15.0 [0, 158] | 18.0 [1.00, 162] |
| Enrollment months (post-index) | ||||||||||
| Mean (SD) | 19.4 (25.1) | 18.7 (25.1) | 25.4 (27.2) | 26.1 (29.4) | 36.4 (30.7) | 33.6 (28.0) | 34.5 (28.2) | 34.4 (28.3) | 32.8 (28.9) | 32.1 (28.4) |
| Median [Min, Max] | 12.0 [2.00, 166] | 9.00 [2.00, 167] | 17.0 [3.00, 145] | 15.0 [2.00, 156] | 25.0 [6.00, 162] | 24.0 [3.00, 162] | 25.0 [6.00, 149] | 24.0 [6.00, 155] | 22.0 [2.00, 166] | 22.0 [2.00, 167] |
| Index year, n (%) | ||||||||||
| 2000 | 3 (1.9) | 30 (2.1) | 0 (0) | 0 (0) | 3 (0.8) | 21 (0.7) | 7 (0.8) | 68 (0.9) | 13 (0.9) | 119 (0.9) |
| 2001 | 1 (0.6) | 10 (0.7) | 1 (1.1) | 10 (1.2) | 5 (1.4) | 30 (0.9) | 22 (2.6) | 203 (2.6) | 29 (2.0) | 253 (1.9) |
| 2002 | 5 (3.2) | 50 (3.6) | 0 (0) | 0 (0) | 9 (2.5) | 90 (2.8) | 13 (1.5) | 111 (1.4) | 27 (1.9) | 251 (1.9) |
| 2003 | 2 (1.3) | 20 (1.4) | 3 (3.2) | 30 (3.8) | 15 (4.2) | 149 (4.6) | 31 (3.6) | 310 (3.9) | 51 (3.5) | 509 (3.8) |
| 2004 | 4 (2.6) | 40 (2.9) | 4 (4.3) | 40 (5.0) | 17 (4.8) | 170 (5.3) | 54 (6.3) | 520 (6.6) | 79 (5.4) | 770 (5.8) |
| 2005 | 5 (3.2) | 50 (3.6) | 4 (4.3) | 40 (5.0) | 15 (4.2) | 150 (4.6) | 56 (6.6) | 550 (6.9) | 80 (5.5) | 790 (5.9) |
| 2006 | 8 (5.2) | 80 (5.7) | 6 (6.4) | 60 (7.5) | 25 (7.0) | 250 (7.7) | 56 (6.6) | 560 (7.1) | 95 (6.5) | 950 (7.1) |
| 2007 | 15 (9.7) | 150 (10.7) | 8 (8.5) | 80 (10.0) | 28 (7.9) | 280 (8.7) | 62 (7.3) | 600 (7.6) | 113 (7.8) | 1,110 (8.3) |
| 2008 | 12 (7.8) | 120 (8.6) | 9 (9.6) | 90 (11.2) | 37 (10.4) | 370 (11.5) | 89 (10.4) | 880 (11.1) | 147 (10.1) | 1,460 (10.9) |
| 2009 | 22 (14.3) | 220 (15.7) | 6 (6.4) | 60 (7.5) | 41 (11.5) | 410 (12.7) | 97 (11.4) | 950 (12.0) | 166 (11.4) | 1,640 (12.3) |
| 2010 | 8 (5.2) | 80 (5.7) | 7 (7.4) | 70 (8.8) | 37 (10.4) | 370 (11.5) | 91 (10.7) | 870 (11.0) | 143 (9.8) | 1,390 (10.4) |
| 2011 | 14 (9.1) | 140 (10.0) | 10 (10.6) | 100 (12.5) | 30 (8.4) | 300 (9.3) | 103 (12.1) | 1,020 (12.9) | 157 (10.8) | 1,560 (11.7) |
| 2012 | 38 (24.7) | 260 (18.6) | 26 (27.7) | 170 (21.2) | 63 (17.7) | 510 (15.8) | 122 (14.3) | 1,000 (12.6) | 249 (17.1) | 1,940 (14.5) |
| 2013 | 17 (11.0) | 150 (10.7) | 10 (10.6) | 50 (6.2) | 31 (8.7) | 130 (4.0) | 50 (5.9) | 290 (3.7) | 108 (7.4) | 620 (4.6) |
SD: standard deviation; SMA: spinal muscular atrophy.
Overall, 305 unique SMA-associated phecodes were identified across all groups and time periods. The number of associated phecodes increased from Groups A to D, which had 176 phecodes and 15 system classes associated with the disease in the pre-index period (Table 4). In Group D, the number of associated codes increased substantially in the post-index period to 231 phecodes, though there were 14 system classes associated with SMA as opposed to 15 in the pre-index period. Although the same trend from the pre-index to post-index periods was observed across all study groups, the differences were more pronounced for Groups A and B (3.4 and 5.9 times higher for phecodes and 1.5 and 3 times higher for system classes, respectively). We also found that the prevalence of phecodes associated with SMA and their ORs were all generally higher in the post-index period when comparing cases against controls (especially for Groups A and B). The ORs for all system classes generally decreased from Groups A and B to D, and Group D contained more ‘general’ codes, e.g. symptoms and injuries, than other groups. Neurologic symptom class appeared in all groups post-index but only in Groups C and D for the pre-index period. The underlying codes were varied, but the most common code in Groups A, B and C was ‘lack of coordination’, while the most common code in Group D was ‘other peripheral nerve disorder’ (same pre- and post-index). Other selected codes with imbalances included epilepsy/convulsions and sleep disorders/sleep apnea.
Table 4
Phecodes and top system classes associated with SMA
| Pre-index | Post-index | |||||
| Group | Phecodes (of approx. 1,600) | System classes (of 17) | Top four SMA-associated system classes, present in > 10% of cases: based on OR of case vs. controls | Phecodes (of approx. 1,600) | System classes (of 17) | Top four SMA-associated system classes, present in > 10% of cases: based on OR of case vs. controls |
| A | 22 | 8 | Endocrine/metabolic 20.13% vs. 1.86%; OR = 13.32 | 75 | 12 | Neurologic 73.38% vs. 4.86%; OR = 53.99 |
| Respiratory 17.53% vs. 2.57%; OR = 8.06 | Endocrine/metabolic 64.29% vs. 5.21%; OR = 32.72 | |||||
| Musculoskeletal 10.39% vs. 1.57%; OR = 7.26 | Digestive 53.90% vs. 6.57%; OR = 16.62 | |||||
| Congenital anomalies 26.62% vs. 5.71%; OR = 5.99 | Mental disorders 36.36% vs. 3.36%; OR = 16.45 | |||||
| Circulatory system 24.68% vs. 2.14%; OR = 14.96 | ||||||
| B | 8 | 4 | Endocrine/metabolic 24.47% vs. 0.75%; OR = 42.87 | 47 | 12 | Digestive 63.83% vs. 3.12%; OR = 54.71 |
| Mental disorders 21.28% vs. 1.00%; OR = 26.76 | Neurologic 67.02% vs. 3.62%; OR = 54.03 | |||||
| Digestive 10.64% vs. 1.50%; OR = 7.82 | Endocrine/metabolic 69.15% vs. 8.12%; OR = 25.34 | |||||
| Respiratory 12.77% vs. 4.00%; OR = 3.51 | Mental disorders 46.81% vs. 4.00%; OR = 21.12 | |||||
| Pregnancy complications 22.34% vs. 1.50%; OR = 18.89 | ||||||
| C | 83 | 14 | Neurologic 47.75% vs. 5.05%; OR = 17.20 | 157 | 16 | Neurologic 67.13% vs. 13.41%; OR = 13.20 |
| Mental disorders 18.82% vs. 1.86%; OR = 12.25 | Endocrine/metabolic 40.45% vs. 6.01%; OR = 10.63 | |||||
| Endocrine/metabolic 29.21% vs. 3.34%; OR = 11.93 | Mental disorders 28.93% vs. 4.09%; OR = 9.55 | |||||
| Musculoskeletal 30.34% vs. 3.65%; OR = 11.48 | Congenital anomalies 14.89% vs. 1.83%; OR = 9.40 | |||||
| Circulatory system 8.99% vs. 1.05%; OR = 9.28 | Genitourinary 17.70% vs. 2.35%; OR = 8.92 | |||||
| D | 176 | 15 | Neurologic 52.40% vs. 18.23%; OR = 4.94 | 231 | 14 | Neurologic 64.36% vs. 16.64%; OR = 9.05 |
| Dermatologic 17.58% vs. 7.03%; OR = 2.82 | Symptoms 79.95% vs. 51.51%; OR = 3.75 | |||||
| Mental disorders 21.92% vs. 9.35%; OR = 2.72 | Injuries &poisonings 26.14% vs. 9.00%; OR = 3.58 | |||||
| Symptoms 68.11% vs. 44.58%; OR = 2.66 | Endocrine/metabolic 31.65% vs. 12.03%; OR = 3.39 | |||||
| Hematopoietic 12.66% vs. 5.51%; OR = 2.49 | Infectious diseases 19.34% vs. 6.83%; OR = 3.27 | |||||
System classes listed in italics represent the 5th most associated symptom class, for cells that contain neurologic system class.
*Respiratory system class is the most prevalent in SMA Groups A and B post-index (79% and 84%, respectively) but do not have the highest ORs due to high prevalence in controls too (Group A matched controls: 32% and Group B matched controls: 38%).
OR: odds ratio; SMA: spinal muscular atrophy.
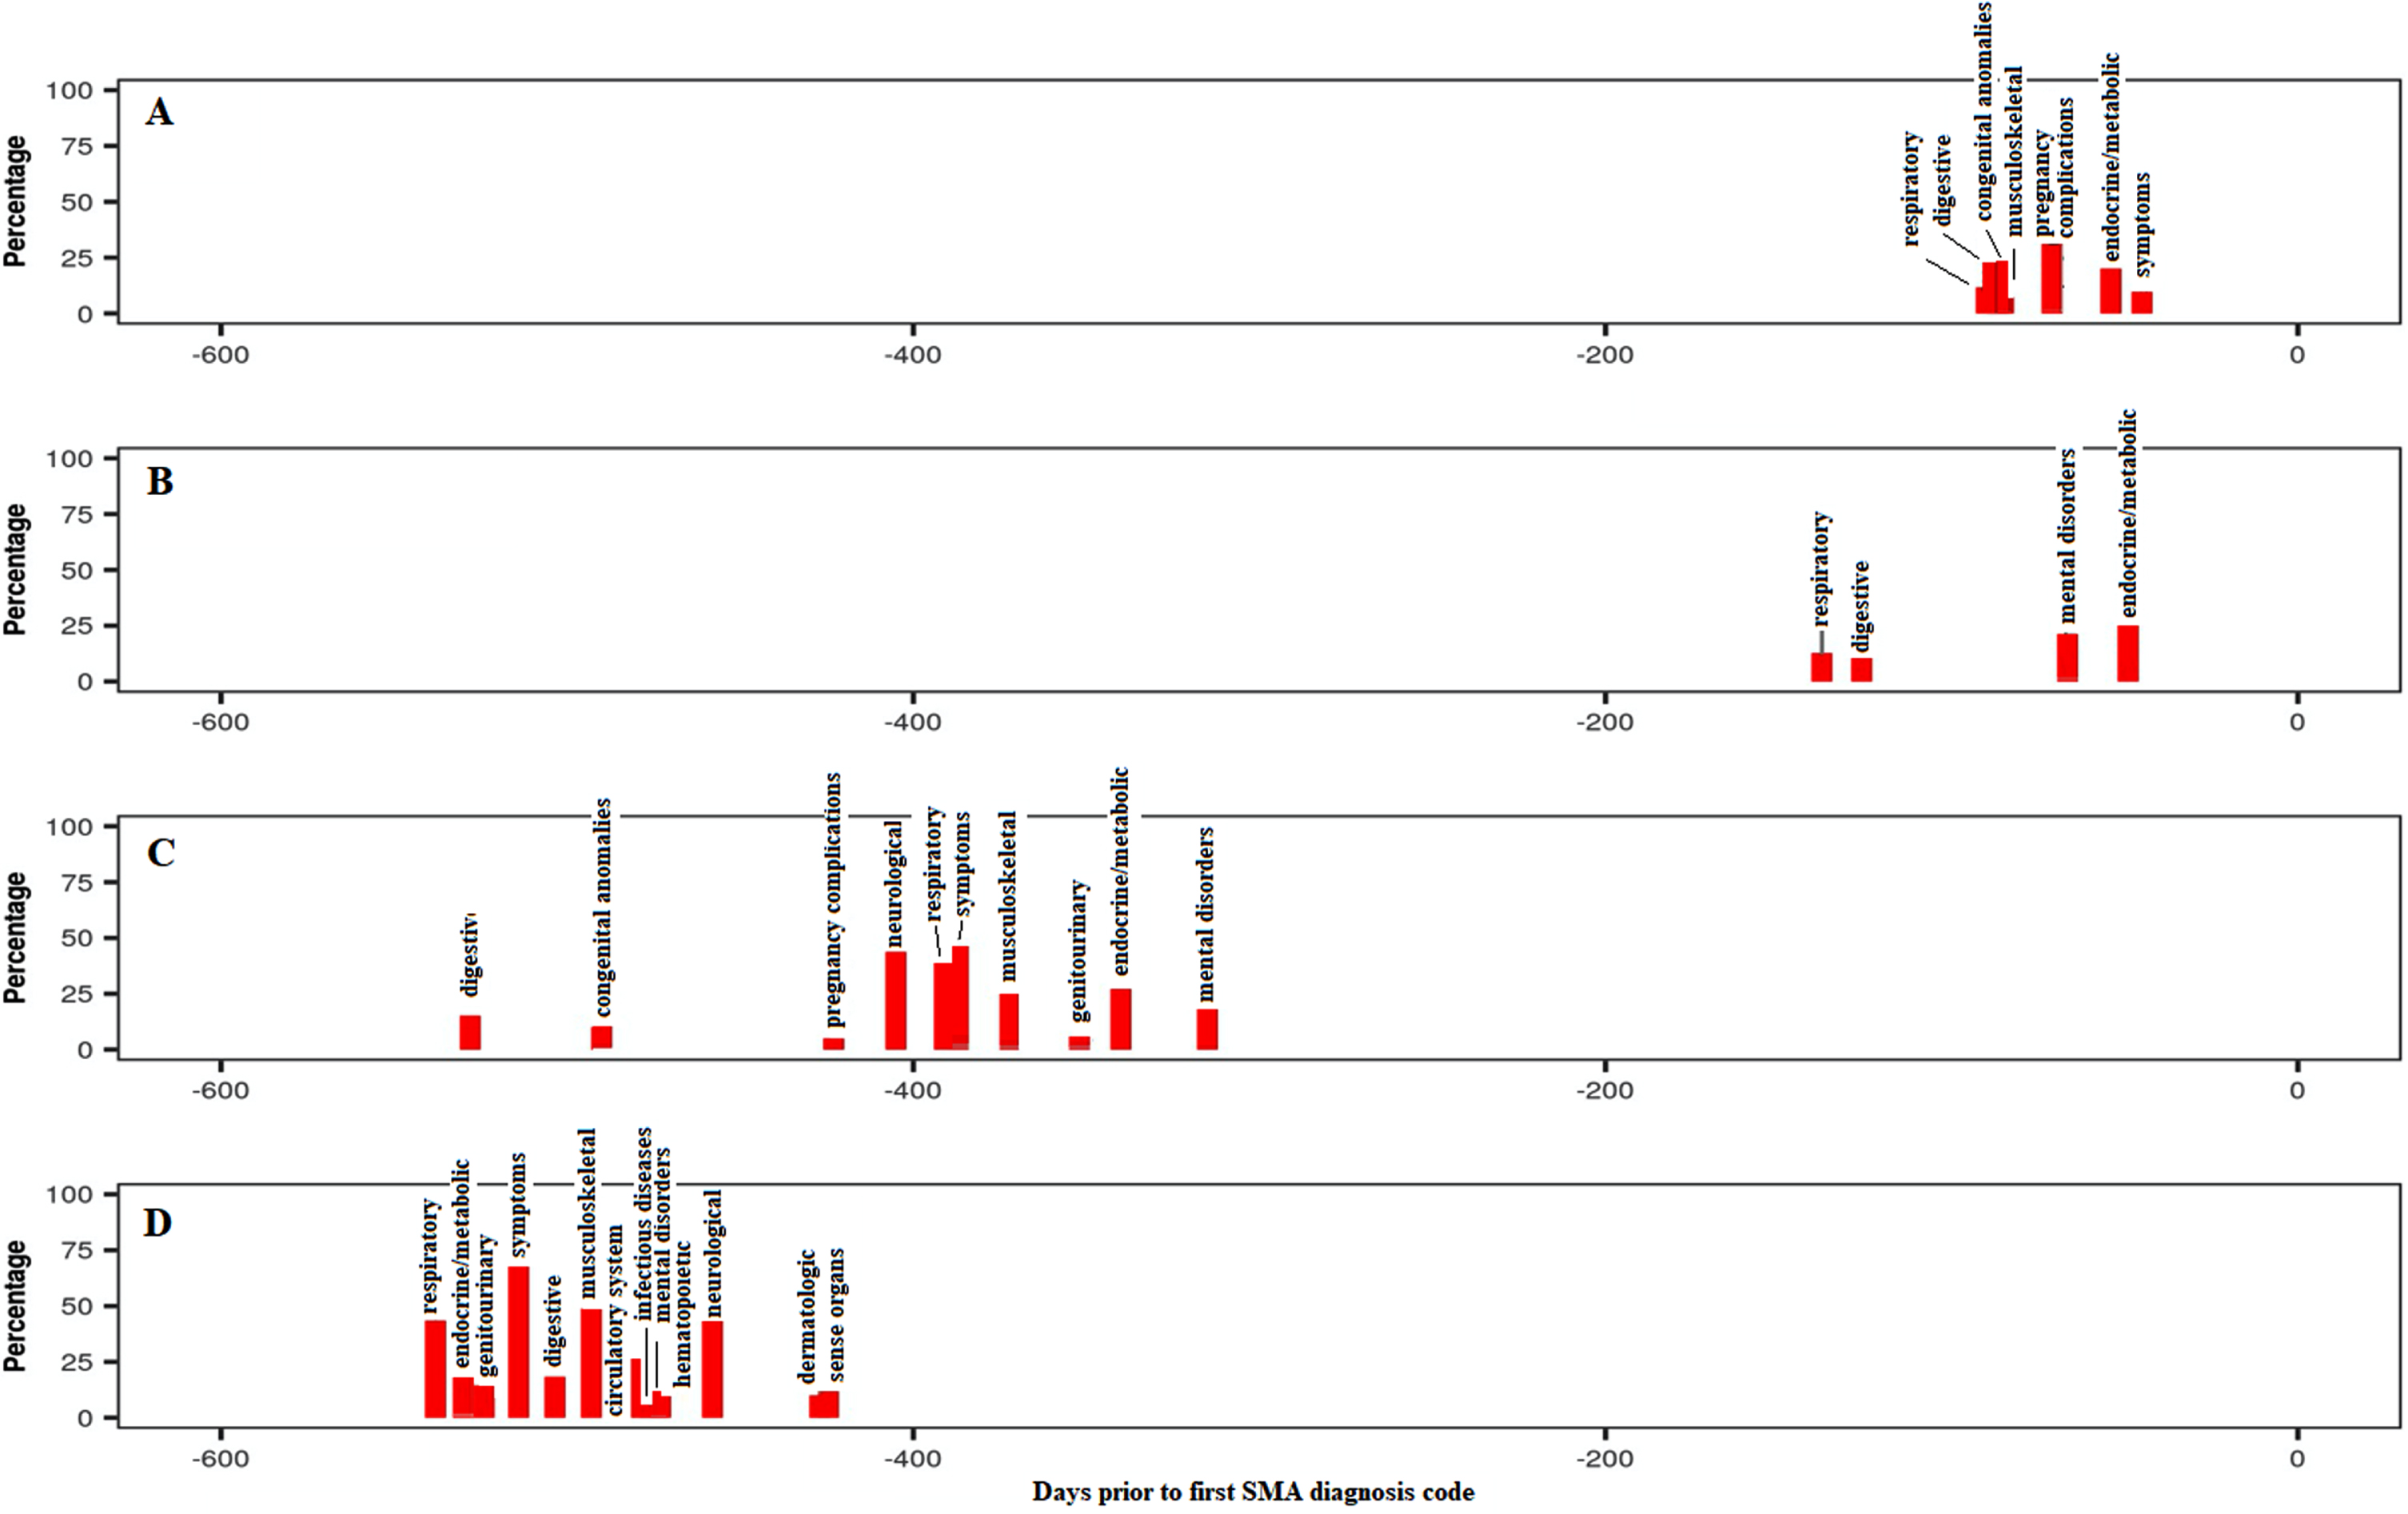
Endocrine/metabolic disorders were highly prevalent and associated with SMA in all groups and time periods, mainly driven by the high occurrence of ‘lack of normal development/failure to thrive’ codes or similar, especially in childhood. Interestingly, additional codes such as ‘acidosis’ and ‘protein-calorie malnutrition’ were also strongly associated with SMA. Mental disorders were also highly prevalent and associated with Groups B to D in the pre-index period and with Groups A to C in the post-index period, although this system class was mainly driven by ‘developmental delay’ codes, probably reflecting the codes used for early disease symptoms before confirming the diagnosis. As expected, the respiratory system class ranked among the top four classes for Groups A and B in the pre-index period, with “dyspnea/shortness of breath” being the strongest codes associated with SMA in this system class. Pneumonia was also frequently reported in those groups. Similarly, the musculoskeletal system was more prevalent in the pre-index period for Groups A and C due to associations with varied typical symptoms prior to the SMA diagnosis including ‘torticollis’, ‘scoliosis’ and ‘pain in joint’. Digestive system disorders, driven by codes for ‘dysphagia’, ‘reflux esophagitis/gastroesophageal reflux disease (GERD)’, ‘flatulence’ and ‘constipation’, were strongly associated with SMA for Group B in both the pre- and post-index periods, while this association was observed for Group A only in the post-index period. The temporal trajectories (Fig. 1) displayed the overall percentage of individuals with each system class associated with SMA by median time period prior to the SMA index date. System classes were prevalent 1.5–17.6 months prior to first SMA diagnosis for all groups, although the time prior increased from Group A to Group D, possibly reflecting the increasing age of participants, time to disease onset or decreasing rate of disease progression from Groups A to D. Additionally, more system classes were associated prior to the index for the oldest groups (C and D).
Fig. 1
Temporal trajectories of system classes associated with SMA in the pre-index period (all groups combined), shown as a percentage of study participants within each system class. The ‘Symptoms’ category includes the following comorbidities/symptoms: Back pain; Cervicalgia; Thoracic or lumbosacral neuritis or radiculitis, unspecified; Sciatica; Cervical radiculitis; Neuralgia, neuritis and radiculitis NOS; Myalgia and myositis, unspecified; Musculoskeletal symptoms referable to limbs; Swelling of limb; Cramp of limb; Symptoms of the muscles; Muscular wasting and disuse atrophy; Spasm of muscle; Muscle weakness; Symptoms involving nervous and musculoskeletal systems; Abnormal posture; Edema; Fever of unknown origin; Abdominal pain; Syncope and collapse; Nausea and vomiting; Malaise and fatigue. SMA: spinal muscular atrophy.
Prevalence and ORs across the three categories of likely etiology of each phecode were generally higher in the post-index period (Fig. 2 and Table 5). Prevalence of motor neuron disease-related symptoms, comorbidities and systemic effects indeed doubled between the pre- and post-index periods in Group A. Although the same increased trend was observed for the oldest age group (i.e. Group D), the difference was of less magnitude. Regardless of the period considered, the ORs for motor neuron disease-related symptoms generally increased with the severity of the disease, i.e. highest ORs for Group A compared with Group D. Across all groups, these ORs were two to four times higher in the post-index period compared with the pre-index period. There was no major difference in the magnitude of the ORs for comorbidities observed between the two periods of observation. Comorbidities were always associated with SMA for all groups, except Group B. This latter finding is due to codes of otitis media, which were more common in controls than cases (33% vs. 53%) and ‘cancelled out’ the effect of ‘short gestation/low birth weight’ (22% vs. 2%) and ‘asthma’ (23% vs. 10%) (Table 5). In the pre-index period, no comorbidities met criteria to be considered. The presumed systemic effects were associated with SMA in all groups and periods. ORs tended to be stronger in the post-index period, especially for Groups A and B. The most prevalent ‘systemic’ codes for Groups A and B pre- and post-index were GERD/reflux esophagitis and cardiac disorders (Table 5).
Fig. 2
Summary of overall disease burden by likely etiology. Note: There were no phecodes with “comorbidity” expert grouping that also met the p < 0.05 and prevalence > 1% criteria to be included in Group B for the pre-index period. For Group B, comorbidity, post-index, ‘short gestation/low birth weight/fetal growth retardation’ (22% vs. 2%) and ‘asthma’ (23% vs. 10%) were more common in cases compared with controls, but suppurative otitis media was more common in controls compared with cases (53% vs. 33%), ultimately leading to an overall OR = 0.97. Table 3 demonstrates the relatively low number of individual phecodes included in other results (especially for Groups A and B). OR: odds ratio; SMA: spinal muscular atrophy.
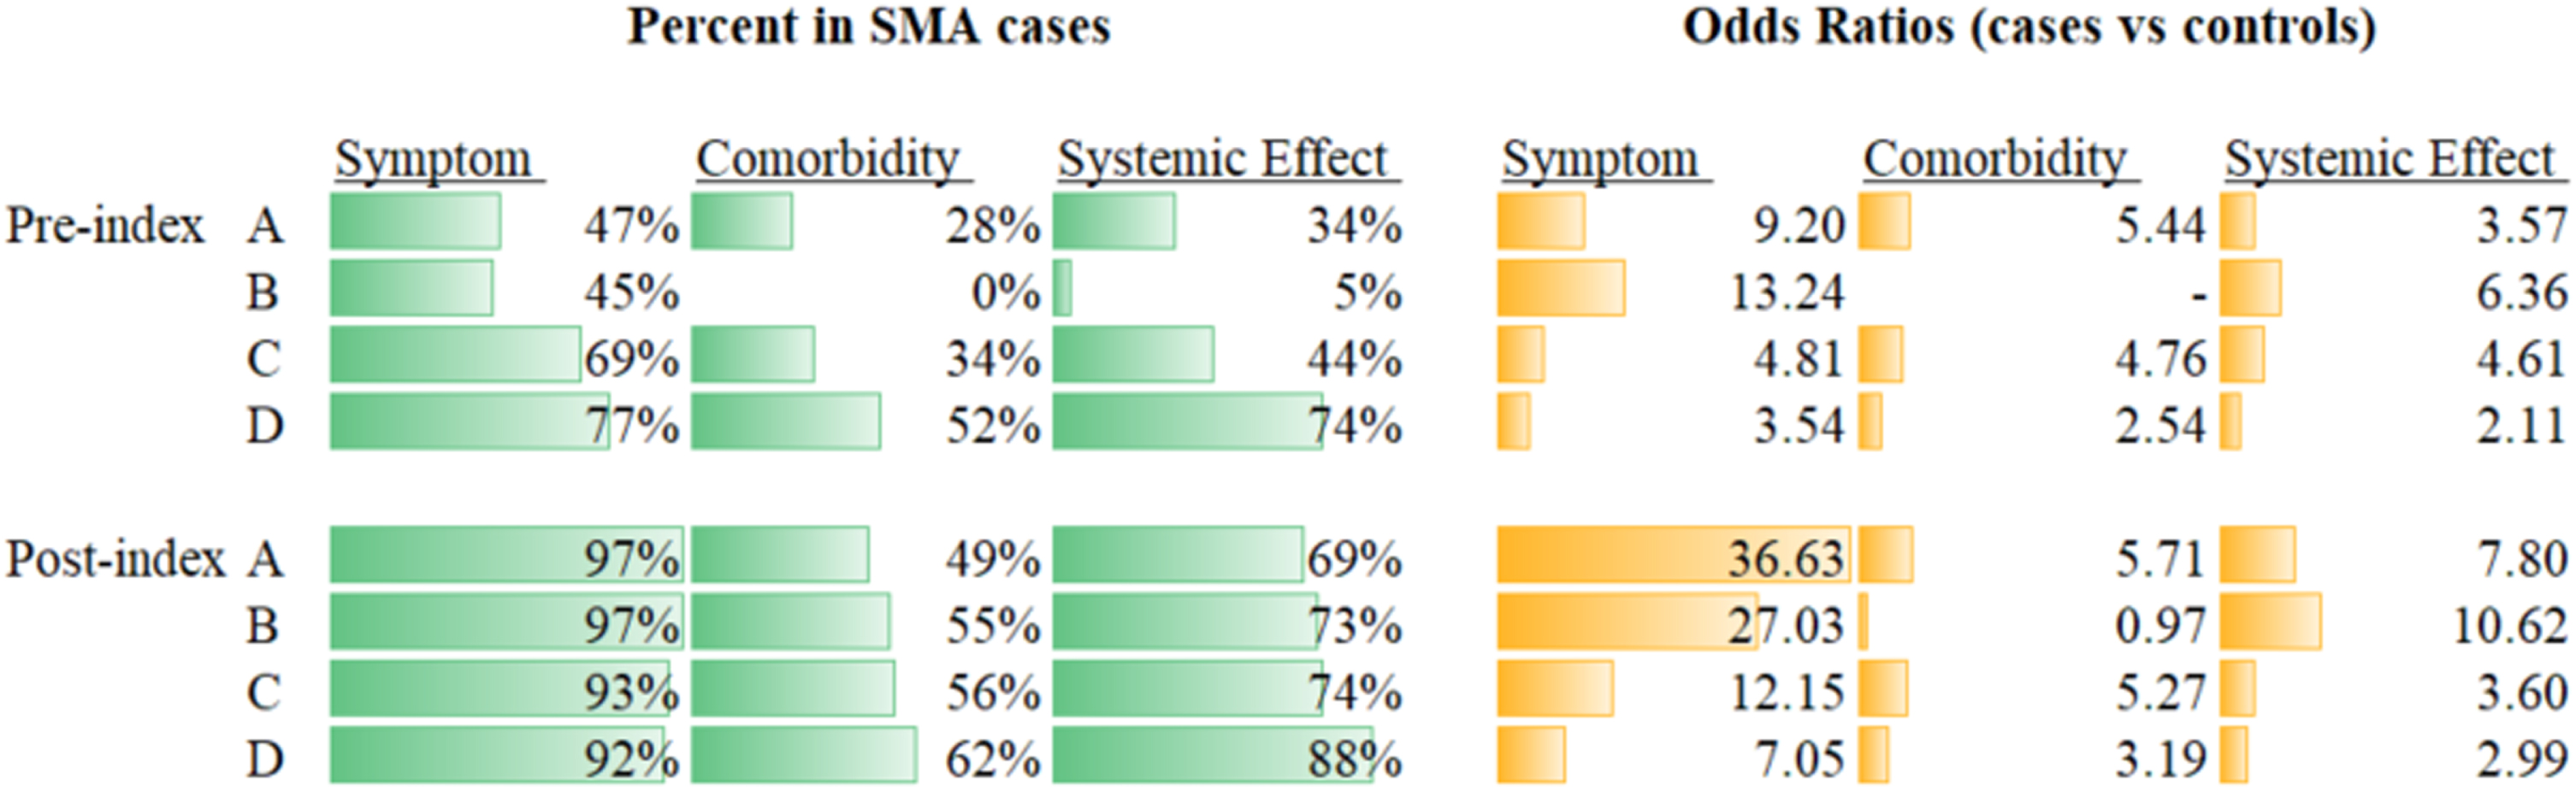
Table 5
Individual phecodes with highest ORs and prevalence, by expert groupings
| Group | Number of contributing phecodes | Phecodes with highest ORs | Phecodes with highest % in cases | |
| Systemic effects, pre-index | A | 5 | Top four are all congenital abnormalities (face, skull, respiratory, cardiac; ORs from 6–11). Percentages ranged from 5–12% in cases vs. 1–2% in controls | GERD (18% vs. 8%) |
| B | 1 | Reflux esophagitis (5% vs. 1%; OR = 6) | Reflux esophagitis (5% vs. 1%) | |
| C | 24 | Other specified congenital anomalies of nervous system (5% vs. < 1%; OR = 23) | GERD (12% vs. 22%) | |
| D | 58 | Myopathy (7% vs. < 1%; OR = 67) | Pain in joint (33% vs. 22%) | |
| Systemic effects, post-index | A | 19 | Cardiac dysrhythmias (9% vs. < 1%; OR = 28) and tachycardia (14% vs. < 1%; OR = 23) | GERD (41% vs. 6%) |
| B | 10 | GERD (40% vs. 2%; OR = 29), followed by tachycardia (22% vs. 1%; OR = 28) | GERD (41% vs. 2%) | |
| C | 51 | Acidosis (6% vs. < 1%; OR = 38) | Abdominal pain (28% vs. 14%) | |
| D | 84 | Myopathy (7% vs. < 1%; OR = 44) | Essential hypertension (41% vs. 34%) | |
| Comorbidities, pre-index | A | 4 | Chromosomal anomalies (5% vs. < 1%; OR = 13). Two others are pregnancy complications and one is strabismus (3% vs. < 1%) | Other perinatal conditions of fetus or newborn (21% vs. 4%) |
| B | 0 | – | – | |
| C | 11 | Infantile cerebral palsy (11% vs. < 1%; OR = 60) | Asthma (14% vs. 7%) | |
| D | 29 | Infantile cerebral palsy (2% vs. < 1%; OR = 28) | Allergic rhinitis (17% vs. 11%) | |
| Comorbidities, post-index | A | 8 | Strabismus (11% vs. 1%; OR = 11) | Asthma (16% vs. 6%) |
| B | 3 | Short gestation/low birth weight/fetal growth retardation (22% vs. 2%) and asthma (23% vs. 10%) are more common in cases, but suppurative otitis media is more common in controls (53% vs. 33%, leading to an overall OR = 0.97) | Asthma (23% vs. 10%) | |
| C | 24 | Infantile cerebral palsy (13% vs. < 1%; OR = 60) | Asthma (21% vs. 10%) | |
| D | 42 | Infantile cerebral palsy (2% vs. < 1%; OR = 27) | Depression (14% vs. 7%) |
Notes: There were no phecodes with the “comorbidity” expert grouping that also met the p < 0.05 and prevalence > 1% criteria to be included in the comorbidity classification for the post-index period. GERD, gastroesophageal reflux disease; OR, odds ratio.
DISCUSSION
Principal findings
Our study has explored a large, real-world dataset to detect previously unidentified signs, comorbidities and extraneural manifestations associated with SMA. The results show that there is a substantial disease burden associated with SMA, corroborating previous research that has shown how substantial both the economic [27] and clinical [28] burdens of SMA are on both parents and caregivers. Some of the strengths of our study are that it incorporates larger cohort sizes than previous research, as well as employing patient identification algorithms to better differentiate between individuals with various types of SMA. A valuable addition is also the expert-based grouping of events that involved several clinicians to distinguish signs, comorbidities or possible extraneural manifestations associated with SMA. Taken together, our findings show that there is a strong rationale for more research into the natural history and progression of SMA, as we identified some system classes/extraneural manifestations of SMA that have not previously been seen. Obtaining such robust knowledge of the full phenotypic spectrum of SMA would aid clinicians in addressing all aspects of the disease [23].
Interpretations
The increase in the numbers of phecodes associated with SMA from the pre- to post-index periods was most pronounced in the youngest age groups (Groups A and B). Similarly, system classes associated with SMA increased considerably from the pre-index period to post-index period in Groups A and B, suggestive of the onset of a more active disease stage in the post-index period. This might reflect that the index date is a good proxy for diagnosis date in these groups. Taken together, these results suggest that individuals in Groups A and B had a more accurately defined index date than those in Groups C and D.
ORs for all system classes generally decreased from Groups A and B to D. ORs for all system classes were generally higher in Groups A and B compared with Groups C and D, probably reflecting a more severe phenotype in patients presenting with symptoms earlier in life. The neurologic system class was associated with SMA in all groups post-index, but only for Groups C and D pre-index, and was driven by codes for ‘lack of coordination’ and ‘other peripheral disorder’. Interestingly, neurologic symptoms may have been reported under a non-neurologic system class such as endocrine/metabolic disorders or mental disorders. Endocrine/metabolic disorders were highly prevalent and associated with SMA in all groups for all time periods, mainly driven by ‘lack of normal development/failure to thrive’ codes, or similar. Mental disorders were also prevalent in Groups B to D pre-index and A to C post-index, possibly reflecting the use of ‘developmental delay’ codes used for early disease symptoms before confirming diagnosis.
Most system classes and codes strongly associated with SMA were reflective of the known early signs/symptoms of SMA before disease diagnosis. However, less-specific codes associated with SMA were found in the oldest age group (Group D). In addition, the index date was less accurate as a proxy of diagnosis date in Group D. This may be because the individuals in the older age groups may have a broader range of SMA types and, generally, the interval from symptom onset to diagnosis increases from Types 1–3 SMA [29]. Additionally, diagnosis may have occurred a significant amount of time before the first code was recorded if, for example, the individual changed insurance plans. This observation is also supported by the findings that associations are generally weaker and correlate less strongly with specific events in the older age groups.
Burden of SMA
In this study, we used three different classifications to interpret the overall burden of SMA. Exploration of this new classification helped to better differentiate symptoms, comorbidities and extraneural (potentially SMA-related) manifestations, although no clinical consensus has yet been reached on these definitions. While it would also be difficult to determine if extraneural (potentially SMA-related) manifestations are caused by the systemic effects of SMN protein deficiency rather than a result of neuromuscular degeneration, the prevalence of some of these phecodes in the pre-index period - before diagnosis and therefore prior to significant neuromuscular symptoms - supports this theory.
Comparisons with previous studies
Our finding that disease burden is not just limited to neurologic manifestations, but also spans a number of other systems and phenotypes, supports previous research by Lipnick et al. [22]. Importantly, we used a large US-based claims dataset to derive our results, which was different to the one used by Lipnick et al in their study [22]. It is therefore interesting to note that our findings corroborated theirs, in that we found similar non-neuromuscular/systemic phenotypes that were associated with SMA, even after expert coding was conducted. Lipnick et al found that symptoms such as a history of diagnoses for cardiovascular disorders, gastrointestinal problems or skeletal deformities could motivate genetic testing for SMA in infants or adolescents, when that child fails to meet expected developmental milestones [22]. These findings are supported by our study, as we note that the phecodes most commonly associated with SMA belong in the four system groups also associated with SMA, namely endocrine/metabolic, musculoskeletal and circulatory system groups. In summary, our findings support those of Lipnick et al as they show that SMA is not exclusively a motor neuron disease, since a wide array of other tissues are implicated [22]. Indeed, neurodegeneration may not even be the earliest clinically detectable sign of SMN deficiency, considering that respiratory and digestive system phecodes were associated with all four groups pre-index.
Study limitations
Several limitations were encountered in this study. Firstly, health insurance claims data are generated for billing purposes and are susceptible to reporting bias and/or coding errors. Secondly, identification of SMA cases relied on two SMA-related codes on different dates to reduce the risk of misdiagnosis, which meant that the accuracy of the diagnosis date may have been compromised. Thirdly, the groupings of A to D are only approximations to Types 1–4 SMA. They are more likely accurate for younger individuals in Groups A and B; however, Groups C and D are likely to reflect individuals with a mix of SMA types because follow-up is not from birth, therefore, it cannot be confirmed whether a first diagnosis code in the database is a true first SMA diagnosis or not. Also, minimum pre- and post-index periods were required to ensure the diagnosis date was accurately reflected by the first ICD-9 code occurrence. However, the index date may not reflect the actual diagnosis date, potentially leading to some individuals being categorized into the wrong group. Next, there was the chance of a phenomenon known as ‘undercoding’, in which potential phenotypes or procedures not directly linked to billable events may be unidentified/underreported. Furthermore, the system-level groupings may be driven by a small number of individual phecodes. While we believe this study is a helpful and descriptive analysis of current insurance-derived data, future studies may benefit from having more granular, pre-specified codes/comorbidities to aid hypothesis testing and interpretation. Finally, complications of SMA versus systemic effects and comorbidities of SMA are difficult to distinguish and there is no established consensus within the medical community on how to differentiate these two aspects.
CONCLUSIONS
Using a large US-based claims dataset, this exploratory study confirmed the considerable disease burden in patients with SMA and by identifying 305 unique phecodes associated with the disease, many of which appeared before the first SMA diagnosis code. Overall, the system classes identified in our study confirms that the disease burden of SMA is not only limited to neuromuscular degeneration-related symptoms but relates to wider systemic effects as well. While there may be some crossover between extraneural manifestations resulting from motor neuron degeneration and those resulting from systemic effects of SMA, further research is required to elucidate these differences as it is unfeasible to do so with claims data alone. Nonetheless, whilst the limitations of using insurance claims may restrict the utility of these findings, these results provide a strong rationale for future research into the potential involvement of other organ systems in SMA.
ACKNOWLEDGMENTS INCLUDING SOURCES OF SUPPORT
This study is sponsored by F. Hoffmann-La Roche Ltd, Basel, Switzerland. The authors thank Greg Rowe of Nucleus Global for providing medical writing support, which was funded by F. Hoffmann-La Roche Ltd, Basel, Switzerland in accordance with Good Publication Practice (GPP3) guidelines (http://www.ismpp.org/gpp3).
CONFLICT OF INTEREST
Basil T. Darras (BTD) has served as Steering Committee Chair for the Roche FIREFISH study.
FINANCIAL DISCLOSURES
Julie Mouchet was a full-time permanent employee of F. Hoffmann-La Roche Ltd during the period of this research study.
Spyros Roumpanis is a current employee of F. Hoffmann-La Roche Ltd.
Eleni Gaki is a current employee of and stockholder in Roche Products Ltd.
Scott Lipnick is a current employee at Flagship Pioneering, and during the period of this research study was employed by PatientsLikeMe and UnitedHealth Group.
Maryam Oskoui serves as a site investigator for clinical trials in spinal muscular atrophy by F. Hoffmann-La Roche Ltd and Biogen, and has received research support from Roche.
Renata S. Scalco is current employee of F. Hoff-mann-La Roche Ltd.
BTD has served as an ad hoc scientific advisory board member for Audentes, AveXis/Novartis Gene Therapies, Biogen, Pfizer, Vertex and Sarepta Therapeutics; Steering Committee Chair for Roche and Data and Safety Monitoring Board member for Amicus Inc.; BTD has no financial interests in these companies. BTD has received research support from the National Institutes of Health/National Institute of Neurological Disorders and Stroke, the Slaney Family Fund for SMA, the Spinal Muscular Atrophy Foundation, Cure SMA, and Working on Walking Fund and has received grants from Ionis Pharmaceuticals, Inc., for the ENDEAR, CHERISH and CS2/CS12 studies; from Biogen for CS11; and from AveXis, Sarepta Therapeutics, Novartis (AveXis), PTC Therapeutics, Roche, Scholar Rock and Fibrogen. BTD has also received royalties for books and online publications from Elsevier and UpToDate, Inc.
REFERENCES
[1] | Farrar MA , Kiernan MC . The genetics of spinal muscular atrophy: Progress and challenges, Neurotherapeutics: The journal of the American Society for Experimental NeuroTherapeutics (2015) ;12: (2):290–302. |
[2] | Darras B , Monani U , De Vivo D . Genetic disorders affecting the motor neuron: Spinal muscular atrophy. In: Swaiman K, Ashwal S, Ferriero D, Schor N, Finkel R, Gropman A, et al., editors. Swaiman’s Pediatric Neurology: Principles and Practice. 6th ed: Elsevier; (2017) . pp. 1057–64. |
[3] | Lefebvre S , Burglen L , Reboullet S , Clermont O , Burlet P , Viollet L , et al. Identification and characterization of a spinal muscular atrophy-determining gene, Cell (1995) ;80: (1):155–65. |
[4] | Monani UR , Lorson CL , Parsons DW , Prior TW , Androphy EJ , Burghes AH , et al. A single nucleotide difference that alters splicing patterns distinguishes the SMA gene SMN1 from the copy gene SMN2, Human Molecular Genetics (1999) ;8: (7):1177–83. |
[5] | Lorson CL , Hahnen E , Androphy EJ , Wirth B . A single nucleotide in the SMN gene regulates splicing and is responsible for spinal muscular atrophy, Proc Natl Acad Sci USA (1999) ;96: (11):6307–11. |
[6] | Coovert DD , Le TT , McAndrew PE , Strasswimmer J , Crawford TO , Mendell JR , et al. The survival motor neuron protein in spinal muscular atrophy, Human Molecular Genetics (1997) ;6: (8):1205–14. |
[7] | Burnett BG , Munoz E , Tandon A , Kwon DY , Sumner CJ , Fischbeck KH . Regulation of SMN protein stability, Molecular and Cellular Biology (2009) ;29: (5):1107–15. |
[8] | Oskoui MDB , De Vivo DC . Spinal Muscular Atrophy: 125 Years Later and on the Verge of a Cure. San Diego, California, USA: Academic Press; 2017. |
[9] | Verhaart IEC , Robertson A , Wilson IJ , Aartsma-Rus A , Cameron S , Jones CC , et al. Prevalence, incidence and carrier frequency of 5q-linked spinal muscular atrophy - a literature review, Orphanet Journal of Rare Diseases (2017) ;12: (1):124. |
[10] | Butchbach ME . Copy Number Variations in the Survival Motor Neuron Genes: Implications for Spinal Muscular Atrophy and Other Neurodegenerative Diseases, Frontiers in Molecular Biosciences (2016) ;3: :7. |
[11] | Dubowitz V . Very severe spinal muscular atrophy (SMA type 0): An expanding clinical phenotype, European Journal of Paediatric Neurology (1999) ;3: (2):49–51. |
[12] | Biogen Inc. SPINRAZA® (nusinersen) EMA prescribing information 2017 [updated December 2017.Available from: http://www.ema.europa.eu/docs/enGB/documentlibrary/EPAR-ProductInformation/human/004312/WC500229704.pdf. |
[13] | Biogen Inc. SPINRAZA® (nusinersen) US prescribing information 2016 [updated December 2016.Available from: https://www.accessdata.fda.gov/drugsatfdadocs/label/2016/209531lbl.pdf. |
[14] | AveXis Inc. ZOLGENSMA (onasemnogene abeparvovecxioi) [package insert] Bannockburn, IL2019 [Available from: https://www.fda.gov/media/126109/download. |
[15] | EMA. ZOLGENSMA® (onasemnogene abeparvovecxioi) EMA prescribing information 2020 [Available from: https://www.ema.europa.eu/en/documents/product-information/zolgensma-epar-product-informationen.pdf. |
[16] | Food and Drug Administration. EVRYSDI(R) Highlights of prescribing information 2020 [Available from: https://www.accessdata.fda.gov/drugsatfdadocs/label/2020/213535s000lbl.pdf. |
[17] | Roche. Evrysdi (risdiplam) summary of product characteristics 2021 [Available from: Available from: https://www.ema.europa.eu/en/documents/product-information/evrysdi-epar-product-informationen.pdf. |
[18] | Hua Y , Liu YH , Sahashi K , Rigo F , Bennett CF , Krainer AR . Motor neuron cell-nonautonomous rescue of spinal muscular atrophy phenotypes in mild and severe transgenic mouse models, Genes & Development (2015) ;29: (3):288–97. |
[19] | Hamilton G , Gillingwater TH . Spinal muscular atrophy: going beyond the motor neuron, Trends in Molecular Medicine (2013) ;19: (1):40–50. |
[20] | Shababi M , Lorson CL , Rudnik-Schoneborn SS . Spinal muscular atrophy: a motor neuron disorder or a multi-organ disease? Journal of Anatomy (2014) ;224: (1):15–28. |
[21] | Yeo CJJ , Darras BT . Yeo and Darras: Extraneuronal phenotypes of spinal muscular atrophy, Annals of Neurology (2021) ;89: (1):24–6. |
[22] | Lipnick SL , Agniel DM , Aggarwal R , Makhortova NR , Finlayson SG , Brocato A , et al. Systemic nature of spinal muscular atrophy revealed by studying insurance claims, PloS One (2019) ;14: (3):e0213680. |
[23] | IBM MarketScan Research Databases White Paper for Life Sciences Researchers. 2020 [05/07/2021]. Available from: https://www.ibm.com/products/marketscan-researchdatabases/resources. |
[24] | Park HB , Lee SM , Lee JS , Park MS , Park KI , Namgung R , et al. Survival analysis of spinal muscular atrophy type I, Korean J Pediatr (2010) ;53: (11):965–70. |
[25] | Adams R , Wu M , Wilson M . The Rasch Rating Model and the Disordered Threshold Controversy, Educational and Psychological Management (2012) ;72: (4). |
[26] | McDonald JH . Handbook of Biological Statistics.: Sparky House Publishing, Baltimore, Maryland.; (2014) . |
[27] | Belter L , Cruz R , Kulas S , McGinnis E , Dabbous O , Jarecki J . Economic burden of spinal muscular atrophy: an analysis of claims data, J Mark Access Health Policy (2020) ;8: (1):1843277. |
[28] | McMillan HJ , Gerber B , Cowling T , Khuu W , Mayer M , Wu JW , et al. Burden of Spinal Muscular Atrophy (SMA) on Patients and Caregivers in Canada, J Neuromuscul Dis (2021) ;8: (4):553–68. |
[29] | Pera MC , Coratti G , Berti B , D’Amico A , Sframeli M , Albamonte E , et al. Diagnostic journey in Spinal Muscular Atrophy: Is it still an odyssey? PloS One (2020) ;15: (3):e0230677. |


