
Enhancing Interrogation of Skeletal Muscle Samples for Informative Quantitative Data
Abstract
Careful quantitative analysis of histological preparations of muscle samples is crucial to accurate investigation of myopathies in man and of interpretation of data from animals subjected to experimental or potentially therapeutic treatments. Protocols for measuring cell numbers are subject to problems arising from biases associated with preparative and analytical techniques. Prominent among these is the effect of polarized structure of skeletal muscle on sampling bias. It is also common in this tissue to collect data as ratios to convenient reference dominators, the fundamental bases of which are ill-defined, or unrecognized or not accurately assessable. Use of such ‘floating’ denominators raises a barrier to estimation of the absolute values that assume practical importance in medical research, where accurate comparison between different scenarios in different species is essential to the aim of translating preclinical research findings in animal models to clinical utility in Homo sapiens.
This review identifies some of the underappreciated problems with current morphometric practice, some of which are exacerbated in skeletal muscle, and evaluates the extent of their intrusiveness into the of building an objective, accurate, picture of the structure of the muscle sample. It also contains recommendations for eliminating or at least minimizing these problems. Principal among these, would be the use of stereological procedures to avoid the substantial counting biases arising from inter-procedure differences in object size and section thickness.
Attention is also drawn to the distortions of interpretation arising from use of undefined or inappropriate denominators.
INTRODUCTION
Skeletal muscle presents a profound illustration of the relationships between function and structure, ranging from gross anatomical arrangement to molecular configuration. Its single-minded dedication to metabolically powered mechanical work is spectacularly reflected in its ordered anisometric polarized structure aligned with its axis of force production. It comes as no surprise therefore, that disturbances arising from systemic or local pathological events or changes in functional demand within this tissue commonly manifest as disturbances of structure and biochemistry and that these are used both as aids to diagnosis and as tools for investigation of the causative bases of muscle dysfunction. Such knowledge is key to effective monitoring of therapeutic intervention. Historically, these pathological features have been routinely investigated by microscopic and biochemical analysis of muscle samples obtained by biopsy or at autopsy. The underlying purpose of such investigations is to obtain a snapshot of tissue structure that will contribute to an understanding of the mechanisms responsible for its status. For purposes of diagnostic clinical pathology, microscopic analysis of the structure of the tissue has long been the main line of investigation but biochemical, proteomic, and gene expression signatures have been added progressively. With the advent and rapid development of new genetic and molecular tools for experimental pathology, it has become possible to penetrate these fundamental properties more comprehensively and with ever more refinement and delicacy. These advances have proved of especial value in fundamental and preclinical research in animal models of human clinical conditions. However, the molecular biological innovations have not been paralleled by equivalent development of methods to fully interrogate the structural consequences of any identified molecular changes. The object of this article is to highlight those areas most obviously in need of reappraisal and to suggest ways in which current practice might be improved. For some issues, there is no fully satisfactory solution, but their identification as potential hazards remains as a bulwark against erroneous interpretation.
Transparent interpretation of quantitative data obtained from complex biological systems is standardly obscured by inter-sample variation whose effects are minimized by appropriate experimental design and statistical analysis. A more insidious, and therefore dangerous, additional factor is the influence on the primary data of factors that are not designed as experimental variables. Where such a factor (e.g. age, diet, physical activity, diurnal rhythm) imposes a systematic directional effect on the measured variable, it will constitute a bias that may distort our interpretation of the experimental outcome. Such biases may arise from many causes, but two are readily identifiable in analysis of skeletal muscle. Some are easily discernable as arising from features intrinsic to the methods we use to gather and analyze our data and, once recognized, can be accommodated during interpretation, but insidious sources of bias, “unknown unknowns’ are, by definition, easily overlooked and can spring unpleasant surprises. A second pervasive source of subliminal bias arises from the practice of expressing findings as ratios either to some internal or external reference value. Despite its co-equal role with the numerator in the generation of quantitative information of interest, the denominator is widely ignored [1]. Without a thorough understanding of the denominators, the numerators convey only limited, and, often, distorted information from which to assemble a harmonious picture of the biological phenomena of interest. This aim of coherence would also be aided by choice of denominators that exhibit some definable relationship to one another.
These intertwined issues are considered in more detail below.
BACKGROUND OF TECHNICAL BIAS
Samples of skeletal muscle are standardly obtained by biopsy, autopsy or on termination of an animal experiment, by necropsy. None is trivial, particularly biopsy, a sufficiently traumatic procedure to be discouraged in preclinical experiments and minimized in clinical research protocols. So, it is important to retrieve the maximum amount of reliable information from such samples. This objective has been pursued by establishment of carefully crafted procedures preparatory to microscopical examination [2, 3]. Most commonly, this involves either fixation followed by wax embedding, or freezing, with or without fixation, followed by sectioning on a microtome or a cryostat and staining of the resulting sections. For most purposes, frozen muscle preparation is preferable; wax embedding, removes lipids, obliterates many antigens, inactivates enzymes, causes shrinkage and, especially in muscle, generates conspicuous split-forming artefacts that complicate measurement of size and spacing. Traditionally, much of the analysis of the resulting sections has been based on qualitative descriptive reporting of features known by experience to be associated with specific clinical conditions, supported, in some instances, by moves towards quantitative analysis [2, 4–9].
Extraction of consistent data from microscopic examination of biological material faces the enduring problem of the amount of shrinkage or expansion that occurs during its preparation. This is especially evident with wax-embedding procedures. Some account may be taken of this problem, by measuring the weight/volume of the pre- and post-embedded material and implementing ‘Fractionation’ [10] protocols to randomize sampling of the entire embedded object during analysis. This combination provides a basis for subsequent estimation of the contributions of pathological elements such as fat fibrous connective tissue. Whether this is a worthwhile exercise with any given muscle sample can only be judged by the importance that might be attached to the precision of outcome required for useful interpretation - often a retrospective exercise.
OBSERVATION AND PHENOMENOLOGY
Most data gathered routinely from structural examination of skeletal muscle samples are descriptive observations that are phenomenological in the sense that the underlying causality is uncertain or ill-defined. Commonly, it includes such items as myofibre size, frequency of centrally/internally nucleated fibres and of myofibre type in terms of oxidative/glycolytic phenotype, myosin isoforms, or of structural abnormalities. Combinations of such descriptors, provide a ‘fingerprint’ of the condition of the muscle but, in themselves provide little information about the mechanisms that produce them. To be of value for translation from pre-clinical to clinical investigation, it is important to assure, as far as possible, that phenomena in the experimental model correspond causally to those that are deemed to be implicated in the disease process in man. For example, our understanding of demise of muscle fibres in the mdx mouse has benefitted from a range of proteomic and physiological investigations demonstrating the many features it shares with those seen in DMD [11]. In contrast the robust regeneration, that is one of the drivers of hypertrophy in the mdx mouse, is widely held to be responsible for its mild clinical phenotype making it somewhat dubious as a model in which to investigate the failure of regeneration in DMD boys [12, 13].
MUSCLE FIBRE SIZE
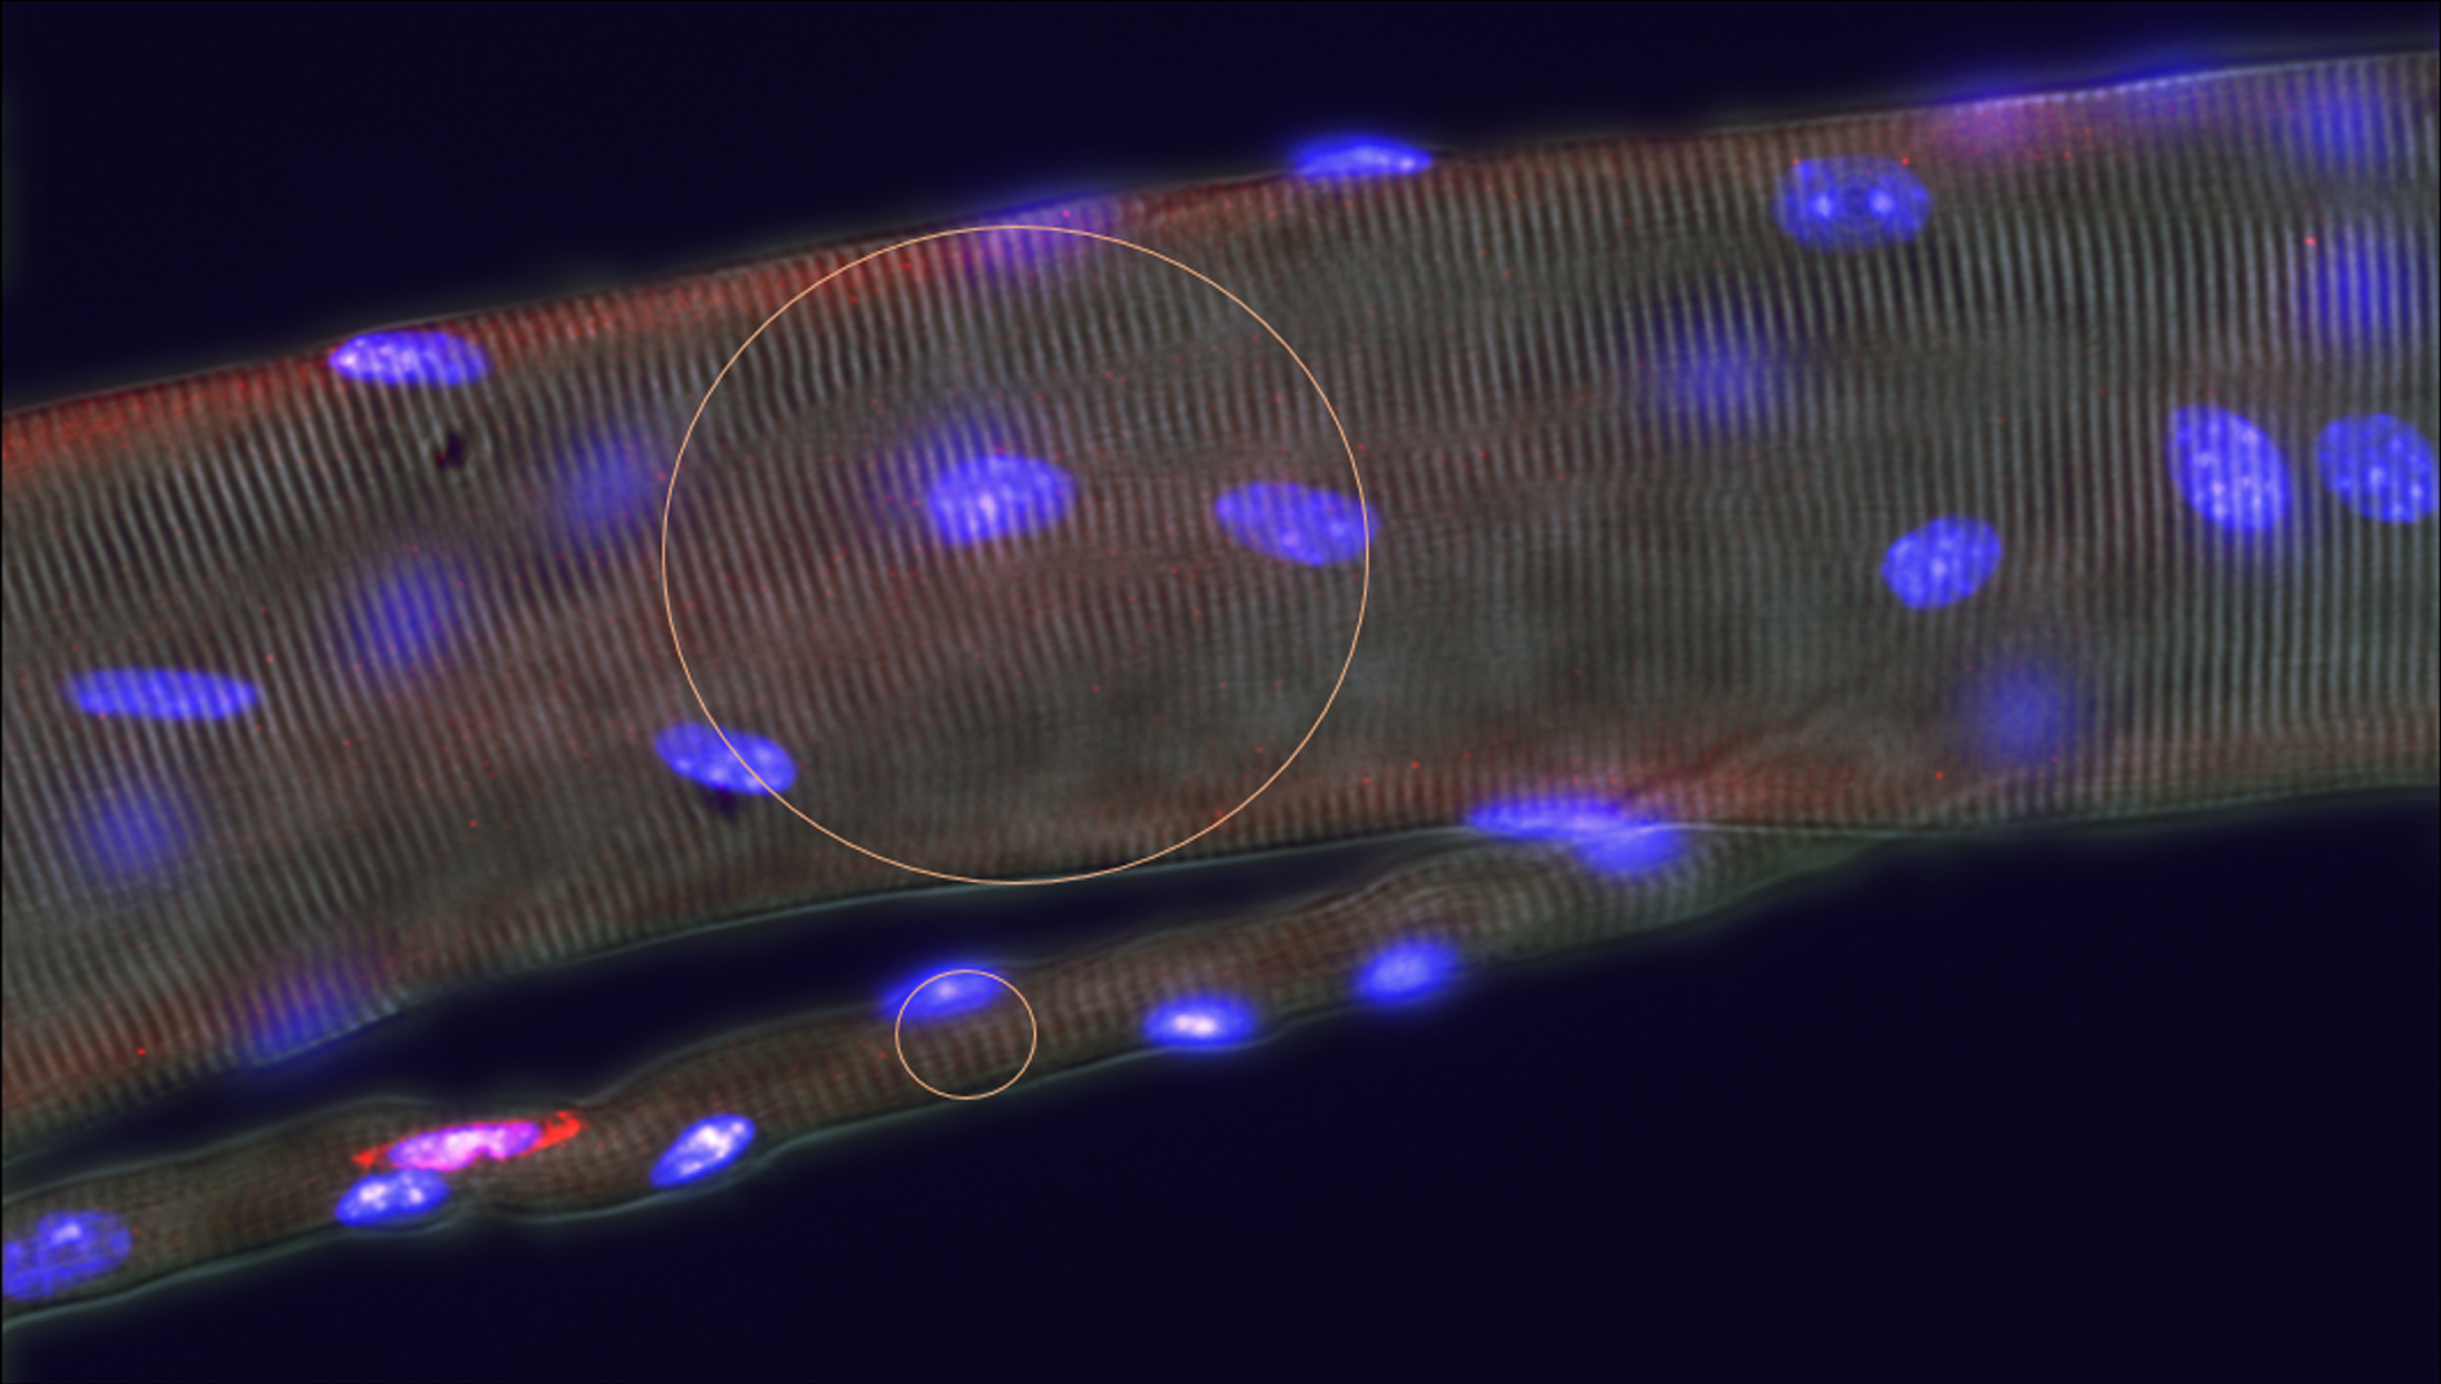
An almost reflex, routine, analytical procedure on microscopic sections of samples of skeletal muscle, is measurement of muscle fibre size either as cross-sectional area or, to minimize the effect of oblique sectioning, as minimum Feret diameter [14]. It is worth contemplating, in each individual case, whether acquisition and analysis of detailed fibre size data is worth the time and effort involved. Such data are usually presented as a histogram of the sampled population whose distribution has been used as a diagnostic criterion [4–7, 15] as well as for comparison between experimental interventions. However, this type of analysis shows only whether any two samples are statistically different, giving no indication of the source or cause of such difference. To give insight into the biological causality of what is being measured, which is the aim in most experimental studies, requires additional information. One major confounding factor is the extent of muscle fibre ‘branching’ that, in histological sections may generate many of the smaller fibre profiles seen in pathological conditions (Fig. 1). Where it has been investigated, branching has been found to be a common feature of muscle regeneration in response to pathological events or aging [16–20, 21] and, in the dystrophic mdx mouse, to be a major constituent part of the apparent increase in myofiber number associated with muscle hypertrophy [22]. While readily identifiable in preparations of isolated muscle fibres (Fig. 1), in sectioned histological material, determination of the extent of branching is arduous and time consuming. Recently developed methods for optical clarification of thick blocks of muscle, may prove to be an acceptable intermediate [23, 24].
Fig. 1
Image of muscle fibre isolated from the EDL muscle of a mature mdx mouse, showing a large fibre with a small branch carrying a satellite cell as revealed by staining for M Cadherin. If this region had been encountered in a histological section of the muscle from which it had been isolated, it would have appeared in most sections as two fibres, one large and on small, the latter contributing to the low end of the spectrum of fibre sizes. The likelihood of such branch sites being recognized as such in a random histological section is low.
Use of fibre size as an indicator of the vigour of myogenic repair in response to injury is an instructive illustration of the dangers of unwarranted interpretation of phenomenological data. The presumption, that muscle fibre size is a reliable reflection of its content of myonuclei, ignores the role of the other main component of muscle fibre size, namely, the amount of sarcoplasm generated around each myonucleus, commonly termed the ‘myonuclear domain’. Thus, measured fibre diameter, is only indirectly related to its myonuclear content, vitiating its value as a quantitative indicator of myogenic input. In normal muscle there is a 2 fold range in myonuclear domain between fast and slow fibres, with growth and aging as additional major variables [25], while in the adult mdx mouse, the myonuclear domain drops to half of that in the wild-type [12]. Whether such differences are shared by pathological muscle samples in other species appears not to have been rigorously investigated by stereological techniques of the type described below.
Additional issue
Problem:- uncertainty about the relationship between muscle fibre size and myonuclear number in pathological conditions, makes it an unreliable index of myogenesis.
1. As a more direct and simple measure of myogenic activity, the number of myonuclei can be measured against a variety of denominators, e.g. per fibre, per area, or per volume of lesioned muscle and per muscle fibre volume. Such a combination would provide a basis for estimating the absolute number of myoblast fusions per lesion.
2. In experimental animal models, pulsed administrations of BrdU or Edu can be used to mark myonuclei originating from myogenic cell divisions within the duration of the pulse, thus adding an element of precision to estimates of rate of myogenesis [13].
STEREOLOGICAL ISSUES
Descriptions of microscopic sections of skeletal muscle have fostered a largely two-dimensional vocabulary that is reflected in a failure to address issues arising from their thickness. Where the section is very thin by comparison with features of interest, e.g. nuclei, treatment of the section as a simple two-dimensional sample is justifiable for gathering a set of proportional descriptors, e.g. the proportion of fibrous connective tissue analysis, according to the Delesse principle [26]. This postulates that for randomly arrayed objects within a sample volume, ratio measurements made on a 2-dimensional surface are maintained as ratios on translation into the third dimension. Accordingly, the ratios of two areas made on a random sample surface can be adopted as equivalent to volume ratios within the sample and, similarly, perimeter lengths around any measured area of object can be used as estimates of volume/surface ratios of those objects.
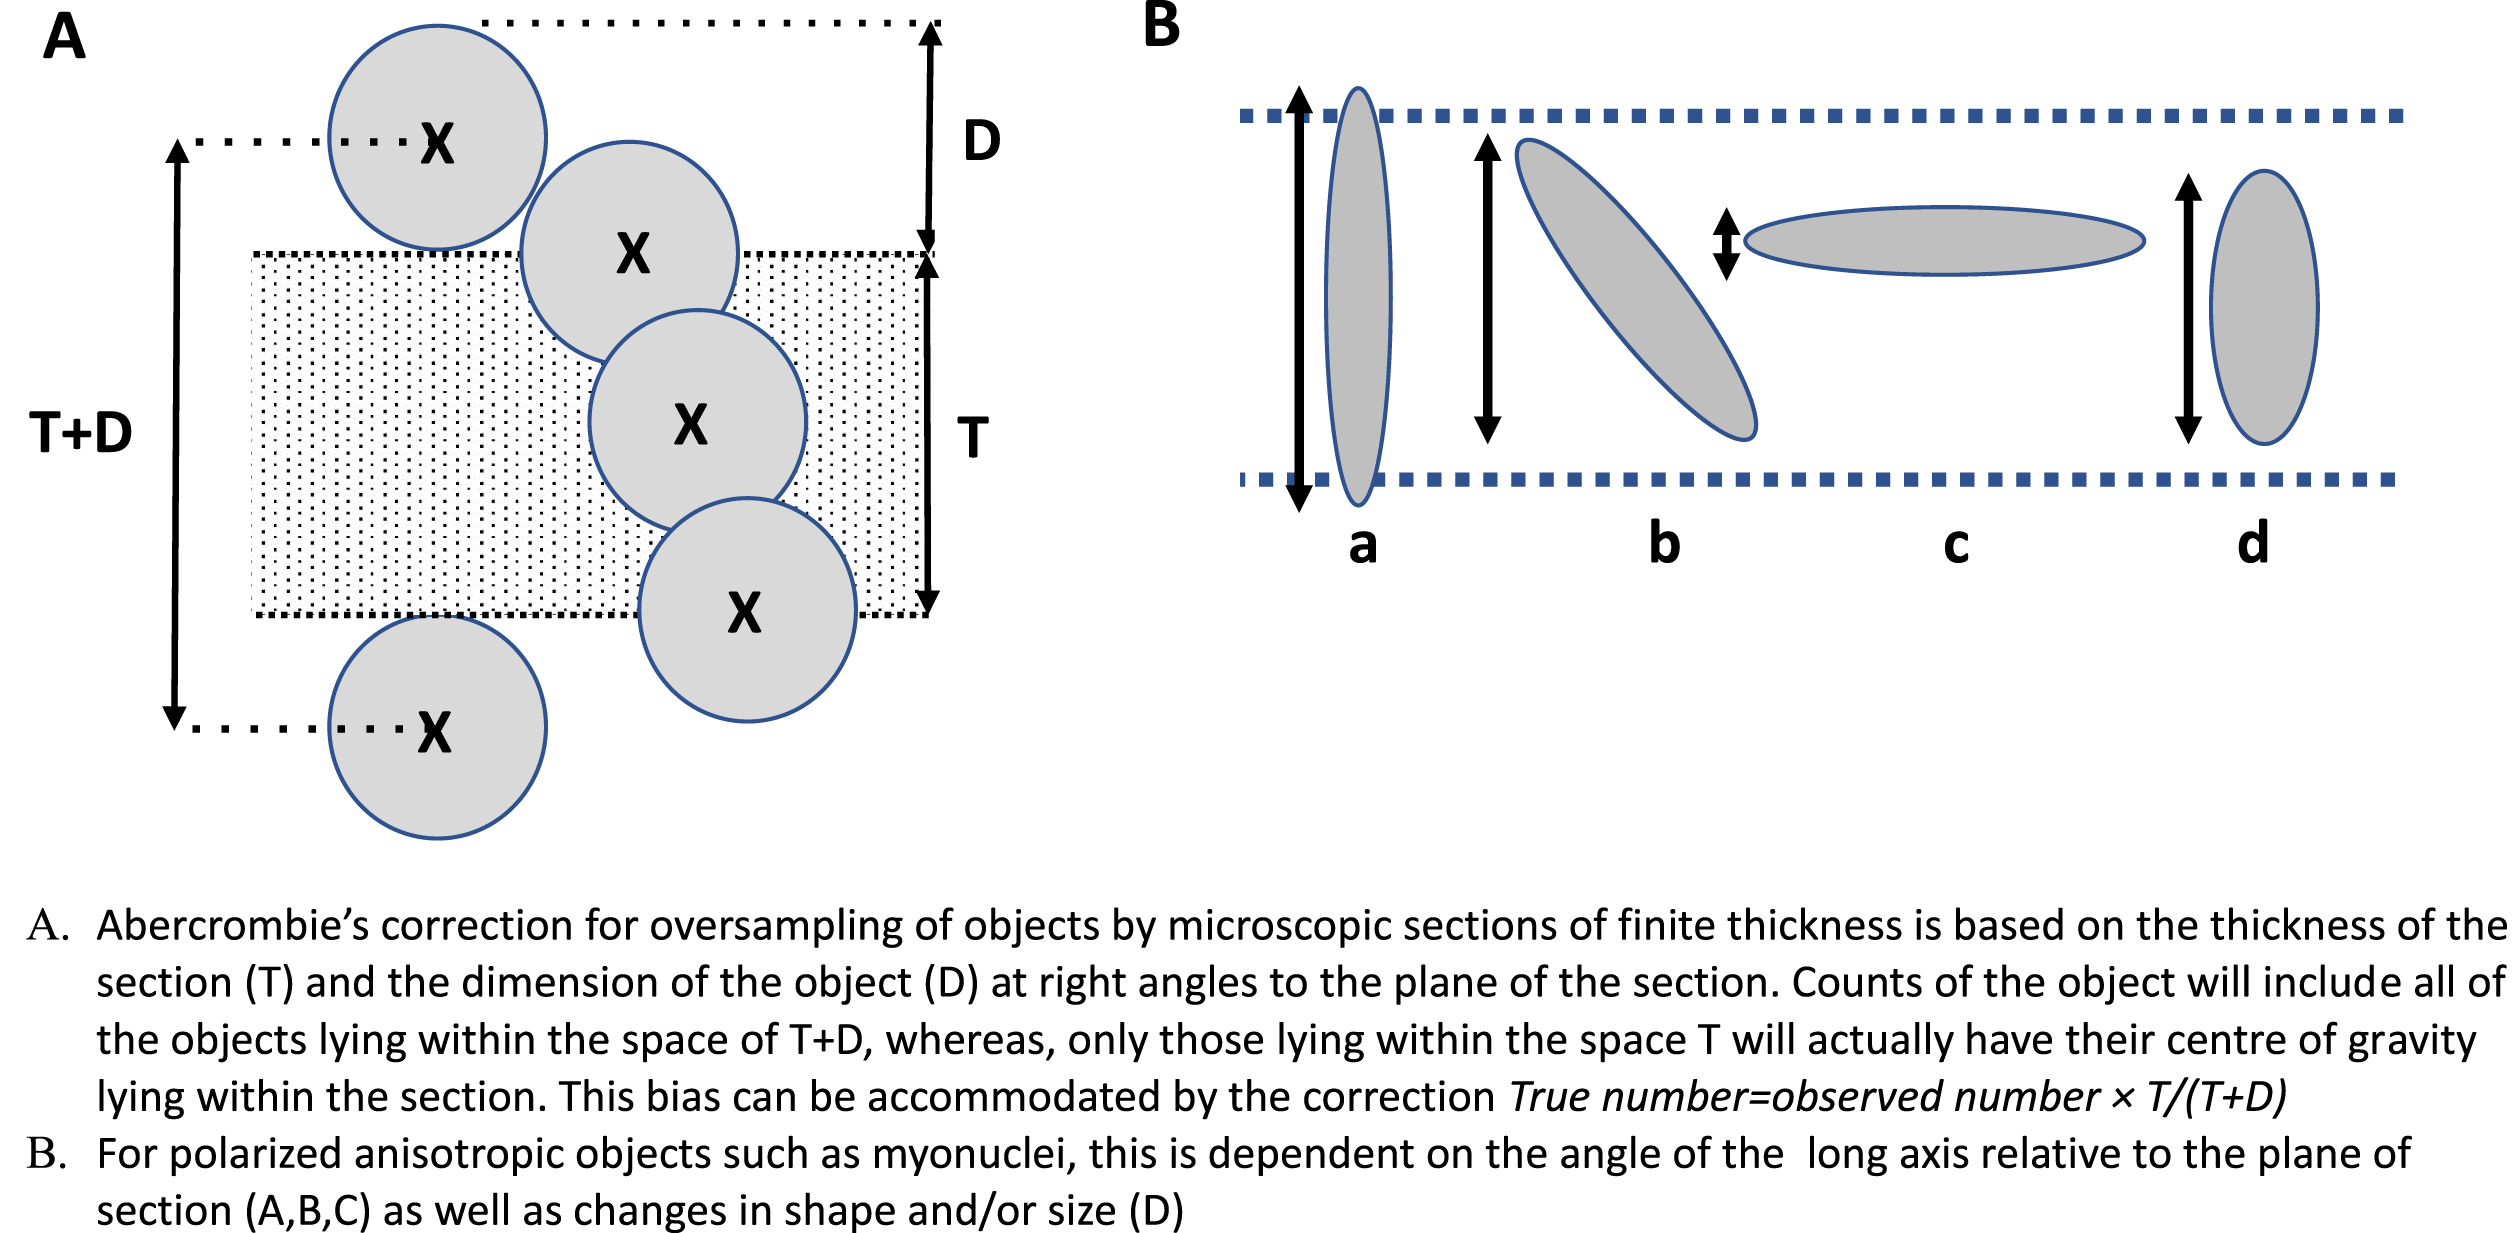
Counts of numbers of objects, by contrast, are subject to significant bias arising from the differences in object size and section thickness. Put simply, the likelihood of encountering an object within a sample area is proportional to the thickness of the section and to the size of the object at 90° to that section (Fig. 2 A). The general rule, when counting objects within sample spaces delimited by arbitrary boundaries, e.g. in a haemocytometer, is to allow for objects that fall on the edge of the defined sample area by exclusion of all objects that fall on two adjacent sides. In a haemocytometer, all objects lie fully within the sample volume, and we have only the lateral boundaries of the sample area to deal with. In microscopic sections, two further boundaries come into play, the upper and lower cut-planes. Because these intersect objects such as nuclei, only half of each of these can be considered to be lying truly within the sample volume of the section. To remove this source of bias, the objects intersected by one of the two cut-planes must be excluded from our counts within this sample volume. This issue is underappreciated in histopathological analysis and is commonly dealt with by ignoring it, to the detriment of the quality of the data. This loss of interpretable data is especially prominent in the case of skeletal muscle, where, as discussed below, it further compromised by interaction with the polarized, anisotropic structure of the tissue.
Fig. 2
Diagram illustrating the sources of counting bias in sectioned histological material. A. Taking the centre of gravity of the counted objects an arbitrary designator of their position, it can be seen that all of the objects actually seen in a section of thickness T, will be proportional to T + D, whereas the actual number lying truly within the sample space T will be proportional to T. The ratio T/T + D therefore gives an unbiased estimate of the actual number of objects lying within that sample space. B. When the object is not spherical allowance must be made for the effects of shape and orientation on the likelihood that it will lie entirely within the sample space. For simplicity, D can be replaced by its size at 90° to the plane of section.
Most protocols for unbiased morphometric sampling of tissues are based on an assumption of random distribution of the objects of interest. This is clearly not the case with skeletal muscle, where the fibres themselves, their nuclei and other organelles, together with surrounding blood vessels, nerves and interstitial connective tissue show strong orientation along the axis of contraction of the tissue. This can have a significant influence on the outcome of many types of measurement, most notably for counts of objects. Myonuclei, for instance, whose long axes are highly oriented along the fibre axis, range, from some 10–12μm long and 4–5μm wide in the mouse. In consequence, myonuclear profiles in muscle cross sections present a very different picture from those in longitudinal sections. In accord with the Delesse principle, the proportion of total area occupied by myonuclei, does not differ between cross and longitudinal sections, but in cross sections this area is distributed as numerous small, near circular, profiles while in longitudinal sections it is represented in fewer, larger, ellipsoid shapes. Thus, as considered in detail below, the greater the dimension of an object perpendicular to the plane of section, the greater the number of sections in which that object appears and thus the frequency with which it is encountered in any given section (Fig. 2B). This effect is particularly strong in the context of the conspicuous orientation of many objects in skeletal muscle where small differences in size of object or section thickness of section generate significant differences between the true number lying within the volume of that section and estimates of the number based on simple counts (see Fig. 1). For some purposes, one might be content with differences in such counts as indicators of some effect of an experimental variable. However, in so dynamic a system as skeletal muscle, this is unsafe practice. Changes in the size or orientation of nuclei in response to an experimental stimulus or to a disease condition can have marked effects on this source of bias that may outweigh true differences in nuclear density. Indeed, any alteration of the distance occupied by an object at 90° to the plane of section - for instance, change in nuclear size, shape, or orientation induced by activation of satellite cells [27] or change in function of myonuclei –will register on simple counts of sections as an apparent change in number of these nuclei.
Fig. 3
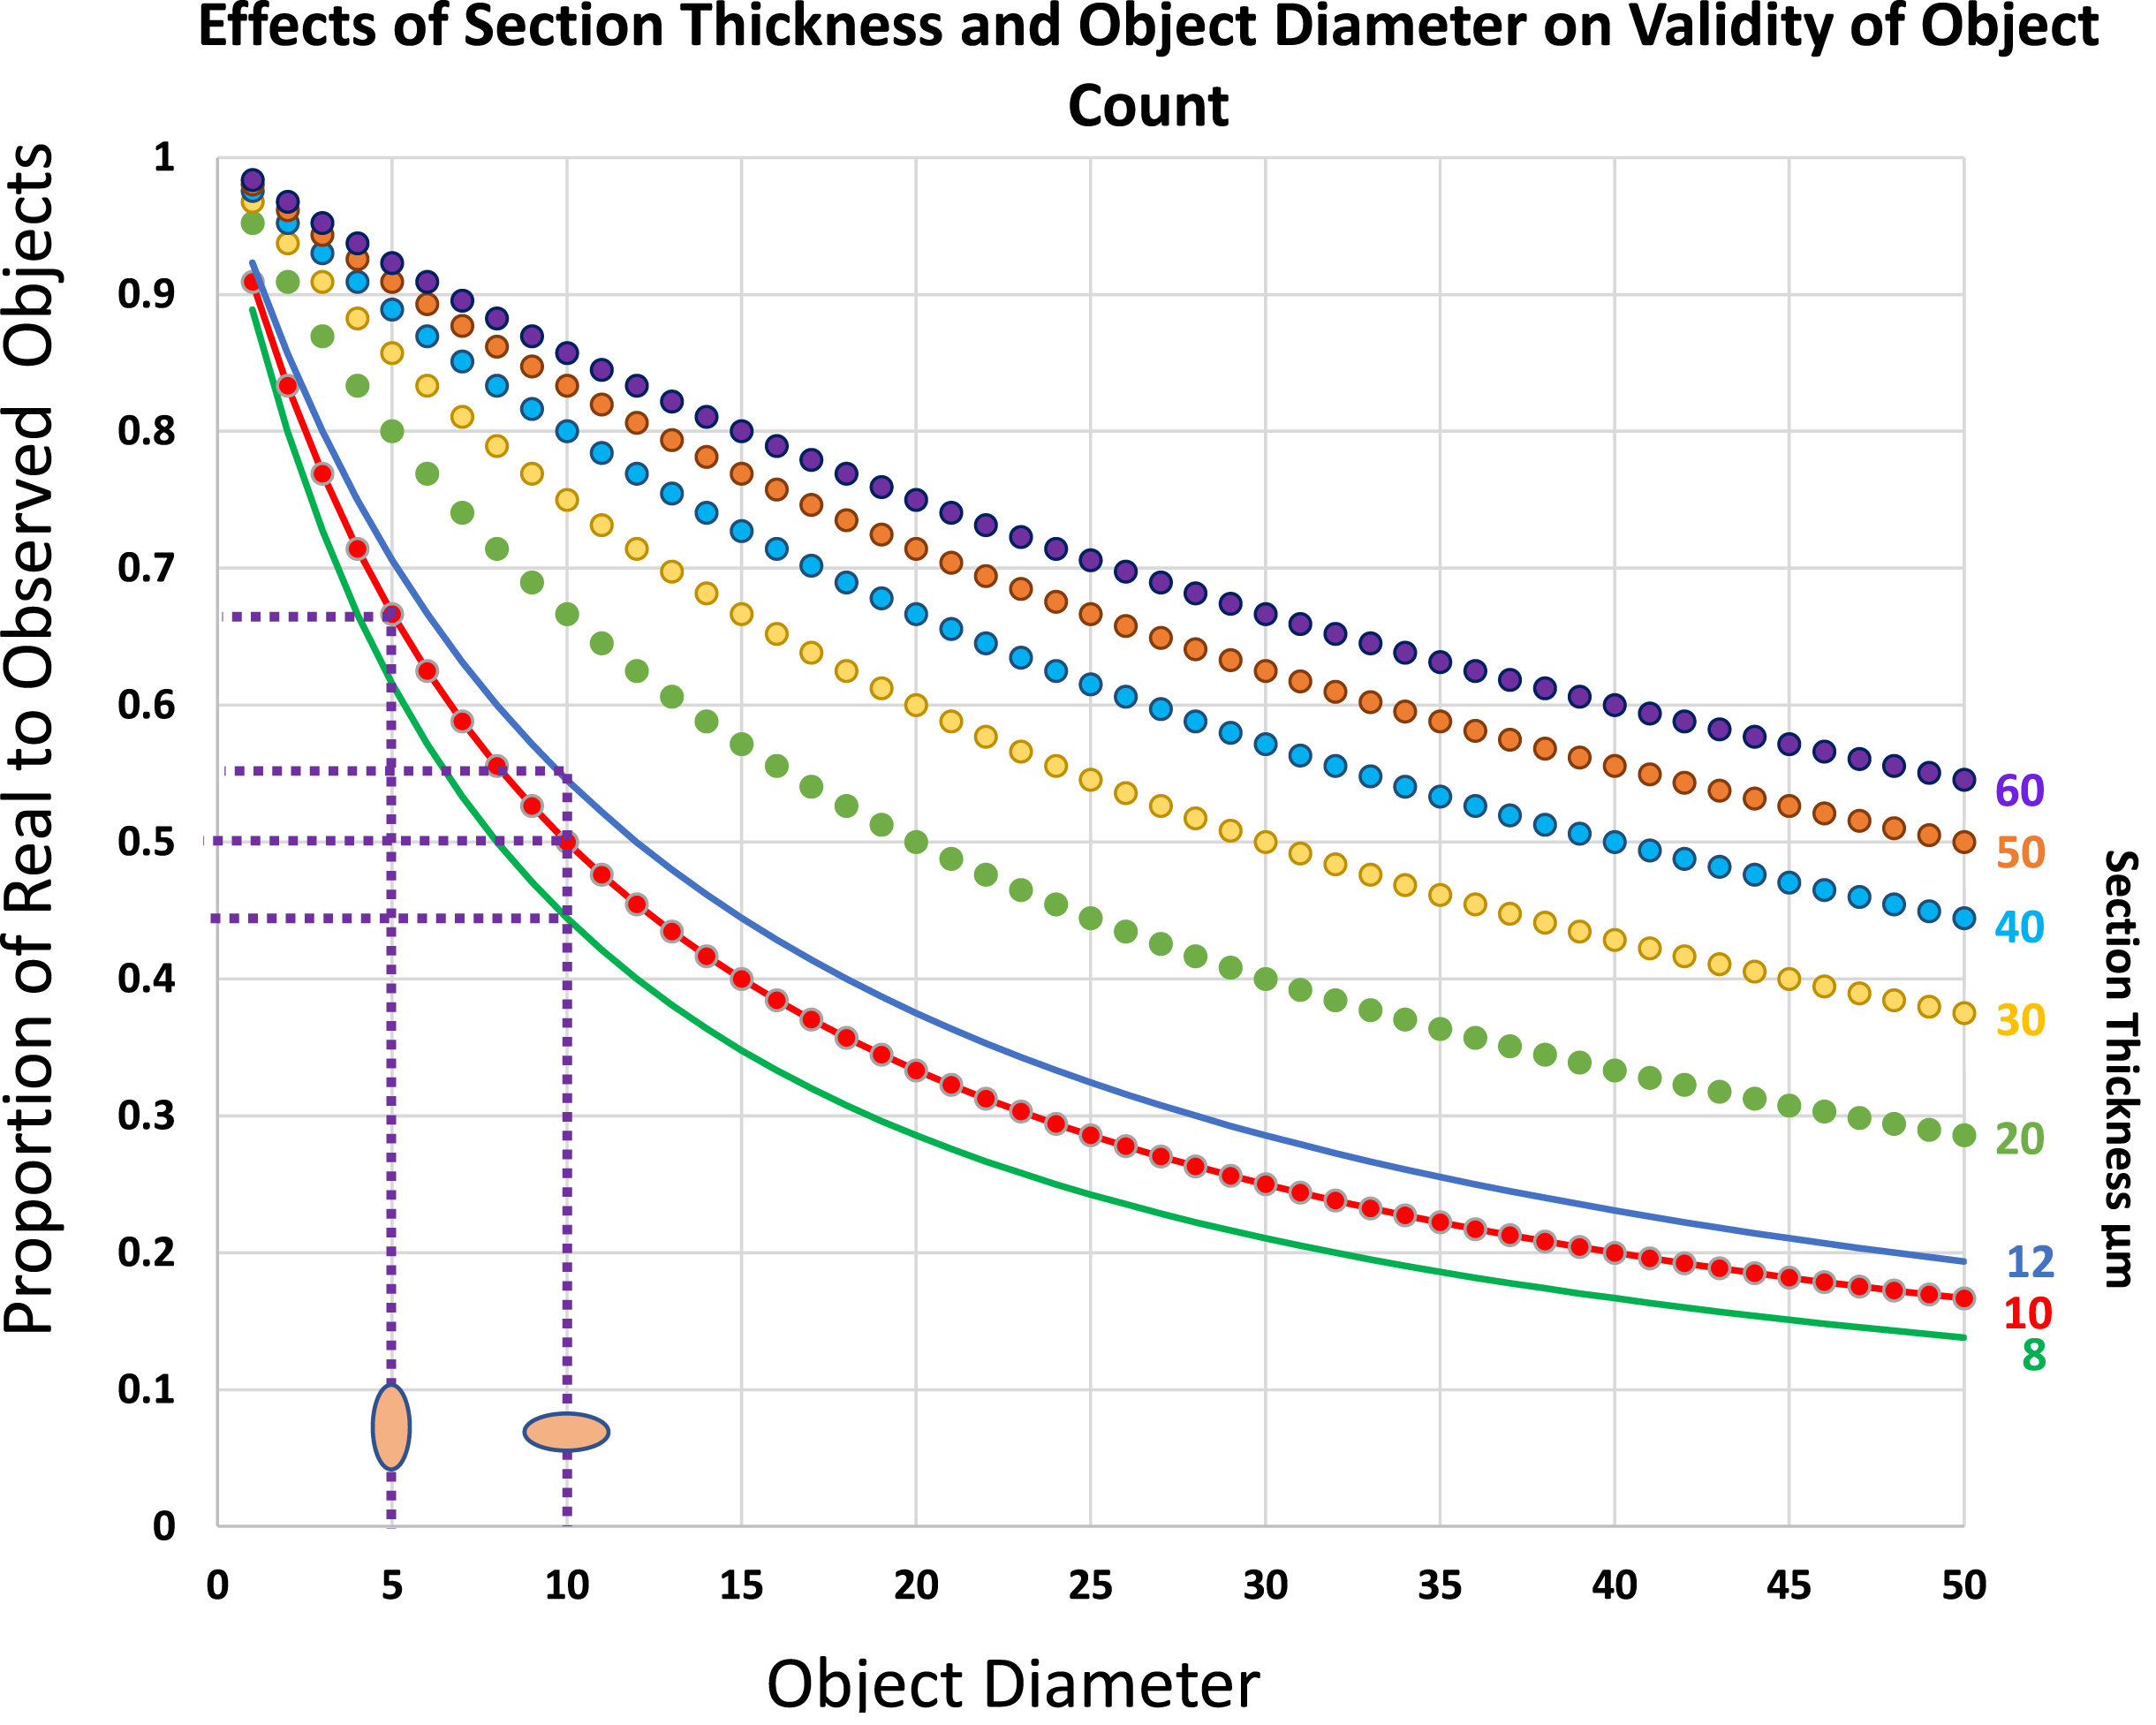
Plots to show the real number of objects per section volume as a proportion of the number of counted objects of various diameters, D, within sections of varying thickness, T. Note that within the range of sizes that commonly apply to skeletal muscle histology, the effects of small differences in either dimension of the object or of section thickness have major effects on the overestimate of object number. Thus, for a 10μm X 5μm satellite cell nucleus its number per 10μm thick section will be overestimated by a factor of 2 if its long axis lies at 90° to the plane of the section but only by a factor of 1.5 if the long axis lies parallel to the plane of section, a difference of 30%. Similarly in sections cut at a nominal thickness of 10μm, a variation of 2μm on either side would shift the over-estimate of numbers from 2.25 to 1.83, a difference of 20%.
Two main alternative approaches have been applied to this problem, the first was to count all objects in a sample area of a section and to apply a correction calculated from the section thickness and the size of the object at right angles to the plane of the section as shown in Fig. 1A [28]. This approach has been applied only rarely to skeletal muscle [29] but the simple equation
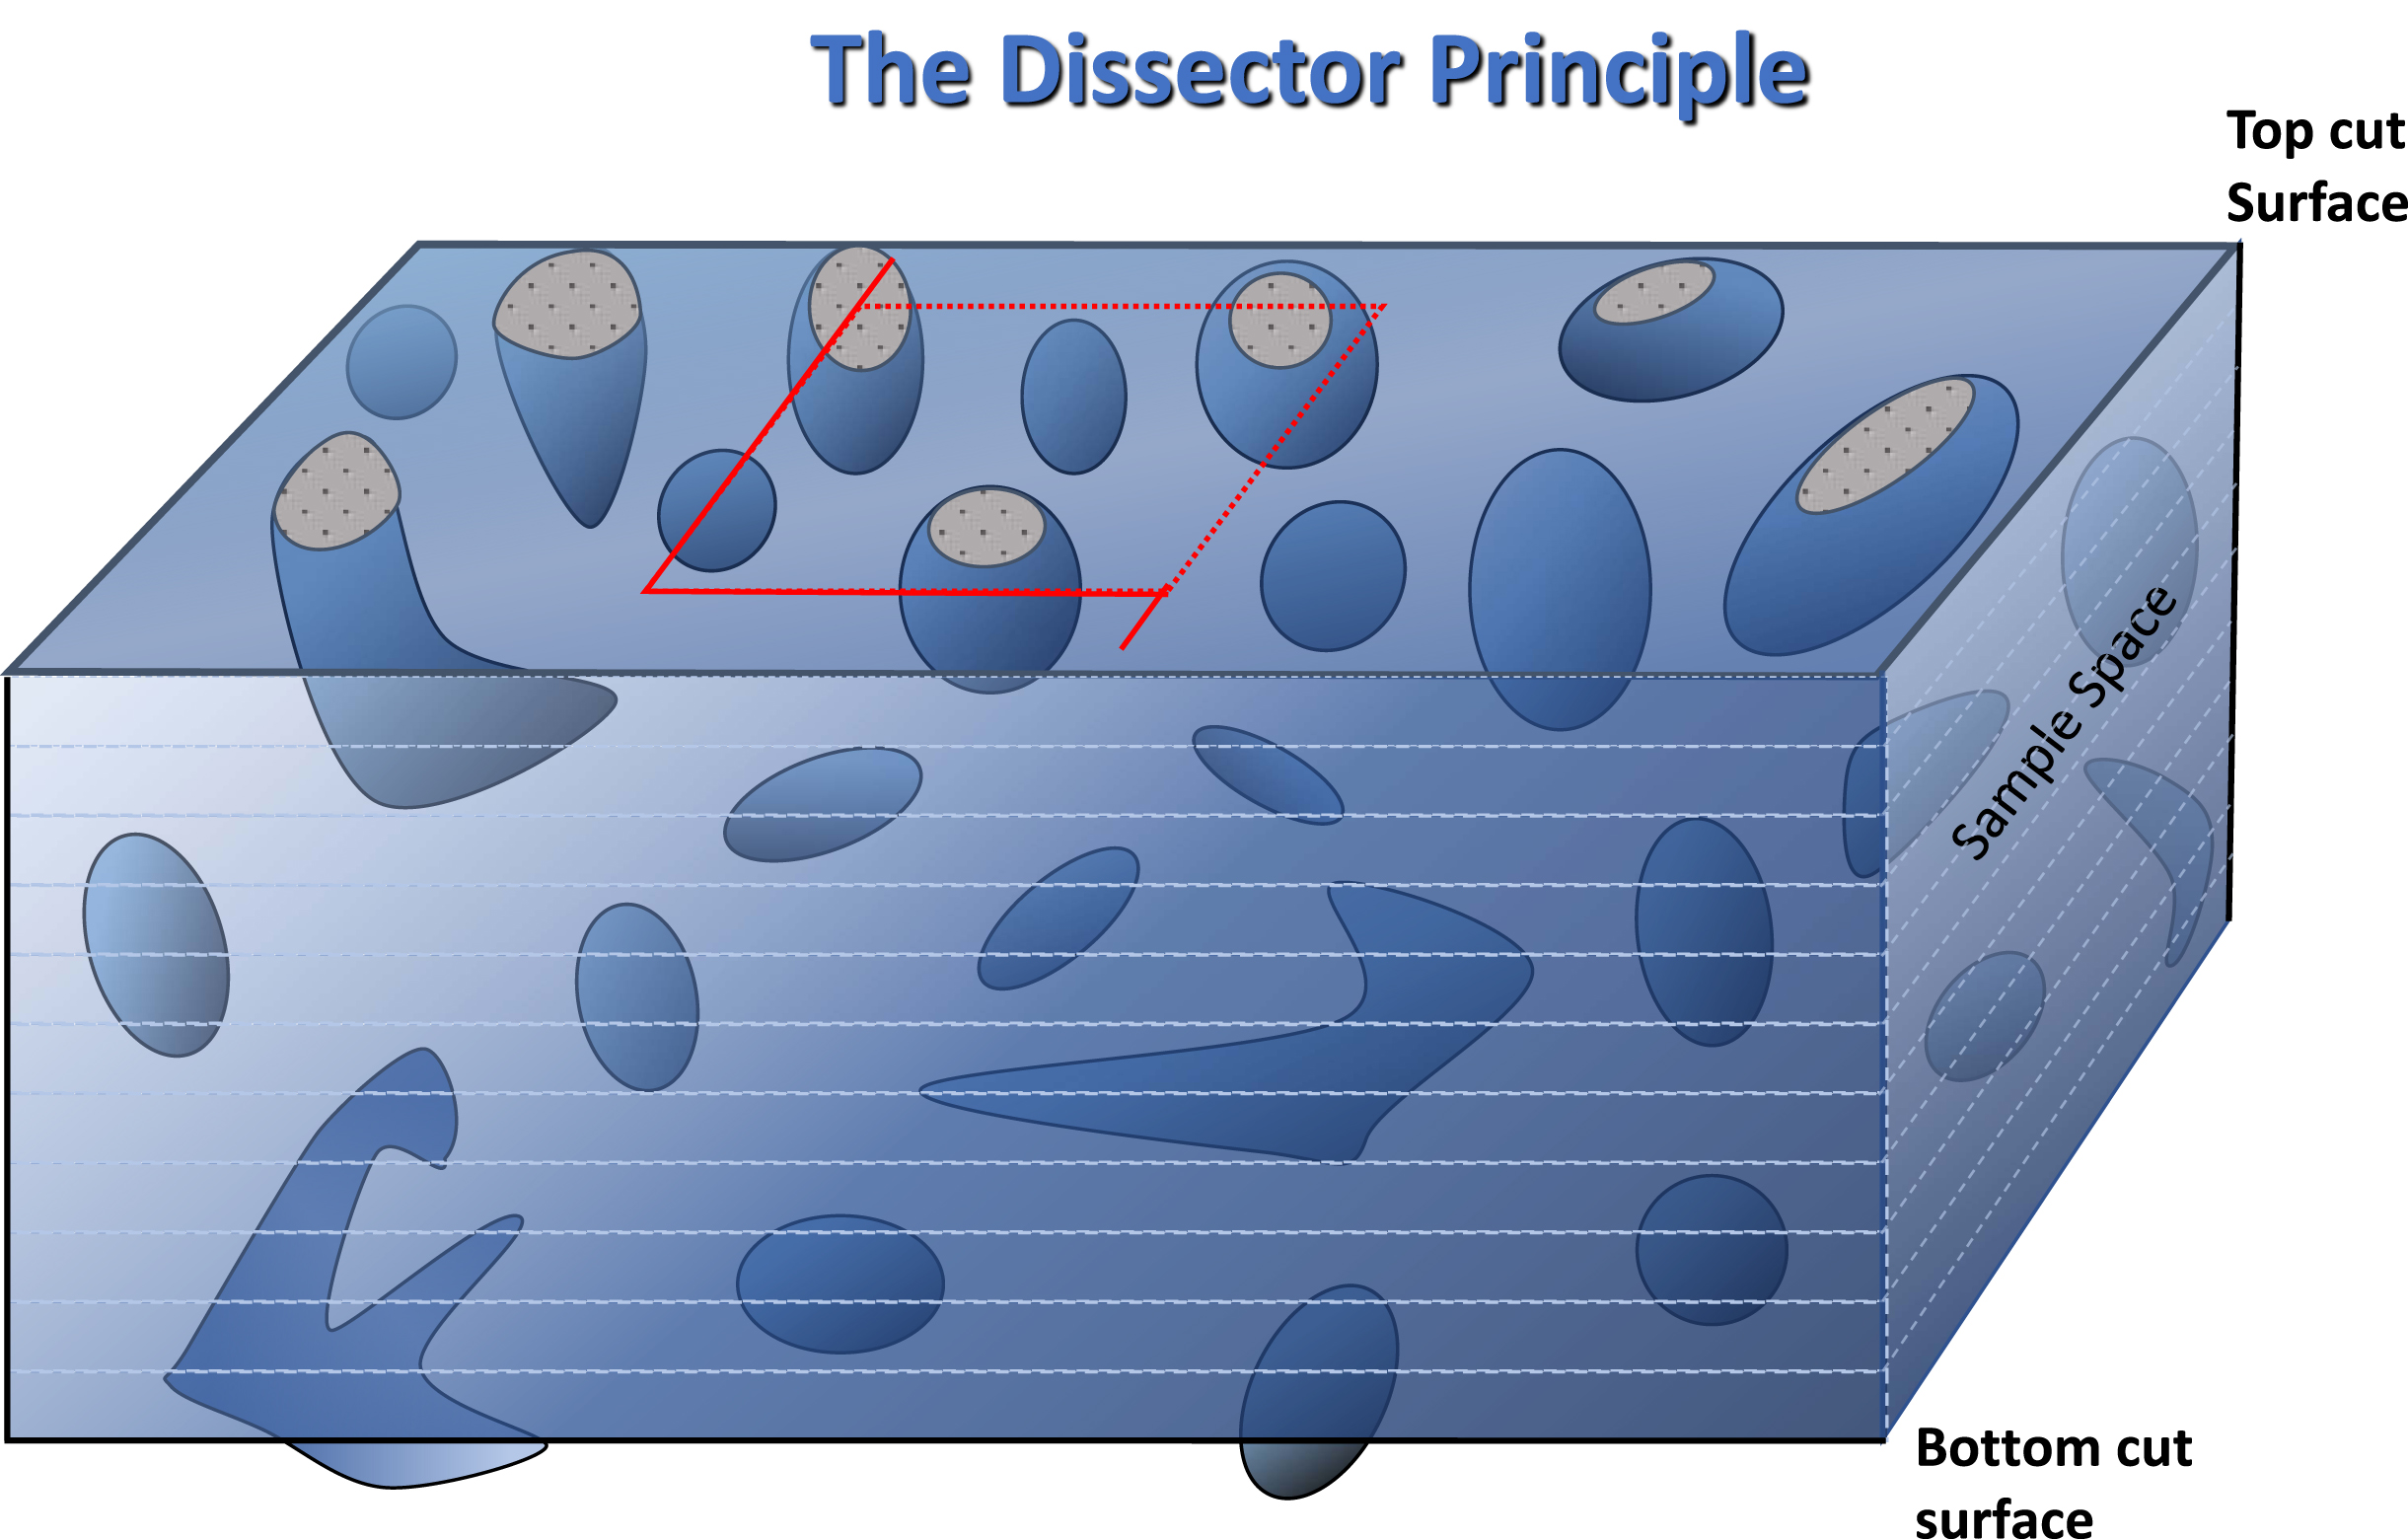
The most robust solution is the use of the ‘Dissector Principle’ to collect data in a way that, as a matter of procedure, avoids bias arising from difference in size of object and section thickness Fig. 4 [10]. This involves analysing the sample volume, by optical sectioning, across a range of depths and ignoring those objects that were present on either the upper surface or the lower surface. Where the objects and section thickness are of similar dimensions this is most easily accomplished by confocal analysis of thick sections, scanning down from the top and excluding those objects which appear on the top surface. For simple shapes, each object has only one ‘top’. Thus all subsequent encounters with further objects within the section thickness represents an unbiased sample of those objects lying within the volume of the section. An example of its rare use for analysis of skeletal muscle sections [30] produces numbers that relate absolutely to the volume of the sample, thus permitting direct comparison between a broad range of samples and experimental systems, telling us, for instance, that the density of satellite cells in human muscle (∼5×10⁵/cm3) is very similar to estimates in mouse muscle (see footnote p10).
Fig. 4
Diagram to illustrate the principles of stereological analysis of microscopic sections by confocal microscopic examination of histological sections. The region outlined in red is the sample area to be examined through the depth of the section. As in a counting chamber, objects falling on the two adjacent boundaries, by convention the upper and right-hand, shown as dashes, are counted and those lying on the remaining two, shown as solid lines, are excluded from any count. By the same argument, objects intersected by the upper cut surface are ignored and only objects encountered afresh within the depth of the section are regarded as an unbiased estimate of objects lying within the sample volume. The two solid line extensions of the square are exclusion boundaries for large irregular bjects, that may be encountered in some tissues, lying partially within the sample square.
Such universally applicable data facilitates comparisons between investigations and gives a perspective to questions whose resolution would be widely informative guides to the prospects of current therapeutic approaches to muscle disease. For example:- how many cells are needed to regenerate a kilogram of muscle; how large is the target population within the whole body for a given gene vector; how much expansion or dilution of a genetic correction would be expected during childhood growth or due to regeneration?
Initial development of the dissector principle had the misfortune to occur prior to the general availability of confocal microscopy. So, originally, the sample volume was defined by adjacent or near neighbouring sections, which, for most objects, required a means of confirming register between two sections, making the procedure unattractively cumbersome. Confocal microscopy has greatly, alleviated this problem for most microscopic objects, both by assuring the identity of the object across a set of optical sample planes and by providing accurate estimates of the separation in the Z axis and of the depth of the sample volume. This latter is especially important with cryostat sections, which are difficult to cut to a reliable thickness, but which are more broadly useful for investigations with marker-specific antibodies as, for instance in a stereological survey of the numbers of myonuclei and satellite cells per volume of muscle.
The sensitivity of this approach rises with the section thickness relative to object-size but raises the question of penetration of antibodies through thick sections and loss of signal strength with depth of focus. Whether this is a serious problem in any given instance may be evaluated by plotting the density of objects identified with any particular marker against section thickness.
For electron microscopy, section thickness, at ∼50 nm is sufficiently close to zero, by comparison with the objects the size of cells or nuclei to be regarded as a 2-dimensional sample that permits application of the Delesse principle for estimation of volume and surface ratios [31], but the number of sections required to adequately sample such objects for counting by use of the dissector principle is too unwieldy for general use. However recent developments in obtaining and managing serial images from adjacent section planes [32–34] have provided straightforward approaches to application of dissector analysis as a means of obtaining unbiased counts of objects of comparable size to the section thickness e.g. of synapses within the CNS.
Summary of stereological issues
Problem:- counts of objects of common interest, e.g. nuclei in microscopic sections, are subject to significant over-estimation arising from small differences in section thickness and object size.
1. This source of bias can be minimized by use of the dissector principle [37] Such absolute information assumes increasing value in the evaluation of systemically delivered therapeutic genetic constructs, where the number of target nuclei and their potential for dilution of the constructs with growth and regeneration have become important ‘unknowns’ in the design of dosing regimens.
2. I am unaware, at present, of any computer program to automate application of the Dissector approach to gathering of numerical data from sections of skeletal muscle. The algorithm is, in principle, quite simple. It comprises a scan from the upper cut surface to the lower cut surface, with consignment of all relevant objects encountered on the top surface to the uncounted category and counting of all subsequently encountered such objects as lying in the sample volume between the two surfaces.
DENOMINATOR PROBLEMS
An intrusive fundamental issue with all biological comparison arises from the measurement of numerical data as ratios against some selected denominator. Denominators commonly differ between different types of assay and even between variants of nominally the same assay. Despite the co-equal part played by the denominator and numerator in these ratios, the former is seldom given its due attention. The denominator is, in effect, the sample space within which we collect the numerator values that we display as data and to which we attach meaning. As such, the size and distribution of the denominator are as important as the numerator to the interpretation of data. As a further complication, it is not uncommon to find data expressed in the form of a ratio between two measures that are themselves ratios. Such ‘stacked ratios’ distance us from the underlying phenomena we are seeking to understand and complicate our attempts to model them. Lack of attention to these matters has been cast as one of the major sources of irreproducibility in preclinical and clinical research [1]. It is especially prominent as a source of ‘noise’ in investigations where findings are expressed as fold change against near-zero baselines.
The highly ordered structure of skeletal muscle tissue, extending from the molecular level to gross anatomical arrangement, presents a broad selection of potential denominators, choice of which, should be carefully examined in each individual case, especially where the data is gathered from histological cross sections, when it impinges heavily on the way we interpret our data. By virtue of their numerical, structural, and functional prominence in skeletal muscle, myofibers have tended to dominate the quantitative scene, sometimes as numerators, but more commonly as denominators. It is technically challenging to obtain a reliable count of the numbers of fibres; even in a simple, 2-tendon muscle the pennate arrangement predicts that fibre profiles in most sections represent only a partial sample of the total number fibres in the whole muscle and any section containing one or more tendons will not include fibres that have inserted on one side or other of the level of the section. The best we can do, for the most part, is to make counts on an arbitrarily identified mid-muscle section.
It must also be recognized that muscle fibres themselves are highly responsive to changes in conditions and therefore not particularly stable features as a basis for making comparison between pathologies, or across a time-course, or between the effects of treatments of interest. Thus, investigations that use muscle fibre profiles in transverse sections as a normalizer of the number of satellite cells, or other interstitial cells should be accompanied by information as to the effect of the experimental variable on muscle fibre size, packing density and length. Another commonly cited measure is the incidence of ‘centrally nucleated fibres’, i.e. fibres containing myonuclei that are not closely subjacent to the muscle fibre surface. This is widely used as a semi-quantitative indicator of prior or current regeneration in both man and mouse, and usually expressed as the percentage fibres containing a ‘central’ nucleus. A switch to the myonuclei themselves as denominators of the numbers at each position within in each fibre, reorients enquiry of the phenomenon from its use simply as a crude indicator of prior pathology and opens questions more relevant to the causal mechanisms that underlie positioning of nuclei within muscle fibres and perhaps of the likely functional consequences within the fibre of such placement. If both denominators are taken into consideration, then the total number of myonuclei per muscle fibre volume and their position within each fibre take their place as further features to aid our quest to understand the biological events that underlie the phenomenon of regeneration as a whole. Thus, such analysis improves sensitivity of measurement of the duration of the central positioning of myonuclei [35]. It is, perhaps, a commentary, on the casual collection of such data, that over 30 years of study it has been recorded only recently that mdx mouse muscle develops twice the myonuclear density of the equivalent wild-type mouse and that those in a central position are supernumerary rather than simply displaced nuclei [12, 13]. To miss a 100%difference of such import, does not speak well of standard practice. It is notable that this change of interrogative mode extends our questions from: ‘what mechanisms are responsible for the position of these myonuclei?;’ by the addition of the new questions: ‘what mechanisms are responsible for the doubling in their number?’ and ‘what are all of these extra centrally positioned nuclei doing?”. Such questions lie in wait for those with interests in characterizing gene expression profiles in single nuclei. The obvious follow-up: ‘are similar nuclei present in DMD muscle?’, will require the application of stereological analysis.
A further a major factor in the interpretability of incidence data within dynamic systems of the type involved in homeostasis of muscle, is the duration of the identifying feature. This can vary considerably between species and probably between muscles. Central nucleation in the mouse, perhaps because it is very persistent, is more conspicuous than in man [35, 36]. This persistence makes it a poor indicator of the dynamics of the process and, in consequence, greatly diminishes its value as an index of degenerative/regenerative activity beyond the first few weeks of onset of a myopathic event. In man, incidence of centrally nucleated fibres of more than 4%is regarded as a strong signal of current pathology [2], but whether this is a manifestation of similar mechanisms to those that operate in the mouse is uncertain. As a comparison, a second commonly used measure of the intensity of regeneration, the incidence of fibres expressing developmental myosin isoforms persists for only 5–7 days in the mouse [37], making it a valuable signal of recent regeneration. In man, the duration of developmental myosin isoform expression is unknown, again limiting its usefulness as a marker [38]. A similar problem of short-lived identification signals arises from the use of satellite cell numbers as indicators of myogenic activity during regeneration. In this highly dynamic process, the rapidity of transit from activation through to fusion [39] renders such snapshot counts uninformative; does a diminution in their number signify a reduction in their generation or an increase in their rates of differerentiation and fusion, or both?
Summary of denominator problems
Problem:- The extensive and complex interactive nature of the cell populations within skeletal muscle raises questions as to how to normalize data on any of them individually.
1. The most broadly informative array of numerical data would consist of the numbers of nuclei and the volume sampled, together with a measure of total muscle weight/volume. Additional reference denominators such as muscle fibres, nerves, blood vessels, should be chosen to test the hypothesis in question rather than on the basis of convenience.
MUSCLE DISSOCIATION
Recent research studies in animal models and in human trials, have taken the quite different tack of analysing the cellular content of muscle by dissociating it and sorting the resultant cell suspension for analysis of aberrations of myogenic function, or of protein content or evidence of expression of genes suspected of playing some part in this malfunction. Initially, prior to the discovery of antigenic markers of cell types of interest, most investigations of this type employed differential adhesion [40] or cell size and granularity as criteria [41] for separation of different cell types and sub-populations. Early investigations of such cells concentrated mainly on the in vitro behaviour of the distinguishable cell types present in these populations, principally on their myogenic proclivities versus those favouring formation of fibrous scar tissue or fatty tissue. This approach had become progressively sophisticated by development of cell-sorting techniques made available by the advent of a range of antigenic markers [42–48], supplemented, more recently, by in situ RNA hybridization to locate sites of expression of specific genes and by editing of specific genes to provide visualizable signals of their active expression [39, 49–51]. These advances have greatly enhanced the precision of cell identification and accelerated the overall aim of relating molecular and structural data to the clinical and pathological status of the muscle. The goal of this work is the ideal of marrying up the findings derived from analysis of the population of isolated cells with those obtained from the histological investigations of the intact tissue and, thus, to generate a coherent overall picture of the status of the muscle and some understanding of the processes underlying this status [39]. Each of these modes of investigation is subject to its individual array of artefacts and biases that must be taken into account in the interpretation of the emerging data, for such features are covertly disruptive of our attempts to meld the data from a variety of types of investigation into a coherent whole [50].
The attraction of dissociated muscle preparations is the facility for detailed analysis of individual cell types, together with an automated detailed record of their proportions within the extracted population. Recent advances in methods for characterizing individual cells in terms of an array of antigens displayed by each one has greatly enhanced understanding of the complexity of interactions between different cell types [52–55]. More direct information on the predilection of individual cells to specific functional pathways comes from the use of constructs that permit interrogation of the assortment of genes they were expressing at the time of isolation and of subpopulations within these cell types derived from normal and pathological of murine [56–58] and human [59–62] muscles. These advantages are tempered by the loss of spatial and numerical relationships between the cells involved. Procedures for isolating individual cells from the tissue perturb their inter-relationships [63, 64] and must be considered likely to have differential effects on the efficiency with which each type is retrieved, thus losing the intrinsic denominators that are available for standardization within the intact tissue. This constitutes a prime example of stacked ratios, presenting a considerable barrier to interpretation of the data in terms of what is actually occurring within the tissue of origin and leaving us with two clear problems.
First, it deprives us of adequate means of assessing biases arising from the rigours of the protocols for dissociation and analysis [63], where efficiency of extraction from a tissue may be affected by its prior and current pathology and by varying resilience of the cells to the sorting procedure associated with their activation or metabolic status. Without such information we are unable to attribute firm causes to any observed differences between proportions of identified cell types. Have they arisen from difference in success of extraction, or survival, or are they, as we might hope, directly reflective of the in vivo mechanisms of the innate pathology of interest, or perhaps of our attempts to modify that pathology?
A second major bias of more subtle origin derives from presentation of data in terms of percentages of cells with no assurance as to the representativeness of the sample from which they are drawn. Published data [48, 65, 66] and personal enquiry, puts the yield of satellite cells isolated and sorted from mouse limb muscle in the order of 0.5 –1×10⁵ /g, whereas calculation from the numbers of satellite cells on isolated EDL muscle fibres would set the number actually resident in muscle at some 10–20 fold greater2 . As with polls of public opinion based on limited sampling density, reliability is strongly dependent on recognition of and adjustment for the biases intrinsic to the data gathering procedure. For cells sorted from skeletal muscle, in the context of a set of only partially identified potential selective influences arising from the extraction and assessment procedure, a swathe of uncertainty befouls precise interpretation. This becomes important where the pathology involves a major change in number of a specific cell type, as seen prominently with the transient immigrant populations of inflammatory cells in myonecrotic or immune pathologies. In such instances, the change in overall cell number can lead to changes in the proportions of minor cellular components of the population that do not necessarily reflect differences in the numbers of each component cell type in the tissue from which they were extracted. Fibre isolation procedures, are potentially subject to the problem of loss of satellite cells from the fibres. But, in this instance, the myonuclei within the co-extracted fibres carrying the satellite cells provide a common reference with histological sections, that can be used to determine the extent of any such loss in any given circumstance [12].
Summary of muscle dissociation issues
Problem:- extraction and sorting of cells from intact muscle tissue disrupts their inter-relationships and exerts a range of selective constraints on the yields of cells of different phenotypes and states of activity, preventing firm assignment of the numerical data within the tissue of origin.
1. Interpretation of complex ratio data would be aided by expressing all data from preclinical models against a broadly applicable denominator, e.g. per starting weight/volume of muscle.
2. The above can be linked to stereological counts of each identified cell type in histological sections, which employs the same denominator and thus permits estimation within the original sample of the absolute frequency of each cell type of interest. Such a format would provide a means of comparing data between samples, protocols, pathologies, or experimental procedures. For preclinical research, where our aim is to produced data from animal model experiments that can be compared with confidence to the nearest human equivalent data, we must choose our denominators thoughtfully.
OVERALL CONCLUSIONS
Sampling of skeletal muscle for diagnostic purposes has, in recent years, partly ceded its once central role in histopathology to a broader set of applications in aiding the rapid advance of fundamental cell biological research made accessible by the toolkits developed for genetic and molecular biological research. In consequence, structural analysis has become a crucial tool for investigating the connection between molecular and functional defects in this tissue. In this respect, the recent development of the facility for characterizing individual isolated cells and using these same markers in sectioned muscle to determine the structural inter-relationships of these cells in intact muscle [39, 46, 49, 50, 56], hold new promise of resolving the in vivo versus in vitro issues that, historically, have beset this type of investigation.
However, our current approach to analysis of the structure of muscle samples has yet to benefit from adoption of quantitative analytical methods that have long been available but little used. Routine application of well-developed stereological approaches would provide a basis for investing molecular biological findings with absolute standards, related to cell number, that would permit their application to the scale of whole muscle or whole body biology. This ability to span scale and species is important if we are to strengthen the prospects of converting our preclinical findings at the molecular and cellular level to realistic routes for treatment of muscle deficit and disease in Homo sapiens.
Over the past few years, analysis of tissue samples has concentrated on automation of tasks that, historically, have consumed the time of expert histopathologists. This entails investment in the use of machine learning, in the hope of incorporating some of the virtues of ‘experience’ into automated objective analyses that recognize and make appropriate accommodation to preparative artefacts, such as scoring from knife defects and edge-effects induced by desiccation of the sample. By comparison, the automation of stereological analysis should be a relatively simple exercise and could be set to gather large amounts of quantitative data against all informative denominators. These should be chosen for their relevance to basic biological features of disease and, of hypothetical predicted modifications of these features induced by therapeutic stratagems. Versatility of structural/molecular biological data can be optimized by selection of denominators that are applicable to each of the modes of investigation. For instance, choice of cell number (or diploid genomes) per sample would, in principle, provide access to the ‘Holy Grail’ of establishing direct quantitative relationships between data on gene/protein expression and the structure and function of the tissue in which they are being expressed.
ACKNOWLEDGMENTS
This article was written while partially supported by the National Institutes of Health NIAMS R21AG051260; T32AR056993, Foundation to Eradicate Duchenne, Muscular Dystrophy Association (MDA295203, Parent Project Muscular Dystrophy, and Duchenne Parent Project Netherlands and the Intramural Research Program of the National Institutes of Health, NINDS.
I am indebted to the following friends and colleagues for advice and suggestions for improvement of the manuscript.
Shin’ichi Takeda, Miranda Grounds, Caroline Sewry, Jyoti Jaiswal, James Novak, Marshall Hogarth, Davi Mazala, Prech Uapinyoying, Francesco Muntoni, Rahul Phadke, Bill Duddy
REFERENCES
[1] | An G . The Crisis of Reproducibility, the Denominator Problem and the Scientific Role of Multi-scale Modeling. Bull Math Biol. (2018) ;80: (12):3071–80. |
[2] | Dubowitz V , Sewry CA , Oldfors A . Muscle Biopsy: A Practical Approach: Elsevier; (2013) ;572. |
[3] | Haun CT , Vann CG , Roberts BM , Vigotsky AD , Schoenfeld BJ , Roberts MD . A Critical Evaluation of the Biological Construct Skeletal Muscle Hypertrophy: Size Matters but So Does the Measurement. Front Physiol. (2019) ;10: :247. |
[4] | Brooke MH , Engel WK . The histographic analysis of human muscle biopsies with regard to fiber types. 4. Children’s biopsies. Neurology. (1969) ;19: (6):591–605. |
[5] | Brooke MH , Engel WK . The histographic analysis of human muscle biopsies with regard to fiber types. 3. Myotonias, myasthenia gravis, and hypokalemic periodic paralysis. Neurology. (1969) ;19: (5):469–77. |
[6] | Brooke MH , Engel WK . The histographic analysis of human muscle biopsies with regard to fiber types.2. Diseases of the upper and lower motor neuron. Neurology. (1969) ;19: (4):378–93. |
[7] | Brooke MH , Engel WK . The histographic analysis of human muscle biopsies with regard to fiber types. 1. Adult male and female. Neurology. (1969) ;19: (3):221–33. |
[8] | Brooke MH , Williamson E , Kaiser KK . The behavior of four fiber types in developing and reinnervated muscle. Arch Neurol. (1971) ;25: (4):360–6. |
[9] | Brooke MH , Kaiser KK . Muscle fiber types: how many and what kind? Arch Neurol. (1970) ;23: (4):369–79. |
[10] | Boyce RW , Dorph-Petersen KA , Lyck L , Gundersen HJ . Design-based stereology: introduction to basic concepts and practical approaches for estimation of cell number. Toxicol Pathol. (2010) ;38: (7):1011–25. |
[11] | Morgan JE , Prola A , Mariot V , Pini V , Meng J , Hourde C , et al. Necroptosis mediates myofibre death in dystrophin-deficient mice. Nat Commun. (2018) ;9: (1):3655. |
[12] | Duddy W , Duguez S , Johnston H , Cohen TV , Phadke A , Gordish-Dressman H , et al. Muscular dystrophy in the mdx mouse is a severe myopathycompounded by hypotrophy, hypertrophy and hyperplasia. SkeletalMuscle. (2015) ;5: :16. |
[13] | Mazala DA , Novak JS , Hogarth MW , Nearing M , Adusumalli P , Tully CB , et al. TGF-beta-driven muscle degeneration and failed regeneration underlie disease onset in a DMD mouse model. JCI Insight. (2020) ;5: (6). |
[14] | Dubowitz VS , Oldfors CA . Muscle Biopsy: A Practical Approach. 4th ed: Elsevier; (2020) ;2020. |
[15] | Reyes-Fernandez PC , Periou B , Decrouy X , Relaix F , Authier FJ . Automated image-analysis method for the quantification of fiber morphometry and fiber type population in human skeletal muscle. Skeletal Muscle. (2019) ;9: (1):15. |
[16] | Rosenblatt JD , Lunt AI , Parry DJ , Partridge TA . Culturing satellite cells from living single muscle fiber explants. In Vitro Cellular Developmental Biology. (1995) ;31: :773–9. |
[17] | Bockhold K , Rosenblatt J , Partridge T . Aging normal and dystrophic mouse muscle: analysis of myogenicity in cultures of living single fibres. Muscle & Nerve. (1998) ;21: :173–83. |
[18] | Blaveri K , Heslop L , Yu DS , Rosenblatt JD , Gross JG , Partridge TA , et al. Patterns of repair of dystrophic mouse muscle: studies on isolated fibers. Developmental dynamics: an official publication of the American Association of Anatomists. (1999) ;216: (3):244–56. |
[19] | Pichavant C , Pavlath GK . Incidence and severity of myofiber branching with regeneration and aging. Skeletal Muscle. (2014) ;4: :9. |
[20] | Irintchev A , Wernig A . Muscle damage and repair in voluntarily running mice: strain and muscle differences. Cell Tissue Res. (1987) ;249: (3):509–21. |
[21] | Wernig A , Irintchev A , Weisshaupt P . Muscle injury, cross-sectional area and fibre type distribution in mouse soleus after intermittent wheel-running. J Physiol. (1990) ;428: :639–52. |
[22] | Faber RM , Hall JK , Chamberlain JS , Banks GB . Myofiber branching rather than myofiber hyperplasia contributes to muscle hypertrophy in mdx mice. Skeletal Muscle. (2014) ;4: :10. |
[23] | Verma M , Murkonda BS , Asakura Y , Asakura A . Skeletal Muscle Tissue Clearing for LacZ and Fluorescent Reporters, and Immunofluorescence Staining. Methods Mol Biol. (2016) ;1460: :129–40. |
[24] | Verma M , Asakura Y , Murakonda BSR , Pengo T , Latroche C , Chazaud B , et al. Muscle Satellite Cell Cross-Talk with a Vascular Niche Maintains Quiescence via VEGF and Notch Signaling. Cell Stem Cell. (2018) ;23: (4):530–43 e9. |
[25] | Neal A , Boldrin L , Morgan JE . The satellite cell in male and female, developing and adult mouse muscle: distinct stem cells for growth and regeneration. PLoS ONE. (2012) ;7: (5):e37950. |
[26] | Liu Y , Schwartz AG , Hong Y , Peng X , Xu F , Thomopoulos S , et al. Correction of bias in the estimation of cell volume fraction from histology sections. J Biomech. (2020) ;104: :109705. |
[27] | Webster MT , Manor U , Lippincott-Schwartz J , Fan CM . Intravital Imaging Reveals Ghost Fibers as Architectural Units Guiding Myogenic Progenitors during Regeneration. Cell Stem Cell. (2016) ;18: (2):243–52. |
[28] | Abercrombie M . Estimation of nuclear population from microtome sections. Anat Rec. (1946) ;94: :239–47. |
[29] | Keefe AC , Lawson JA , Flygare SD , Fox ZD , Colasanto MP , Mathew SJ , et al. Muscle stem cells contribute to myofibres in sedentary adult mice. Nat Commun. (2015) ;6: :7087. |
[30] | Sajko S , Kubinova L , Cvetko E , Kreft M , Wernig A , Erzen I . Frequency of M-cadherin-stained satellite cells declines in human muscles during aging. J Histochem Cytochem. (2004) ;52: (2):179–85. |
[31] | Weibel ER , Kistler GS , Scherle WF . Practical stereological methods for morphometric cytology. J Cell Biol. (1966) ;30: (1):23–38. |
[32] | Merchan-Perez A , Rodriguez JR , Alonso-Nanclares L , Schertel A , Defelipe J . Counting Synapses Using FIB/SEM Microscopy: A True Revolution for Ultrastructural Volume Reconstruction. Front Neuroanat. (2009) ;3: :18. |
[33] | Peddie CJ , Collinson LM . Exploring the third dimension: volume electron microscopy comes of age. Micron. (2014) ;61: :9–19. |
[34] | Peddie CJ , Blight K , Wilson E , Melia C , Marrison J , Carzaniga R , et al. Correlative and integrated light and electron microscopy of in-resin GFP fluorescence, used to localise diacylglycerol in mammalian cells. Ultramicroscopy. (2014) ;143: :3–14. |
[35] | McGeachie JK , Grounds MD , Partridge TA , Morgan JE . Age-related changes in replication of myogenic cells in mdx mice: quantitative autoradiographic studies. Journal of the Neurological Sciences. (1993) ;119: (2):169–79. |
[36] | McGeachie JK , Grounds MD , Partridge TA , Morgan JE . Age-related changes in replication of myogenic cells in mdx mice: quantitative autoradiographic studies. J Neurol Sci. (1993) ;119: :169–79. |
[37] | Novak JS , Hogarth MW , Boehler JF , Nearing M , Vila MC , Heredia R , et al. Author Correction: Myoblasts and macrophages are required for therapeutic morpholino antisense oligonucleotide delivery to dystrophic muscle. Nat Commun. (2018) ;9: (1):1256. |
[38] | Janghra N , Morgan JE , Sewry CA , Wilson FX , Davies KE , Muntoni F , et al. Correlation of Utrophin Levels with the Dystrophin Protein Complex and Muscle Fibre Regeneration in Duchenne and Becker Muscular Dystrophy Muscle Biopsies. PLoS One. (2016) ;11: (3):e0150818. |
[39] | De Micheli AJ , Laurilliard EJ , Heinke CL , Ravichandran H , Fraczek P , Soueid-Baumgarten S , et al. Single-Cell Analysis of the Muscle Stem Cell Hierarchy Identifies Heterotypic Communication Signals Involved in Skeletal Muscle Regeneration. Cell Reports. (2020) ;30: (10):3583–95e5. |
[40] | Yasin R , Van Beers G , Nurse KC , Al Ani S , Landon DN , Thompson EJ . A quantitative technique for growing human adult skeletal muscle in culture starting from mononucleated cells. Journal of the Neurological Sciences. (1977) ;32: (3):347–60. |
[41] | Montarras D , Morgan J , Collins C , Relaix F , Zaffran S , Cumano A , et al. Direct isolation of satellite cells for skeletal muscle regeneration. Science. (2005) ;309: (5743):2064–7. |
[42] | Yasin R , Walsh FS , Landon DN , Thompson EJ . New approaches to the study of human dystrophic muscle cells in culture. Journal of the Neurological Sciences. (1983) ;58: (3):315–34. |
[43] | Seale P , Sabourin LA , Girgis-Gabardo A , Mansouri A , Gruss P , Rudnicki MA . Pax7 is required for the specification of myogenic satellite cells. Cell. (2000) ;102: :777–86. |
[44] | Searle P , Rudnicki MA . A New Look at the Origin, Function, and “Stem-Cell” Status of Muscle Satellite Cells. Development Biology. (2000) ;218: :115–24. |
[45] | Yablonka-Reuveni Z , Rudnicki MA , Rivera AJ , Primig M , Anderson JE , Natanson P . The transition from proliferation to differentiation is delayed in satellite cells from mice lacking MyoD. Developmental Biology. (1999) ;210: :440–55. |
[46] | Maesner CC , Almada AE , Wagers AJ . Established cell surface markers efficiently isolate highly overlapping populations of skeletal muscle satellite cells by fluorescence-activated cell sorting. Skelet Muscle. (2016) ;6: :35. |
[47] | Cerletti M , Jurga S , Witczak CA , Hirshman MF , Shadrach JL , Goodyear LJ , et al. Highly efficient, functional engraftment of skeletal muscle stem cells in dystrophic muscles. Cell. (2008) ;134: (1):37–47. |
[48] | Sherwood RI , Christensen JL , Conboy IM , Conboy MJ , Rando TA , Weissman IL , et al. Isolation of adult mouse myogenic progenitors: functional heterogeneity of cells within and engrafting skeletal muscle. Cell. (2004) ;119: (4):543–54. |
[49] | Gheller BJ , Blum J , Soueid-Baumgarten S , Bender E , Cosgrove BD , Thalacker-Mercer A . Isolation, Culture, Characterization, and Differentiation of Human Muscle Progenitor Cells from the Skeletal Muscle Biopsy Procedure. Journal of visualized experiments: JoVE. (2019) (150). |
[50] | Machado L , Dos Santos M , Camps J , Van Herck J , Varet H , Legendre R , et al. Skeletal Muscle Tissue Damage Leads to a Conserved Stress Response and Stem Cell-Specific Adaptive Transitions.. CELL-STEM-CELL-D-20-00065. |
[51] | Available at SSRN: https://ssrncom/abstract=3537798 or http://dxdoiorg/102139/ssrn3537798.2020. |
[52] | Kuang S , Kuroda K , Le Grand F , Rudnicki MA . Asymmetric self-renewal and commitment of satellite stem cells in muscle. Cell. (2007) ;129: (5):999–1010. |
[53] | Christov C , Chretien F , Abou-Khalil R , Bassez G , Vallet G , Authier FJ , et al. Muscle satellite cells and endothelial cells: close neighbors and privileged partners. Mol Biol Cell. (2007) ;18: (4):1397–409. |
[54] | Abou-Khalil R , Mounier R , Chazaud B . Regulation of myogenic stem cell behavior by vessel cells: the “menage a trois” of satellite cells, periendothelial cells and endothelial cells. Cell Cycle. (2010) ;9: (5):892–6. |
[55] | Abou-Khalil R , Le Grand F , Pallafacchina G , Valable S , Authier FJ , Rudnicki MA , et al. Autocrine and paracrine angiopoietin 1/Tie-2 signaling promotes muscle satellite cell self-renewal. Cell Stem Cell. (2009) ;5: (3):298–309. |
[56] | Giordani L , He GJ , Negroni E , Sakai H , Law JYC , Siu MM , et al. High-Dimensional Single-Cell Cartography Reveals Novel Skeletal Muscle-Resident Cell Populations. Molecular Cell. (2019) ;74: (3):609–21 e6. |
[57] | Dos Santos M , Backer S , Saintpierre B , Izac B , Andrieu M , Letourneur F , et al. Single-nucleus RNA-seq and FISH identify coordinated transcriptional activity in mammalian myofibers. Nat Commun. (2020) ;11: (1):5102. |
[58] | Evano B , Khalilian S , Le Carrou G , Almouzni G , Tajbakhsh S . Dynamics of Asymmetric and Symmetric Divisions of Muscle Stem Cells In Vivo and on Artificial Niches. Cell Reports. (2020) ;30: (10):3195–206 e7e6. |
[59] | Gattazzo F , Laurent B , Relaix F , Rouard H , Didier N . Distinct Phases of Postnatal Skeletal Muscle Growth Govern the Progressive Establishment of Muscle Stem Cell Quiescence. Stem Cell Reports. (2020) ;15: (3):597–611. |
[60] | Pakula A , Spinazzola JM , Gussoni E . Purification of Myogenic Progenitors from Human Muscle Using Fluorescence-Activated Cell Sorting (FACS). Methods Mol Biol. (2019) ;1889: :1–15. |
[61] | Franzin C , Piccoli M , Urbani L , Biz C , Gamba P , De Coppi P , et al. Isolation and Expansion of Muscle Precursor Cells from Human Skeletal Muscle Biopsies. Methods Mol Biol. (2016) ;1516: :195–204. |
[62] | Wolcott KM , Woodard GE . CD34 positive cells isolated from traumatized human skeletal muscle require the CD34 protein for multi-potential differentiation. Cell Signal. (2020) ;74: :109711. |
[63] | Woodard GE , Ji Y , Christopherson GT , Wolcott KM , Hall DJ , Jackson WM , et al. Characterization of discrete subpopulations of progenitor cells in traumatic human extremity wounds. PLoS One. (2014) ;9: (12):e114318. |
[64] | Machado L , Esteves de Lima J , Fabre O , Proux C , Legendre R , Szegedi A , et al. In Situ Fixation Redefines Quiescence and Early Activation of Skeletal Muscle Stem Cells. Cell Reports. (2017) ;21: (7):1982–93. |
[65] | Machado L , Geara P , Camps J , Dos Santos M , Teixeira-Clerc F , Van Herck J , et al. Tissue damage induces a conserved stress response that initiates quiescent muscle stem cell activation. Cell Stem Cell. 2021. |
[66] | Feige P , Rudnicki MA . Isolation of satellite cells and transplantation into mice for lineage tracing in muscle. Nat Protoc. (2020) ;15: (3):1082–97. |
[67] | Tierney M , Sacco A . Engraftment of FACS Isolated Muscle Stem Cells into Injured Skeletal Muscle. Methods Mol Biol. (2017) ;1556: :223–36. |
Notes
1 T= section thickness, D= object size at 90° to plane of section
2 A mouse EDL muscle, weighing 10–12 mg contains ∼1000 fibres with 5–10 satellite cells per fibre, providing a simple estimate of number of satellite cells in a mouse EDL muscle at 5–10 X103 i.e. 0.5–1 X 10⁶/g of muscle.

