
Identification of Serum Interleukin 6 Levels as a Disease Severity Biomarker in Facioscapulohumeral Muscular Dystrophy
Abstract
Background:
Facioscapulohumeral muscular dystrophy (FSHD) is one of the most common myopathies in adults, displaying a progressive, frequently asymmetric involvement of a typical muscles’ pattern. FSHD is associated with epigenetic derepression of the polymorphic D4Z4 repeat on chromosome 4q, leading to DUX4 retrogene toxic expression in skeletal muscles. Identifying biomarkers that correlate with disease severity would facilitate clinical management and assess potential FSHD therapeutics’ efficacy.
Objectives:
This study purpose was to analyze serum cytokines to identify potential biomarkers in a large cohort of adult patients with FSHD.
Methods:
We retrospectively measured the levels of 20 pro-inflammatory and regulatory cytokines in sera from 100 genetically confirmed adult FSHD1 patients. Associations between cytokine concentrations and various clinical scores were investigated. We then measured serum and muscle interleukin 6 (IL-6) levels in a validated FSHD-like mouse model, ranging in severity and DUX4 expression.
Results:
IL-6 was identified as the only cytokine with a concentration correlating with several clinical severity and functional scores, including Clinical Severity Score, Manual Muscle Testing sum score, Brooke and Vignos scores. Further, FSHD patients displayed overall IL-6 levels more than twice high as control, and patients with milder phenotypes exhibited lower IL-6 serum concentration than those with severe muscular weakness. Lastly, an FSHD-like mouse model analysis confirmed that IL-6 levels positively correlate with disease severity and DUX4 expression.
Conclusions:
Serum IL-6, therefore, shows promise as a serum biomarker of FSHD severity in a large cohort of FSHD1 adult patients.
LIST OF ABBREVIATIONS
FSHD | Facioscapulohumeral muscular dystrophy |
DUX4 | Double Homeobox 4 |
IL-6 | Interleukin 6 |
CSS | Clinical Severity Score |
MMT | Manual Muscle Testing |
Rus | Repeated Units |
mRNA | Messenger Ribonucleic Acid |
MRI | Magnetic resonance imaging |
STIR | Short tau inversion recovery |
CD8 | Cluster of Differentiation 8 |
CD4 | Cluster of Differentiation 4 |
SMCHD1 | Structural Maintenance of Chromosomes flexible Hinge Domain containing 1 |
GM-CSF | Granulocyte-Macrophage-Colony-Stimulating Factor |
IFNg | Interferon-gamma, |
TNFα | Tumor Necrosis Factor alpha |
TNFβ | Tumor Necrosis Factor beta |
VEGF | Vascular Endothelial Growth Factor |
STAT3 | Signal Transducer and Activator of Transcription 3 |
INTRODUCTION
Facioscapulohumeral muscular dystrophy (FSHD) manifests as a progressive asymmetric myopathy with facial and upper arm muscle weakness. The most common form, called FSHD1, is dominantly inherited and has been associated with a critical contraction in D4Z4 macrosatellite repeats on chromosome 4q35, resulting in aberrant expression of the DUX4 retrogene [1, 2] and ultimately causing muscle cell death and subsequent muscle atrophy and weakness [3]. The variability in FSHD progression, yet unpredictable, and the limited knowledge in determinants of disease progression complicate the development of sensitive outcome measures and potential biomarkers search, representing a significant obstacle for new therapeutic strategies development. DUX4 mRNA and protein’s low expression levels in muscle, short half-life, and absence of serum prevent further their use as biomarkers in clinical practices. DUX4 target genes’ expression is frequently used to quantify DUX4 expression indirectly. Still, no clear correlation has been reported between the expression of these genes and clinical severity or imaging scores in patients [4, 5].
Beyond DUX4 expression, the FSHD pathophysiology is still unknown. It has been proposed that the expression of DUX4 and its target genes, which are usually expressed in an immune-privileged environment, trigger an immune response [3, 6]. This hypothesis has been supported by the presence of infiltrating CD8 + T cells in the endomysium and CD4 + T cells in the perivascular area [7, 8]. Further, MRI studies showed that muscle edema/inflammation, flagged as short tau inversion recovery signal hyperintensity (STIR + muscles), precedes fibro-fatty degeneration in FSHD patients [9]. Inflammatory pathway activation induced by inappropriate DUX4 expression seems to play a role in the early stages of disease progression [7, 10]. While a definitive characterization of immune system deregulation in FSHD1 is still lacking, several studies have highlighted the increase in circulating inflammatory protein in FSHD patients compared to healthy control [8, 11, 12].
Given the central role of inflammation in FSHD pathophysiology, we analyze serum cytokines to identify potential severity biomarkers in a large cohort of adult patients with FSHD1. We found that IL-6 levels are higher in FSHD patients than in control and correlate with several clinically relevant functional scores. Besides, increased IL-6 levels correlate with a higher Clinical Severity Score in FSHD1 patients and levels of DUX4 expression and disease severity in an FSHD-like mouse model. We propose increased IL-6 levels as a potential new disease severity serum biomarker for FSHD1 patients.
METHODS
Patient study design and participants
This retrospective study was performed on sera derived from blood samples from adult FSHD1 patients (biobank reference: DC2015-2374) and healthy volunteers (clinical trial number NCT02209142) collected in previous studies. All participants provided a written non-opposition form for the specific use of their serum.
Participants
All patients were referred to the Neuromuscular Department of Nice University Hospital, France, with genetically confirmed FSHD1, defined by a D4Z4 copy number inferior to 11 on chromosome 4q, a permissive 4qA allele, and the absence of concurrent mutations in the SMCHD1 gene.
Exclusion criteria included: chronic pathologies which could impact immune response (autoimmune disorders, neurodegenerative diseases, diabetes, neoplasms); severely reduced mobility (patients using a wheelchair most of the day for more than two years); exposure to vaccines, blood products, or residence in a tropical country during the three months preceding blood sample collection; an infectious episode during the three weeks before blood sample collection; human immunodeficiency virus, hepatitis B virus or hepatitis C virus seropositivity; receiving any immunosuppressive or immunomodulatory drug during the two weeks or for more than 14 consecutive days during the six months before blood sample collection; chronic alcohol consumption or illicit drug use during the three months before blood sample collection; having been placed on a particular diet regimen for medical reasons; participating or having participated in another clinical study using an investigational treatment. Samples from healthy volunteers from another study (NCT number: NCT02209142) were used [13].
For all patients, collected data included: the size of D4Z4 RUs contraction, age at examination and at disease onset, comorbidities, previous and current therapies at the time of blood sample collection.
Motor function was assessed by Manual Muscle Testing (MMT) sum score including 28 functional muscle groups from upper and lower limbs (each muscle group being scored from zero to five according to Medical Research Council scale), Brooke and Vignos scores (assessing functional impairment of upper and lower limbs respectively), Clinical Severity Score (CSS) and age-corrected CSS, as previously described [14]. Briefly, clinical severity was calculated for each participant based on muscle involvement (scored 0 to 10, increasing from face and shoulder to lower extremity). Age-corrected CSS was calculated as follow: (CSS/age) X1000. For healthy volunteers, collected data included age and demographics.
Patient and healthy serum samples
Patients’ serum samples were obtained from blood samples available in an FSHD biobank (Reference: DC2015-2374), while healthy serum samples were collected in another study (NCT02209142). The collection method was identical between controls and patients. Venipuncture was performed on fasting subjects between 7 AM and 9 AM. The blood was allowed to clot for one hour before centrifugation (1,500 g, 10 min). Serum samples were stored in 0.5 ml aliquots at –80°C. For cytokine levels, serum samples were thawed on ice and kept at –80°C in 50μl aliquots.
Immunoassay for patient samples
Serum levels of Granulocyte-Macrophage Colony-Stimulating Factor (GM-CSF), interferon-gamma (IFNg), interleukin (IL)-1alpha, IL-1beta, IL-2, IL-4, IL-5, IL-6, IL-7, IL-8, IL-10, IL-12p40, IL-12p70, IL-13, IL-15, IL-16, IL-17, TNFα (Tumor Necrosis Factor alpha), TNFß (Tumor Necrosis Factor beta), and Vascular Endothelial Growth Factor (VEGF) were measured using v-plex® immunoassay using the commercially available Proinflammatory Panel 1, and Cytokine Panel 1 (MSD). All assays were performed according to the manufacturer’s instructions. Data were acquired on the v-plex® Sector Imager 2400 plate reader and analyzed using the Discovery Workbench 3.0 software (MSD). Standard curves for each cytokine were generated using the premixed lyophilized standards provided in the kits. Serial two-fold dilutions of standards were run to create a 13-standard concentration set, and the diluent alone was used as a blank. The cytokine concentrations were determined from the standard curve using a robust-fit curve to transform the mean light intensities into concentrations. The lower limit of quantification (LLOD) was determined for each cytokine and each plate as twice the signal recorded for the blank.
Statistical analysis for patient samples
Outliers were detected using the GraphPad Prism7 ROUT algorithm with the more stringent parameter (Q = 0.1%) and excluded from downstream analyses. Correlations between serum biomarker levels and clinical scores were computed using the Spearman’s r correlation coefficient rank test with Benjamini & Hochberg’s multiple test correction (False Discovery Rate, FDR). Comparative analyses between different groups were performed using the non-parametric Mann & Whitney U-test. Statistical significance was set according to a corrected p-value (p < 0.05). Statistical analyses were performed using the R Stats package, and graphs were generated using GraphPad Prism version 6.00 for iOS. Heatmaps were obtained using the Matlab software R2017b.
Mouse study design
All mouse work was performed at the University of Nevada, Reno, and approved by the local IACUC committee (#00701). ACTA1-MCM (control), ACTA1-MCM; FLExD (mild FSHD-like model), and ACTA1-MCM; FLExD + tamoxifen (TMX) (severe FSHD-like model) mice were generated, genotyped, and analyzed as described [15].
Mouse phenotyping
Muscle physiology (extensor digitorum longus muscles), histology, and immunocytochemistry (tibialis anterior muscles) were performed as described [15]. Primary antibody against DUX4, E5-5 (Abcam, ab124699) was used at 1:200 dilution. A series of 10 non-consecutive sections were imaged using the Leica DMi8, DFC365 FX camera, and LAS X Expert software (Leica Microsystems Inc.). Representative images from n = 3–4 animals per group are shown.
Immunoassay for IL-6 quantification
IL-6 quantification was performed by the Immune Assessment Core (University of California, Los Angeles) using the Luminex Multiplexed Technology, as per manufacturer’s instructions, and the Mouse Cytokine/Chemokine (32-plex) panel. Gastrocnemius muscle homogenates were prepared from freshly dissected and unfixed tissue with a sample-grinding kit (80- 6483-37; GE Healthcare Bio-Sciences, Pittsburgh, PA) in 100μl of sample grinding buffer (20 mM Tris HCl pH4.5, 100 mM NaCl, 0.2%NP40, and 1:10 protease inhibitor cocktail (Sigma P8340) according to Roche et al. [16]. Homogenates were subjected to centrifugation at 16,000 x g for 20 minutes at 4°C, and supernatants were stored at –80°C. All gastrocnemius muscle homogenate samples were normalized to 2000μg/ml before analysis. The samples for which IL-6 levels were below the quantification limit were assigned the respective threshold quantification value.
Statistical analysis for mouse work
Multiple comparison analyses were performed with one-way ANOVA with uncorrected Fisher’s LSD for muscle physiology data and Kruskal-Wallis for IL-6 quantification data using GraphPad Prism 8.2.1. Statistical significance was considered according to the following p-values: *p < 0.05, **p < 0.01, ***p < 0.001, ****p < 0.0001.
RESULTS
Patient demographical and clinical data
Out of the 136 patients initially included, the final cohort was composed of 100 FSHD1 adults, 51 males and 49 females (Table 1) after applying exclusion criteria. The age at disease onset ranged from 1 to 76 years old (mean: 31.7±17.8), the age at examination from 16 to 84 (mean: 58.0±16.9), and the disease duration from 1 to 69 years (mean: 26.4±16.7). The age at examination and disease duration did not differ significantly between males and females (Table 1). Overall, the 4qA D4Z4 RUs ranged from 2 to 10 (mean: 6.2±1.8). The female group had a larger 4qA D4Z4 contraction than males (5.8 RUs±2 versus 6.7 RUs±1.4) (Table 1).
Table 1
Patient demographic and clinical characteristics
| All (n = 100) | Males (n = 51) | Females (n = 49) | Males vs. | |
| Females p-value | ||||
| Age at examination | 58.0±16.9 | 55.6±15.4 | 60.5±18.3 | p = 0.054. |
| Disease duration | 26.4±16.7 | 27.3±16.7 | 25.4±16.7 | p = 0.57 |
| 4qA D4Z4 RUs | 6.2±1.8 (from 2 to 10) | 6.7±1.4 (from 4 to 10) | 5.8±2.0 (from 2 to 10) | p = 0.01* |
| MMT sum score | 102.2±23.8 | 106.9±24.3 | 97.4±22.4 | p = 0.01* |
| Brooke score | 2.8±1.0 | 2.8±0.9 | 2.7±1.0 | p = 0.28 |
| Vignos score | 4.0±2.9 | 4.1±2.9 | 3.9±2.8 | p = 0.89 |
| Clinical Severity Score (CSS) | 6.4±2.2 | 6.4±2.2 | 6.4±2.2 | p = 0.76 |
| Age-corrected CSS | 127.5±78.2 | 131.3±75.4 | 123.6±81.74 | p = 0.093 |
Data expressed as means±SD. RUs: Repeat Units, MMT: Manual Muscle testing, CSS: Clinical Severity Score.
The MMT sum score ranged from 30 to 140 (mean: 102.2±23.8), with female more severely affected than men (p = 0.01*), Brooke score from 1 to 6 (mean: 2.8±1.0), Vignos score from 1 to 9 (mean: 4.0±2.9), CSS from 1 to 10 (mean: 6.4±2.2), age-corrected CSS from 14.5 to 375 (mean: 127.5±78.2). Detailed values for both male and female groups are described in Table 1.
Cytokine profile in human sera
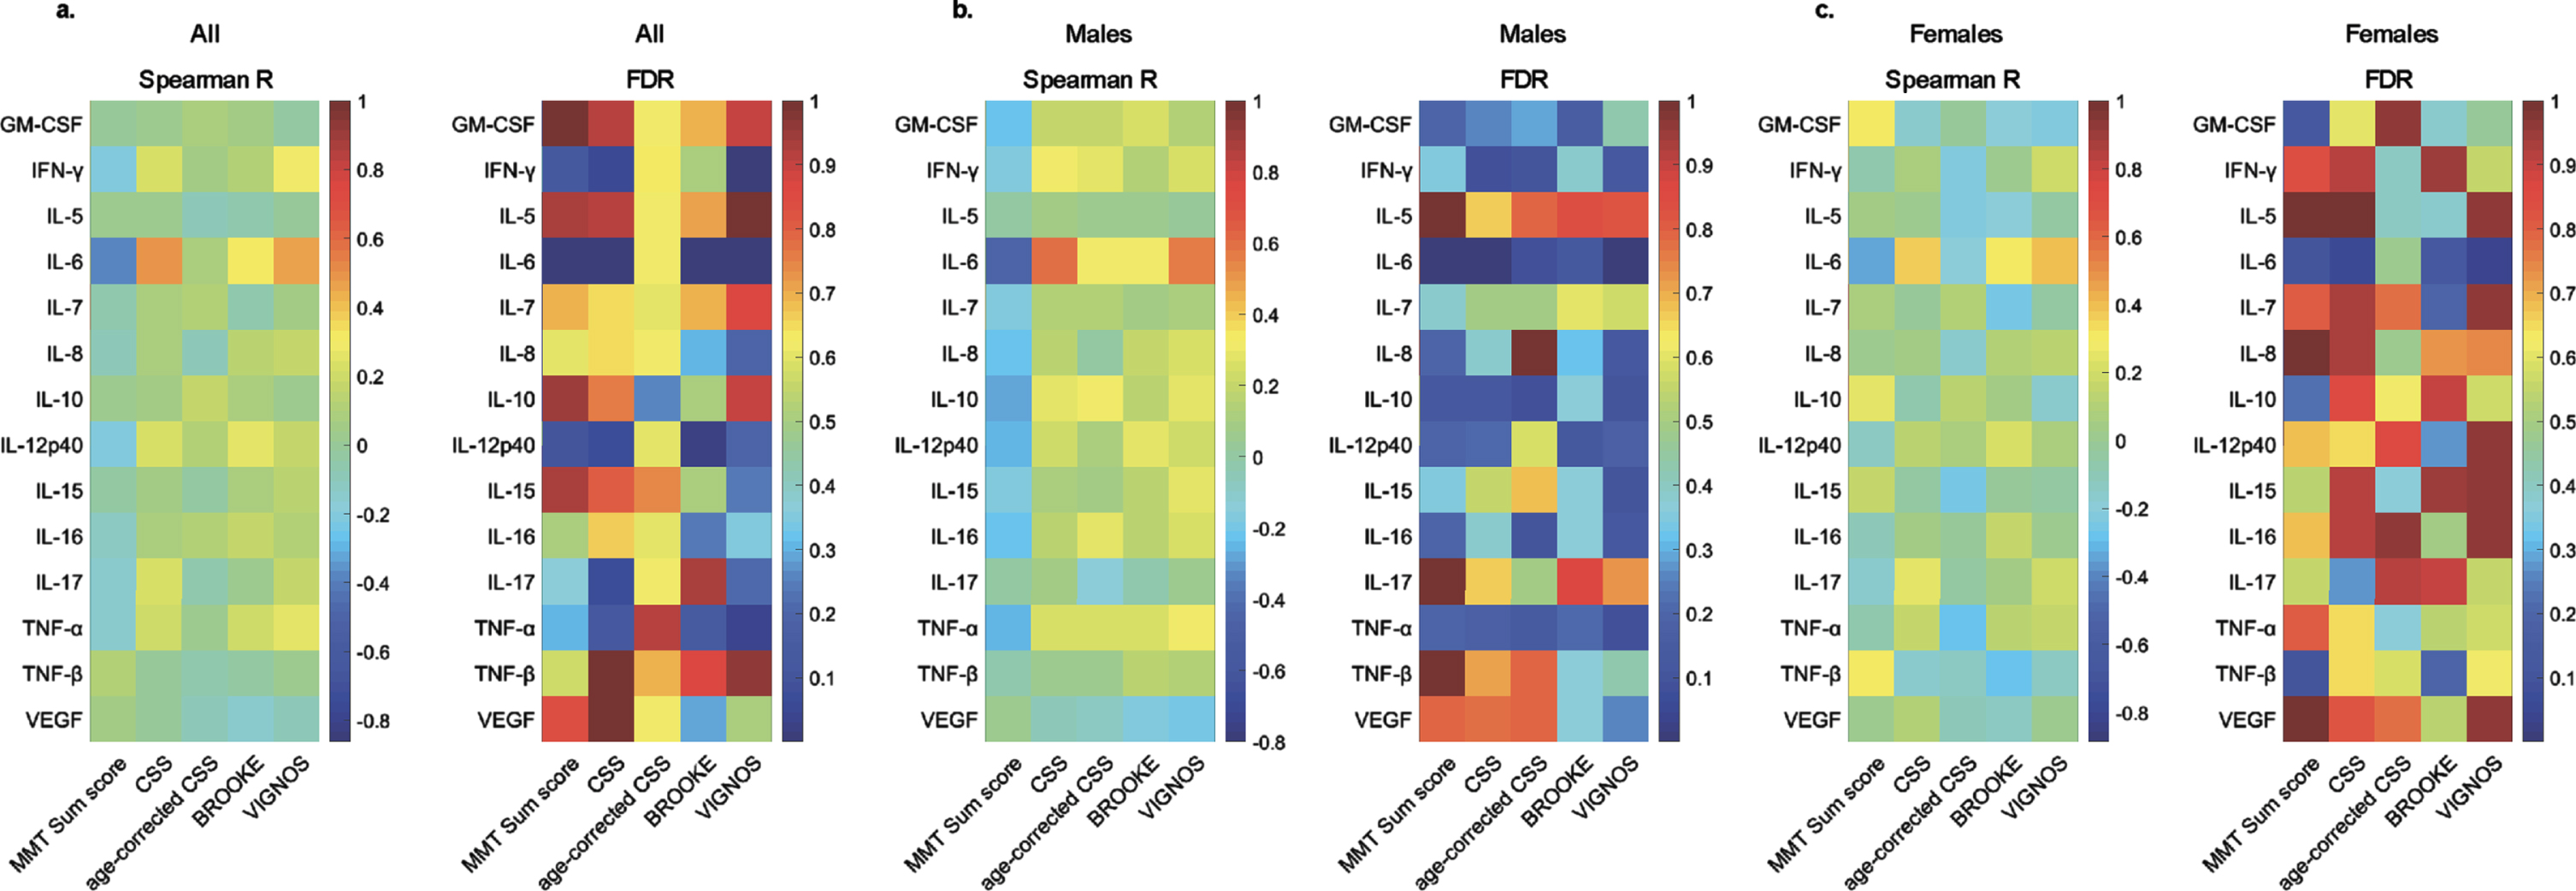
The cytokine profile in human sera was determined for 20 soluble proteins. Levels were determined for GM-CSF, IFN-gamma, IL-5, IL-6, IL-7, IL-8, IL-10, IL-12p40, IL-15, IL-16, IL-17, TNF-alpha, TNF-beta, and VEGF. IL-1-alpha, IL-1-beta, IL-2, IL-4, IL-12p70, and IL-13 were below the detection level in more than 20%of patients and were excluded from further analysis. Spearman’s correlation coefficient was computed between the 14 reliably detectable cytokines and MMT sum score, Brooke and Vignos scores, CSS, and age-corrected CSS, to investigate a possible association between serum cytokine levels and disease severity. After correction for multiple testing, serum IL-6 was the sole cytokine which levels correlated negatively with MMT sum score (R = –0.38, FDR = 2.97×10⁻⁴) and positively with Brooke score (R = 0.31, FDR = 6.82×10⁻³), Vignos score (R = 0.47, FDR = 3.29×10⁻⁶), and CSS (R = 0.48, FDR = 1.26×10⁻⁶) in the overall cohort (Fig. 1, Supplementary Table 1).
Fig. 1
Correlations between serum cytokine levels and clinical scores in FSHD1. Heat maps of Spearman’s correlation coefficient (Spearman R) and False Discovery Rate (FDR) using Benjamini and Hochberg method for cytokines and clinical scores in all patients (a.), males (b.), and females (c.).
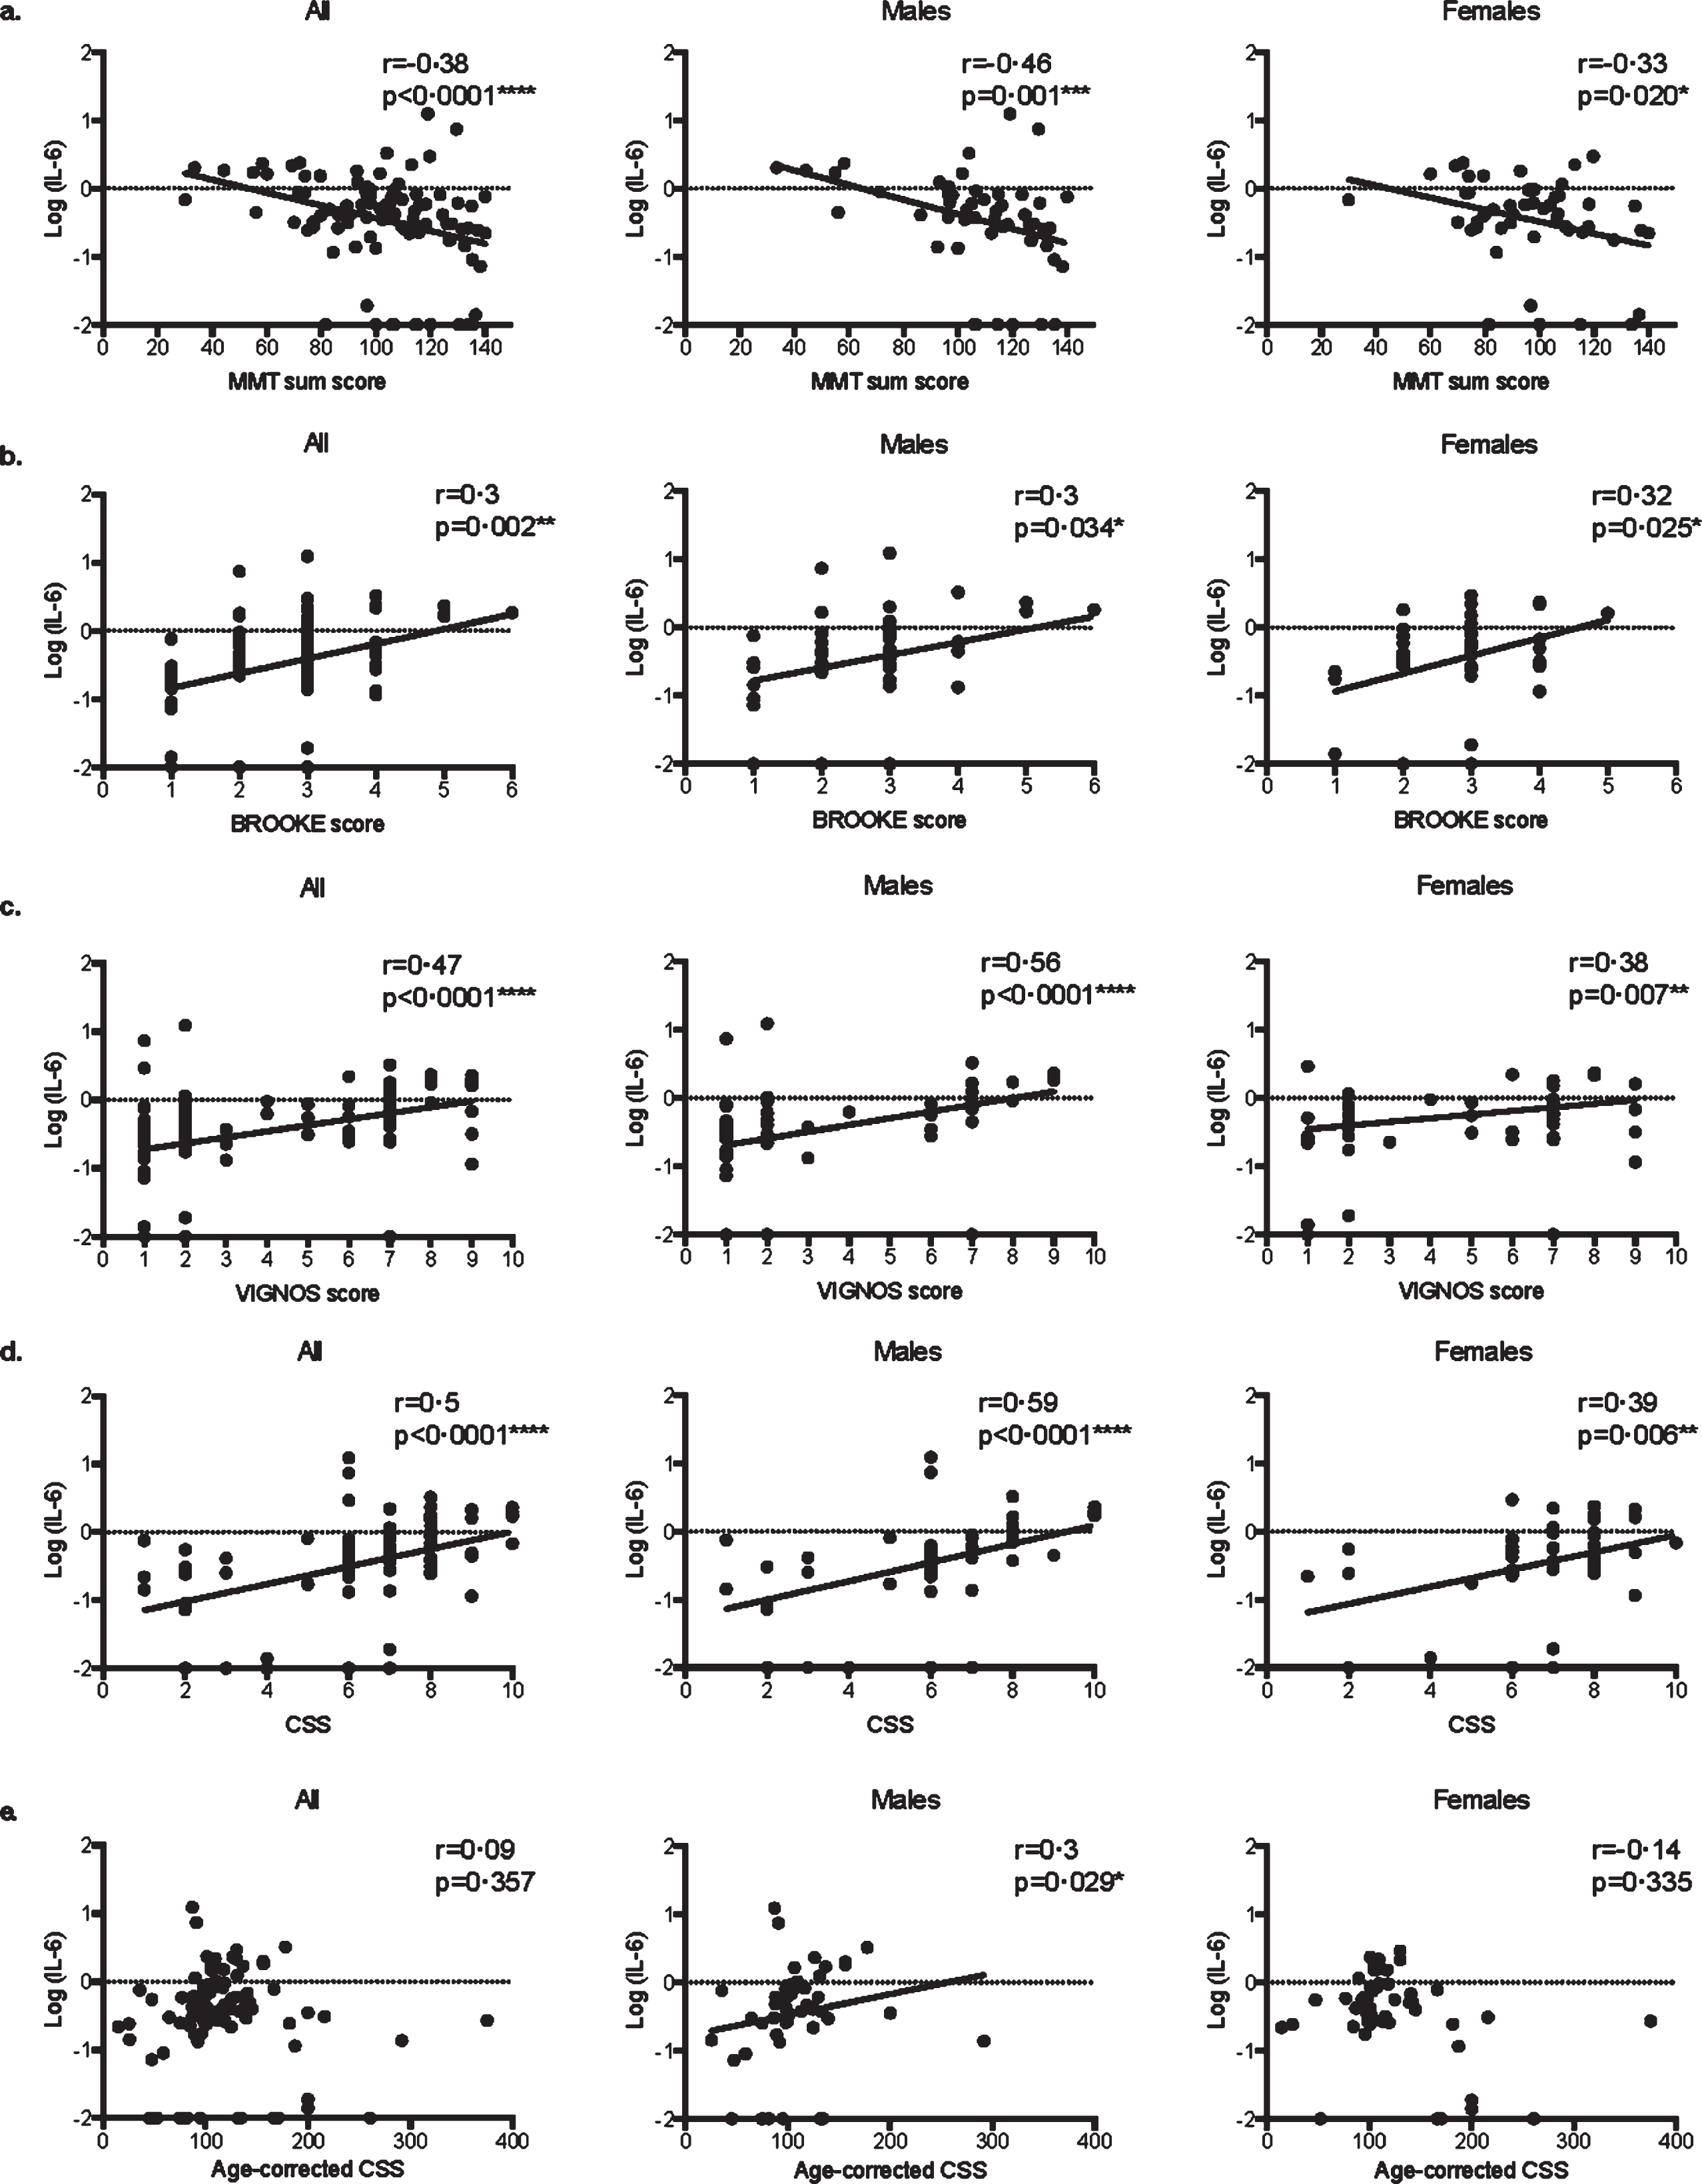
More precisely, in both male and female patients, serum IL-6 levels were correlated with MMT sum score (Fig. 2a, respectively r = –0.46 p = 0.001*** and r = –0.33 p = 0.020*), Brooke score (Fig. 2b, respectively r = 0.3 p = 0.034* and r = 0.32 p = 0.025*), Vignos score (Fig. 2c, respectively r = 0.56 p < 0.0001**** and r = 0.38 p = 0.007**), and CSS (Fig. 2d, respectively r = 0.59 p < 0.0001**** and r = 0.39 p = 0.006**). Remarkably, serum IL-6 levels did not correlate with age-corrected CSS in the overall population (r = 0.09, p = 0.357) and in the female group (r = 0.14, p = 0.335), while it did in the male groups (r = 0.3, p = 0.029*, Fig. 2e).
Fig. 2
Correlations between serum IL-6 levels and clinical scores in FSHD1. Scatter plot representations of serum IL-6 levels versus MMT sum score (a.), Brooke score (b.), Vignos score (c.), clinical severity score (CSS) (d.), and age-corrected CSS (e.) in all patients, males, and females. Spearman R coefficients and p-values are indicated.
Our data also revealed alterations in the mean serum levels of IL-6, depending on the clinical severity. No differences were found in the level of IL-6 between the males and female groups, but serum IL-6 levels were significantly higher in patients presenting a CSS > 6 than those with a CSS≤6 (p < 0.0001****, Fig. 3a). A similar correlation was found in the male (p = 0.0016**) and the female group (p = 0.015*, Fig. 3a).
Fig. 3
Comparison of serum IL-6 levels with clinical severity in FSHD1 and with control. a. Scatter plot representation of serum IL-6 levels in the different groups according to clinical severity. A significant difference in serum IL-6 levels was obtained between patients with a CCS≤6 and or > 6 in the overall population (p < 0.0001****), in males (p = 0.0016**) and in females (p = 0.015*). b. Scatter plot representation of serum IL-6 levels in the control and FSHD1 patient. A significant difference in serum IL-6 levels was obtained between control and patients in the overall population (p = 0.006**), in males (p = 0.027*), and in females (p = 0.011*).
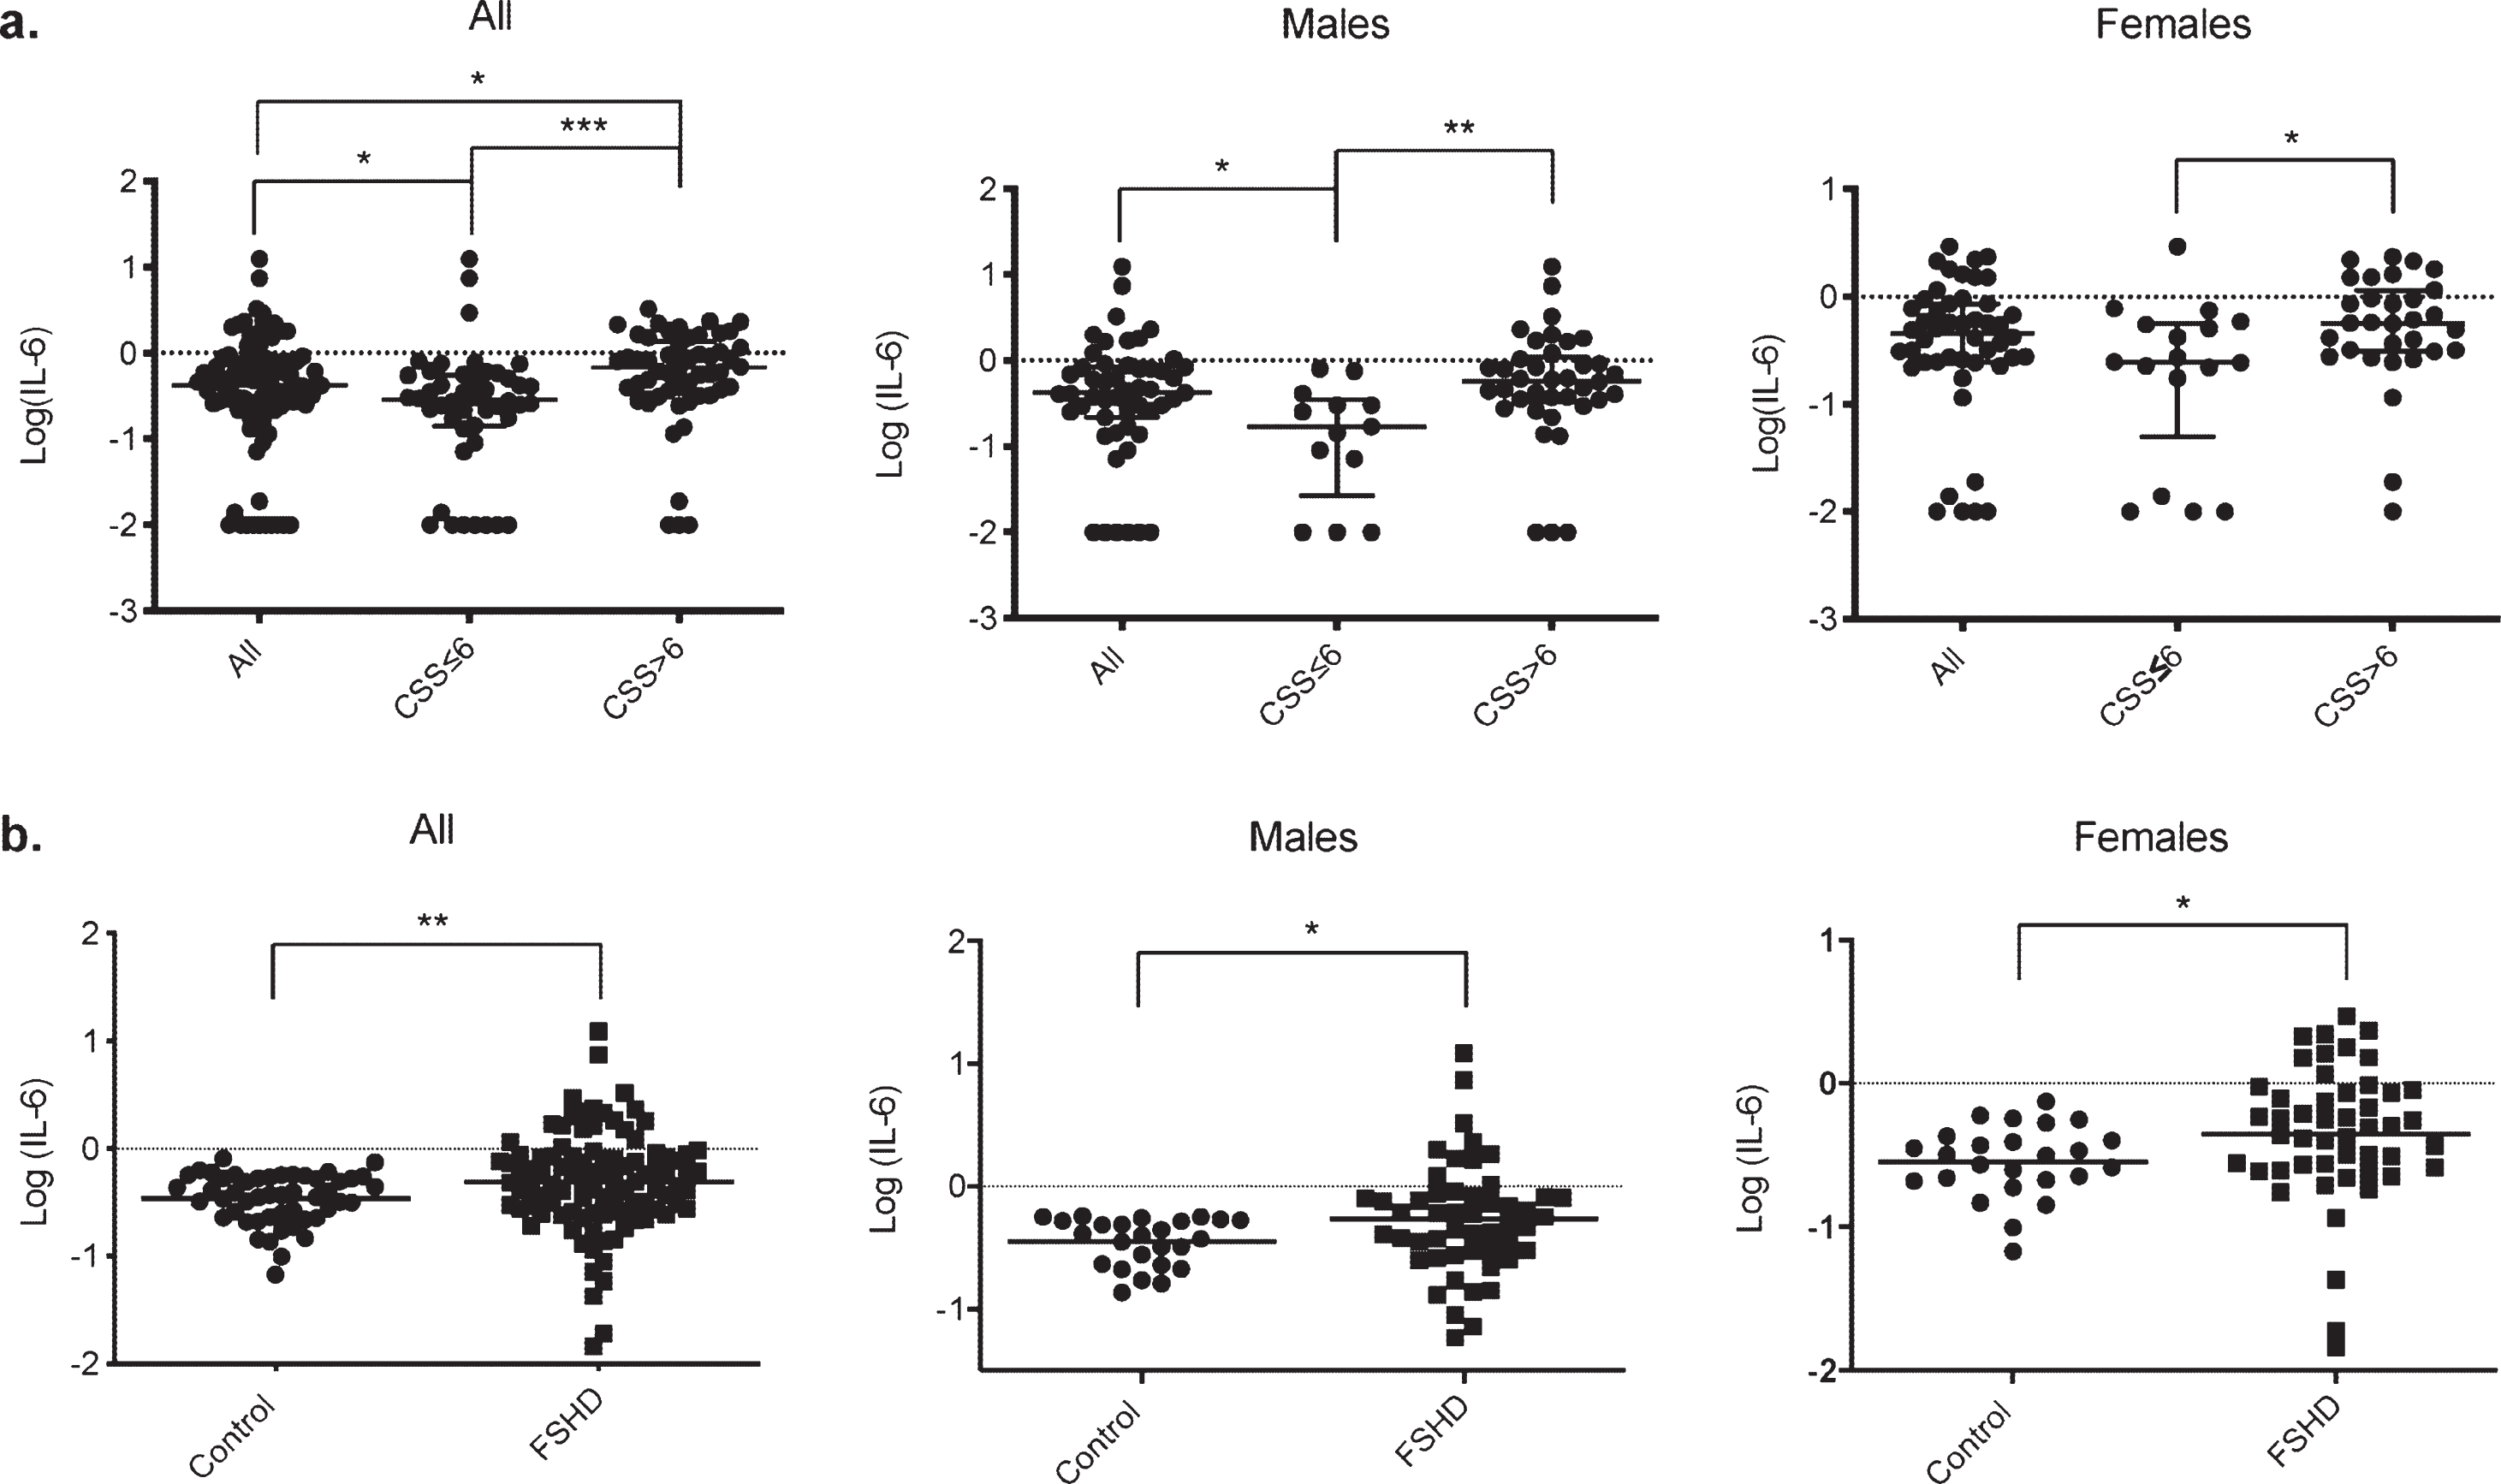
To further confirm IL-6 as a severity biomarker in FSHD1, we have compared the level of serum IL-6 between FSHD1 patients and unrelated healthy control. The age at the exam for the control ranged from 46 to 71 (mean: 54.9±6.4), with a similar male/female ratio compare to our patients’ cohort (50%male and 50%females for control VS 51%males and 49%females for FSHD1 patients). No significant difference was found in the mean age between control and patients (p = 0.21), males (p = 0.3), and females (p = 0.09). Control demographics are represented in Supplementary Table 2. The serum IL-6 in FSHD1 patients was more than twice as high as Control group (0.88±0.15 pg/ml for FSHD1 patients and 0.36±0.02 pg/ml for control p = 0.0012*, Fig. 3b). Further, both males and females’ patients subgroup display higher level of IL-6 compare to males and females control subgroup (1.05±0.28 pg/ml and 0.39±0.03 pg/ml for patients and control males respectively, p = 0.027*; 0.70±0.09 pg/ml and 0.33±0.03 pg/ml for patients and control females respectively, p = 0.011*, Fig. 3b).
Our results showed that IL-6 levels are increased in the FSHD1 population compared to healthy control, and higher IL-6 levels reach more affected patients.
Cytokine profile in FSHD-like transgenic mice
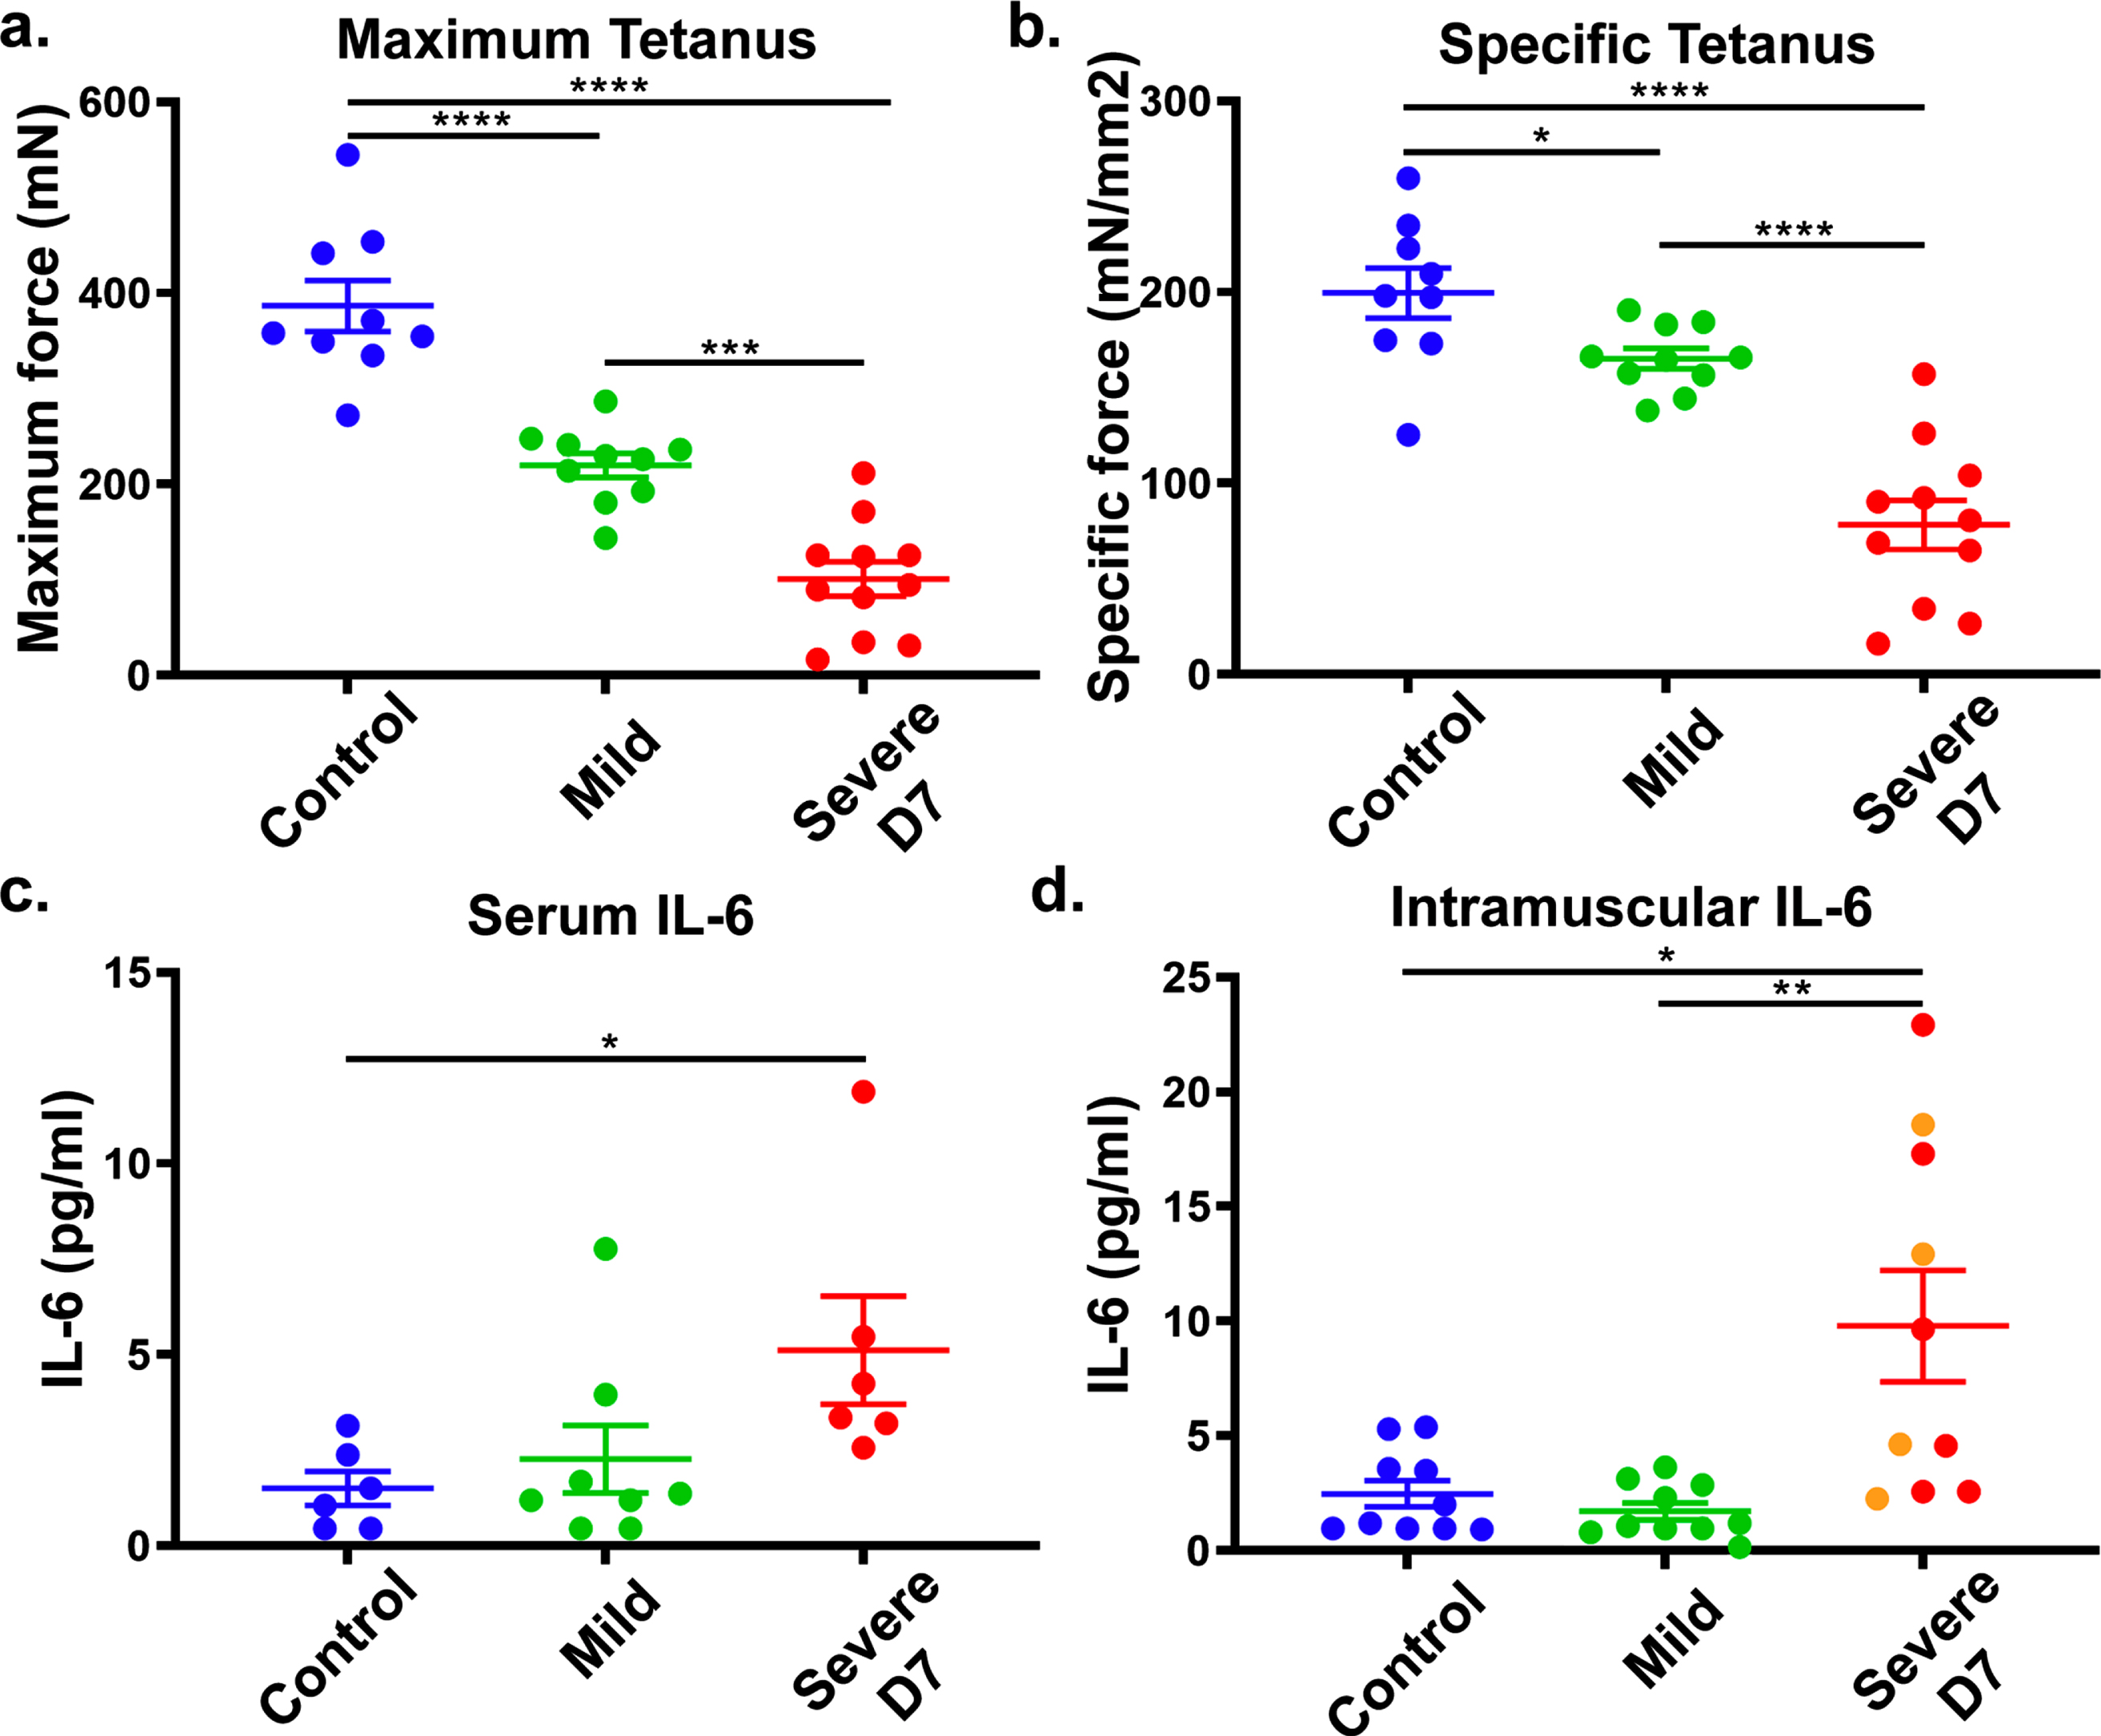
To confirm IL-6 as a DUX4-responsive biomarker for FSHD1, we tested if IL-6 levels correlate with DUX4 expression in the ACTA1-MCM, FLExD FSHD-like mouse model. This bi-transgenic mouse model expresses the human DUX4-fl mRNA isoform in skeletal muscles in response to tamoxifen (TMX), resulting in an FSHD-like phenotype.19 We used a mild FSHD-like model (ACTA1-MCM, FLExD/ + mice, no TMX) and a severe FSHD-like model (ACTA1-MCM, FLExD/ + mice treated with TMX) and ACTA1-MCM/ + mice treated with TMX as the control group. We first assessed disease pathology using muscle histology and immunostaining for DUX4 (Supplementary Figure 1a-i) and assessed ex vivo muscle physiology (Fig. 4a and b). We then measured circulating IL-6 levels in serum and intramuscular IL-6 levels using the gastrocnemius muscle in 13- to 14-week-old mice 7 days post-TMX injection (Fig. 4c and d). The severe FSHD-like model showed high muscle pathology levels, including increased centrally located nuclei, variable fiber size, immune cell infiltration, and increased fibrosis, compared with the controls and mild model, which did not show overt signs of histopathology (Supplementary Figure 1a-c), as previously reported [15]. However, muscle physiology showed significant differences between all three groups (Supplementary Figure 1a and b). We quantified IL-6 serum levels from blood collected at the time of ex vivo physiology analysis. Interestingly, we found that serum IL-6 levels were significantly increased in the severe FSHD-like model compared to controls (Fig. 4c). Intramuscular IL-6 levels in gastrocnemius muscle from the severe FSHD-like model were higher than serum levels and significantly increased compared to controls and the mild model (Fig. 4d). Although female mice showed a more significant increase in IL-6 levels than male mice, they are also more severely affected (Supplementary Figure 2). Further, the use of TMX did not affect IL-6 levels in male or female control ACTA1-MCM mice (Supplementary Figure 2), indicating the increase in IL-6 is not due to TMX. These results support that IL-6 levels in the serum and skeletal muscle are responsive to pathogenic levels of DUX4 expression and lend further support to our human data proposing serum IL-6 levels as a biomarker for FSHD.
Fig. 4
FSHD-like mouse model: IL-6 levels in the serum and muscle. ACTA1-MCM/ + with TMX (control), ACTA1-MCM, FLExD/ + no TMX (mild) and ACTA1-MCM, FLExD/ + 7 days post-TMX (Severe D7) mice were assessed for muscle function and IL-6 levels. Ex vivo muscle physiology assessment of extensor digitorum longus muscle in each group of mice (a., b.): Control, blue (n = 9), Mild, green (n = 10), and Severe D7, red (n = 11). Mice were assessed for maximum tetanus (a.), and cross-sectional muscle area normalized specific tetanus (b.). IL-6 levels in the serum (c.) and gastrocnemius muscle (d.) in each group of mice: Control, blue (n = 6 in serum, n = 10 in muscle), Mild, green (n = 8 in serum, n = 10 in muscle), and Severe D7 (n = 6 in serum, n = 10 in muscle). Red dots in panels c and d depict corresponding samples used for serum and muscle analysis. Orange dots in panel d represent samples exclusively used for muscle analysis. Significance: *p < 0.05, **p < 0.01, ***p < 0.001, ****p < 0.0001.
DISCUSSION
FSHD is a heterogeneous disease characterized by high variability in the age at onset, progression, and severity. The precise FSHD pathophysiology is still unknown, but a unifying model has emerged implicating epigenetic derepression caused by a critical contraction in the number of D4Z4 macrosatellite repeats on chromosome 4q35, the aberrant reactivation of the DUX4 gene, which is generally silenced in somatic cells. This causes disease by a toxic gain of function [1–3]. Among DUX4p downstream pathways, muscle inflammation undeniably plays a central role in FSHD pathophysiology, preceding muscle atrophy and fibrofatty degeneration. Several studies on skeletal muscle biopsies and human primary myoblasts have highlighted a link between the cytotoxicity of DUX4 and the deregulation of adaptive and innate immunity and triggered an immune response [3, 6]. This hypothesis is supported by the presence, in more than half of the patients, of a muscular inflammation consisting mainly of infiltrating CD8 + T cells in the endomysium and CD4 + T cells in the perivascular area, accompanied by cytokines production, including IL-12/IL-23p40, IFNg, TNFa, IL-6, and IL-10 [8]. Nevertheless, the exact pathway of muscle inflammation needs to be further clarified to understand better FSHD pathophysiology and inflammation contribution in disease variable progression and develop new biomarkers and/or potential therapeutic strategies.
Previous studies used multiplex assay for a search of FSHD biomarkers. Statland and colleagues have used a microsphere-based immune-fluorescent assay of 243 markers (Myriad, Human Discovery MAP 250, v2.0) and found seven biomarkers with a concentration different between subjects with FSHD and control [12]. The biomarkers identified were in the plasminogen, inflammatory, and wound healing pathways. In this study on serum of 22 FSHD patients, the authors found a significantly increased inflammatory biomarkers (CCL2, CD40LG, and CD40 antigen) in FSHD patients than healthy control. Still, they could not detect inflammatory cytokines such as IL-6, IL-10, IL-12, and TNF-α although those cytokines have been previously reported to be differentially expressed in FSHD patients [8, 11]. This discrepancy can be explained by the small size of the samples and the analysis methods, as correction for a false discovery rate of 5%in such a small sample will likely discard many biomarkers [12].
Another study conducted by Petek and colleagues used a high-throughput SomaLogic proteomics platform of 1129 proteins to identify serum proteins with levels that correlate with FSHD severity in a cross-sectional study of two independent cohorts [17]. In this study, the authors identified 66 proteins with a concentration higher in FSHD patients than control and four proteins among the 66 with a concentration correlating with disease severity. However, these biomarkers correlated when CSS < 6 but failed to correlate when CSS > 6, suggested that they can’t be used as severity biomarkers in FSHD. Further, despite a significantly higher concentration, no correlation was found between proteins involved in inflammation and the severity of the disease. Lastly, this study didn’t identify cytokines (IL-6, IL-10, IL-12, and TNF-α; [8, 11]) or proteins (CCL2, CD40LG, and CD40 antigen, [12]) that were previously reported to be differentially expressed in FSHD compare to control.
The present study is the first to identify any reliable serum biomarker of disease severity in subsets of FSHD1 patients. This finding was made possible by the clinical and biological characterization of 100 FSHD1 patients –among whom 51 were males –therefore assuring an adequate power to detect statistically significant differences. Our results clearly identified IL-6 as the sole cytokine showing a correlation with multiple validated clinical severity scores.
Numerous studies have reported an increase in IL-6 levels in neuromuscular diseases, including Duchene muscular dystrophy [18], Myositis [19], or Amyotrophic Lateral Sclerosis (ALS) [20]. IL-6 levels are used as a disease progression biomarker in the IL6R358Ala variant groups in amyotrophic lateral sclerosis patients [20]. An increased IL-6 secretion by peripheral blood mononuclear cells [8] and increased serum IL-6 levels [11] in FSHD1 patients have also been reported. However, IL-6 role in neuromuscular pathophysiology is still poorly understood. IL-6 has pleiotropic roles as a pro-inflammatory cytokine when secreted by innate immune cells, but IL-6 can also be produced by non-immune cells, including fibroblasts, vascular endothelial cells, and skeletal muscle cells [21]. In this case, IL-6 is a pivotal myokine for muscle repair [22], muscle wasting, exercise, and aging [23]. In skeletal muscle, IL-6 is produced by satellite cells, myofibers, and neutrophils [24] and can have a dual role. On the one hand, IL-6-STAT3 signaling was shown to impair satellite cell self-renewal in aged muscle, specifically [25], and promote myogenic lineage progression during muscle repair [26]. Conversely, experimental evidence implicated IL-6 in promoting satellite cell proliferation during hypertrophic muscle growth [27]. Therefore, IL-6 production in neuromuscular diseases can represent either a muscle-derived auto-repair mechanism [22] or a mediator of immune damage [28] and have to be elucidated.
Nevertheless, to our knowledge, our study is the first to link IL-6 levels and FSHD1 severity. Indeed, our results showed that among the 20 cytokines tested, IL-6 was the only one with concentrations strongly correlated with several well-established clinical severity and functional scores (MMT sum core, Brooke score, Vignos score, and CSS) in the overall FSHD1 population in both male and female subsets. Further, IL-6 levels are higher in the FSHD1 population compare to healthy control and follow disease severity, as more affected patients present increased IL-6 levels compare to less affected patients. The differences between our study and others can be explained by the more significant number of patients included in our study and the analysis method of biomarkers. We analyzed serum cytokine using the MSD technic with ultra-low detection limits and provides up to five logs of linear dynamic range. In contrast, others have used Luminex-based assay [12] or proteomics platform [17]. Our patients’ results were further confirmed by analyzing the FSHD-like mouse model, where serum and muscular IL-6 levels increased with the disease severity and DUX4 expression, suggesting that IL-6 levels are linked to DUX4 expression in skeletal muscles, and that circulating and muscle resident cells could contribute to IL-6 production. However, the primary source of IL-6 in FSHD pathophysiology remains to be defined. Further, whether IL-6 secretion plays an active role in DUX4-dependent muscle degeneration or is just a downstream epiphenomenon in FSHD1 pathogenesis remains to be clarified. Further studies will also be a crucial matter of research for therapeutic development since anti-IL-6 receptor monoclonal antibodies, tocilizumab and sarilumab, have already been approved to treat rheumatoid arthritis and other IL-6-related pathologies [29]. In this perspective, our study points out IL-6 as a suitable tool for phenotypic stratification and a candidate target for therapy in FHSD.
ACKNOWLEDGMENTS
The authors thank the patients who participated in this study and Isabelle PELISSON for helping with manuscript submission. This work was funded by a grant to SS from the Centre Hospitalier Universitaire de Nice (13AOI-01). It was also supported by the French Government (National Research Agency, ANR-13-BSV1-0004-04) through the ‘Investments for the Future’ (LABEX SIGNALIFE, ANR-11-LABX-0028-01) and the University Hospital Federation (FHU) “OncoAge.” It was also supported by a grant to PLJ from the National Institute of Arthritis, Musculoskeletal, and Skin Diseases, NIH, (R01AR070432).
CONFLICT OF INTEREST
Pr S. SACCONI and N. GLAICHENHAUS filed a pending patent on IL-6 as a disease severity biomarker in FSHD1.
Pr S. SACCONI served as a consultant for Sanofi-Genzyme.
All other authors report no competing interests.
ETHICS APPROVAL AND CONSENT TO PARTICIPATE
This retrospective study complies with the Data Protection Act n ° 78-17 of January 6, 1978, as amended and with Regulation (EU) 016/679 of the European Parliament and of the Council of April 27, 2016, applicable from May 25, 2018 (General Data Protection Regulation). All the participants signed a non-opposition form before the use of their serum in this study.
Mice work complies with American registration on animal use as a laboratory model and has been approved by the local IACUC committee (#00701).
SUPPLEMENTARY MATERIAL
[1] The supplementary material is available in the electronic version of this article: https://dx.doi.org/10.3233/JND-210711.
REFERENCES
[1] | Lemmers RJLF , van der Vliet PJ , Klooster R , et al. A unifying genetic model for facioscapulohumeral muscular dystrophy. Science. (2010) ;329: :1650–1653. |
[2] | Wang LH , Tawil R . Facioscapulohumeral Dystrophy. Curr Neurol Neurosci Rep. (2016) ;16: :66. |
[3] | Geng LN , Yao Z , Snider L , et al. DUX4 activates germline genes, retroelements, and immune mediators: Implications for facioscapulohumeral dystrophy. Dev Cell. (2012) ;22: :38–51. |
[4] | Yao Z , Snider L , Balog J , et al. DUX4-induced gene expression is the major molecular signature in FSHD skeletal muscle. Hum Mol Genet. (2014) ;23: :5342–52. |
[5] | Banerji CRS . PAX7 target gene repression associates with FSHD progression and pathology over 1 year. Hum Mol Genet. (2020) ;29: :2124–33. |
[6] | Snider L , Geng LN , Lemmers RJLF , et al. Facioscapulohumeral dystrophy: Incomplete suppression of a retrotransposed gene. PLoS Genet. (2010) ;6: :e1001181. |
[7] | Wang LH , Friedman SD , Shaw D , et al. MRI-informed muscle biopsies correlate MRI with pathology and DUX4 target gene expression in FSHD. Hum Mol Genet. (2019) ;28: :476–86. |
[8] | Frisullo G , Frusciante R , Nociti V , et al. CD8(+) T cells in facioscapulohumeral muscular dystrophy patients with inflammatory features at muscle MRI. J Clin Immunol. (2011) ;31: :155–66. |
[9] | Dahlqvist JR , Andersen G , Khawajazada T , et al. Relationship between muscle inflammation and fat replacement assessed by MRI in facioscapulohumeral muscular dystrophy. J Neurol. (2019) ;266: :1127–35. |
[10] | Tasca G , Monforte M , Corbi M , et al. Muscle Microdialysis to Investigate Inflammatory Biomarkers in Facioscapulohumeral Muscular Dystrophy. Mol Neurobiol. (2018) ;55: :2959–66. |
[11] | Turki A , Hayot M , Carnac G , et al. Functional muscle impairment in facioscapulohumeral muscular dystrophy is correlated with oxidative stress and mitochondrial dysfunction. Free Radic Biol Med. (2012) ;53: :1068–79. |
[12] | Statland J , Donlin-Smith CM , Tapscott SJ , et al. Multiplex Screen of Serum Biomarkers in Facioscapulohumeral Muscular Dystrophy. J Neuromuscul Dis. (2014) ;1: :181–90. |
[13] | Belzeaux R , Lefebvre M-N , Lazzari A , et al. How to: Measuring blood cytokines in biological psychiatry using commercially available multiplex immunoassays. Psychoneuroendocrinology. (2017) ;75: :72–82. |
[14] | Statland JM , Donlin-Smith CM , Tapscott SJ , et al. Milder phenotype in facioscapulohumeral dystrophy with 7-10 residual D4Z4 repeats. Neurology. (2015) ;85: :2147–50. |
[15] | Jones TI , Chew G-L , Barraza-Flores P , et al. Transgenic mice expressing tunable levels of DUX4 develop characteristic facioscapulohumeral muscular dystrophy-like pathophysiology ranging in severity. Skelet Muscle. (2020) ;10: :8. |
[16] | Roche JA , Tulapurkar ME , Mueller AL , et al. Myofiber damage precedes macrophage infiltration after in vivo injury in dysferlin-deficient A/J mouse skeletal muscle. Am J Pathol. (2015) ;185: :1686–98. |
[17] | Petek LM , Rickard AM , Budech C , et al. A cross sectional study of two independent cohorts identifies serum biomarkers for facioscapulohumeral muscular dystrophy (FSHD). Neuromuscul Disord NMD. (2016) ;26: :405–13. |
[18] | De Paepe B , De Bleecker JL . Cytokines and chemokines as regulators of skeletal muscle inflammation: Presenting the case of Duchenne muscular dystrophy. Mediators Inflamm. (2013) ;2013: :540370. |
[19] | Yang Y , Liu Y , Huang L , et al. Clinical Features and Cytokine Profile in Myositis Patients with Anti-EJ Autoantibodies Detected by a Novel Immunoprecipitation Assay. BioMed Res Int. (2019) ;2019: :1856180. |
[20] | Wosiski-Kuhn M , Caress JB , Cartwright MS , et al. Interleukin 6 (IL6) level is a biomarker for functional disease progression within IL6R358Ala variant groups in amyotrophic lateral sclerosis patients. Amyotroph Lateral Scler Front Degener. (2021) ;22: :248–59. |
[21] | Scheller J , Chalaris A , Schmidt-Arras D , et al. The pro- and anti-inflammatory properties of the cytokine interleukin-6. Biochim Biophys Acta. (2011) ;1813: :878–88. |
[22] | Belizário JE , Fontes-Oliveira CC , Borges JP , et al. Skeletal muscle wasting and renewal: A pivotal role of myokine IL-6. SpringerPlus. (2016) ;5: :619. |
[23] | Muñoz-Cánoves P , Scheele C , Pedersen BK , et al. Interleukin-6 myokine signaling in skeletal muscle: A double-edged sword? FEBS J. (2013) ;280: :4131–48. |
[24] | Pedersen BK , Febbraio MA . Muscle as an endocrine organ: Focus on muscle-derived interleukin-6. Physiol Rev. (2008) ;88: :1379–406. |
[25] | Price FD , von Maltzahn J , Bentzinger CF , et al. Inhibition of JAK-STAT signaling stimulates adult satellite cell function. Nat Med. (2014) ;20: :1174–81. |
[26] | Tierney MT , Aydogdu T , Sala D , et al. STAT3 signaling controls satellite cell expansion and skeletal muscle repair. Nat Med. (2014) ;20: :1182–6. |
[27] | Serrano AL , Baeza-Raja B , Perdiguero E , et al. Interleukin-6 is an essential regulator of satellite cell-mediated skeletal muscle hypertrophy. Cell Metab. (2008) ;7: :33–44. |
[28] | Tanaka T , Narazaki M , Kishimoto T . IL-6 in inflammation, immunity, and disease. Cold Spring Harb Perspect Biol. (2014) ;6: :a016295. |
[29] | Ogata A , Kato Y , Higa S , et al. IL-6 inhibitor for the treatment of rheumatoid arthritis: A comprehensive review. Mod Rheumatol. (2019) ;29: :258–67. |


