
Interrogation of Dystrophin and Dystroglycan Complex Protein Turnover After Exon Skipping Therapy
Abstract
Recently, the Food and Drug Administration granted accelerated approvals for four exon skipping therapies –Eteplirsen, Golodirsen, Viltolarsen, and Casimersen –for Duchenne Muscular Dystrophy (DMD). However, these treatments have only demonstrated variable and largely sub-therapeutic levels of restored dystrophin protein in DMD patients, limiting their clinical impact. To better understand variable protein expression and the behavior of truncated dystrophin protein in vivo, we assessed turnover dynamics of restored dystrophin and dystrophin glycoprotein complex (DGC) proteins in mdx mice after exon skipping therapy, compared to those dynamics in wild type mice, using a targeted, highly-reproducible and sensitive, in vivo stable isotope labeling mass spectrometry approach in multiple muscle tissues. Through statistical modeling, we found that restored dystrophin protein exhibited altered stability and slower turnover in treated mdx muscle compared with that in wild type muscle (∼44 d vs. ∼24 d, respectively). Assessment of mRNA transcript stability (quantitative real-time PCR, droplet digital PCR) and dystrophin protein expression (capillary gel electrophoresis, immunofluorescence) support our dystrophin protein turnover measurements and modeling. Further, we assessed pathology-induced muscle fiber turnover through bromodeoxyuridine (BrdU) labeling to model dystrophin and DGC protein turnover in the context of persistent fiber degeneration. Our findings reveal sequestration of restored dystrophin protein after exon skipping therapy in mdx muscle leading to a significant extension of its half-life compared to the dynamics of full-length dystrophin in normal muscle. In contrast, DGC proteins show constant turnover attributable to myofiber degeneration and dysregulation of the extracellular matrix (ECM) in dystrophic muscle. Based on our results, we demonstrate the use of targeted mass spectrometry to evaluate the suitability and functionality of restored dystrophin isoforms in the context of disease and propose its use to optimize alternative gene correction strategies in development for DMD.
INTRODUCTION
Duchenne muscular dystrophy (DMD) is a progressive myopathy that results from frame-shifting mutations in the X-linked DMD gene that disrupts the mRNA open reading frame and prevents translation of dystrophin protein [1, 2]. Dystrophin plays a structural role at the sarcolemma where it associates with the dystrophin glycoprotein complex (DGC) that tethers it to the extracellular matrix (ECM). Its loss in DMD patients leads to chronic muscle damage, inflammation, fibrosis, regenerative deficits and progressive muscle wasting [3]. Currently, the only effective treatment for DMD are corticosteroids [4], which delays disease progression and severity by several years; however, the introduction of various gene therapy platforms in recent years holds promise for reversing the genetic defect in DMD and ameliorating disease progression [5].
Systemic injection of AOs, based on the phosphorodiamidate morpholino oligonucleotide (PMO)-based chemistry, holds great therapeutic promise for DMD and has been demonstrated to safely restore expression of some dystrophin protein in both canine and mouse DMD models, while also improving muscle function [6–9]. These efforts have resulted in the accelerated approval by the Food and Drug Administration (FDA) of four PMO therapeutics for DMD to date –Eteplirsen, Golodirsen, Viltolarsen, and Casimersen [10–13]. These treatments were approved based on FDA’s determination that an increase in dystrophin production in response to these treatments is reasonably likely to predict clinical benefit in patients with DMD [14]. Final approval will require verification of anticipated clinical benefits upon conducting further clinical trials to evaluate the safety and efficacy of these treatments [14]. Common features of all these treatments include relatively low dystrophin expression and sub-optimal therapeutic efficacy in patients. To optimize and improve clinical outcomes, we require a better understanding of the dynamics and functional qualities of restored dystrophin proteins in vivo. However, presently we lack such information. Acquiring of accurate quantitative data concerning: 1) the accumulation of dystrophin mRNA and protein in response to systemic treatment, 2) the time taken to reach peak dystrophin levels within the muscle, and 3) the persistence, stability and half-life of truncated dystrophin isoforms within dystrophic muscle tissue, would help to optimize the dose and frequency of these treatments.
In this study, we describe the development and standardization of a targeted mass spectrometry approach, in the mdx mouse, to investigate the abundance, expression profile, turnover and half-life of truncated dystrophin protein, along with muscle and dystrophin-associated glycoprotein complex (DGC) proteins. We applied our validated in vivo stable isotope-labeling (SILAM) mass spectrometry (LC-MS/MS) approach using parallel reaction monitoring (PRM) [15–19] to simultaneously evaluate our targeted precursor peptides and their transition ions following SILAM [17, 20]. This method allows for the accurate and reproducible measurement of targeted peptides (heavy isotope-labeled vs. light isotope-labeled), to longitudinally investigate the dynamics of protein turnover and half-life in vivo.
By modeling our mass spectrometry data, our results show that restored exon skipped dystrophin protein, together with its associated DGC proteins, demonstrate differential turnover dynamics in treated mdx mouse muscle compared to wild type (WT). Our results serve as validation of our novel proteomics-based approach to quantitatively investigate the dynamic expression and stability of various truncated dystrophin isoforms to optimize development of exon skipping and gene replacement strategies for DMD and other diseases.
MATERIALS AND METHODS
Animal studies
All animal procedures were conducted in accordance with guidelines for the care and use of laboratory animals as approved by the Institutional Animal Care and Use Committee (IACUC) of Children’s National Hospital (CNH). The C57Bl/10ScSn-mdx/J mouse model of DMD (B10-mdx or mdx) was utilized for all experiments and harbors a nonsense point mutation in exon 23 of the dystrophin gene thereby abolishing dystrophin protein expression [21]. The C57Bl/10ScSnJ (B10-WT or WT) mouse was used as the control. Mice were obtained from the Jackson Laboratory and were housed at the CNH Research Animal Facility where they were provided daily monitoring, food, water and enrichment ad libitum, while being maintained under 12 h light/dark cycles.
SILAM labeling approach
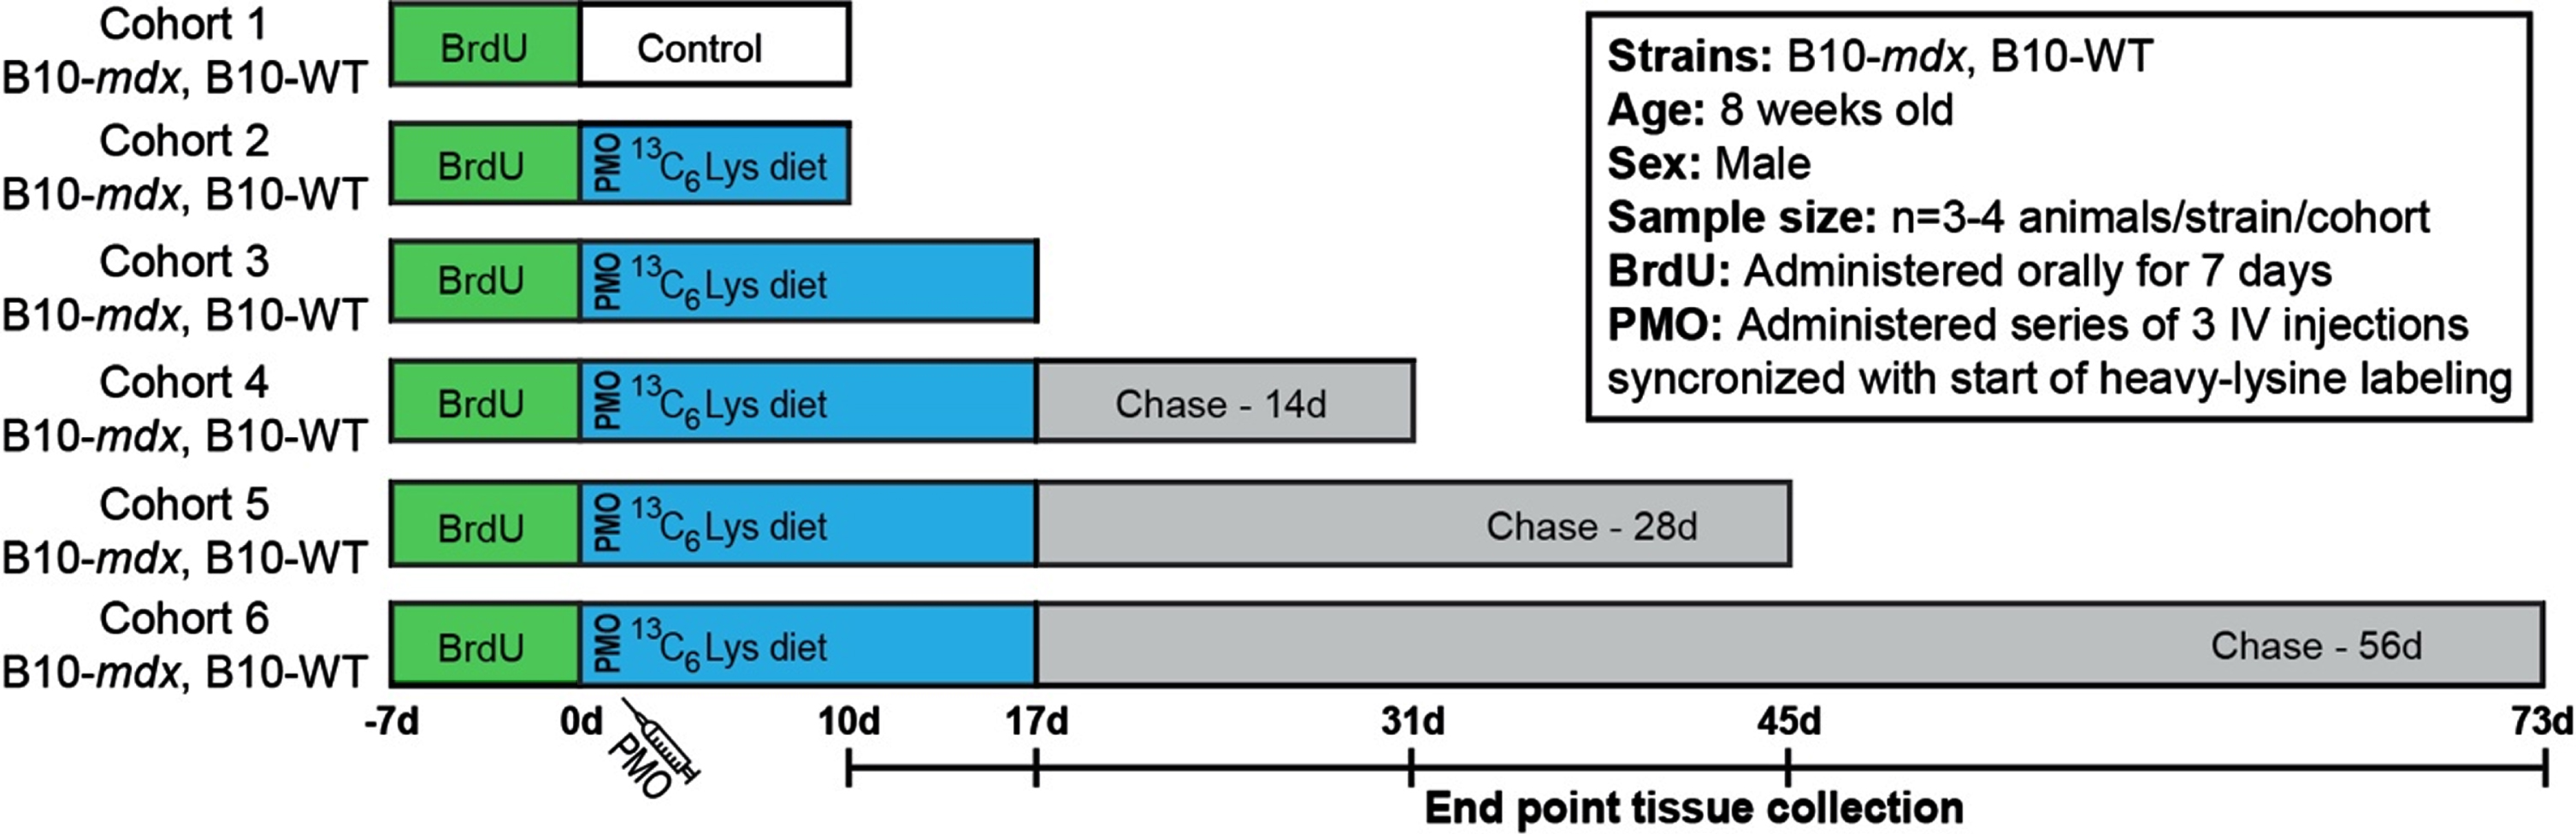
Age-matched mdx and WT mice (8-week-old) were blindly stratified into cohorts (cohorts 1–6, Fig. 1). mdx and WT cohorts were provided unlabeled mouse feed (MF-UNLABELED-IR, Cambridge Isotope Laboratories Inc) in order to acclimate mice to the change in diet (–7 d to –1 d). At 0 d, the indicated cohorts were provided 13C6-Lys (heavy-Lys) labeled feed (MLK-LYS-C-IR, Cambridge Isotope Laboratories Inc) for designated ‘pulse’ phases shown in Fig. 1A. After completion of pulse phase, mice were provided normal feed for the duration of the ‘chase’ phase.
Fig. 1
Workflow to examine the turnover of dystrophin and DGC proteins after exon skipping therapy. Schematic representation of SILAM-based MS approach to evaluate dystrophin expression and turnover in response to exon skipping therapy in mdx, compared to the normal dynamics in WT. BrdU was administered for 7 d prior to administration of vivo-PMO and the 3C6-Lys (heavy-Lys) ‘pulse’ phase. Cohorts were then provided a ‘chase’ phase to evaluate the dynamics of dystrophin turnover over time (10 d –73 d). End point tissue collection dates are shown in the timeline.
Exon skipping strategy
PMO targeting the exon-intron boundary of exon 23 of the dystrophin pre-mRNA (+7–18; 5′-GGCCAAACCTCGGCTTACCTGAAAT-3′) [22–24] were synthesized and covalently conjugated to a non-peptide-based transporter (vivo-PMO; Gene Tools LLC) [25]. PMO was diluted in saline and warmed at 55°C for 10 min prior to injection. Mice (treated mdx cohorts 2–6) were anesthetized using 4% isoflurane and PMO was administered PMO (I.V. tail vein, 28-guage/0.3 mL syringe) once daily for 3 days as follows: 12.5 mg/kg (day 0), 9.375 mg/kg (day 1), 6.25 mg/kg (day 2). Saline was injected at equivalent volumes as a control (mdx cohort 1). WT cohorts did not receive any saline or PMO treatment. Mice were euthanized at the designated time points indicated in Fig. 1.
Bromodeoxyuridine administration
5′-bromo-2′-deoxyuridine or BrdU (Sigma-Aldrich) was administered ad libitum in drinking water at a concentration of 0.8 mg/ml for a period of 7 d prior to the start of our labeling protocol. BrdU was prepared in sterile water and kept protected from light during administration.
Study design
Our major aim was to develop an accurate and quantitative proteomics-based approach to evaluate the stability, functionality and half-life of truncated dystrophin isoforms to inform the clinical development of DMD dystrophin replacement therapies. Here, we have implemented our previously established SILAM-based mass spectrometry protocol [17–19] to define the half-life of restored dystrophin in PMO-treated mdx compared to full length dystrophin in WT mice. This procedure allows for accurate and reproducible detection of labeled/unlabeled peptides by liquid chromatography with tandem mass spectrometry (LC-MS-MS) [17–19]. To investigate protein expression and turnover dynamics in response to therapy, we employed a longitudinal, ‘pulsed’ 13C6-Lys (heavy-Lys) labeling and ‘chase’ strategy (Fig. 1). Our cohorts included both untreated, healthy WT mice and PMO-treated mdx mice. Each cohort (cohorts 2–6) received incremental heavy-Lys ‘pulse’ and ‘chase’ phases to quantify heavy-label incorporation during mRNA translation (rate of protein synthesis) and loss of heavy-labeled peptides (rate of turnover, half-life) over a ∼10-week period (Fig. 1). Simultaneously with the start of our heavy-labeling protocol, mdx cohorts received a series of three vivo-PMO injections staggered over a 3-day period (Fig. 1). Here, PMO was conjugated to a non-peptide-based transporter to improve pharmacokinetics and enhance its therapeutic effect in vivo [25]. Our design was influenced based on our previous reports [26, 27] detailing the variability and delivery of non-conjugated PMO following systemic administration. Cohorts were provided heavy-Lys feed for a 10 d to 17 d ‘pulse’ phase (Fig. 1), to quantify the initial dynamics of dystrophin translation after exon skipping in mdx, as well as its normal rate of translation (replacement) in WT. This timing is coincident with peak dystrophin expression after exon skipping therapy based on our preclinical studies in mdx models [26–29]. Each cohort was then provided unlabeled feed for increasing durations as a ‘chase’ of the heavy-Lys (Fig. 1). This will help determine the rate of labeled-protein turnover in both models. In addition, prior to the heavy-Lys ‘pulse’ phases, all cohorts were administered a synchronized 7 d BrdU-labeling treatment (Fig. 1), as a method to ‘birthdate’ regenerating myofibers in order to track their degeneration over the course of our study to then assess the contribution of pathology-induced muscle fiber turnover to the turnover of dystrophin and associated muscle proteins.
Tissue harvesting and sample collection
Mice were sacrificed at designated timeframes according to the schematic diagram in Fig. 1 and euthanized via CO2 inhalation and cervical dislocation. Muscles samples including tibialis anterior, quadriceps, and triceps were surgically removed, mounted on cork with tragacanth gum, flash-frozen in liquid nitrogen-chilled isopentane and stored at –80°C. For all assays, samples were collected from matched regions of the same muscles by collecting cryosections (Leica CM1900 cryostat) for RNA expression or mass spectrometry (∼80 sections per polypropylene tube per assay) or immunostaining (serial cut slides) and stored at –80°C for processing.
Sample preparation for mass spectrometry analysis
Muscle tissue lysates were prepared from aliquots of sectioned muscle tissue (80 sections, 8μM). Tissue sections were homogenized using a hand-held pellet pestle motor (W.W. Grainger, Inc.) in 150 ul cold lysis buffer (100 mM Tris pH 8.0, 5% sodium dodecyl sulfate, 1X Halt protease inhibitor cocktail (Thermo Scientific). Samples were incubated on ice for 30 min followed by another round of homogenization. Finally, the samples were briefly sonicated and centrifuged for 10 minutes at 16,000 g. The supernatant containing total muscle protein was collected and transferred to a new polypropylene tube. Protein concentration was determined (Pierce Protein Assay Kit), and lysates were aliquoted, flash-frozen and transferred to –80°C for later use. Next, 120μg of total protein per sample was incubated at 95°C in the presence of 1X Laemmli sample buffer (BioRad) and DTT and separated by electrophoresis through 3–8% tris-acetate protein gels (NuPAGE). Gels were stained with Coomassie for 1 h and de-stained overnight at 4°C. Dystrophin peptides were isolated by excising the gel area between 300 and 460 kDa from each lane and processed for in-gel trypsin digestion [30]. To identify proteins associated with the dystrophin-associated glycoprotein complex (DGC), 24 sequential 1 mm slices from a single lane were excised and subjected to in-gel digest as above. Eluted peptides were dried by vacuum centrifugation and reconstituted with 12 ul of 0.1% formic acid for LC-MS/MS proteomic analysis.
LC-MS/MS proteomic analyses
Six μl of each sample was injected onto a Dionex UltiMate 3000 RS UPLC. Chromatography was performed through a mobile phase A of 0.1% formic acid in water and mobile phase B of 0.1% formic acid in 80% ACN. The 2 h gradient consisted of the following steps: 98% A and 2% B for 8 min, 5% to 30% B gradient for 87 min, 30% to 100% B for 5 min, 100% to 100% B for 5 min, 100% to 2% B for 5 min, and back to 98% mobile phase A and 2% mobile phase B for 10 min. The UPLC system was connected to a Q-Exactive HF-X Hybrid Quadrupole-Orbitrap mass spectrometer. Samples were injected onto a sample loop and separated on an EASY-Spray LC Column (75μm diameter, 500-mm length, 100 Å pore size, and 2μm particle size; Thermo Scientific). DDA acquisition was performed at a collision energy of 27 eV, 300-V ion spray, 350°C column temperature, 120,000 resolution for MS1 and 30,000 resolution for MS2. This was performed over a scan mass range of 375 to 1600 m/z. Data Dependent Acquisition (DDA) was employed to identify suitable peptides for subsequent Parallel Reaction Monitoring (PRM). Peptides used for targeted analysis (Supplemental Figure 1) were chosen based on their consistently high intensity over multiple samples. Raw mass spectrometry files were imported into Proteome Discoverer 2.0 (Thermo Fisher) and peptides were identified using the SEQUEST algorithm. For PRM analysis, resolution was set at 60,000 with an isolation window of 1.2 m/z and full MS resolution was set at 120,000 over a scan range of 380 to 1100 m/z. Peptide transitions were later identified and quantified using Skyline software. Selected transition peak areas for each peptide were averaged and values used to calculate relative isotope intensity [heavy/(heavy+light)].
Immunostaining
Cryosections were stained with anti-dystrophin (ab15277, 1:100, Abcam), anti-BrdU-biotin conjugate (B35138, 1:100, Life Technologies), anti-laminin-α2 (4H8-2, 1:100, Sigma) and anti-α-dystroglycan (IIH6C4, 1:50, Millipore). Sections were fixed in ice-cold acetone for 10 min, washed in PBS-Tween (0.1% tween-20; Sigma-Aldrich), and blocked for 1 h in PBS supplemented with 20% goat serum (GeneTex), 0.1% tween-20 (Sigma-Aldrich), and 10 mg/ml BSA (Sigma-Aldrich). Primary antibodies were incubated overnight at 4°C in a humidified chamber. Sections were then washed and probed with the appropriate Alexa Fluor secondary antibody (Thermo Fisher) at a dilution of 1:500 for 1 h. Sections were mounted with Prolong Gold Mounting Media (Thermo Fisher) with 4′,6-diamidino-2-phenylindole (DAPI) for nuclear staining. For BrdU immunostaining, sections were fixed in ice-cold acetone for 10 min, incubated in 2N HCl at 37°C for 30 min, and briefly neutralized with 0.15 M sodium tetraborate (Sigma-Aldrich); sections were blocked and incubated in the appropriate antibodies as described above and stained with a 10x DAPI stock prior to mounting in Prolong Gold Mounting Media.
Microscopy
Microscopy was performed using an Olympus BX61 VS120-S5 Virtual Slide Scanning System with UPlanSApo 40x/0.95 objective, Olympus XM10 monochrome camera, and Olympus VS-ASW FL 2.7 imaging software. Analysis and quantification were performed using Olympus CellSens 1.13, Adobe Photoshop CC and FIJI ImageJ software.
Dystrophin quantification by immunostaining
Dystrophin staining intensity was thresholded uniformly across all images and normalized to WT dystrophin intensity. Dystrophin expression was quantified relative to tissue area by two independent observers and averaged for the final analyses. Detection of low-intensity dystrophin-expressing fibers was reported when clearly identified by its sub-sarcolemmal position relative to laminin-α2 co-immunostaining.
Quantitative real time PCR (qRT-PCR)
Total RNA was extracted from muscle samples by standard TRIzol (Life Technologies) isolation. Purified RNA (400 ng) was reverse-transcribed using Random Hexamers and High-Capacity cDNA Reverse Transcription Kit (Thermo Fisher). Skipped and non-skipped Dmd transcripts were measured by qRT-PCR using TaqMan assays and Taqman Fast Advanced MasterMix (Thermo Fisher) on an ABI QuantStudio 7 Real-Time PCR machine (Applied Biosystems). The TaqMan probe for the skipped Dmd product (AIOIXIL; Thermo Fisher) was designed to amplify the splice junction spanning Dmd exons 22–24. TaqMan probe Mm01216492_m1 (Thermo Fisher) amplifies the region spanning Dmd exons 2–3 to calculate non-skipped Dmd transcript levels. Percent exon skipping was calculated based on the corresponding ΔCt values for skipped and total Dmd transcript normalized to Hprt (Mm01545399_m1; Thermo Fisher) and 18S (Mm03928990_g1; Thermo Fisher) mRNA, using the following equation: [(Average of triplicate reactions of skipped Dmd)/(Average of triplicate reactions of skipped Dmd + Average of triplicate reactions of non-skipped Dmd)] * 100.
Droplet Digital PCR (ddPCR)
cDNA samples were diluted 1:25 yielding a final concentration of 2 ng/ul. Next, 15μl reactions using QuantStudio 3D Digital PCR Master Mix v2 (A26358, ThermoFisher) were loaded onto Quantstudio 3D digital PCR 20K Chip (A26316, ThermoFisher) using the Quantstudio chip loading device. Primer probes for VIC-labeled Dmd exon 2–3 and FAM-labeled skipped Dmd exon 22–24 were diluted 20-fold (1x, 5% reaction volume). For ddPCR we used the following cycling conditions: 96°C for 10 minutes, followed by 39 cycles of denaturation at 98°C for 30 seconds and annealing/extension at 60°C for 2 minutes. Cycled chips were loaded into Quantstudio 3D chip reader and resulting data was imported into QuantStudio 3D Analysis Suite Cloud Software (ThermoFisher). For analysis, we generated a copy number for each labeled probe in our samples. Data corresponds to absolute copy number of skipped Dmd transcript per ng RNA.
Capillary Gel Electrophoresis (Wes)
Capillary gel electrophoresis Western immunoassay was performed using the Wes system (ProteinSimple) according to the manufacturer’s instructions using a 66–440 kDa Separation Module (ProteinSimple). Protein lysates were loaded into capillaries at a concentration of 0.2 mg/ml for detection and quantification of dystrophin and vinculin proteins. Here, we used anti-dystrophin (ab15277, Abcam, dilution 1:15) and anti-vinculin (GTX109749, GeneTex, dilution 1:100) antibodies together with anti-rabbit secondary antibodies (042-206, Protein Simple). A standard curve was generated using a mixture of WT/mdx samples denoting 20%, 10%, 7.5%, 5%, 2.5% and 0% WT dystrophin levels. Relative dystrophin expression was calculated based on dystrophin chemiluminescence intensities normalized to vinculin The area corresponding to chemiluminescence signal was determined using Compass for SW software. Dystrophin expression values were plotted along our standard curve to calculate % dystrophin (relative to WT) in mdx samples.
Statistical modeling and analyses
For modeling the trajectories of normalized (normalized to start at 100% by dividing all data points by highest observation for the strain at chase = 0 d [pulse = 17 d; cohort 3]) proportions of heavy-labeled to total protein, we used exponential decay regression models: C (t) = eβ0+β2straine(β1+β3strain)t where t denotes time, strain denotes mdx or WT, and C(t) denotes the normalized proportion at time t. Model performance was evaluated with adjusted R2 while a residual analysis was carried out to judge whether assumptions for modeling were met satisfactorily. A correlation analysis was carried out between the dystrophin data on the quadriceps from the left and right muscles to judge whether data could be averaged for the same mice and either left and right datapoints incorporated when both were not available. A sensitivity analysis was also carried out with dystrophin data using left muscle and right muscle data only. All technical replicates for the same mouse were averaged. An alpha of 0.05 was pre-specified and hypothesis tests within the regression framework (p-values for comparison of trajectories reported) were two-tailed. Figures of normalized data and expected trajectories based on model fit are provided. The half-life was calculated using estimated coefficients. Furthermore, an analysis was conducted by assuming that degeneration of fibers occurred at a constant rate and that the analyses must be adjusted for retained % fiber. In this case, a scaling factor was used for the mdx mice to adjust for what proportion of fibers were retained at a particular end point. For example, consider that we assume at time = 0, 100% of fibers are retained, while at day 1, a% of fibers have degenerated; in that case, data is available to observe only on the (100-a)% of retained fibers, and so we can scale the observed signal by dividing by (100-a)%. Similarly, at day t, (100-a)∧(t)% of fibers are retained and so this is adjusted for. We ran corrections for this at two levels: 0.25% and 1% daily degeneration rate. For all other statistical comparisons, we performed two-tailed, nonparametric Mann-Whitney rank sum tests ( Fig. 2, Fig. 5, Supplemental Figure 2). Here, data are reported as scatter plots with mean values±SD. Differences were considered statistically significant for p < 0.05 and was reported as follows in figure panels: ***p < 0.001, **p < 0.01, *p < 0.05.
Fig. 2
Dynamics of exon skipped Dmd transcript and dystrophin protein localization in treated mdx mice. A) Quantification of exon skipped Dmd transcript relative to total Dmd transcript by qRT-PCR represented as percent skipped mRNA at each end point for quadriceps, triceps and tibialis anterior. B) Quantification of dystrophin-expressing fibers normalized per mm2 for all tissues/end points above (A). Data reported as scatter plot together with the mean ± S.D. Statistical analyses performed using the nonparametric Mann-Whitney rank sum test, ***p < 0.001, **p < 0.01, *p < 0.05 (A, B). C) Representative immunostaining images demonstrating the extent of dystrophin expression and relative staining intensity (qualitative assessment of half-life) for mdx quadriceps from each cohort following the respective pulse/chase phases. Dystrophin shown in red, DAPI-stained nuclei shown in blue. Scale bars represent 50μm.
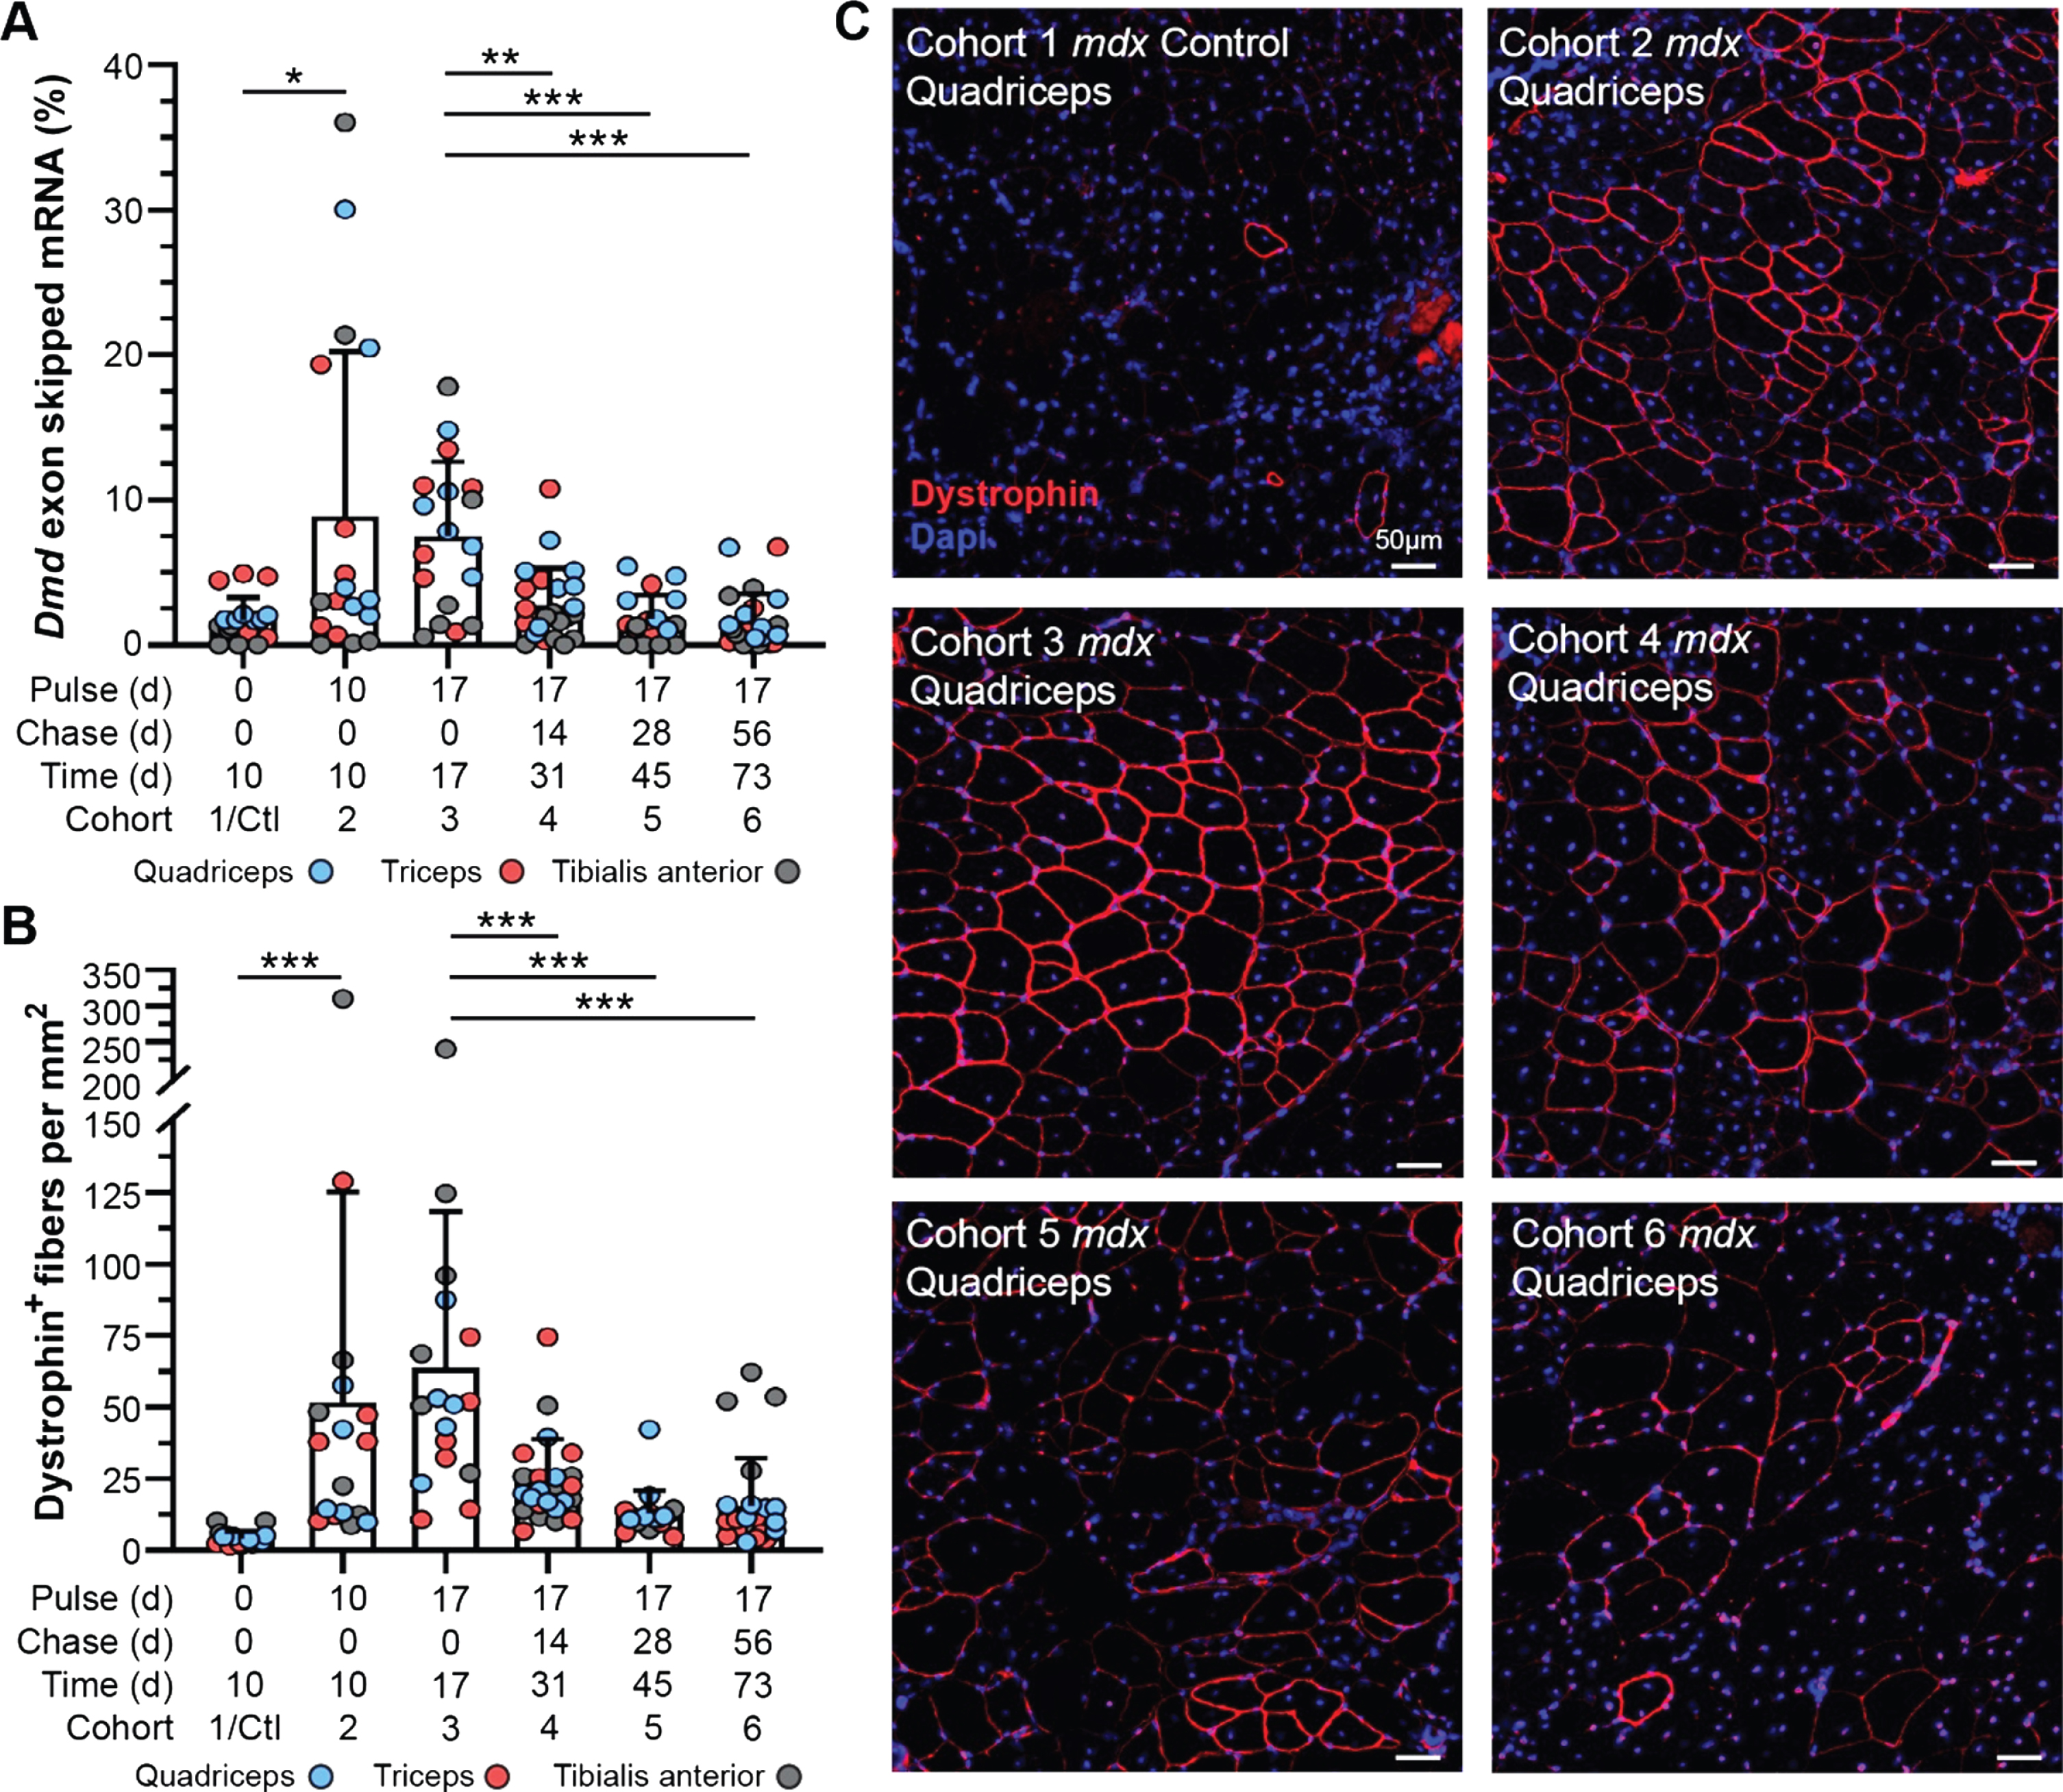
Fig. 5
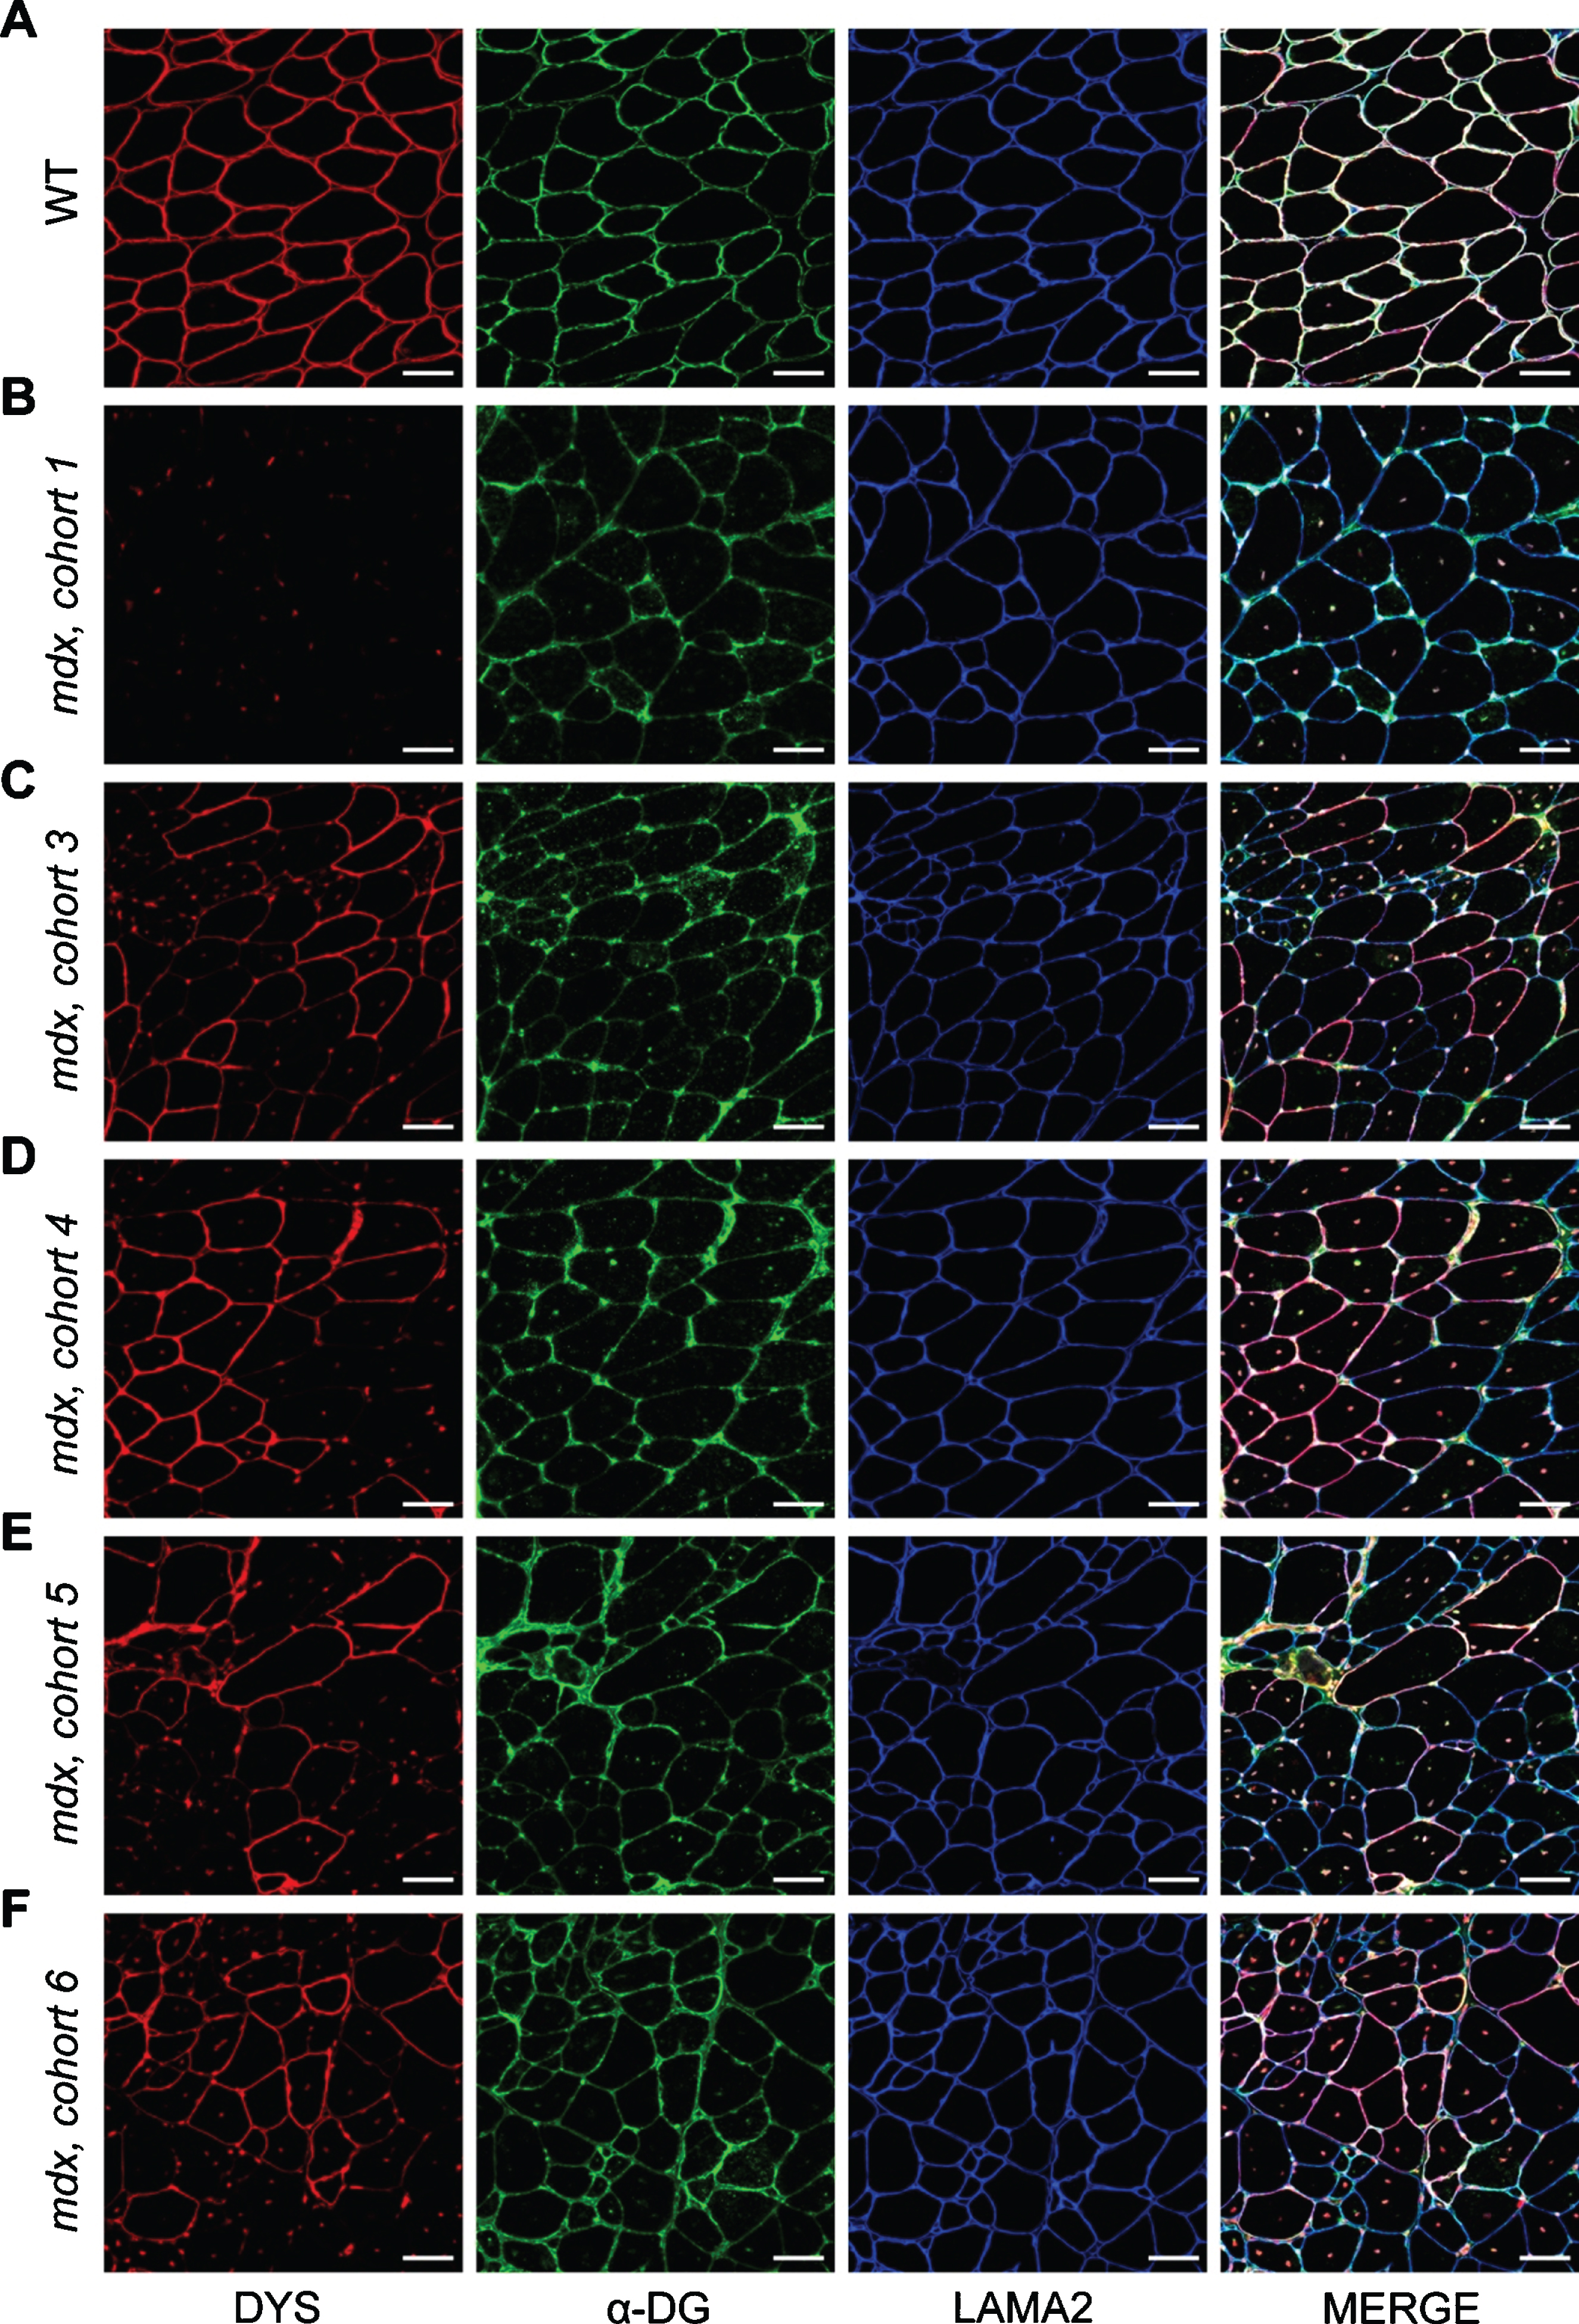
Localization of DGC proteins after dystrophin-restoring therapy. A–F) Co-mmunolabeling of dystrophin (DYS, red), α-dystroglycan (α-DG, green), laminin-α2 (LAMA2, blue) to assess protein localization in areas of dystrophin restoration after therapy. Immunostaining was performed on WT muscle (A), control/untreated mdx muscle from mdx cohort 1 (B), and PMO-treated mdx muscles from mdx cohorts 3–6 (C–F, respectively). Merged panels show dystrophin, α-dystroglycan, and laminin-α2 localization with DAPI-labeled nuclei. Scale bars represent 50μm.
RESULTS
Therapeutically restored dystrophin transcript and protein levels decline after 17 days of post treatment in mdx muscle
To evaluate the longitudinal efficacy of a single bout of exon skipping therapy in our study cohorts, we assayed relative and absolute quantities of exon skipped Dmd transcript by quantitative real time PCR (qRT-PCR) and droplet digital PCR (ddPCR), and compared this with dystrophin protein expression and localization in the muscle tissue by immunostaining (Fig. 2, Supplemental Figure 2). We investigated skipped transcript and restored, truncated protein levels 10 d, 17 d, 31 d, 45 d, and 73 d after exon skipping therapy in mdx cohorts, focusing on the quadriceps, triceps, and tibialis anterior based on our previous experience of enhanced therapeutic effect in these muscles [26, 27] (Fig. 1, Fig. 2A–C). Levels of skipped Dmd transcript (relative to non-skipped Dmd transcript) reached maximal levels (mean ∼8–10%, range up to ∼35%) by 10 d post-treatment, and persisted relatively unchanged over the next week through the 17 d end point (Fig. 2A). However, between the 17 d and 31 d end points, skipped transcript levels drastically declined to just above baseline levels (untreated cohort) (Fig. 2A). Based on the detailed pharmacokinetics of PMO and peptide-conjugated PMO [31, 32], we anticipate retention of the drug within the muscle for < 1 week, before its decline to undetectable levels. This would align with our finding that skipped transcript plateaued, or potentially began to decline, between 10 d and 17 d post-treatment (Fig. 2A). This sudden decline in skipped mRNA levels was confirmed by droplet digital PCR (ddPCR) that allows for absolute quantification of skipped transcript levels within the tissue (Supplemental Figure 2A). Although skipped Dmd transcript was still detectible at low copy number for several muscle samples in our longer-term cohorts (cohorts 4–6), mainly in the quadriceps and triceps in line with our previous investigations [26, 27], these levels were not significantly different from baseline controls. This data indicates stability of the skipped Dmd transcript for ∼3 weeks, that would correspond with an abrupt termination of mRNA translation providing a logical starting point to assess dystrophin protein turnover in our study.
Next, we evaluated dystrophin expression qualitatively by immunostaining for dystrophin at its sub-sarcolemmal position relative to extracellular-bound laminin-α2, to assess the abundance and proper localization of restored dystrophin protein over time in comparison with the dynamics of skipped Dmd transcript (Fig. 2B, C). In concert with its mRNA transcript dynamics, we found dystrophin protein was rapidly expressed by the 10 d end point and reached maximal expression in terms positively-stained fibers per area around 17 d post-treatment (∼50–60 dystrophin-positive fibers per mm2) (Fig. 2B). Subsequent loss of dystrophin expression was observed, both in terms of the total number of positive fibers and intensity of dystrophin staining within individual fibers at end points ranging from 31 d to 73 d post-treatment (Fig. 2B). Investigation of dystrophin intensity revealed –a slight increase in in the abundance of sarcolemmal-bound dystrophin between 10 d and 17 d, with the most robust and widespread levels of dystrophin achieved in the 17 d cohort (Fig. 2C). Notably, at all subsequent end points, there was a striking diminution of intensity of dystrophin staining although it remained distinguishable from background and baseline levels. This result was independently confirmed at the protein level by semi-quantitative capillary gel electrophoresis approach (WES) (Supplemental Figure 2B, C).
Therapeutically restored dystrophin exhibits altered stability and slower turnover in PMO-treated mdx muscle than WT
Administration of pulsed stable isotope-labeled (13C6-lysine) feed to mice over various intervals, in conjunction with increasing unlabeled ‘chase’ periods (Fig. 1), allowed detection and quantification of lysine-containing peptides and measurement of heavy lysine-labeled to light labeled peptide pair ratios over time.
To determine the abundance of heavy- and light-dystrophin isoforms over time we used PRM as described in the method and monitored same peptides across all samples and all data points. Raw mass spectrometry data were analyzed using Proteome Discoverer to identify unique peptides corresponding to mouse dystrophin that met specific criteria (e.g terminal lysine residues, mouse dystrophin specificity, etc). We confirmed that all unique target peptides employed (TQSTTLSEPTAIK, LEQSIQSAQEIEK, QLLEQPQAEAK; Supplemental Figure 1) demonstrated accuracy and stability, with limited inter-peptide variable and background signal intensity when assayed in both sets of cohorts (PMO-treated mdx and untreated WT). Next, we identified a series of reproducible transition MS/MS fragment peaks corresponding to our peptide and ratios heavy to light were determined using Skyline software. Ratios determined from transition ions were averaged across the individual target peptide data sets to determine the overall dystrophin isoform intensities and the proportion of heavy-labeled dystrophin per total dystrophin protein (Supplemental Figure 3A, B).
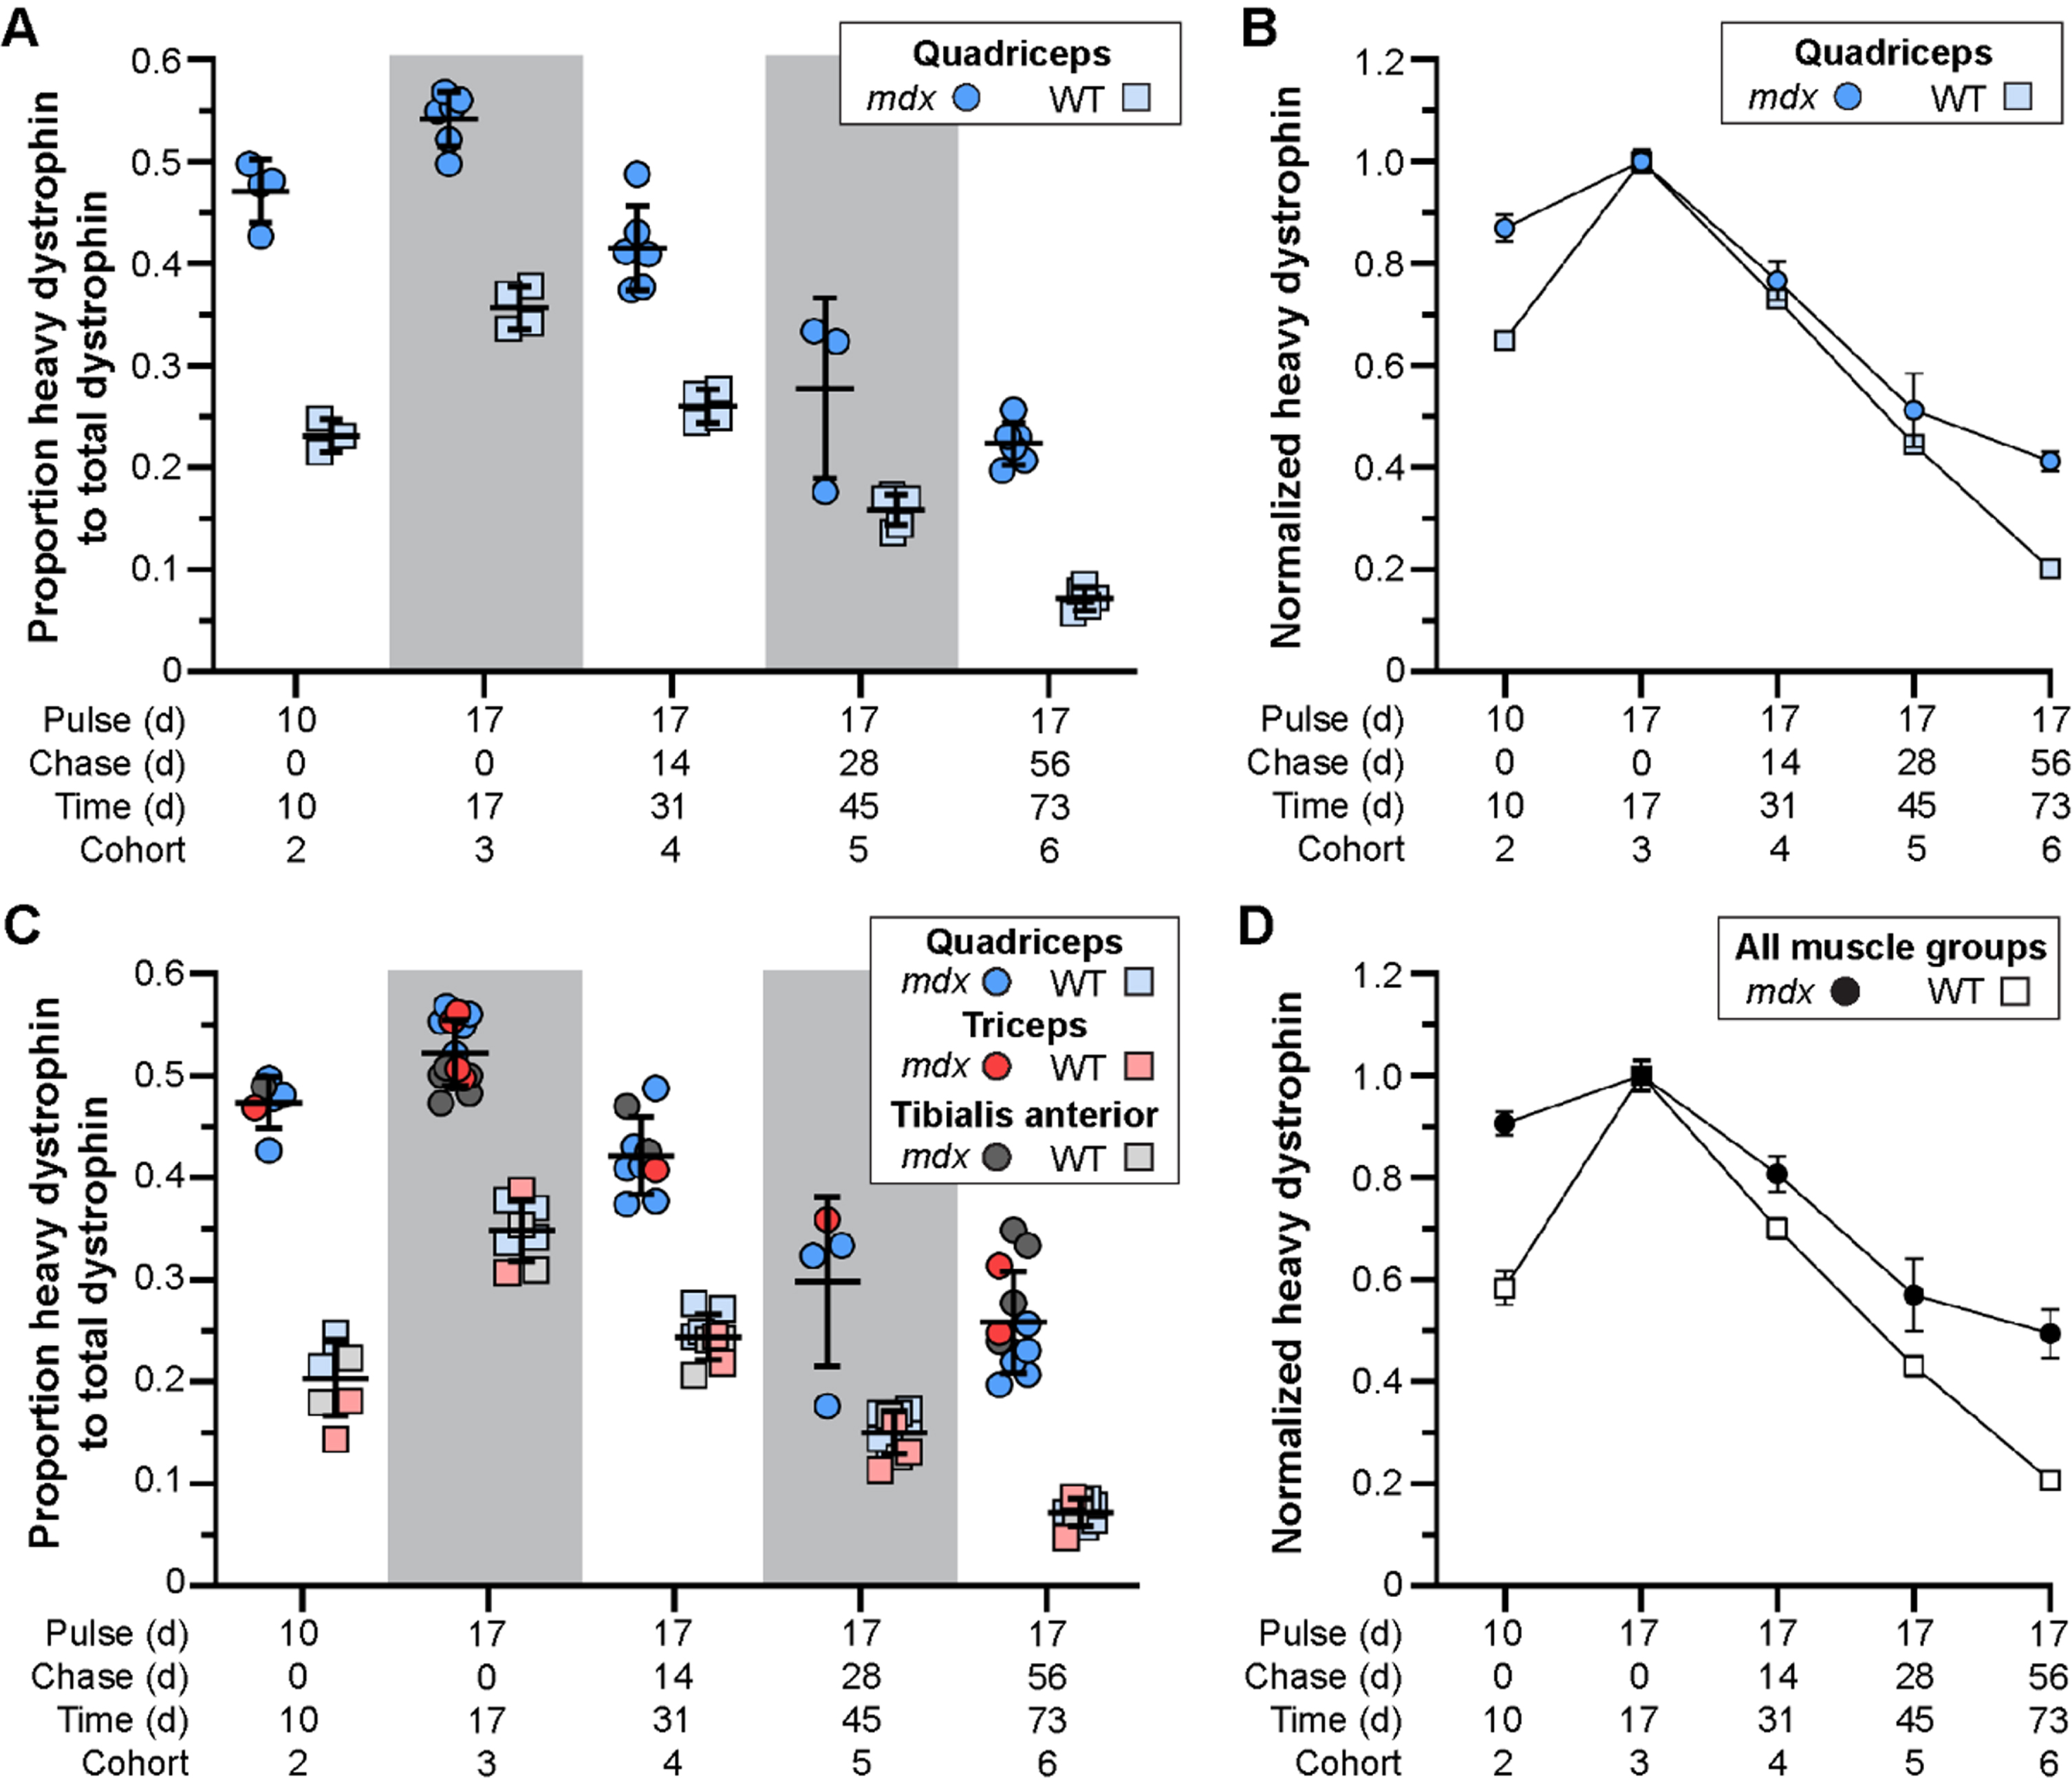
In response to exon skipping-mediated dystrophin restoration, we found altered rates of protein expression and turnover in treated mdx quadriceps (Fig. 3A, B), which was mirrored in subsequent analyses of triceps and tibialis anterior muscles (Fig. 3C, D). Within 10 d post-treatment, mdx muscles showed heavy-dystrophin labeling in ∼47% of total dystrophin, with maximal labeling achieved by 17 d corresponding to ∼55% of total dystrophin detected. This was in contrast to < 25% labeling of WT dystrophin by 10 d, and ∼35% labeling by 17 d. To assess the altered turnover dynamics between dystrophin isoforms in both mdx and WT, we normalized all proportions to the peak values obtained 17 d post-treatment (cohort 3, WT and mdx independently normalized) to directly compare the rates of heavy 13C6-Lys incorporation and loss with time (Fig. 3B, D). Here, nearly 40% of labeled, truncated dystrophin in treated mdx muscle was retained 56 d after reaching peak levels (73 d post-treatment, cohort 6), while only ∼20% labeled dystrophin remained by this end point in WT muscles. Portrayal of the data in this respect, clearly demonstrates the two critical findings. First, in treated mdx, prolonged retention of the restored, truncated dystrophin corresponds with a reduced rate of dystrophin protein turnover in dystrophic muscle after therapy (∼2-fold slower turnover rate in mdx). Second, in WT, the rate of dystrophin-labeling (over the ‘pulse’ phases) and subsequent loss of labeled protein showed mirrored slope, indicating that the presence of 13C6-Lys does not influence the turnover of lysine labelled peptides. From this we calculated a turnover rate (or protein replacement rate) of ∼2% per day for dystrophin in normal, healthy muscles.
Fig. 3
Altered stability of therapeutically restored dystrophin protein in treated mdx mice. A–D) Ratio of heavy-Lys labeled dystrophin protein relative to total dystrophin protein, and its rate of synthesis and turnover over time, for mdx and WT. Dystrophin protein dynamics plotted as the ratio of heavy-Lys labeled dystrophin to total dystrophin (A, C) or the normalized ratio (cohort 3 peak level averages set to 1.0) of heavy-Lys labeled dystrophin to total dystrophin (B, D) for the quadriceps (A, B) or combined quadriceps, triceps, and tibialis anterior muscles (C, D) demonstrating the consistency and reproducibility of our SILAM approach to distinguish changes in expression and half-life of dystrophin isoforms. Raw data reported as scatter plot together with bar plot designating the mean ± S.D (A, C) or mean ± S.D (B, D).
On the basis that only dietary heavy lysine would be available for its translation, we would expect that all de novo truncated dystrophin would be labelled, but we found only ∼50% labeling of de novo dystrophin (mdx cohort 3). Thus, while essential amino acids are absorbed exclusively from the diet, they are also recycled via protein degradation for subsequent usage. This limited our ability to label all de novo dystrophin proteins without a pre-treatment ‘wash out’ phase of 12C6-lysine from the system. However, this did not impair our ability to accurately track the relative proportions of heavy labeled-dystrophin over time, or model its dynamic behavior in this study.
Degeneration promotes rapid turnover of DGC and other muscle proteins despite limited dystrophin restoration after therapy
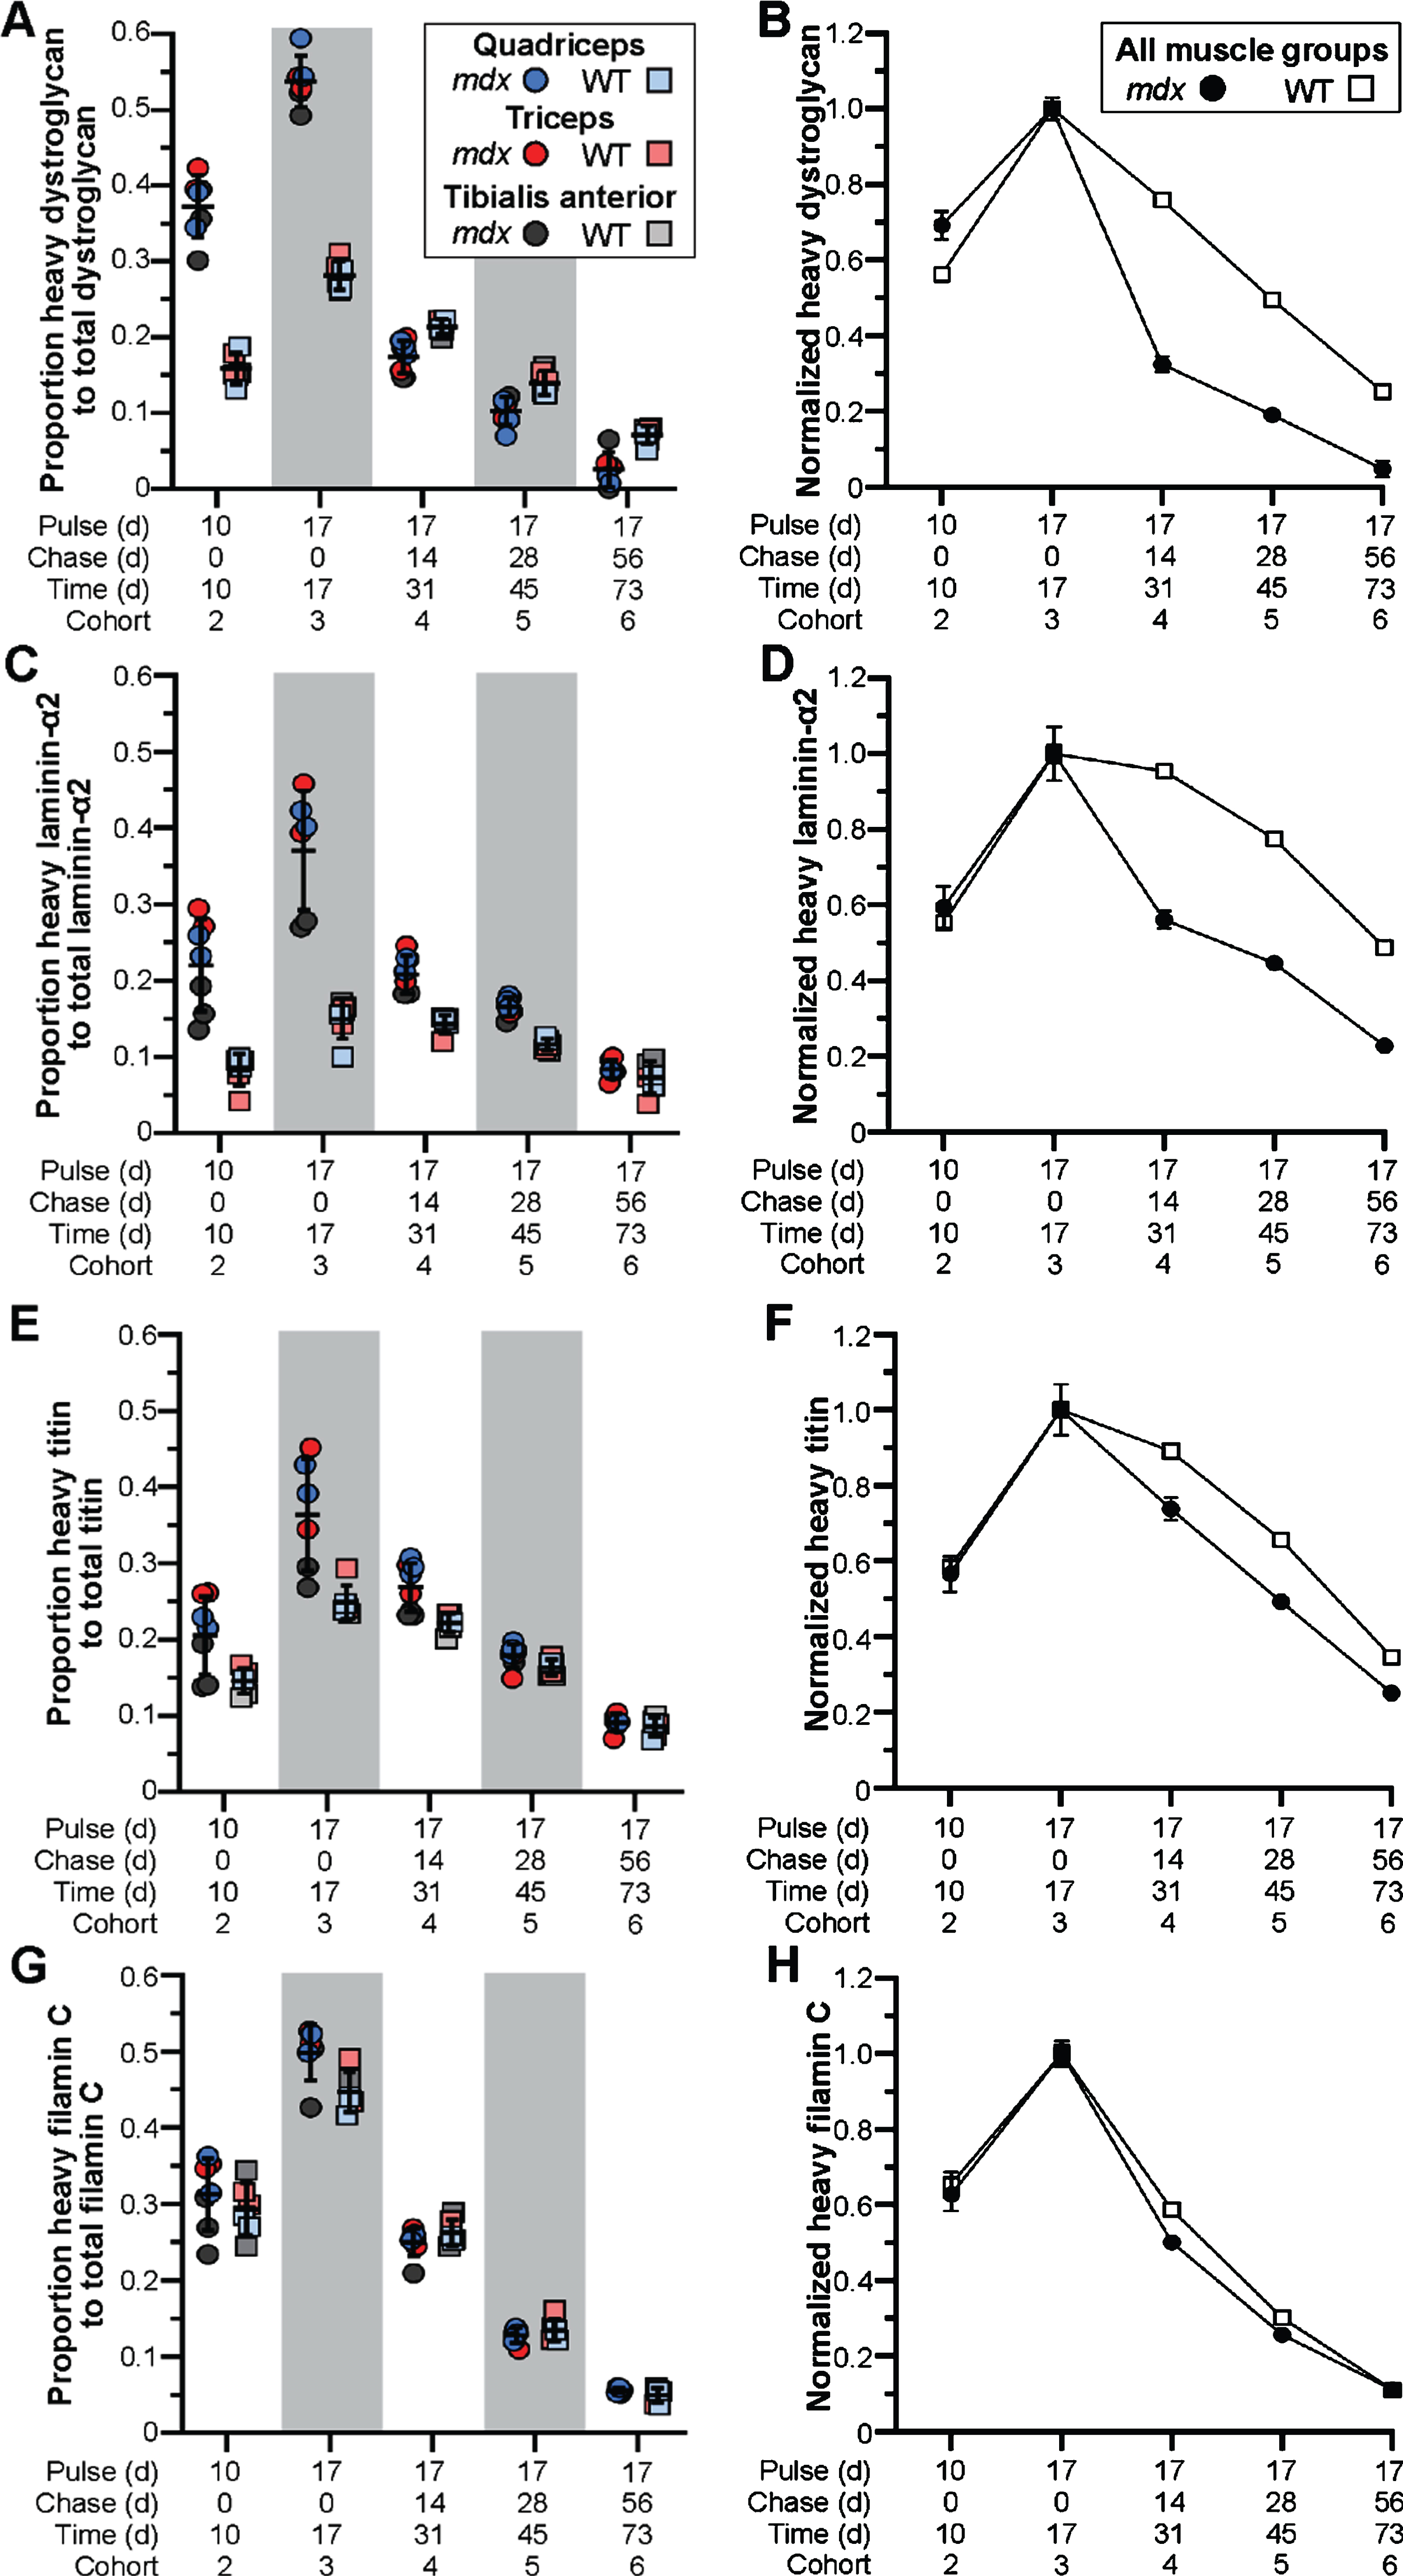
Next, we employed our targeted mass spectrometry approach to evaluate the dynamics of muscle and DGC proteins in our model. We determined the relative abundance and turnover of heavy-labeled dystrophin-associated glycoproteins, α-dystroglycan (Fig. 4A, B) and laminin-α2 (Fig. 4C, D), as well as muscle proteins, titin (Fig. 4E, F) and filamin C (Fig. 4G, H). In contrast to the turnover profile for truncated dystrophin, we found the inverse relationship for mdx DGC proteins, where α-dystroglycan and laminin-α2 were more rapidly turned over (compared to WT) resulting in the abrupt loss of heavy-labeled proteins after peak labeling 17 d post-treatment (Fig. 4A–D). Here, between 17 d (cohort 3) and 31 d (cohort 4) the proportion of labeled protein fell drastically by > 60% for α-dystroglycan and > 40% for laminin-α2, in comparison to the 20% drop in labeled WT α-dystroglycan and miniscule drop in labeled WT laminin-α2 over this same period (Fig. 4A–D). Further, by the 73 d end point, we were left with ∼5% labeled-α-dystroglycan and > 25% labeled-laminin-α2 in treated mdx cohort 6, in comparison to the retention of some 25% labeled-α-dystroglycan and 50% labeled-laminin-α2 in the corresponding WT cohort (Fig. 4A–D).
Fig. 4
Pathology-induced rapid turnover of DGC proteins in treated mdx mice. A–H) Ratio of heavy-Lys labeled protein relative to total protein for dystroglycan (DGC, A, B), laminin-α2 (ECM, C, D), titin (sarcomere, E, F) and filamin C (sarcolemma, Z-disk, G, H), and their rates of synthesis and turnover over time, for mdx and WT. DGC protein dynamics plotted as the ratio of heavy-Lys labeled dystrophin to total dystrophin (A, C, D, G) or the normalized ratio (cohort 3 peak level averages set to 1.0) of heavy-Lys labeled protein to total protein (B, D, F, H) for the quadriceps, triceps, and tibialis anterior muscles. Raw data reported as scatter plot together with mean ± S.D (A, C, D, G) or normalized mean value±S.D (B, D, F, H).
To assess how these altered dynamics influence the function and localization of α-dystroglycan and laminin-α2 after PMO therapy, we co-immunostained the triceps muscles from PMO-treated mdx cohorts for dystrophin, α-dystroglycan and laminin-α2 and investigated their expression and localization in both dystrophin-expressing and non-dystrophin-expressing regions. It appears, as a function of time, that α-dystroglycan protein localization mirrors dystrophin localization (Fig. 5A–F). In these areas of restored dystrophin, we observed more finely-localized expression patterns for α-dystroglycan and laminin-α2 along the sarcolemma, as well as a resolution of suspected protein aggregates observed in untreated mdx muscle and the earlier PMO-treated mdx cohorts (cohort 1 and 3, Fig. 5B, C). Here, this data suggests that acute restoration of dystrophin with exon skipping improves muscle ECM remodeling and the localization of α-dystroglycan and laminin-α2 with time, and furthermore, that chronic use of dystrophin-restoring therapies would be anticipated to restore and shift DGC protein dynamics towards a more stable state. However, additional studies are required to determine if restored dystrophin stability is influenced by potential aggregation, or whether the restored dystrophin protein has formed a functional complex with dystroglycan and other DGC components at the sarcolemma.
The rapid turnover of DGC proteins in the context of our study and resulting drug efficacy, where only limited dystrophin restoration was observed, suggests that the turnover of these proteins is dominated by disease pathogenies (ECM remodeling, myofiber degeneration). Further, while we would expect that any effect on rescue of dystrophin, would be diluted by its restoration in only a subset of myofibers, we were, interested to observe the same turnover trajectory for titin, that has essential structural functions at the sarcomere, which we predicted would show a similar turnover to WT. For titin, we found a ∼25% loss of labeled peptide over the 14 d window between the end points for cohorts 3 and 4, compared with only a ∼10% loss in WT muscle over this time (Fig. 4E, F). This difference was more pronounced in treated mdx quadriceps and triceps in accordance with the heightened pathology we find in these tissues [26, 27]. By the end of the study (73 d post-treatment, cohort 6), we observed a retention of only ∼15% labeled-titin proteins in treated mdx, compared to ∼25% retention in WT muscles (Fig. 4E, F). Thus, despite its role outside the DGC, titin was still rapidly turned over probably as a direct reflection of chronic myofiber degeneration. This is supported by several studies, including our own, demonstrating the detection of small titin fragments in both serum and urine of DMD patients, and their development as a robust disease-relevant serum biomarker for DMD clinical evaluations [15, 16, 33, 34].
Further, we observed no difference in the rate of heavy labeling or protein turnover for filamin C between our strains at any end point (Fig. 4G, H). Filamin C has been shown to play numerous roles within the myofiber, where it supports cross-linking of actin filaments at the Z-disc, and binds γ- and δ-sarcoglycan at the sarcolemma [35], in addition to other roles. Despite these functions, the turnover of filamin C directly mirrored WT, where both strains showed rapid expression and turnover rates (Fig. 4G, H). Perhaps these dynamics are influenced in part by its interactions with > 90 potential binding partners. Nevertheless, this data shows the varying influences of disease pathology on muscle-specific protein dynamics that would require chronic therapy to restore normal turnover dynamics. Our ability to simultaneously analyze multiple peptides within a single gel slice (for instance, isolation of laminins with dystrophin due to relatively large molecular weights), allows us to broaden our investigations in future studies to assess a wider range of structural or signaling proteins to provide information on the overall therapeutic impact of gene therapies.
Restored dystrophin protein, but not DGC and other muscle proteins, potentially resists muscle degeneration in PMO-treated mdx mice
Our previous demonstration of gross disturbance of myogenic activity and regeneration of dystrophic muscle in the context of disease progression and genetic modifiers [36], provides an incisive route to evaluation of the impact of myofiber degeneration on the turnover of muscle proteins in our current study. Prior to our administration of heavy-labeled feed, all cohorts were provided bromodeoxyuridine (BrdU; thymidine analog) water for 1 week to label proliferating myoblasts and benchmark the extent/rate of myofiber regeneration at the start of our study. Quantification of BrdU-labeled, centrally-nucleated fibers at each end point in mdx could then be used to assess the rate of myofiber degeneration with time (Fig. 6A, C). We found that detection of labeled-myofibers declined steadily between 10 d and 73 d post-treatment, ultimately indicating a consistent loss of labeled fibers by ∼1% daily (slope = –0.4143, p = 0.0008, R2 = 0.9845) over the course of this study (Fig. 6A, B). Here, large labeled myofiber clusters at the start of the study progressively shrink in both cluster size and overall number of labeled fibers at a constant rate for each end-point assessed (Fig. 6C).
Fig. 6
Muscle degeneration differentially affects turnover of muscle proteins in treated mdx mice. A-B) Quantification of BrdU-labeled fibers as a measure of muscle degeneration over time from baseline for mdx. WT cohorts exhibited almost no regeneration as marked by BrdU incorporation in all WT cohorts. BrdU-positive fibers were quantified per mm2 for the quadriceps, triceps and tibialis anterior at each end point indicating loss of fibers over time that were repairing during the BrdU pulse phase the week prior to the lysine-labeling phase (A). Linear regression model indicating a consistent and significant loss of BrdU-labeled fibers over time as a consequence of disease pathogenesis in mdx (B; p = 0.00008, R2 = 0.9845). Data reported as scatter plot together with a bar plot designating the mean ± S.D (A), or mean value±S.D (B). Statistical analyses performed using the nonparametric Mann-Whitney rank sum test, ***p < 0.001, **p < 0.01, *p < 0.05. C) Representative immunostaining images demonstrating the extent of muscle regeneration (BrdU-positive centrally-nucleated fibers) at the start of the study and subsequent loss of BrdU-labeled fibers over time for mdx quadriceps for the designated cohorts. BrdU shown in green, laminin-α2 shown in magenta, DAPI-stained nuclei shown in blue. D) Evidence that dystrophin-expressing fibers can resist damage and subsequent necrosis despite proximity to widespread muscle necrosis. Both high- and low-intensity dystrophin expression (red sarcolemmal staining) observed amidst localized necrosis in this region (infiltration of interstitial mononuclear cells and non-specific fiber staining). Scale bars represent 100μm (C), 200μm (D), 50μm (D, inlay).
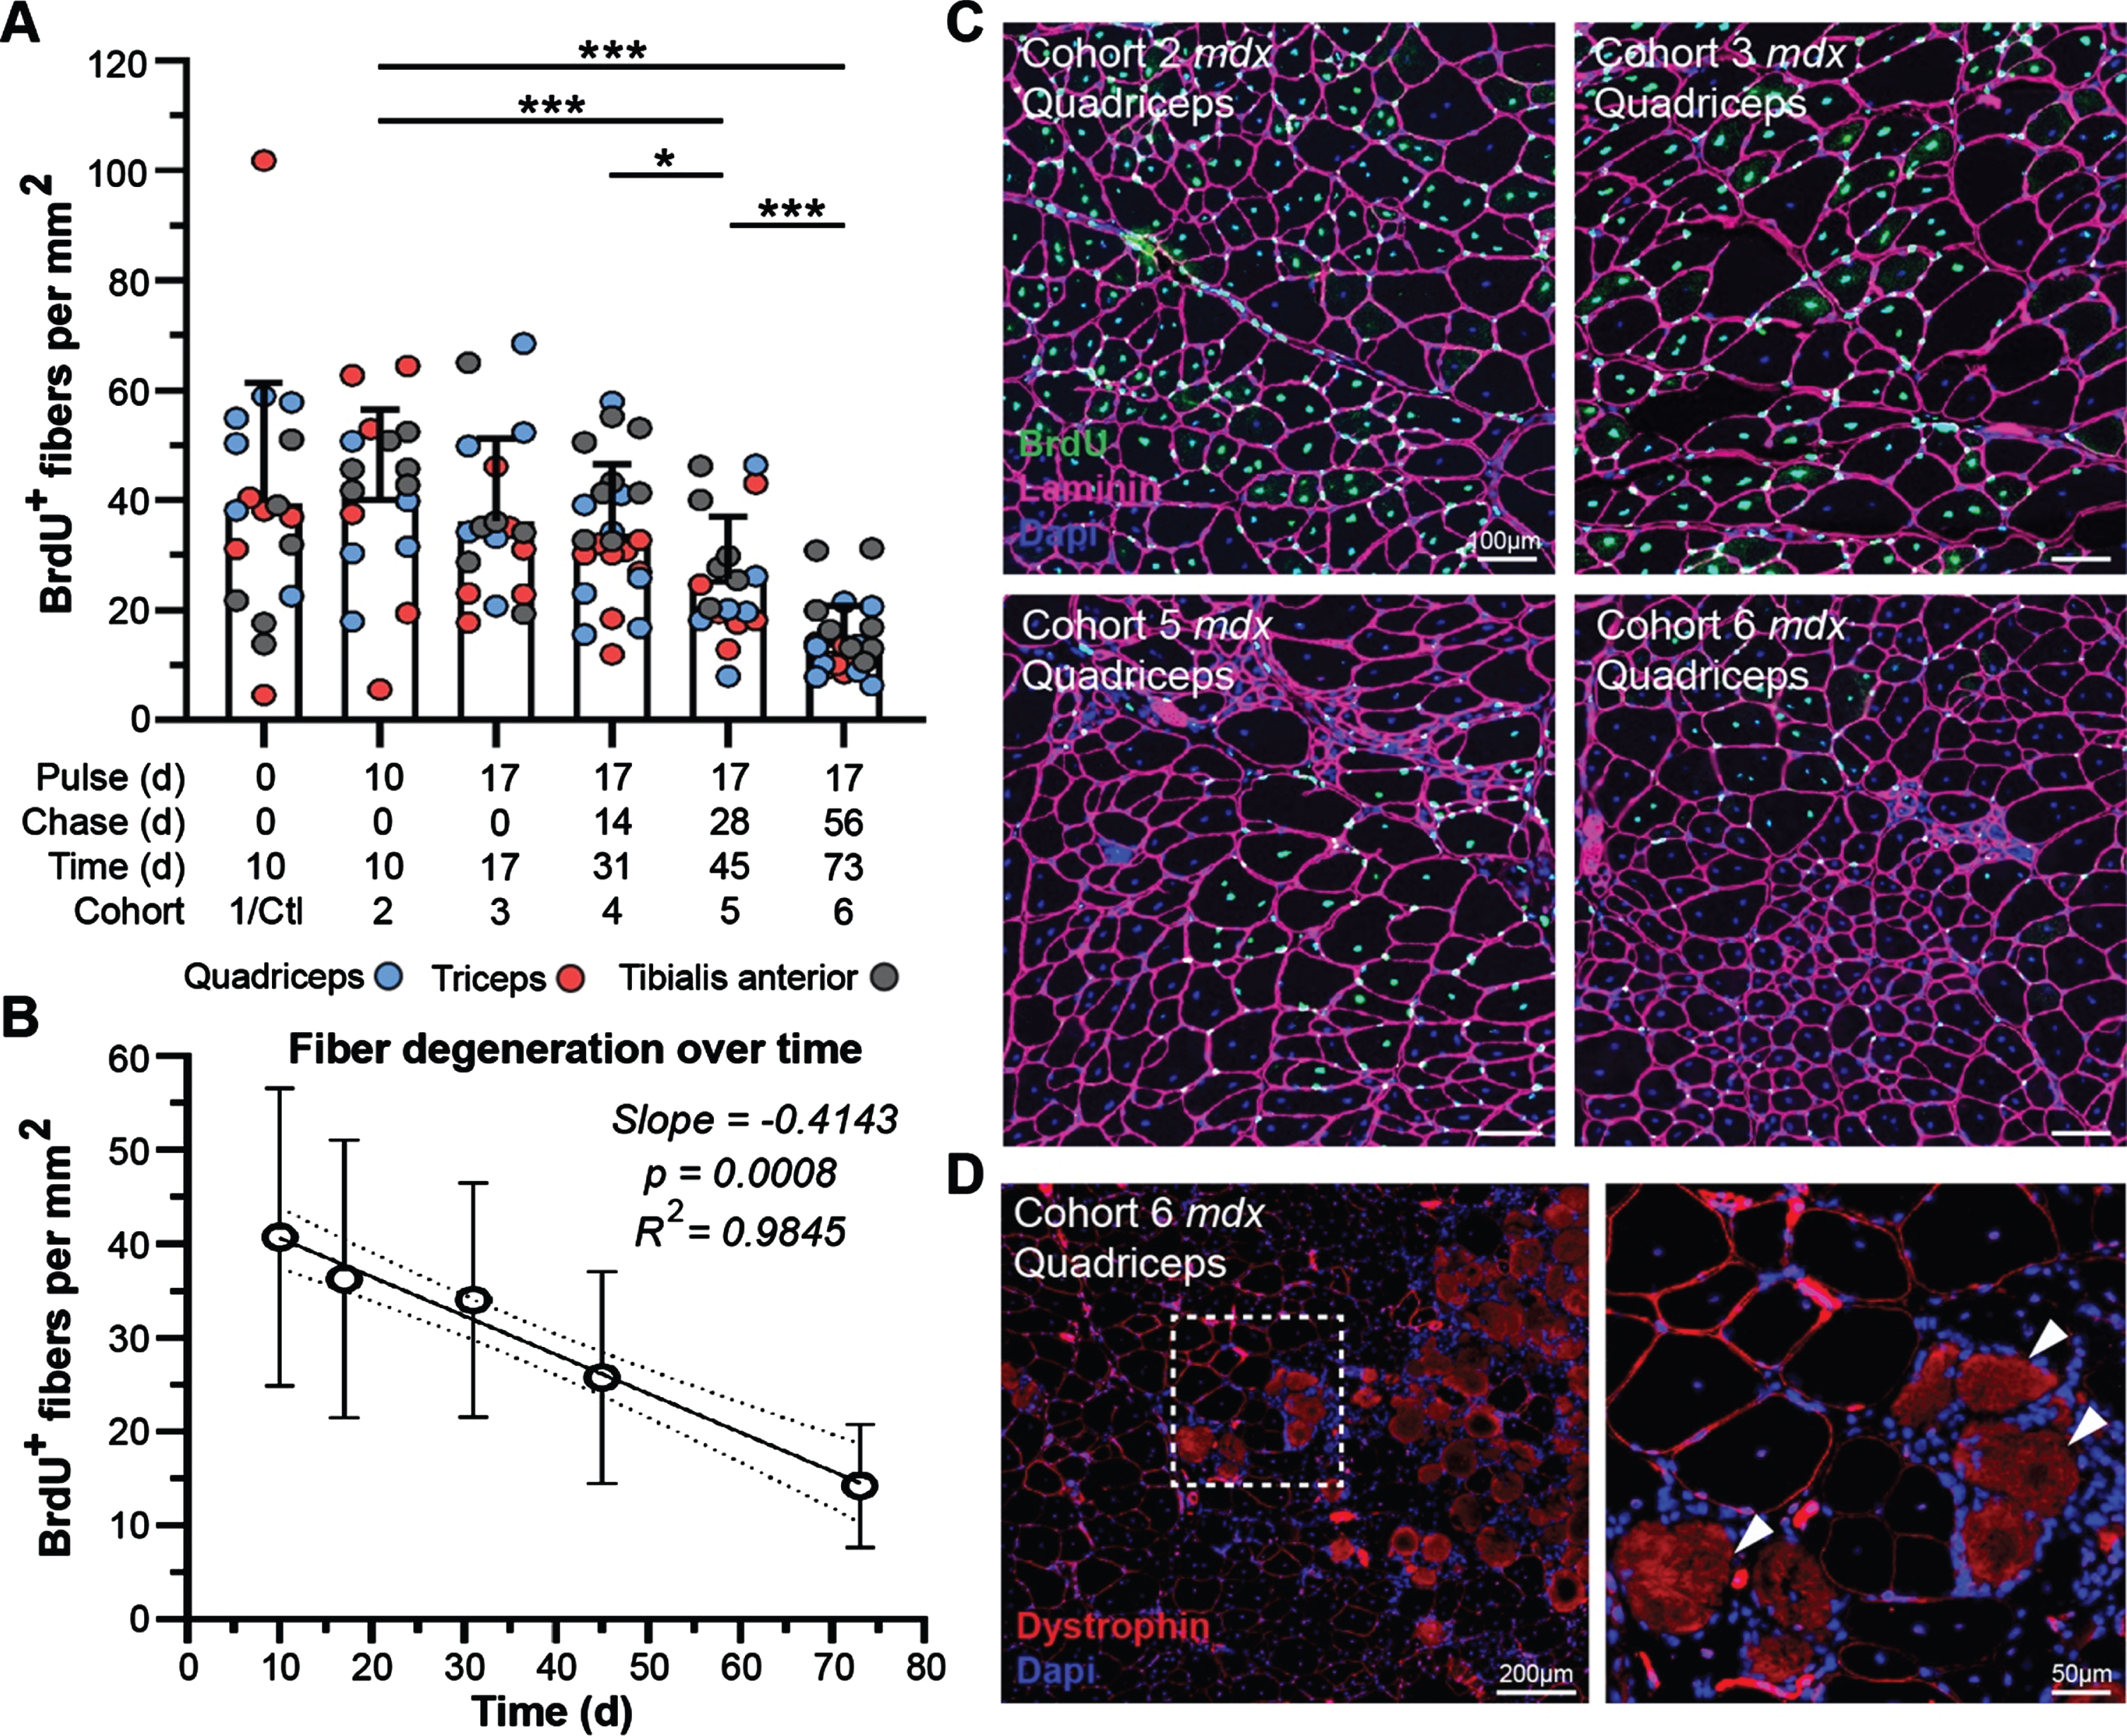
The rescue of dystrophin expression in dystrophic muscle above a therapeutic threshold is expected to support myofiber repair mechanisms and reduce the extent of degeneration, based on preclinical functional performance following exon skipping therapies [37–39]. While we cannot explicitly rule out the death of myofibers where dystrophin was properly restored, the presence of conspicuous clusters of low-expressing dystrophin-positive myofibers even after 73 d post-treatment does suggest its protective effect against myonecrosis (Fig. 6D). Microscopic examination of dystrophin-expressing fibers clusters, in relation to adjacent areas exhibiting extensive myonecrosis, revealed evidence that dystrophin restoration (high- and low-level) provided protection against myonecrosis (Fig. 6D). We found dystrophin-positive fibers lying adjacent to areas of widespread muscle damage, as indicated by intense background staining of the necrotic fibers (Fig. 6D, arrows) and local infiltration of mononuclear cells (macrophages) throughout the interstitium around necrotic fibers (Fig. 6D, DAPI-stained mononuclear cells). However, inflammation was not elevated around dystrophin-expressing fibers despite the relative expression level even out at 73 d post-treatment (Fig. 6D).
This result, while not confirmatory as there is no method to track the loss of dystrophin-expressing fibers over time, does suggest that restored dystrophin proteins after therapy are not greatly subject to degeneration, whereas DGC and muscle structural proteins are more likely to be subject to destabilization by this pathology.
Half-life of restored dystrophin protein, but not DGC proteins, is prolonged in PMO-treated mdx mice
In this study, the major objective was to accurately describe and model the behavior of dystrophin expression and turnover with time, in comparison to muscle-specific and associated dystrophin complex proteins, following an acute bout of exon skipping therapy in mdx mice. We demonstrate the use of our novel ‘pulse-labeling’ mass spectrometry approach to quantitatively measure the turnover of muscle proteins in dystrophic muscle in the context of disease and dystrophin-restoring therapies.
Based on mass spectrometry data, we next modeled the normalized decline in proportions of heavy-labeled to total protein to determine differences in the differential turnover and half-life we observed between strains (WT vs. PMO-treated mdx) for our proteins of interest. The exponential decay model we applied to the various protein data sets fitted the data satisfactorily (based on model performance and residuals). Here, if a datapoint was judged to be an outlier based on residual analysis, it was removed from further analysis; this resulted in the removal of one datapoint each from the dystrophin and laminin modeling. As the quadriceps represented our most robust dataset across all proteins investigated in this study, we focused our subsequent analyses exclusively on data obtained from this muscle. Raw data was assessed to evaluate consistency of signal within our samples. Our statistical analyses revealed high correlation between muscles of opposing limbs, which we suspect is due to their relatively stable rate of heavy-Lys usage within a given subject over the pulse phase. This led us to average data obtained from contralateral muscles for subsequent assessment of our model. Analysis of our dystrophin turnover (Fig. 7A) indicated a strong fit to our exponential decay regression model (R2 = 0.979) and a highly significant difference between the behavior of dystrophin over time in the mdx versus WT muscle (p = 8e-08). From our model estimates, we calculated the half-life of dystrophin in mdx as 44.41 d, dramatically lengthier (1.85-fold) than the 23.96 d half-life calculated for WT dystrophin (Fig. 7A).
Fig. 7
Modeling of protein turnover and half-life for dystrophin and DGC proteins. A–E) Model demonstrating the normalized decline in proportions of heavy-labeled to total protein to determine the differential turnover and half-life for dystrophin and muscle proteins of interest between WT and treated mdx. Analyses indicated a strong fit for our exponential decay model as indicated by R2 values (A–E). Statistically significant differential turnover rates and half-lives were found for mdx dystrophin (A), α-dystroglycan (B), laminin-α2 (C) and titin (D), but not filamin C (E), as compared to WT dynamics, and is indicated by the p-values shown (A–E). Calculated half-life for each protein across both treated mdx and WT strains is shown in days (d). WT turnover dynamics are shown in red in each panel and labeled accordingly, while mdx turnover dynamics are displayed in blue (A–E).
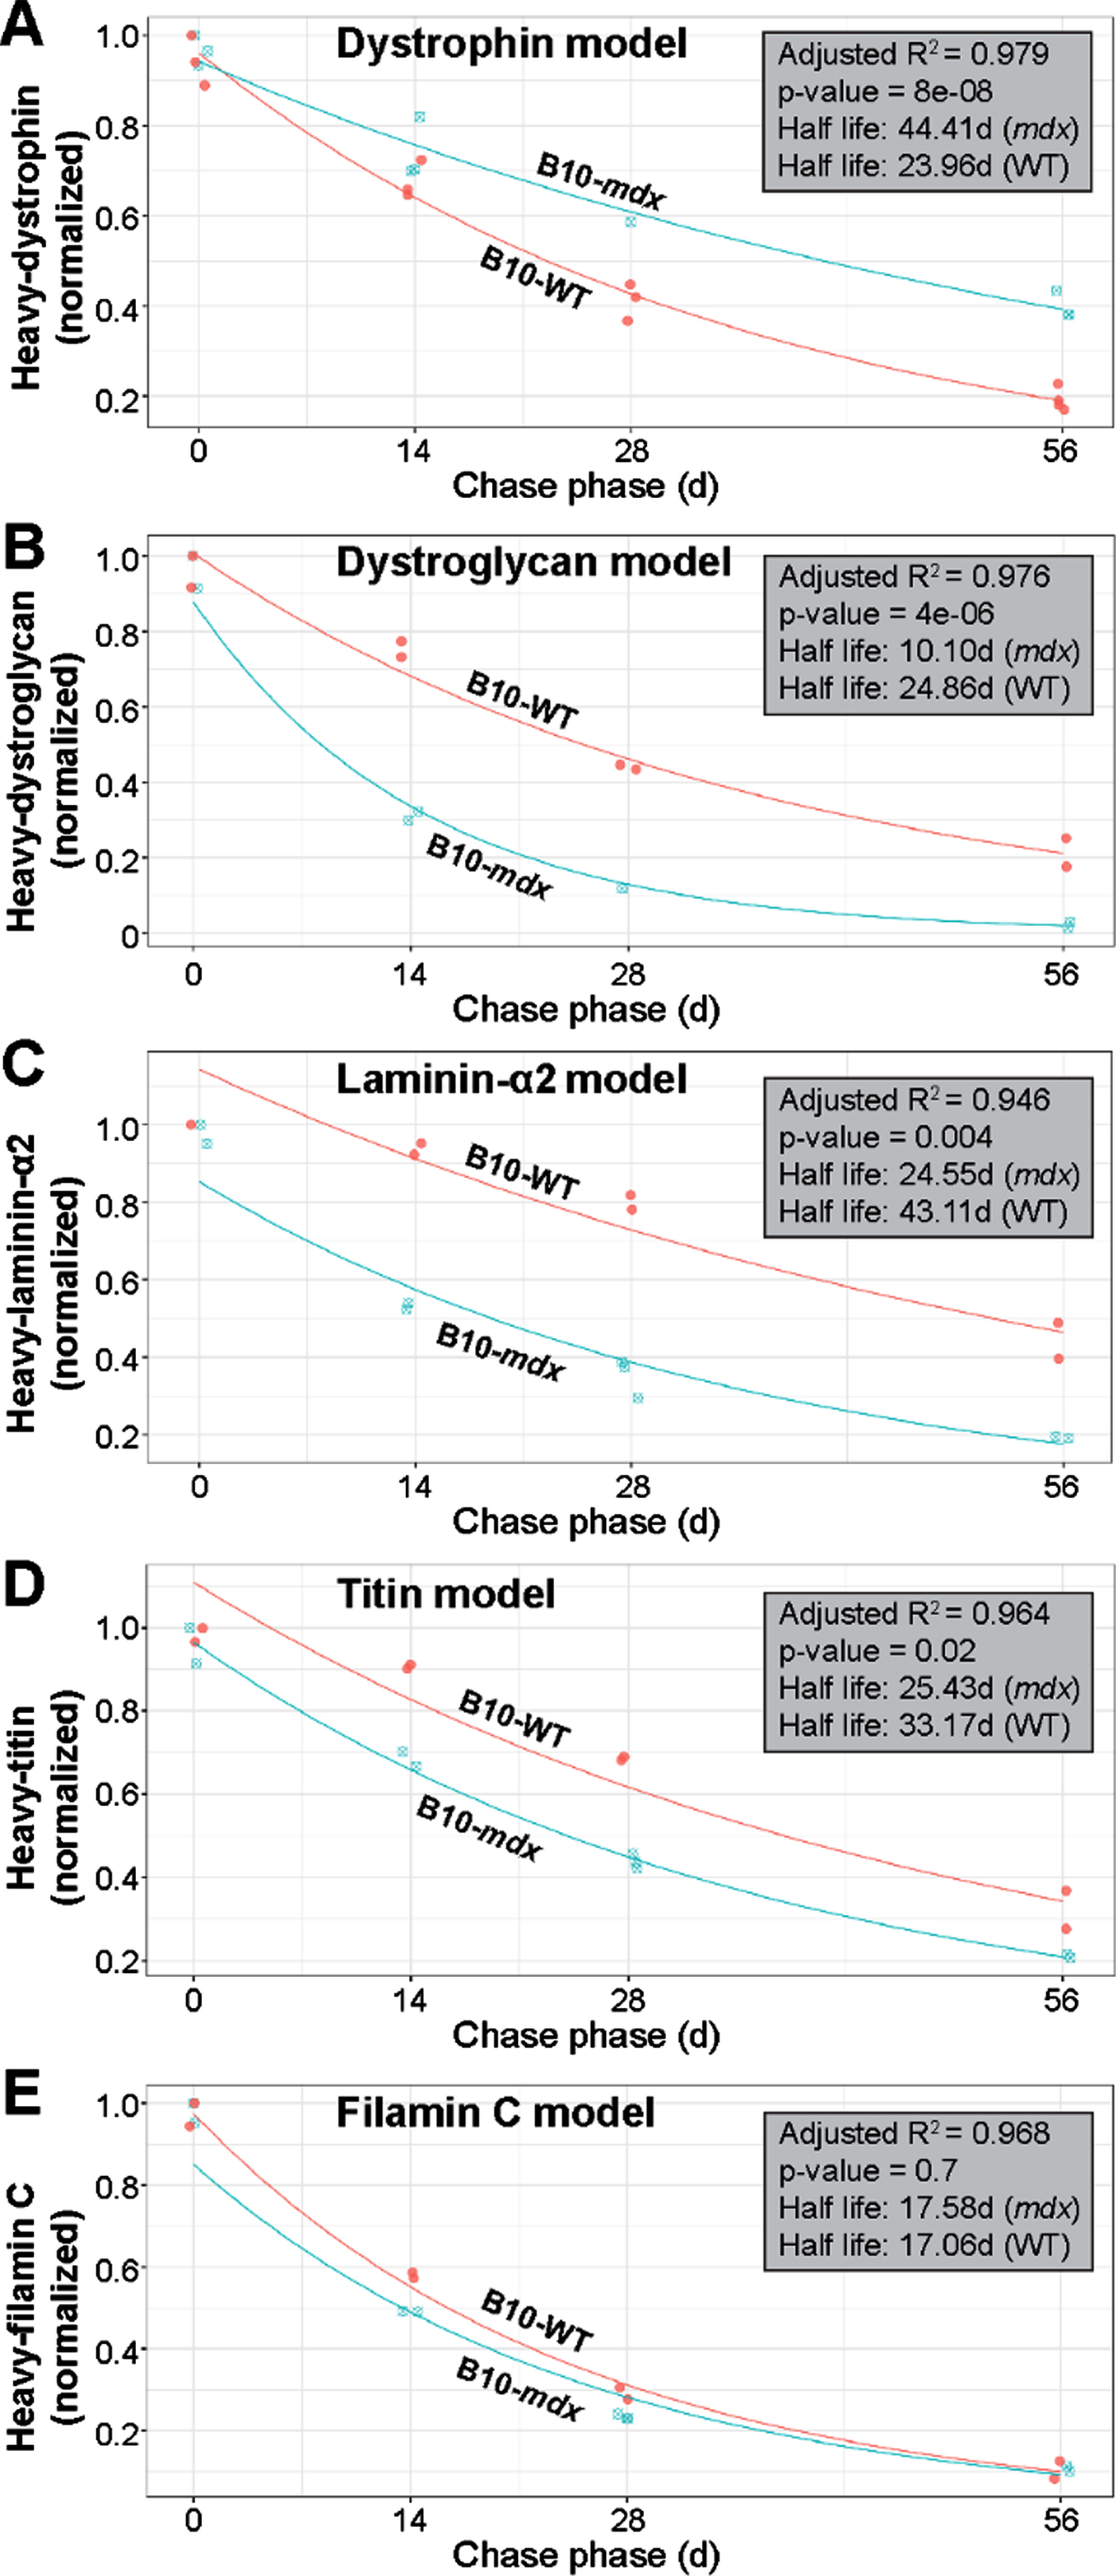
Based on the strong fit by our dystrophin dataset to this model, we next applied the exponential decay model to all other muscle proteins of interest. Again, our model performed well in terms of model fit and residuals (refer to R2 values shown in Fig. 7B–E) for the most part. Here, we found statistical differences in the turnover of mdx α-dystroglycan (p = 4e-06) and laminin-α2 (p = 0.004) in relation to WT (Fig. 7B, C). The calculated half-life of α-dystroglycan, 10.10 d in mdx, differed significantly from the 24.86 d in WT, while the half-life for laminin-α2 was calculated at 24.55 d vs. 43.11 d, respectively in these two strains. This equates to a 2.5-fold and 1.7-fold difference in the half-life of α-dystroglycan and laminin-α2, respectively in mdx muscle (Fig. 7B, C). Here, we can explain this observation by the fact that our strategy yielded only limited dystrophin expression within a minority of myofibers, and was thus insufficient to restore proper architecture of the DGC resulting in a less constrained rapid turnover rate. Similarly, differences were found between mdx and WT for titin (p = 0.02; half-life mdx = 25.43; half-life WT = 33.17) with a 1.3-fold increase in half-life for mdx (Fig. 7D). We suspect that sub-therapeutic restoration of dystrophin limited its protective effect against contraction-induced damage of the sarcomere, leading to its degradation, both when the fiber was able to repair the local damage, and when this injury resulted in fiber loss and replacement by regeneration. In contrast to the striking differences observed for our DGC proteins of interest, and to a lesser extent for titin, we found no difference between the modeled turnover rate for WT and mdx filamin C proteins (p = 0.7), with the half-lives calculated as 17.58 d and 17.06 d in mdx and WT, respectively (Fig. 7E). Here, we speculate that the turnover of Filamin C is buffered largely by its numerous cellular roles in the myofiber [35], or possibly by its roles in other cell types within the interstitium of muscle, that result in a similar turnover relative to WT despite myofiber degeneration in this model. It is also likely that the high intrinsic rate of turnover of this protein in normal muscle reduces the sensitivity of these measures to loss by fiber turnover.
DGC and muscle protein turnover is affected by pathology-induced muscle degeneration
To address the effect of muscle fiber turnover, we added an element of adjustment for % fibers retained against pathological loss. Our best available estimates (Fig. 6) for this make the assumption that degeneration of fibers in the mdx mouse was occurring at a near constant rate during our study, providing a scaling factor for adjustment of labeled protein measures to the proportion of fibers retained at each end point. For example, consider that we assume at time = 0, 100% of fibers are retained, while at day 1, a% of fibers have degenerated; in that case, data is available to observe only on the (100-a)% of retained fibers, permitting a scaling up of observed signal by dividing by (100-a)%. Similarly, at day t, (100-a)∧(t)% of fibers are retained providing an index of adjustment for revision of our models. We ran corrections for this at two levels of degeneration to account for variability: 0.25% and 1% daily degeneration rates (Supplemental Figure 4). Factoring in this pathological variable, shows that our earlier model for dystrophin turnover may be more conservative than its true dynamics in diseased muscle tissue. Adjustment by our calculated rates of myofiber degeneration, at both 0.25% and 1% daily loss, suggests that sarcolemmal dystrophin may stabilize further, with a half-life ranging from 52–125 d (Supplemental Figure 4A, A’).
The above analysis, strongly implicates degeneration of myofibers as a factor influencing turnover on DGC and muscle proteins in our model. Specifically, factoring in degeneration, raised our estimate of laminin-α2 stability (27–38 d half-life) to a level approaching its normal rate in WT (43 d half-life) (Supplemental Figure 4C, C’). Similarly, application of this revised modeling to titin moved its calculated turnover rate closer to that calculated for WT titin when assuming a loss of ∼1% muscle daily (Supplemental Figure 4D, D’). In contrast, α-dystroglycan showed only a modest increase in half-life when degeneration was factored in. This may be explained by its compromised interactions with the DGC in the absence of substantial dystrophin restoration across the muscle (Supplemental Figure 4B, B’). Lastly, inclusion of muscle cell turnover when modeling filamin C, led to a modest, yet significant extension in half-life beyond WT (Supplemental Figure 4E, E’). Importantly, this demonstrates our ability to factor in major variables related to disease pathology that may influence protein turnover in dystrophic muscle to more accurately assess this dynamics process.
DISCUSSION
Despite the growing promise offered by current exon skipping and gene therapy platforms for the treatment of DMD, little attention has been given to understanding how the resulting internal truncations within the protein, influence its stability, turnover and functionality in vivo. This report demonstrates our ability to investigate the stability of therapeutically restored dystrophin protein in dystrophic muscle tissue using a targeted in vivo stable isotope labeling mass spectrometry approach. We found that restored dystrophin protein in PMO-treated mdx showed significantly slower turnover than that in WT muscle, suggesting increased stability leading to prolonged sequestration at the sarcolemma relative to the normal turnover of full-length dystrophin. In contrast, DGC proteins demonstrated a rapid rate of turnover compared to wild-type muscle that could be attributable to degenerative pathology.
Previous in vitro studies have demonstrated variable thermodynamic instability of dystrophin proteins corresponding to specific mutations or deletions within the gene, or resulting from exon skipping- or gene therapy-mediated restoration, relative to the full-length protein [40–42]. While these in vitro efforts have played a significant role in establishing the consequence of different gene modifications on the biophysical properties and stability of resulting proteins, these studies are limited in their ability to assess the dynamic behavior of genetically modified proteins within the complex micro-environment of normal or diseased muscle tissue.
The majority of standard techniques used to evaluate dystrophin expression in response to therapy in vivo, yield only semi-quantitative information that have limited our accuracy in detection of low-level protein expression [43]. Consequently, this has confounded clinical evaluations and the process of regulatory consideration, leading to questions regarding long-term clinical efficacy. Recently, our team developed a precise and reproducible, quantitative mass spectrometry approach using parallel reaction monitoring for accurate evaluation of dystrophin restoring therapies in preclinical models and DMD patients [17, 44]. In a recent study, we demonstrated the use of targeted mass spectrometry to determine the absolute amount of dystrophin using SILAM and parallel reaction monitoring together with a recombinant dystrophin spike-in approach, where we reported a limit of detection as low as 30 pg dystrophin per mg muscle protein in DMD and Becker muscular dystrophy (BMD) patient biopsies [17]. In this present study, we further implemented this method to quantitatively measure the expression and turnover (half-life) of a restored, internally-truncated dystrophin protein, in comparison to the dynamics of a full-length dystrophin. Further, we added breadth to our approach by simultaneously monitoring the turnover of various DGC and muscle proteins, thus revealing how exon skipping or gene therapies may also modulate the dynamics of this functionally interconnected group of proteins in dystrophic muscle. Our work demonstrates the accuracy and reliability of our approach and highlights its far-reaching implications for optimization and development of exon skipping and gene therapy clinical programs for DMD and other diseases.
In this study, our approach was designed around a pulse-chase strategy using heavy-labeled lysine that permits for the accurate detection of heavy-labeled peptides simultaneously across an array of protein targets. Importantly, this provides a comprehensive view at how these protein dynamics change throughout the muscle tissue based upon drug efficacy (e.g. quantity of protein restored) and specific internal truncations of the protein itself (e.g. various DMD exon skipping and gene therapies). Despite many efforts to develop these therapies over the last decade, questions remain surrounding the suitability of different exon targets or gene-transfer constructs. So far, based on standard experimental practices, it has been difficult to ascertain the important variables. While our focus here aimed to optimize and validate this approach in the context of a single exon skipping therapy in the standard mdx mouse model, we envisage its most impactful future development for optimizing various truncated dystrophin gene therapy vectors based on the stability of their protein product in vivo. In addition, investigation of dystrophin turnover using different BMD models corresponding to different internal truncations, would provide additional insight into disease progression based on various truncations in this patient population that would also serve to further exon skipping and gene therapy development and optimization for DMD.
The fact that our approach allows for the simultaneous assessment of numerous muscle proteins in parallel to dystrophin, provides a comprehensive tool for monitoring overall muscle fiber health and muscle function at the individual protein level across the sarcomere, sarcolemma and the ECM. Here, we have demonstrated the sensitivity of our technique to detect even small differential changes in muscle protein stability that would otherwise be impossible to determine. As a proof-of-concept, we investigated the stability of dystrophin, and DGC-related proteins dystroglycan and laminin, where we observed significant differential changes in the turnover and half-life between PMO-treated mdx and WT. Our starting hypothesis was that low-level expression of truncated dystrophin, by virtue of its strong sequestration by an excess of dystrophin-binding proteins, would show greater stability than normal levels of full-length dystrophin. This idea is strongly supported by the nearly 2-fold increase in the half-life of truncated dystrophin in PMO-treated mdx relative to full-length dystrophin in WT muscle. In contrast, DGC proteins displayed heightened turnover and reduced half-lives, in treated mdx mice relative to those in WT mice. This may be attributed in part to the effects of disease pathologies including myofiber degeneration and heightened ECM remodeling, but may also reflect, more directly their diminished participation in complexes with the small amount of dystrophin. Of particular interest is the variable effects on the half-lives of other muscle-specific proteins in response to the dystrophic pathology and its partial blunting afforded by the exon skipping agent. Thus, while titin displays a more rapid turnover in dystrophic muscle, the dynamics of filamin C, with more numerous cellular functions, was consistent between strains. Clearly, further investigation into global muscle protein dynamics and defects associated with disease progression and/or therapy is warranted and potentially afforded by the type of analysis we have employed.
Our suggestion that the prolonged half-life of truncated dystrophin in PMO-treated mdx is attributable to its increased sequestration at the sarcolemma upon low-level therapeutic restoration in dystrophic muscle provokes a number of more extensive applications of the methods we have developed. We intend next to evaluate how chronic or more robust therapies, either with long-term exon skipping or gene replacement therapy, affects the turnover and half-life of these proteins over time. This approach would resolve difficulties associated with interpretation of DGC dynamics based on our exon skipping strategy. Thus, we expect chronic exon skipping therapy or the longer-lasting effects of gene therapy to ultimately restore the dynamics of DGC and ECM proteins to the normal dynamics we found in WT muscle and associate with amelioration of disease processes. Here, we have demonstrated our abilities to accurately model in vivo protein dynamics in tissue over time, as well as our capacity to factor in disease-related variables, such as myofiber degeneration, into such a model. Thus, the use of a pulsed SILAM strategy provides an accurate and reproducible technique to interrogate global protein dynamics within tissue, with massive implications towards our understanding of exactly how different dystrophin-restoring therapies, and their resulting internal truncations of the dystrophin protein, impact protein turnover, disease progression, and muscle function at the myofiber and whole tissue level. A feature of particular value with our approach is use of spiked-in standards to generate reference points common to all proteins within a study and ideally between studies. Use of reference peptides labelled in vivo, has proved particularly useful in this respect and spiking with fully labelled reference peptides offers the near-ideal prospect of expressing all values in molar terms raising the utopian vision of fully stoichiometric analysis of the inter-relationships of the component proteins [17].
Our work provides validation of the technical and innovative approach we have developed to investigate protein stability in tissue, and importantly, represents the first detailed investigation of altered dystrophin protein dynamics within skeletal muscle in vivo in response to a dystrophin-restoring therapy. It establishes the use of our highly-sensitive procedure that will be broadly applicable to the analytical investigation of protein stability in tissues, and investigation of the modulatory effects of these therapies on the dynamics of these processes in the context of underlying disease. We have attempted to resolve, in principle, the challenges encountered in the present study of dissecting the impact of therapy from those related to disease processes (e.g. DGC dynamics). This experience has also informed us of the impediments to further optimization of our approach, notably of the need to apply it to fully standardizable therapeutic procedures, such as reliable, fully standardizable, drug delivery/efficacy as has been demonstrated for the current viral gene replacement therapies. As next generation exon skipping and gene therapies enter clinical development, our approach can be exploited to interrogate the in vivo stability, functionality and longevity of various alternative gene therapy products to further optimize their design and administration, helping to overcome the major barriers currently challenging their clinical use in DMD and other neuromuscular diseases.
AUTHOR CONTRIBUTIONS
This experimental design and rationale for this study was conceptualized by KN, YH, TAP, KJB and JSN. Animal studies and tissue processing were performed by JSN and AAF with contributions by DAGM and CBT. Mass spectrometry was conducted by RS, EC and YH. Cellular and histological analyses were performed by JSN and RH. Quantification of exon skipped mRNA and protein levels was performed by CBT and AF. Statistical modeling and analyses were performed by UJD and JSN. Manuscript was written by JSN, TAP, YH and KN; final manuscript was reviewed and approved by all authors prior to submission.
ACKNOWLEDGMENTS
Funding for this project was obtained by KN, YH, and TAP. This work was primarily supported by the National Institutes of Health (NINDS, R56NS097229 | KN, TAP) and the Office of the Assistant Secretary of Defense for Health Affairs, through the Department of Defense Duchenne Muscular Dystrophy Research Program (DMDRP, W81XWH-16-1-0572 | YH). Additionally, this work was partially supported by the Parent Project Muscular Dystrophy (KN; TAP), Muscular Dystrophy Association (MDA295203 | TAP; MDA480160 | JSN), Foundation to Eradicate Duchenne (JSN; KN), Dutch Duchenne Parent Project (JSN), Department of Defense Duchenne Muscular Dystrophy Research Program (DMDRP, W81XWH-17-1-047 | AAF), and Children’s National Hospital (CNH)/Children’s Research Institute (CRI) institutional funds (JSN, AAF). Microscopy was performed at the CRI Cell and Tissue Microscopy Core, which is supported CRI and the Intellectual and Developmental Disabilities Research Center Award (U54HD090257) through the National Institutes of Health and the National Institute of Child Health and Human Development (NICHD). Lastly, the authors would like to acknowledge the Binghamton University Decker Foundation for its continuous support and generous contributions that covered the costs of the state-of-the-art mass spectrometry instrument used to generate the reported data. Opinions, interpretations, conclusions and recommendations are those of the authors and are not necessarily endorsed by our funding agencies.
CONFLICTS OF INTEREST
KN is the co-founder and president of Agada Biosciences and the co-founder and vice-president of research for ReveraGen Biopharma. TAP serves on the scientific advisory committee of Sarepta Therapeutics. KJB is an employee of Solid Biosciences Inc. All other authors have no competing financial interests or conflicts of interest to declare.
SUPPLEMENTARY MATERIAL
[1] The supplementary material is available in the electronic version of this article: https://dx.doi.org/10.3233/JND-210696.
REFERENCES
[1] | Hoffman EP , Brown RH Jr, Kunkel LM . Dystrophin: The protein product of the Duchenne muscular dystrophy locus. Cell. (1987) ;51: (6):919–28. |
[2] | Hoffman EP , Monaco AP , Feener CC , Kunkel LM . Conservation of the Duchenne muscular dystrophy gene in mice and humans. Science. (1987) ;238: (4825):347–50. |
[3] | Guiraud S , Aartsma-Rus A , Vieira NM , Davies KE , van Ommen GJ , Kunkel LM . The Pathogenesis and Therapy of Muscular Dystrophies. Annual review of genomics and human genetics. (2015) ;16: :281–308. 10.1146/annurevgenom-090314-025003 |
[4] | McDonald CM , Henricson EK , Abresch RT , Duong T , Joyce NC , Hu F , et al. Long-term effects of glucocorticoids on function, quality of life, and survival in patients with Duchenne muscular dystrophy: A prospective cohort study. Lancet. (2018) ;391: (10119):451–61. 10.1016/S0140-6736(17)32160-8 |
[5] | Sheikh O , Yokota T . Developing DMD therapeutics: A review of the effectiveness of small molecules, stop-codon readthrough, dystrophin gene replacement, and exon-skipping therapies. Expert Opin Investig Drugs. (2021) ;30: (2):167–76. 10.1080/13543784.2021.1868434 |
[6] | Baudy AR , Sali A , Jordan S , Kesari A , Johnston HK , Hoffman EP , et al. Non-invasive optical imaging of muscle pathology in mdx mice using cathepsin caged near-infrared imaging. Mol Imaging Biol. (2011) ;13: (3):462–70. |
[7] | Aoki Y , Yokota T , Wood MJ . Development of multiexon skipping antisense oligonucleotide therapy for Duchenne muscular dystrophy. BioMed Research International. (2013) ;2013: :402369. 10.1155/2013/402369 |
[8] | Hoffman EP , Connor EM . Orphan drug development in muscular dystrophy: Update on two large clinical trials of dystrophin rescue therapies. Discovery Medicine. (2013) ;16: (89):233–9. |
[9] | Touznik A , Lee JJ , Yokota T . New developments in exon skipping and splice modulation therapies for neuromuscular diseases. Expert Opinion on Biological Therapy. (2014) ;14: (6):809–19.. 10.1517/14712598.2014.896335 |
[10] | Charleston JS , Schnell FJ , Dworzak J , Donoghue C , Lewis S , Chen L , et al. Eteplirsen treatment for Duchenne muscular dystrophy: Exon skipping and dystrophin production. Neurology. (2018) ;90: (24):e2146–e54. 10.1212/WNL.0000000000005680 |
[11] | Clemens PR , Rao VK , Connolly AM , Harper AD , Mah JK , Smith EC , et al. Safety, Tolerability, and Efficacy of Viltolarsen in Boys With Duchenne Muscular Dystrophy Amenable to Exon 53 Skipping: A Phase 2 Randomized Clinical Trial. JAMA Neurol. (2020) ;77: (8):982–91. 10.1001/jamaneurol.2020.1264 |
[12] | Frank DE , Schnell FJ , Akana C , El-Husayni SH , Desjardins CA , Morgan J , et al. Increased dystrophin production with golodirsen in patients with Duchenne muscular dystrophy. Neurology. (2020) ;94: (21):e2270–e82. 10.1212/WNL.0000000000009233 |
[13] | Rodrigues M , Yokota T . An Overview of Recent Advances and Clinical Applications of Exon Skipping and Splice Modulation for Muscular Dystrophy and Various Genetic Diseases. Methods Mol Biol. (2018) ;1828: :31–55. 10.1007/978-1-4939-8651-4—2 |
[14] | FDA Approves Targeted Treatment for Rare Duchenne Muscular Dystrophy Mutation [press release]. https://www.fda.gov/news-events/press-announcements/fda-approves-targeted-treatment-rare-duchenne-muscular-dystrophy-mutation-0, February 25, 2021. |
[15] | Hathout Y , Marathi RL , Rayavarapu S , Zhang A , Brown KJ , Seol H , et al. Discovery of serum protein biomarkers in the mdx mouse model and cross-species comparison to Duchenne muscular dystrophy patients. Human Molecular Genetics. (2014) ;23: (24):6458–69. 10.1093/hmg/ddu366. |
[16] | Hathout Y , Seol H , Han MH , Zhang A , Brown KJ , Hoffman EP . Clinical utility of serum biomarkers in Duchenne muscular dystrophy. Clin Proteomics. (2016) ;13: :9. 10.1186/s12014-016-9109-x. |
[17] | Canessa EH , Goswami MV , Alayi TD , Hoffman EP , Hathout Y . Absolute quantification of dystrophin protein in human muscle biopsies using parallel reaction monitoring (PRM). J Mass Spectrom. (2020) ;55: (2):e4437. 10.1002/jms.4437. |
[18] | Rayavarapu S , Coley W , Cakir E , Jahnke V , Takeda S , Aoki Y , et al. Identification of disease specific pathways using in vivo SILAC proteomics in dystrophin deficient mdx mouse. Mol Cell Proteomics. (2013) ;12: (5):1061–73. 10.1074/mcp.M112.023127. |
[19] | Zhang A , Uaesoontrachoon K , Shaughnessy C , Das JR , Rayavarapu S , Brown KJ , et al. The use of urinary and kidney SILAM proteomics to monitor kidney response to high dose morpholino oligonucleotides in the mdx mouse. Toxicology reports. (2015) ;2: :838–49. 10.1016/j.toxrep.2015.05.008. |
[20] | Gallien S , Bourmaud A , Kim SY , Domon B . Technical considerations for large-scale parallel reaction monitoring analysis. J Proteomics. (2014) ;100: :147–59. 10.1016/j.jprot.2013.10.029. |
[21] | Bulfield G , Siller WG , Wight PA , Moore KJ . X chromosome-linked muscular dystrophy (mdx) in the mouse. Proceedings of the National Academy of Sciences of the United States of America. (1984) ;81: (4):1189–92. |
[22] | Fletcher S , Honeyman K , Fall AM , Harding PL , Johnsen RD , Wilton SD . Dystrophin expression in the mdx mouse after localised and systemic administration of a morpholino antisense oligonucleotide. The Journal of Gene Medicine. (2006) ;8: (2):207–16. 10.1002/jgm.838. |
[23] | Gebski BL , Mann CJ , Fletcher S , Wilton SD . Morpholino antisense oligonucleotide induced dystrophin exon 23 skipping in mdx mouse muscle. Human Molecular Genetics. (2003) ;12: (15):1801–11. |
[24] | Mann CJ , Honeyman K , Cheng AJ , Ly T , Lloyd F , Fletcher S , et al. Antisense-induced exon skipping and synthesis of dystrophin in the mdx mouse. Proceedings of the National Academy of Sciences of the United States of America. (2001) ;98: (1):42–7. 10.1073/pnas.011408598. |
[25] | Morcos PA , Li Y , Jiang S . Vivo-Morpholinos: A non-peptide transporter delivers Morpholinos into a wide array of mouse tissues. BioTechniques. (2144) ;45: (6):613–4, 6, 8passim.10.2144/000113005. |
[26] | Novak JS , Hogarth MW , Boehler JF , Nearing M , Vila MC , Heredia R , et al. Myoblasts and macrophages are required for therapeutic morpholino antisense oligonucleotide delivery to dystrophic muscle. Nature Communications. (2017) ;8: (1):941. 10.1038/s41467-017-00924-7 |
[27] | Vila MC , Klimek MB , Novak JS , Rayavarapu S , Uaesoontrachoon K , Boehler JF , et al. Elusive sources of variability of dystrophin rescue by exon skipping. Skeletal Muscle. (2015) ;5: :44. 10.1186/s13395-015-0070-6 |
[28] | Aoki Y , Nagata T , Yokota T , Nakamura A , Wood MJ , Partridge T , et al. Highly efficient in vivo delivery of PMO into regenerating myotubes and rescue in laminin-alpha2 chain-null congenital muscular dystrophy mice. Human Molecular Genetics. (2013) ;22: (24):4914–28. 10.1093/hmg/ddt341. |
[29] | Aoki Y , Yokota T , Nagata T , Nakamura A , Tanihata J , Saito T , et al. Bodywide skipping of exons 45-55 in dystrophic mdx52 mice by systemic antisense delivery. Proceedings of the National Academy of Sciences of the United States of America. (1376) ;109: (34):3–8. 10.1073/pnas.1204638109. |
[30] | Jensen ON , Wilm M , Shevchenko A , Mann M . Sample preparation methods for mass spectrometric peptide mapping directly from 2-DE gels. Methods Mol Biol. (1999) ;112: :513–30. 10.1385/1-59259-584-7:513. |
[31] | Amantana A , Moulton HM , Cate ML , Reddy MT , Whitehead T , Hassinger JN , et al. Pharmacokinetics, biodistribution, stability and toxicity of a cell-penetrating peptide-morpholino oligomer conjugate. Bioconjugate chemistry. (2007) ;18: (4):1325–31. 10.1021/bc070060v. |
[32] | Burki U , Keane J , Blain A , O’Donovan L , Gait MJ , Laval SH , et al. Development and Application of an Ultrasensitive Hybridization-Based ELISA Method for the Determination of Peptide-Conjugated Phosphorodiamidate Morpholino Oligonucleotides. Nucleic Acid Ther. (2015) ;25: (5):275–84. 10.1089/nat.2014.0528. |
[33] | Hathout Y , Liang C , Ogundele M , Xu G , Tawalbeh SM , Dang UJ , et al. Disease-specific and glucocorticoid-responsive serum biomarkers for Duchenne Muscular Dystrophy. Scientific Reports. (2019) ;9: (1):12167. 10.1038/s41598-019-48548-9. |
[34] | Rouillon J , Zocevic A , Leger T , Garcia C , Camadro JM , Udd B , et al. Proteomics profiling of urine reveals specific titin fragments as biomarkers of Duchenne muscular dystrophy. Neuromuscular disorders: NMD. (2014) ;24: (7):563–73. 10.1016/j.nmd.2014.03.012. |
[35] | Mao Z , Nakamura F . Structure and Function of Filamin C in the Muscle Z-Disc. Int J Mol Sci. (2020) ;21: (8). 10.3390/ijms21082696. |
[36] | Mazala DA , Novak JS , Hogarth MW , Nearing M , Adusumalli P , Tully CB , et al. TGF-beta-driven muscle degeneration and failed regeneration underlie disease onset in a DMD mouse model. JCI Insight. (2020) ;5: (6). 10.1172/jci.insight.135703. |
[37] | Betts CA , Saleh AF , Carr CA , Hammond SM , Coenen-Stass AM , Godfrey C , et al. Prevention of exercised induced cardiomyopathy following Pip-PMO treatment in dystrophic mdx mice. Scientific Reports. (2015) ;5: :8986.. 10.1038/srep08986. |
[38] | van Putten M , Hulsker M , Nadarajah VD , van Heiningen SH , van Huizen E , van Iterson M , et al. The effects of low levels of dystrophin on mouse muscle function and pathology. PloS one. (2012) ;7: (2):e31937. 10.1371/journal.pone.0031937. |
[39] | Vila MC , Rayavarapu S , Hogarth MW , Van der Meulen JH , Horn A , Defour A , et al. Mitochondria mediate cell membrane repair and contribute to Duchenne muscular dystrophy. Cell Death Differ. (2017) ;24: (2):330–42. 10.1038/cdd.2016.127. |
[40] | Henderson DM , Belanto JJ , Li B , Heun-Johnson H , Ervasti JM . Internal deletion compromises the stability of dystrophin. Human Molecular Genetics. (2011) ;20: (15):2955–63. 10.1093/hmg/ddr199. |
[41] | Henderson DM , Lee A , Ervasti JM . Disease-causing missense mutations in actin binding domain 1 of dystrophin induce thermodynamic instability and protein aggregation. Proceedings of the National Academy of Sciences of the United States of America. (2010) ;107: (21):9632–7. 10.1073/pnas.1001517107. |
[42] | McCourt JL , Rhett KK , Jaeger MA , Belanto JJ , Talsness DM , Ervasti JM . In vitro stability of therapeutically relevant, internally truncated dystrophins. Skeletal Muscle. (2015) ;5: :13. 10.1186/s13395-015-0040-z. |
[43] | Aartsma-Rus A , Morgan J , Lonkar P , Neubert H , Owens J , Binks M , et al. Report of a TREAT-NMD/World Duchenne Organisation Meeting on Dystrophin Quantification Methodology. J Neuromuscul Dis. (2019) ;6: (1):147–59. 10.3233/JND-180357. |
[44] | Brown KJ , Marathi R , Fiorillo AA , Ciccimaro EF , Sharma S , Rowlands DS , et al. Accurate Quantitation of Dystrophin Protein in Human Skeletal Muscle Using Mass Spectrometry. J Bioanal Biomed. (2012) ;Suppl 7: . 10.4172/1948-593X.S7-001. |


