
Characterization of Adult Patients With SMA Treated in US Hospital Settings: A Natural History Study in the Premier Healthcare Database
Abstract
Background:
Spinal muscular atrophy (SMA) is a rare genetic disease characterized by progressive muscular weakness and atrophy resulting from motor neuron degeneration. Limited information is available on disease progression among older SMA patients, particularly adults.
Objective:
This study sought to characterize the natural history of SMA among adult patients in US hospital settings through the assessment of symptoms, complications, costs, and healthcare resource utilization (HRU) over 3 years before the availability of disease-modifying therapies.
Methods:
The study population included adult (≥18 years) patients with inpatient and/or hospital-based outpatient discharge records and ≥2 primary or secondary SMA ICD-9 codes ≥30 days apart in the Premier Healthcare Database during the main study period (2007–2014). Index date was the date of the first SMA ICD-9 code. The frequency of SMA-related symptoms and complications was assessed 1 year preindex through 2 years postindex to characterize disease progression. Costs and HRU were also assessed across the study period.
Results:
A total of 446 adult patients from 337 US hospitals met inclusion criteria for these analyses. All evaluated SMA-related symptoms and complications increased steadily over time, from 1 year preindex to 2 years postindex both overall and in each age group. Adult patients with SMA had increasing total costs and HRU over the 3-year study period: total costs were $1,759 preindex and $12,308 by 2 years postindex.
Conclusions:
Findings are consistent with increasing disease burden over time and support the progressive nature of SMA for adult patients with hospital interactions.
INTRODUCTION
Spinal muscular atrophy (SMA) is a rare neuromuscular disease caused primarily by homozygous deletion of the survival motor neuron (SMN) 1 gene that leads to SMN protein deficiency and subsequent motor neuron degeneration [1, 2]. Individuals with SMA have at least one SMN2 gene, which has a similar structure to SMN1, but the SMN2 gene produces only low levels of full-length protein that cannot fully compensate for loss of SMN1 [3, 4]. Copy number variation in the SMN2 gene is inversely correlated with the clinical severity of the SMA phenotype [5]. The global incidence of SMA is estimated to be one in 12,000 births [6]. In a US study using indirect estimation methods, the type-specific population prevalence estimates were 1610, 3944, and 3875 for SMA Type I, II, and III, respectively, totaling an estimated prevalence of 9429 based on projections from 2016 [7].
SMA is generally characterized by progressive muscle weakness and respiratory insufficiency resulting from the degeneration of motor neurons in the spinal cord [2]. There are four primary phenotypic subgroups of SMA (Types I–IV), which are defined primarily by age of onset and maximum motor milestones achieved [8, 9]. Historically, without disease-modifying therapy, individuals with SMA Type I have symptom onset by 6 months of age, do not sit independently, and do not usually live past age 2 [2, 8, 9]. Those with SMA Type II experience symptom onset between 7–18 months of age and can sit but typically never progress to walking independently [2, 8, 9]. Those with SMA Type III typically have symptom onset at > 18 months of age and can stand and walk independently, though they many lose the ability to walk over time [8, 9]. SMA Type IV is a rare, milder, adult-onset form of SMA with normal life expectancy; and affected individuals are generally high-functioning and walk independently [2, 8, 9]. The phenotype varies within SMA types as well as between types, with individuals exhibiting a range of functional abilities [9].
Individuals with SMA may experience a wide array of symptoms and complications resulting from their disease, and these may differ by SMA type [10]. Few studies have focused specifically on adults with SMA (who are largely individuals with SMA Type II or III). A recent study conducted in the International SMA Patient Registry indicated that limitations on mobility and walking had the highest impact on the daily lives of adult patients with SMA [10]. However, this survey of 359 adults was designed to assess the impact of symptoms and did not include costs or healthcare resource utilization (HRU) associated with reported symptoms and complications, nor did it include assessment by multiple age groups. Limited information is available regarding the burden of these symptoms or complications and the resulting associated costs or HRU, especially in the adult SMA population.
Thus, we conducted a retrospective observational longitudinal database study of adult patients with SMA from January 1, 2007, to September 30, 2016, using the Premier Healthcare Database (PHD). We assessed symptoms, complications, costs, and HRU of SMA inpatient and outpatient hospital-based encounters, both overall and by adult age group (18–29, 30–54, and ≥55 years), during the 1 year preindex, hospital index, and 2 year postindex periods.
METHODS
Study design and database
The PHD is a large US hospital discharge database covering approximately one in every five discharges in the nation. The PHD contains data from standard hospital discharge files, including a patient’s demographic and disease state, and information on billed services, including medications, laboratory tests performed, diagnostics, and therapeutic services in de-identified patient daily service records. In addition, information on hospital characteristics, including geographic location, bed size, and teaching status, is available. Institutional review board oversight was not required for this analysis because data in the PHD are de-identified and compliant with the Health Insurance Portability and Accountability Act [11].
We used a retrospective longitudinal study design to capture index hospital encounters occurring between January 1, 2007, and September 30, 2014, with 2 years of follow-up through September 30, 2016. The study time frame was chosen to include encounters 1 year preindex through 2 years postindex for the study population with SMA, to provide complete quarters of data from the PHD, and to ensure that the study period did not overlap with the approval and use of disease-modifying SMA therapies (e.g., nusinersen).
SMA population
The study population included adult patients aged ≥18 years at index with at least two primary or secondary SMA ICD-9 codes (335.0, 335.10, 335.11, 335.19) separated by at least 30 days, with a healthcare encounter at a hospital reporting data for ≥90 days before and 30 days after index visit. The patient index date was defined as the first visit with an SMA ICD-9 diagnosis code in the PHD and patients were divided into subgroups based on age at index. Adult age groups were defined as 18–29, 30–54, and ≥55 years, based on age at the index hospital encounter, and correspond with early, middle, and later adulthood, respectively. Exclusion criteria were any of the following: (1) no complete agreement on birth year and gender during the study period; (2) the hospital did not submit inpatient or outpatient data continuously for 90 days predischarge or 30 days postdischarge; (3) no attached billing records to the index hospital encounter; and (4) evidence of SMA diagnosis prior to January 1, 2007, using a look-back period to January 1, 2000.
Symptoms and complications
Symptoms and complications were chosen by US clinical expert opinion and defined using International Classification of Diseases, Ninth Revision (ICD-9), International Classification of Diseases, Tenth Revision (ICD-10), current procedural terminology (CPT), and Healthcare Common Procedure Coding System (HCPCS) codes for all time periods: 1 year preindex, index hospital encounter, and through 2 years postindex.
Categories of symptoms and complications included the following: (1) pneumonia; (2) other respiratory illness, symptom, or insufficiency (e.g., acute and chronic bronchitis, acute and chronic sinusitis, acute tonsillitis, acute upper respiratory infection, respiratory infection, respiratory symptom, insufficiency, cold/cough/fever/influenza); (3) ventilation support (e.g., intermittent positive pressure breathing device, respiratory treatments (cough assist/suction machine), bilevel positive airway pressure (BiPAP)/continuous positive airway pressure (CPAP), tracheostomy); (4) gastrointestinal-related issues (e.g., esophagitis/reflux, dysphagia, feeding problems, gastrostomy (G-tube) feeding/upper gastrointestinal procedures); (5) musculoskeletal problems (e.g., muscle weakness, lack of coordination, osteoporosis/fracture/other bony abnormality, scoliosis, contracture/dislocation/subluxation); (6) support/therapy (e.g., occupational therapy, wheelchairs); and (7) surgery (e.g., scoliosis surgery, other). A complete list of individual codes/definitions can be found in Supplementary Table 1.
Costs and HRU
Total costs for all encounter time periods comprised inpatient, outpatient emergency department (ED), and outpatient non-ED, as well as combined encounters. Department costs were identified at the index encounter only and included expenses such as intensive care unit (ICU), room and board, pharmacy, and central supply, but this is not an exhaustive list of departmental costs included in the total cost. During the pre- and postindex periods, number and type (inpatient, outpatient ED, outpatient non-ED) of hospital-based healthcare encounters were assessed. Length of stay and stay type (e.g., inpatient, ICU) were examined for all index encounters. In-hospital mortality during the index encounter and through 2 years postindex was also examined.
Statistical analysis
Descriptive summary statistics were calculated for all variables. Means, standard deviations, medians, and ranges were used for continuous variables, while categorical variables were expressed as frequencies and percentages. Costs and visit types were calculated cumulatively within the pre- and postindex time periods. Analysis of variance or chi-square tests were used to compare patient and hospital characteristics across age groups. Total and departmental costs were winsorized at the 95th percentile to account for outliers, and Kruskal-Wallis tests were used to compare costs and length of stay across age groups. 95% confidence intervals (CIs) were constructed around pre- and postindex visit types, as well as total costs at each time period. For categorical variables, missing data were re-coded as unknown. For continuous variables such as total cost or departmental costs, missing records were excluded from the cost analysis. Patients with negative or $0 cost data were excluded from the cost results but remained part of the other analyses. p-values < 0.05 were considered statistically significant. SAS 9.4 (SAS Institute, Inc., Cary, NC, USA) was used for all analyses.
RESULTS
A total of 446 patients with SMA met the study inclusion criteria: 129 in the age 18–29 years group, 163 in the age 30–54 years group, and 154 in the age ≥55 years group (Fig. 1). At the index hospital encounter, patients differed significantly across age groups for primary payer type (p < 0.001), admit type (p = 0.008), and discharge status/disposition (p = 0.004) (Table 1). As expected, the age ≥55 years group had a higher percentage of Medicare insurance, while the majority of the age 18–29 years and 30–54 years groups had commercial insurance or Medicaid. Home discharges were the most frequent across all the age groups; however, the age ≥55 years group had higher percentages of rehab discharges (14%) as compared with the age 18–29 years (2%) and 30–54 years (7%) groups. In-hospital mortality through 2 years postindex also differed across age groups (p = 0.01), with the highest mortality in the age ≥55 years group (Table 1).
Fig. 1
Study attrition. ICD-9 = International Classification of Diseases, Ninth Revision; SMA = spinal muscular atrophy.
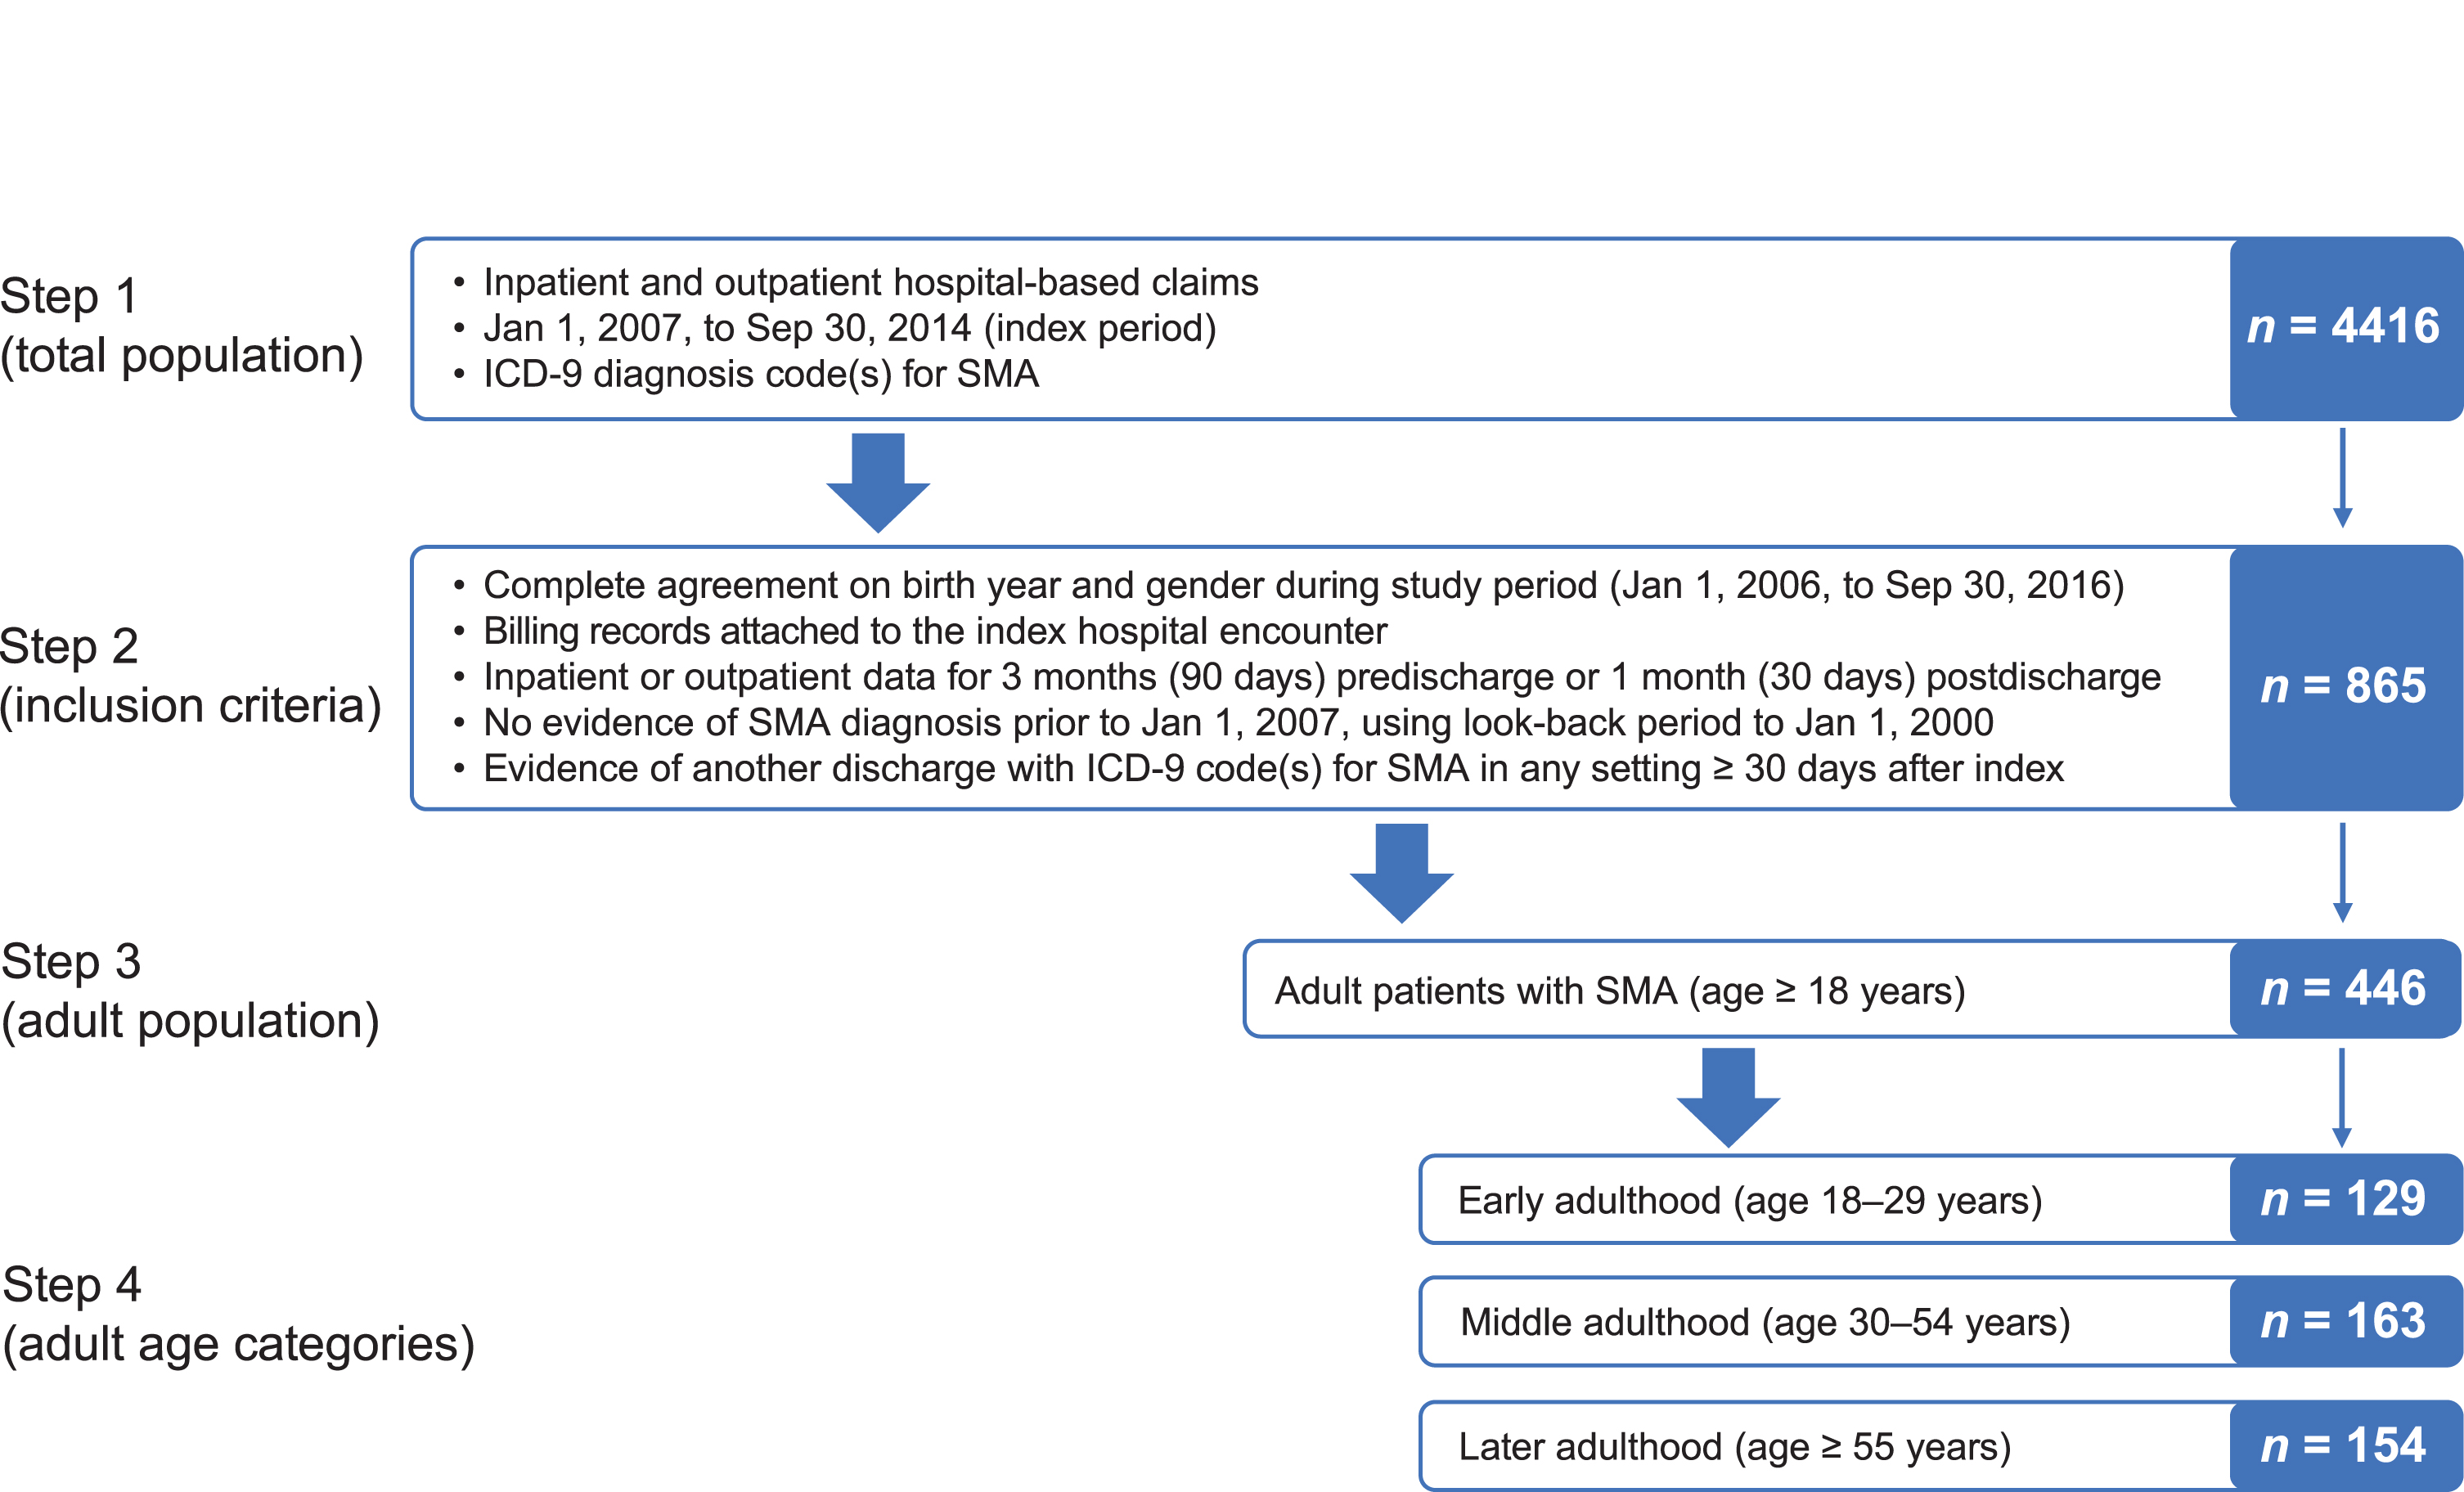
Table 1
Patient and hospital characteristics for adult patients with spinal muscular atrophy by age group
| Characteristic | Total population | Age 18–29 years | Age 30–54 years | Age ≥ 55 years | p-value* |
| (N = 446) | (n = 129) | (n = 163) | (n = 154) | ||
| Inpatient index, n (%) | 157 (35) | 47 (36) | 52 (32) | 58 (38) | 0.53 |
| Mean ± SD age, years | 45±19 | 23±4 | 42±8 | 66±8 | |
| Female, n (%) | 231 (52) | 73 (57) | 80 (49) | 78 (51) | 0.42 |
| Race, n (%) | 0.88 | ||||
| White | 340 (76) | 97 (75) | 126 (77) | 117 (76) | |
| Black | 34 (8) | 13 (10) | 10 (6) | 11 (7) | |
| Hispanic | 7 (2) | 1 (0.8) | 3 (2) | 3 (2) | |
| Other | 65 (15) | 18 (14) | 24 (15) | 23 (15) | |
| Primary payer, n (%) | <0.001 | ||||
| Medicare | 182 (41) | 16 (12) | 62 (38) | 104 (68) | |
| Medicaid | 100 (22) | 56 (43) | 32 (20) | 12 (8) | |
| Commercial | 146 (33) | 51 (40) | 59 (36) | 36 (23) | |
| Other | 18 (4) | 6 (5) | 10 (6) | 2 (1) | |
| Admit type, n (%)† | 0.008 | ||||
| Emergency | 156 (35) | 44 (34) | 56 (34) | 56 (36) | |
| Urgent | 49 (11) | 8 (6) | 26 (16) | 15 (10) | |
| Elective | 163 (37) | 42 (33) | 60 (37) | 61 (40) | |
| Other/unknown | 78 (18) | 35 (27) | 21 (13) | 22 (14) | |
| Discharge status/disposition, n (%) | 0.004 | ||||
| Home, self-care | 338 (76) | 105 (81) | 133 (82) | 100 (65) | |
| Home health | 38 (9) | 10 (8) | 11 (7) | 17 (11) | |
| Acute care facility | 5 (1) | 2 (2) | 0 | 3 (2) | |
| SNF, ICF, rehab, or LTC | 36 (8) | 3 (2) | 11 (7) | 22 (14) | |
| Other | 29 (7) | 9 (7) | 8 (5) | 12 (8) | |
| In-hospital mortality, n (%)‡ | 14 (3) | 1 (0.8) | 3 (2) | 10 (6) | 0.01 |
| Hospital bed size ≥500, n (%) | 158 (35) | 48 (37) | 66 (40) | 44 (29) | 0.08 |
| Teaching hospital, n (%) | 210 (47) | 57 (44) | 84 (52) | 69 (45) | 0.36 |
| Hospital location, n (%) | 0.41 | ||||
| Rural | 54 (12) | 14 (11) | 17 (10) | 23 (15) | |
| Urban | 392 (88) | 115 (89) | 146 (90) | 131 (85) |
ICF = intensive care facility; LTC = long-term care; SD = standard deviation; SNF = skilled nursing facility. Note: Some summations may not equal 100% due to rounding. *p-values by analysis of variance or linear regression. †Definitions for types of admissions: Emergency: The patient required immediate medical intervention as a result of severe, life-threatening, or potentially disabling conditions. Urgent: The patient required immediate attention for the care and treatment of a physical or mental disorder. Elective: The patient’s condition permitted adequate time to schedule the availability of a suitable accommodation. ‡Through 2 years postindex.
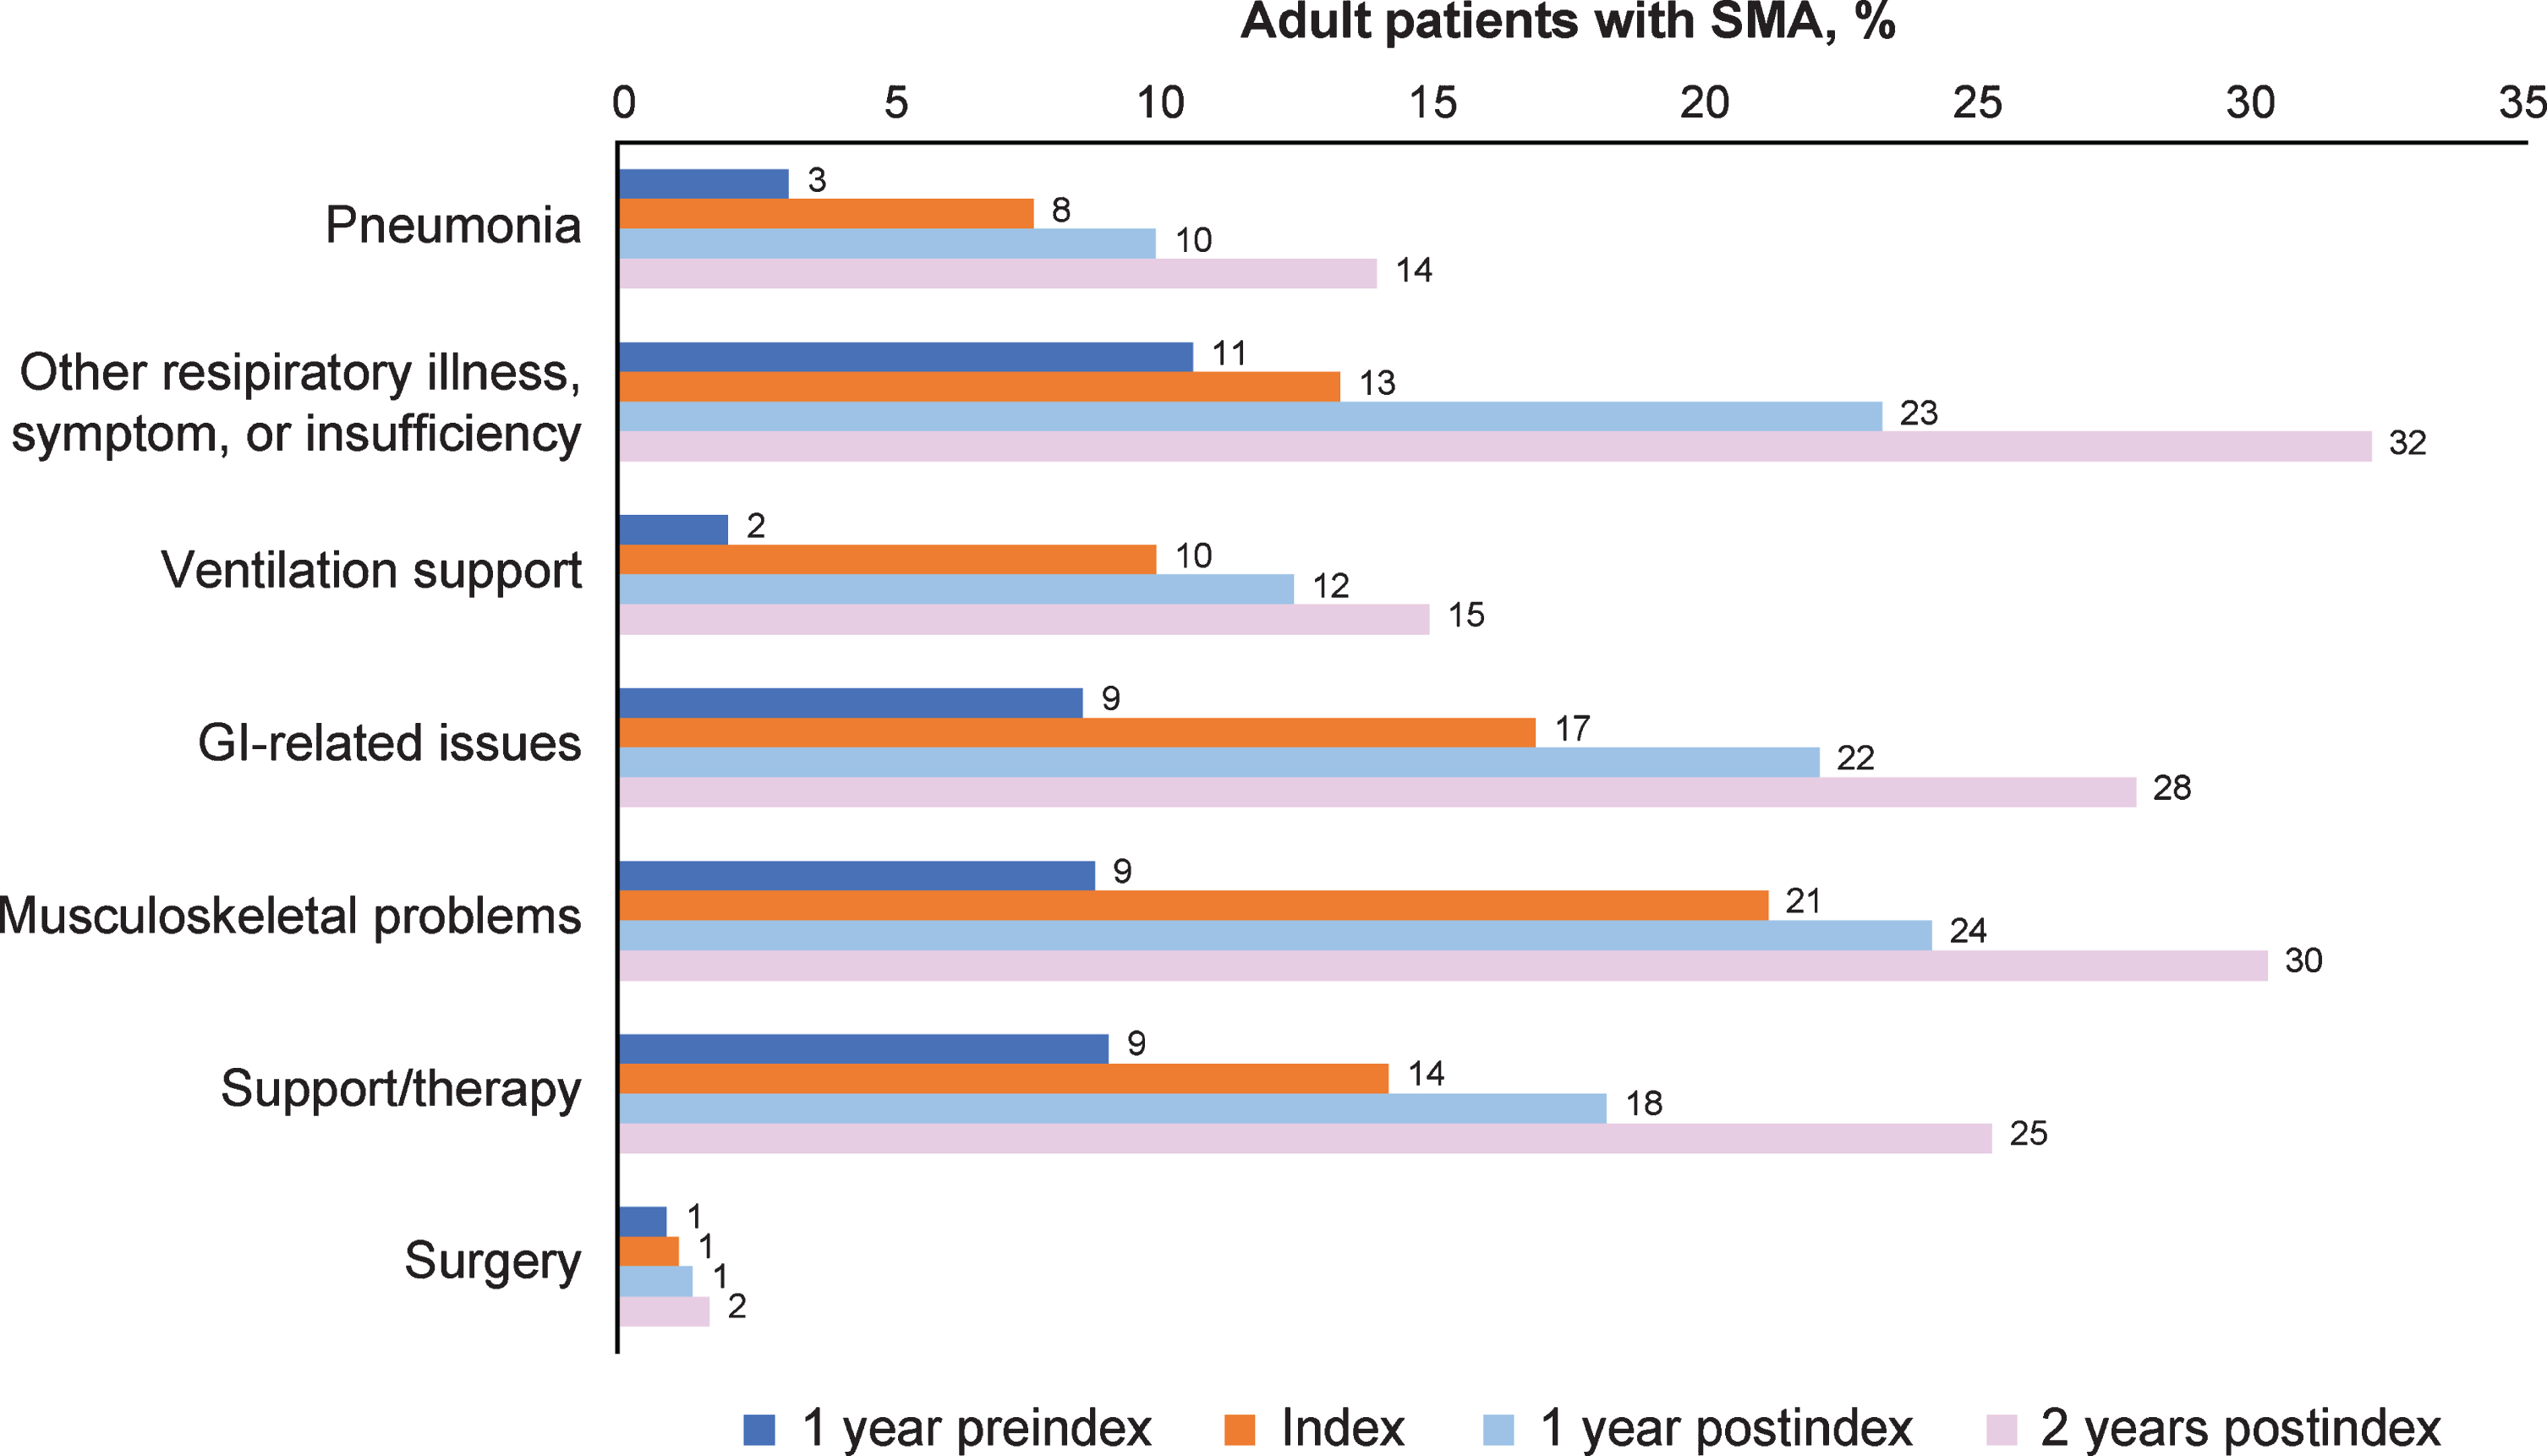
Figure 2 and Supplementary Table 2 display the symptoms and complications of interest over time periods among all adult patients with SMA and by age groups. The proportion of symptoms and complications increased steadily over time, from 1 year preindex through 2 years postindex both overall and in each age group. In the overall group, the proportion of patients with pneumonia increased from 3% at 1 year preindex to 14% at 2 years postindex; other respiratory illness, symptom, or insufficiency increased from 11% to 32%. Ventilation support increased from 2% at 1 year preindex to 15% at 2 years postindex, and gastrointestinal-related issues from 9% to 28%. Musculoskeletal problems increased from 9% at 1 year preindex to 30% at 2 years postindex, surgery from 1% to 2%, and support/therapy from 9% to 25% (Fig. 2). In particular, scoliosis (part of the musculoskeletal category) increased from 4% preindex to almost 14% at 2 years postindex. This increasing trend held within each age group across time periods (Supplementary Table 2). Although gastrointestinal-related issues were the most frequent symptom and complication in the age ≥55 years group at 2 years postindex (39%), the most frequent categories in the age 18–29 years group during the same time period were other respiratory illness, symptom, or insufficiency (40%) and musculoskeletal problems (33%). Scoliosis was most frequent in the age 18–29 years category at 2 years postindex (24%), followed by the age 30–54 years (10%) and ≥55 years (9%) categories.
Fig. 2
Symptoms and complications across time periods for all adult patients with SMA (n = 446). GI = gastrointestinal; SMA = spinal muscular atrophy. Other respiratory illness, symptom, or insufficiency includes acute and chronic bronchitis, acute and chronic sinusitis, acute tonsillitis, acute upper respiratory infection, respiratory infection, respiratory symptom or insufficiency, and cold/cough/fever/influenza. Ventilation support is defined by codes listed in Supplemental Table 1 and includes intermittent positive pressure breathing device, respiratory treatments (cough assist/suction machine), bilevel positive airway pressure (BiPAP)/continuous positive airway pressure (CPAP), and tracheostomy. GI-related issues include esophagitis/reflux, dysphagia, feeding problems, gastrostomy (G-tube) feeding/upper GI procedures. Musculoskeletal problems include muscle weakness, lack of coordination, osteoporosis/fracture/other bony abnormality, scoliosis, contracture/dislocation/subluxation. Support/therapy includes occupational therapy and wheelchairs. Surgery includes scoliosis surgery and other surgeries.
At the index hospital encounter, ICU utilization differed significantly across age groups (p < 0.001), with the highest utilization in the age 18–29 years group (51%) followed by the age 30–54 years (21%) and ≥55 years (19%) groups (Table 2). Although not statistically significant, the age 18–29 years group had the highest ICU costs at index as well as longer inpatient length of stay and longer ICU length of stay as compared with the other age groups (Table 2). In general, higher costs were seen in the age 18–29 years group as compared with the other age groups at index.
Table 2
Index visit costs and healthcare resource utilization for adult patients with spinal muscular atrophy by age group
| Total population* | Age 18–29 years | Age 30–54 years | Age ≥55 years | p-value† | |
| (N = 446) | (n = 129) | (n = 163) | (n = 154) | ||
| Service category | |||||
| Inpatients, n | 157 | 47 | 52 | 58 | |
| Outpatients, n | 289 | 82 | 111 | 96 | |
| Resource utilization | |||||
| ED stay, n (%) | 168 (38) | 48 (37) | 59 (36) | 61 (40) | 0.81 |
| ICU stay, n (%) | 46 (29) | 24 (51) | 11 (21) | 11 (19) | < 0.001 |
| Inpatient length of stay, days | |||||
| n | 157 | 47 | 52 | 58 | |
| Mean±SD | 7.9±9.7 | 12.7±14.8 | 6.0±6.3 | 5.7±4.3 | < 0.001 |
| Median | 5 | 6 | 3 | 5 | |
| ICU length of stay, days | |||||
| n | 46 | 24 | 11 | 11 | |
| Mean±SD | 8.2±10.3 | 10.1±12.8 | 7.0±7.5 | 5.1±4.6 | 0.83 |
| Median | 4 | 4.5 | 4 | 3 | |
| Costs‡ | |||||
| Total costs | |||||
| n | 428 | 122 | 156 | 150 | |
| Mean±SD, $ | 4924.99±7992.57 | 6698.52±10,365.09 | 3553.06±6384.27 | 4909.33±6991.19 | 0.19 |
| Median, $ | 890.91 | 851.11 | 796.32 | 1203.49 | |
| ICU costs (inpatient only) | |||||
| n | 44 | 24 | 9 | 11 | |
| Mean±SD, $ | 24,942.71±26,440.44 | 32,794.05±31,635.47 | 18,045.19±17,683.24 | 13,445.92±10,872.39 | 0.3 |
| Median, $ | 12,425.23 | 22,077.93 | 11,042.00 | 11,028.99 | |
| Non-ICU costs (inpatient only) | |||||
| n | 151 | 45 | 48 | 58 | |
| Mean±SD, $ | 8985.26±8012.57 | 10,265.28±10,177.81 | 7636.34±5898.45 | 9108.49±7580.18 | 0.67 |
| Median, $ | 6431.81 | 6134.54 | 5794.51 | 7908.41 | |
| Room and board costs (inpatient only) | |||||
| n | 149 | 45 | 47 | 57 | |
| Mean±SD, $ | 8039.01±9926.54 | 13,964.18±13,914.75 | 5527.58±6966.90 | 5432.07±5290.97 | 0.002 |
| Median, $ | 4062.21 | 7807.86 | 2973.67 | 3979.98 | |
| Pharmacy costs | |||||
| n | 221 | 67 | 71 | 83 | |
| Mean±SD, $ | 858.76±1156.04 | 1271.59±1505.83 | 580.84±831.49 | 806.85±997.70 | 0.065 |
| Median, $ | 285.21 | 342.83 | 162.77 | 388.31 | |
| Central supply costs | |||||
| n | 147 | 44 | 43 | 60 | |
| Mean±SD, $ | 981.50±1652.23 | 1286.69±1880.23 | 824.59±1717.20 | 870.15±1406.98 | 0.025 |
| Median, $ | 251.6 | 493.35 | 122.14 | 350.09 |
ED = emergency department; ICU = intensive care unit; SD = standard deviation. All costs are in US dollars. *Cost n-values vary by type of cost and group as further clarified in the table. †P-values are derived from Kruskal-Wallis test and calculated for mean±SD. ‡Total costs included ICU, room and board, pharmacy, and central supply, but this is not an exhaustive list of departmental costs included in the total cost. Additionally, all costs were winsorized at the 95th percentile (across all age groups, not within each age group).
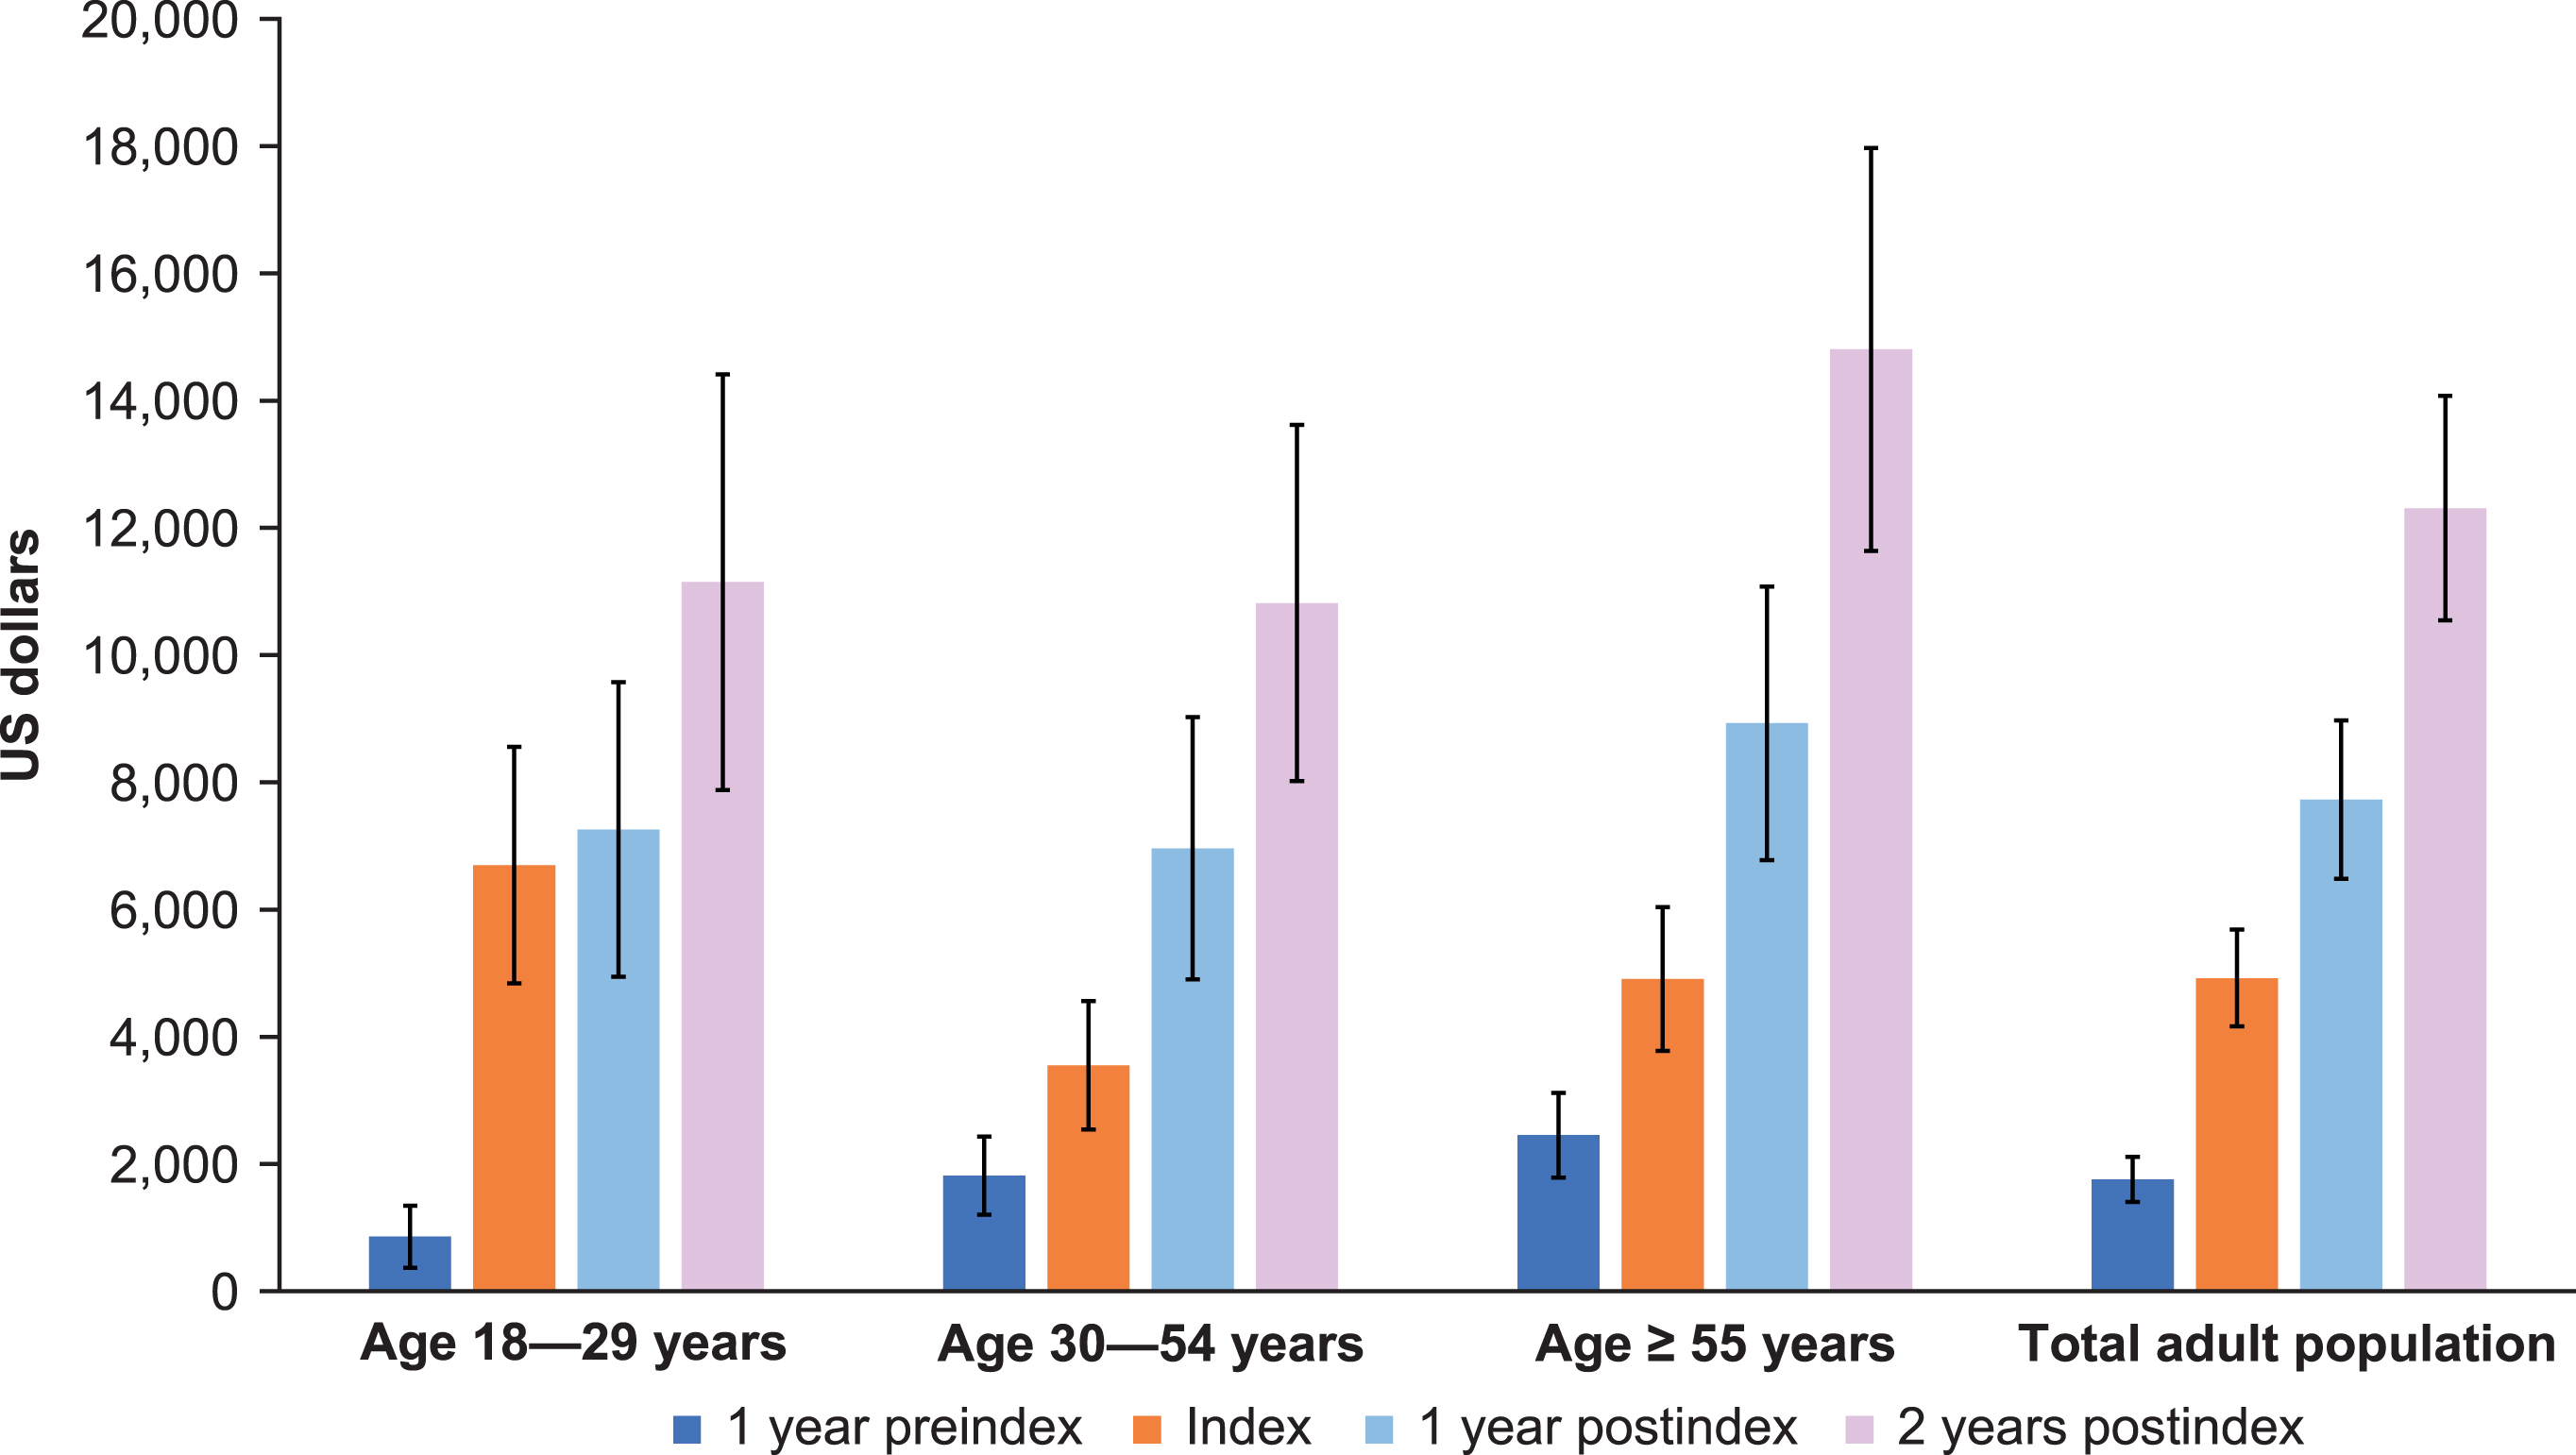
By 2 years postindex, outpatient non-ED visits were the most frequent, with an average of 4.7 visits. Outpatient ED and inpatient averaged approximately 1.0 and 0.9 visits, respectively, over 2 years postindex (Fig. 3). Approximately one-third of visits among adult patients with SMA occurred in inpatient and outpatient-ED settings at 2 years postindex. This pattern also held for the preindex period, with 1.5 outpatient non-ED visits on average, followed by 0.3 and 0.2 outpatient ED and inpatient visits on average, respectively (Fig. 3). At 1 year preindex as well as 1 and 2 years postindex, total costs were highest among the age ≥55 years group (Fig. 4). Costs increased steadily across all age groups and time periods (Fig. 4). Across the total adult population, total costs per patient preindex were $1,759, and by 2 years postindex were $12,308.
Fig. 3
Preindex and postindex visit types and number for all adult patients with spinal muscular atrophy (N = 446) across all age groups. ED = emergency department. Error bars are 95% confidence intervals.
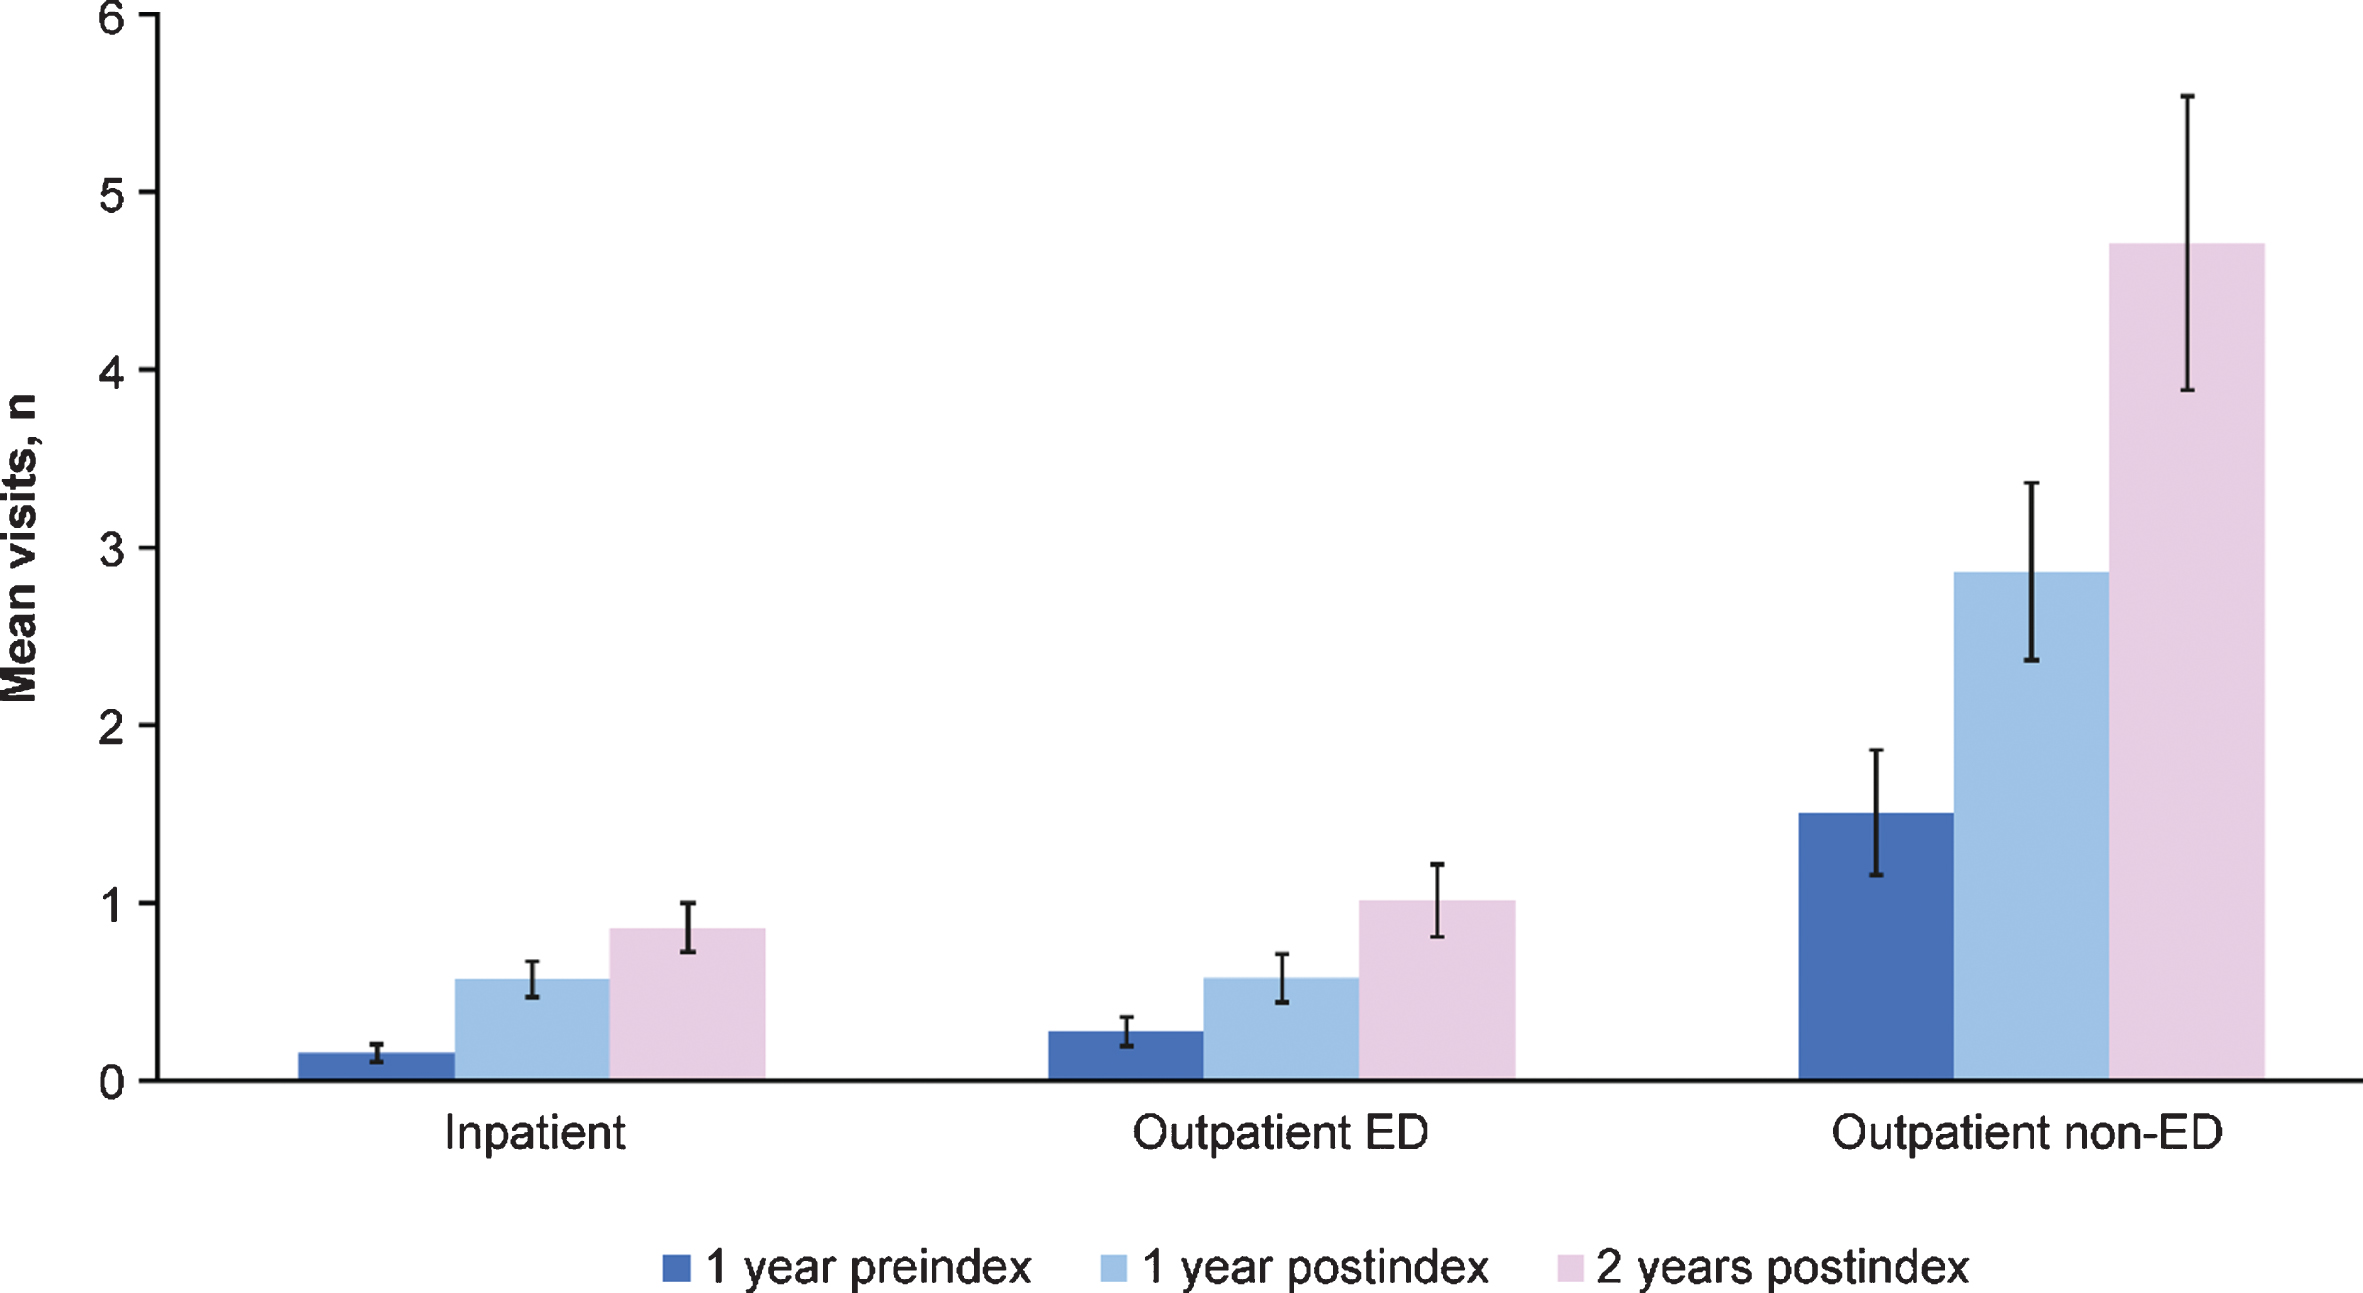
Fig. 4
Total overall costs for adult patients with spinal muscular atrophy by age group across time periods. Total costs included intensive care unit, room and board, pharmacy, and central supply, but this is not an exhaustive list of departmental costs included in the total cost. Additionally, all costs were winsorized at the 95th percentile (over all the age groups, not within age groups). Cost n varies by type of cost and group. Error bars are 95% confidence intervals.
DISCUSSION
In this retrospective longitudinal study using data from the PHD, adult patients with SMA had increasing total costs and HRU from 1 year preindex through 2 years postindex. The HRU and costs were highest at index for the age 18–29 years group, while pre- and postindex costs were generally highest among the age ≥55 years group. This could potentially be due to the fact that the age 18–29 years group had higher ICU use at index, but that at the other time points, the age ≥55 years group could have been more costly due to comorbidities.
Very limited information is available in the literature on cost and HRU among adult patients with SMA; the most recent studies [12–15] are predominantly in infants or children with early-onset diagnosis or focus on SMA Type I. A study by The Lewin Group using data from Optum showed that the per capita cost (based on claims paid in 2009) for patients with SMA onset after age 3 years was $20,085 (in 2010 US dollars) [15]. This result is consistent with the magnitude of costs in the current study, especially the total overall costs over 2 years postindex. The burden of symptoms and complications rose steadily through 2 years postindex among all adult patients with SMA, with all identified categories of interest showing increasing proportions of patients with these symptoms over time. This trend held within each age group across time periods as well. Although the age ≥55 years group had the highest frequency of gastrointestinal issues through 2 years postindex, the age 18–29 years group experienced the highest occurrence of musculoskeletal and respiratory illnesses of all three age groups through 2 years postindex. These results may be indicative of disease severity, although clinical type and age of symptom onset were not available in the PHD and could not be confirmed in the study. Notably, over one-third of adult patients with SMA identified based on first diagnosis code of SMA were age ≥55 years.
In general, compared with adults in the general population, adults with SMA have a higher burden of many of the symptoms or conditions studied here. Approximately 4% of US adults have dysphagia [16]; however, through 2 years postindex, 13.4% of SMA patients in this study had dysphagia (data not shown). In the general population, prevalence of scoliosis ranges widely, from 8.3% in a 1987 National Health and Nutrition Examination Survey (NHANES) of adults aged 25–74 years [17] and 8.9% in a study of 3185 adults aged ≥40 years [18] to 13.4% based on another smaller study of 500 adults aged 25–64 years reporting thoracic scoliosis [19]. In the current study, by 2 years postindex, 13.7% of patients with SMA had a hospital-based encounter for scoliosis; however, the prevalence of scoliosis in the age 18–29 years group was 24% by 2 years postindex (data not shown).
The annual incidence of hospitalizations for pneumonia in the US adult population ranges from 24.8 to 26.7 cases per 10,000 people [20], which would correspond to approximately 1.1 to 1.2 cases in adult patients with SMA in the current study. In contrast, during every 1-year time period in this study, the number of adult patients with SMA with hospital inpatient or outpatient encounters for pneumonia (3–14%) far exceeded this expected number.
Finally, over 2 years postindex hospitalization, the overall in-hospital mortality was 3.1% in the current study, which would equate to ∼1570 deaths per 100,000 people. When compared with the most recent National Vital Statistics Reports from 2017 [21], stating a crude mortality rate of 863.8 per 100,000 people and an age-adjusted rate of 731.9 per 100,000 for the general population, the projected mortality rate among patients with SMA is substantially higher. Note that in the current study, only the number of in-hospital deaths can be projected with the current data source, while national statistics contain deaths regardless of setting.
Strengths of this study include the relatively large sample size for adult patients with SMA and that patients were followed over time so that patterns could be ascertained. A notable study limitation of the PHD (or other administrative data such as claims) is the lack of access to detailed medical records; therefore, index date may not be indicative of the age of onset or age of diagnosis, and clinical type was not readily available. Thus, disease severity was unable to be assessed in this study; and the study population represented a survival cohort, which may have consisted of more mild patients overall. It is also possible since the index date (or first instance of SMA identified in claims) was identified in adulthood that there could have been a change in patients health, such as a rapid deterioration, that trigged medical attention. In addition, costs may have been underestimated in this study, based on excluding costs that occurred outside the hospital-based setting and using codes to define symptoms and complications that were not specific to SMA. Finally, data among patients identified with SMA from 2007 to 2014 were aggregated and cumulative costs were shown over time. Despite this representing the “pretreatment” era, there may have been medical advances and changes in standard of care over the study period from 2007 to 2014. It will be beneficial to continue studying the overall HRU and costs for adults with SMA following the availability of treatment.
Despite these limitations, the pattern of results from the current study suggests that adult patients with SMA who have hospital-based encounters may experience notable disease progression over a relatively short time period (3 years) as assessed through symptoms, complications, costs, and HRU. Now that disease-modifying therapy is available for adult patients with SMA, new evolving disease phenotypes should be further explored in treated patients, and the clinical and economic burden should be evaluated over time.
CONCLUSION
In this retrospective longitudinal study using data from PHD, the most frequent SMA-related symptoms and complications varied by age cohort among adult patients with SMA 2 years postindex; however, the overall burden of symptoms and complications rose steadily over 2 years postindex across the total adult cohort. Postindex costs were highest for the later adulthood SMA age group, but all adult patients with SMA had increasing total costs and HRU over time. These findings are consistent with the progressive natural history of SMA, especially among adult patients.
ACKNOWLEDGMENTS
Biogen (Cambridge, MA, USA) funded this research project, which was conducted by Premier Inc., an independent research consultancy. Biogen was involved in the study design and development of the manuscript. Biogen provided funding for editorial support in the development of this paper, which was provided by Alison Gagnon and Nathaniel Hoover of Excel Medical Affairs (Fairfield, CT, USA).
CONFLICTS OF INTEREST
Nicole B. Johnson, Thos Cochrane, and Angela D Paradis are employees of and hold stock/stock options in Biogen. Crystal Proud has served on advisory boards and as a consultant for AveXis, Biogen, and Sarepta; been a speaker for AveXis and Biogen; and a Principal Investigator of clinical studies from Astellas, AveXis, Biogen, Catabasis, CSL Behring, Pfizer, PTC, Sarepta, and Scholar Rock. Christina L. Wassel and Jill Dreyfus were employees of Premier at the time of the study, which received consulting fees from Biogen for the conduct of the study.
SUPPLEMENTARY MATERIAL
[1] The supplementary material is available in the electronic version of this article: https://dx.doi.org/10.3233/JND-200624.
REFERENCES
[1] | Lefebvre S , Burglen L , Reboullet S , Clermont O , Burlet P , Viollet L , et al. Identification and characterization of a spinal muscular atrophy-determining gene, Cell. (1995) ;80: (1):155–65. doi: 10.1016/0092-8674(95)90460-3 |
[2] | Lunn MR , Wang CH . Spinal muscular atrophy, Lancet. (2008) ;371: (9630):2120–33. doi: 10.1016/S0140-6736(08)60921-6 |
[3] | Monani UR , Lorson CL , Parsons DW , Prior TW , Androphy EJ , Burghes AH , et al. A single nucleotide difference that alters splicing patterns distinguishes the SMA gene SMN1 from the copy gene SMN2, Hum Mol Genet. (1999) ;8: (7):1177–83. doi: 10.1093/hmg/8.7.1177 |
[4] | Lorson CL , Hahnen E , Androphy EJ , Wirth B . A single nucleotide in the SMN gene regulates splicing and is responsible for spinal muscular atrophy, Proc Natl Acad Sci U S A. (2002) ;96: (11):6307–11. doi: 10.1073/pnas.96.11.6307 |
[5] | Feldkotter M , Schwarzer V , Wirth R , Wienker TF , Wirth B . Quantitative analyses of SMN1 and SMN2 based on real-time lightCycler PCR: Fast and highly reliable carrier testing and prediction of severity of spinal muscular atrophy, Am J Hum Genet. (2002) ;70: (2):358–68. doi: 10.1086/338627 |
[6] | Verhaart IEC , Robertson A , Wilson IJ , Aartsma-Rus A , Cameron S , Jones CC , et al. Prevalence, incidence and carrier frequency of 5q-linked spinal muscular atrophy – A literature review, Orphanet J Rare Dis. (2017) ;12: (1):175. doi: 10.1186/s13023-017-0671-8 |
[7] | Lally C , Jones C , Farwell W , Reyna SP , Cook SF , Flanders WD . Indirect estimation of the prevalence of spinal muscular atrophy type I, II, and III in the United States, Orphanet J Rare Dis. (2017) ;12: (1):175. doi: 10.1186/s13023-017-0724-z |
[8] | Finkel R , Bertini E , Muntoni F , Mercuri E , Group ESWS. 209th ENMC International Workshop: Outcome Measures and Clinical Trial Readiness in Spinal Muscular Atrophy 7-9 November Heemskerk, The Netherlands 2014, Neuromuscul Disord. (2015) ;25: (7):593–602. doi: 10.1016/j.nmd.2015.04.009 |
[9] | Zerres K , Rudnik-Schoneborn S . Natural history in proximal spinal muscular atrophy. Clinical analysis of 445 patients and suggestions for a modification of existing classifications, Arch Neurol. (1995) ;52: (5):518–23. doi: 10.1001/archneur.1995.00540290108025 |
[10] | Mongiovi P , Dilek N , Garland C , Hunter M , Kissel JT , Luebbe E , et al. Patient Reported Impact of Symptoms in Spinal Muscular Atrophy (PRISM-SMA), Neurology. (2018) ;91: (13):e1206–14. doi: 10.1212/WNL.0000000000006241 |
[11] | Premier Applied Sciences® tRDoPI. Premier Healthcare Database white paper: Data that informs and performs. Available from: https://products.premierinc.com/downloads/PremierHealthcareDatabaseWhitepaper.pdf November 30, 2020]. |
[12] | Cardenas J , Menier M , Heitzer MD , Sproule DM . High healthcare resource use in hospitalized patients with a diagnosis of spinal muscular atrophy type 1 (SMA1): Retrospective analysis of the Kids’ Inpatient Database (KID), Pharmacoecon Open. (2019) ;3: (2):205–13. doi: 10.1007/s41669-018-0093-0 |
[13] | Droege M , Sproule D , Arjunji R , Gauthier-Loiselle M , Cloutier M , Dabbous O . Economic burden of spinal muscular atrophy in the United States: A contemporary assessment, J Med Econ. (2020) ;23: (1):70–9. doi: 10.1080/13696998.2019.1646263 |
[14] | Lee M Jr , Franca UL , Graham RJ , McManus ML . Pre-nusinersen hospitalization costs of children with spinal muscular atrophy, Pediatr Neurol. (2019) ;92: :3–5. doi: 10.1016/j.pediatrneurol.2018.11.002 |
[15] | The Lewin Group. Cost of amyotrophic lateral sclerosis, muscular dystrophy, and spinal muscular atrophy in the United States. https://www.mda.org/sites/default/files/Cost_Illness_Report_0.pdf. Accessed October 27, 2020 2012 |
[16] | Bhattacharyya N . The prevalence of dysphagia among adults in the United States, Otolaryngol Head Neck Surg. (2014) ;151: (5):765–9. doi: 10.1177/0194599814549156 |
[17] | Carter OD , Haynes SG . Prevalence rates for scoliosis in US adults: Results from the first National Health and Nutrition Examination Survey, Int J Epidemiol. (1987) ;16: (4):537–44. doi: 10.1093/ije/16.4.537 |
[18] | Kebaish KM , Neubauer PR , Voros GD , Khoshnevisan MA , Skolasky RL . Scoliosis in adults aged forty years and older: Prevalence and relationship to age, race, and gender, Spine (Phila Pa 1976). (2011) ;36: (9):731–6. doi: 10.1097/BRS.0b013e3181e9f120 |
[19] | Chen JB , Kim AD , Allan-Blitz L , Shamie AN . Prevalence of thoracic scoliosis in adults 25 to 64 years of age detected during routine chest radiographs, Eur Spine J. (2016) ;25: (10):3082–7. doi: 10.1007/s00586-015-4215-4 |
[20] | Jain S , Self WH , Wunderink RG ; CDC EPIC Study Team. Community-acquired pneumonia requiring hospitalization, N Engl J Med. (2015) ;373: (24):2382. doi: 10.1056/NEJMc1511751 |
[21] | Kochanek KD , Murphy SL , Xu J , Arias E . Deaths: Final data for 2017. Natl Vital Stat Rep. (2019) ;68: (9):1–77. |


