
The Cure SMA Membership Surveys: Highlights of Key Demographic and Clinical Characteristics of Individuals with Spinal Muscular Atrophy
Abstract
Background:
Cure SMA maintains the largest patient-reported database for people affected with spinal muscular atrophy (SMA). In 2017, Cure SMA initiated annual surveys with their membership to collect demographic and disease characteristics, healthcare, and burden of disease information from patients and caregivers.
Objective:
To summarize results from two large-scale Cure SMA surveys in 2017 and 2018.
Methods:
Cure SMA database members were invited to complete surveys; these were completed by caregivers for living or deceased individuals with SMA and/or affected adults.
Results:
In 2017, 726 surveys were completed for 695 individuals with SMA; in 2018, 796 surveys were completed for 760 individuals with SMA. Data from both survey years are available for 313 affected individuals. Age at symptom onset, distribution of SMN2 gene copy number, and representation of each SMA type in the surveys were consistent with that expected in the SMA population. In the 2018 survey, the average age at diagnosis was 5.2 months for SMA type I and the reported mean age at death for this subgroup was 27.8 months. Between survey years, there was consistency in responses for factors that should not change within individuals over time (e.g., reported age at diagnosis).
Conclusions:
Results from the Cure SMA surveys advance the understanding of SMA and facilitate advocacy efforts and healthcare services planning. Longitudinal surveys are important for evaluating the impact of effective treatments on changing phenotypes, and burden of disease and care in individuals with SMA.
ABBREVIATIONS
BiPAP | Bilevel Positive Airway Pressure |
SMA | Spinal muscular atrophy |
SMN | Spinal muscular atrophy |
INTRODUCTION
Spinal muscular atrophy (SMA) is a rare chronic, progressive, neuromuscular disorder [1–8] caused by the homozygous disruption of the survival motor neuron 1 (SMN1) gene [2, 9, 10]. The key determinant of disease phenotype is the SMN2 gene copy number, a paralogous gene that produces low levels of full-length SMN protein but is unable to compensate for the loss of SMN1 [9, 11, 12]. Historically, SMA has been categorized into types (0–IV) based on clinical manifestation, mainly age of symptom onset and maximal motor function achieved [9, 11]. Infants with the most severe and very rare form of SMA, type 0, are symptomatic at birth and die within a few weeks of life [11, 13]. Patients with all other types of SMA are clinically asymptomatic at birth [11, 14].
SMA type I (also known as infantile-onset SMA) accounts for approximately 60% of SMA births [15]. Infants with this phenotype exhibit motor weakness within the first 6 months of life [11]. Because they never achieve the ability to sit independently, these infants require the most intensive and supportive care [10, 11, 15]. Before the approval of disease-modifying treatments, infants with SMA type I typically required both respiratory and nutritional support, frequently with the eventual use of permanent ventilation or death before 2 years of age [11, 16]. Thus, although the incidence is highest for the infantile-onset phenotype, in the era before treatment, the prevalence was lower than for types II and III, also known as later-onset SMA [15].
SMA type II accounts for approximately 30% of SMA births, manifesting weakness by 18 months of age and achieving the motor milestone of sitting [11, 14]. While commonly surviving into the third decade of life, individuals with SMA type II frequently experience difficulties with swallowing and breathing, and develop contractures and scoliosis [14, 16–20].
Ten percent of individuals are classified as SMA type III [21], with characteristic symptoms appearing after 18 months of age [11]; life expectancy is almost the same as in the general population [11, 14, 21]. Individuals with SMA type III typically reach all major milestones such as independent walking, but legs are often more severely affected than the arms [10]. Some may require wheelchair assistance in childhood, some may lose the ability to walk at the time of puberty, whereas others might continue to walk as adults [9, 11]. In SMA type IV, another rare phenotype, symptoms develop in the second or third decade of life; it is the least severe form of SMA [14] as affected individuals are able to walk unaided, and symptoms generally include mild motor impairment without respiratory or nutritional problems [9, 14].
Disease-modifying treatments have been shown to alter the disease progression for patients with SMA [22–25], including extending overall and permanent-ventilation free survival, and allowing improvement or maintenance of motor function [26]. The expected trajectory for each SMA type in the era of effective treatments will need to be redefined. Although there is currently no cure for SMA, the development of targeted therapies has revolutionized the management of the disease and provided therapeutic options beyond supportive and orthopedic/rehabilitative care [16, 27].
Nusinersen, an antisense oligonucleotide, was the first disease-modifying drug (DMD) approved by the US Food and Drug Administration (FDA) in December 2016 for the treatment of SMA in infants, children, and adults [28]. The first gene therapy for SMA was approved by the FDA in May 2019 for the treatment of children age <2 years [29]. Risdiplam, approved by the FDA in August 2020, is the second DMD that is available for the treatment of SMA, the first oral drug approved to treat patients ≥2 years [30]. Several other investigational small molecule drugs for the treatment of SMA are being evaluated in clinical trials [31–33].
Although most existing studies in SMA have focused on clinical aspects of the disease, there are several reports documenting the impact of SMA on patients and caregivers. The perspectives from caregivers and affected individuals on living with SMA provide useful insight into the impact of the disease [34–38]. Living with SMA is challenging for individuals with this disease, siblings, and other family members, particularly given the uncertainty associated with disease progression and loss of physical functioning [39]. Large-scale surveys are needed to enhance the understanding of the impact of the disease on affected individuals and their families across the SMA phenotypic and age spectrum. With the availability of targeted therapies and a paradigm shift toward newborn screening and early treatment [31, 40, 41], input from caregivers and individuals with SMA on functional impacts of the disease would provide insight into changing trends in the epidemiology of SMA in the treatment era. Self-reported data from surveys document real-world experiences and may capture a broader spectrum of affected individuals than studies of patients from major medical centers. Because self and caregiver reports are expected to more fully characterize the experiences of those living with SMA, it is critical to establish the reliability and validity of these types of surveys in capturing key clinical disease characteristics.
The current study uses data from a large, heterogeneous sample of individuals living with SMA and caregivers to describe their demographic and disease characteristics, health experiences, and burden of disease, as well as assess the reliability and accuracy of self-reported data on key clinical characteristics, such as SMN2 gene copy number. The purpose of the current study is to enhance the scientific understanding of burden of disease from the perspective of affected individuals and caregivers in a large sample spanning the SMA phenotypic and age spectra.
METHODS
Participants
Cure SMA is the largest patient advocacy organization based in the US and maintains the largest self-reported data repositories on individuals with SMA worldwide. The database was launched in 1996 and, at the time of the 2018 survey, an average of 27 new affected individuals were being entered into the Cure SMA database each month. This number had increased significantly over the past 2 years. Details on the Cure SMA database can be found in Belter et al., 2018 [42]. In 2017, an annual community survey was launched to gather further data on demographic and disease characteristics, delivery of clinical health care, and disease burden of those affected by SMA and their caregivers, with the goal of elevating awareness of the experiences of people living with SMA and their families. The Cure SMA database members were the primary target population for these surveys, and the current report includes data from both the 2017 and 2018 surveys (Supplemental Tables 2 and 3, respectively). Surveys were completed by caregivers for living or deceased patients and/or affected adults. An abbreviated version of the survey was administered to caregivers of deceased individuals, which excluded questions about current functioning and care, surgeries related to SMA, hospitalizations in the past 12 months, and treatment with nusinersen. In a small number of instances, multiple surveys were completed for an affected individual within a survey year wherein, most commonly, both parents completed a survey for the same affected individual. When this occurred, data were used from the most complete survey or, if the surveys had the same amount of completed information, the mother’s survey was used as they most frequently completed a survey.
In each year, survey invitations were sent to Cure SMA database members via email and/or postcards to the last known valid address, if any. In 2018, this included 3,542 members. The membership update survey was advertised on the Cure SMA social media pages, including Facebook, and the Cure SMA website to invite new members to complete the survey.
Institutional review board (IRB) approval was obtained by Schulman IRB for the 2017 survey and Western IRB for the 2018 survey. Consent was assumed from a respondent’s survey participation. All data were de-identified before analysis.
Survey
In both 2017 and 2018, participants were asked to complete information on a range of topics including demographics (e.g., sex, age at survey, vital status, educational level, employment); disease characteristics (e.g., age at diagnosis, SMN2 gene copy number); respiratory interventions, motor function, surgeries and hospitalizations; and clinical care providers and caregivers.
Regarding questions pertaining to motor function, respondents selected a single option reflecting current maximum motor function; they did not indicate all current motor function(s). To derive an indicator of whether the affected individual had each motor function at the time of survey, the response options were treated as a continuum, encompassing head control, maintaining seated position (with or without support), stands with support, walks with support, and walks independently. If “none of the above” was selected, the affected individual was assumed to not have current head control (the lowest function on the continuum). Given the heterogeneous age range of patients and the fact that some had not yet reached the age at which they would be expected to achieve various motor milestone (based on the CDC developmental milestones checklist [43]), denominators were adjusted to accurately determine proportions currently able to perform each motor function. The age cut-offs for each motor function were as follows: 4 months for head control, 4 months for maintains seated position supported, 7 months for maintains seated position unsupported, 8 months for stands with support, 11 months for walks with support, 15 months for walks independently. Patients who were missing data for this question and those who had not yet reached the milestone and were younger than the CDC age cut-offs, were removed from the denominator.
Surgical procedures related to SMA included scoliosis surgery (spinal fusion, spinal rods, vertical expandable prosthetic titanium rib (VEPTR), and MAGEC® rods), orthopedic surgery (hip surgery, joint contractures, and ankle or foot surgery), gastrointestinal surgery (Nissen fundoplication, g-tube placement, and gastrostomy), otolaryngology/oral surgery (tonsillectomy, dental surgery, and ear tube placement), and respiratory surgery (tracheostomy). The proportion of individuals who ever had these surgeries was reported among those who had reported “yes” to any of the specific surgeries noted above.
The 2018 survey collected several additional key data points such as age at symptom onset (which permitted the calculation of diagnostic delay) and reasons for hospitalization in the 12-month period before the survey. Although a question on a presymptomatic diagnosis was not included in the survey, it was assumed to have occurred if diagnosis preceded symptom onset, as determined by the diagnosis date and age at symptom onset. A single question was also added to the 2018 survey to capture whether affected individuals with SMA had been treated with nusinersen [44]. The only questions that required an answer in the surveys was name, birthdate, and SMA type.
Analysis
This descriptive study was designed to examine disease burden from the perspective of the affected individual and caregiver. Given the heterogeneity of the SMA population, the distribution of each study variable by SMA type is presented here. Means (standard deviations) and medians (ranges) for continuous variables and numbers and percentages for binary and categorical factors are reported. Missing values are presented to discern whether key characteristics were captured by affected individuals and caregivers. No significance testing was conducted across groups.
We examined year-to-year consistency in res-ponses between survey years for factors that should not change within individuals over time, including sex, SMA type, age at diagnosis, and SMN2 gene copy number. Pearson correlation coefficients were used for continuous variables and Cohen’s kappa was provided for nominal variables.
RESULTS
Participants from 38 countries were represented in the 2018 surveys, and 26 countries in the 2017 surveys. The surveys were predominantly completed for individuals living in the US. In the 2017 and 2018 surveys, 92.5% and 85.6% of participants reported living in the US, respectively; 1.3% and 2.8% of the participants reported living in Canada, respectively. As of the 2017 survey, there were 6694 individuals with SMA in the Cure SMA database; at the time of the 2018 survey, there were 7211 individuals in the database.
In 2017, 726 surveys were completed for 695 individuals with SMA between February 4 and March 16. In 2018, 796 surveys were completed for 760 individuals with SMA between March 13 and April 30. Multiple surveys were completed for some individuals, i.e., 29 (4.2%) individuals in the 2017 survey and 30 (3.9%) individuals in the 2018 survey.
In 2018, most respondents were parents (75.0%), followed by the affected individuals (21.4%) and others (3.6%), such as grandparents, spouses, and friends. A subset of 313 individuals have data available from both 2017 and 2018, permitting us to examine the 12-month reliability of key disease characteristics (e.g., age at diagnosis). The data indicate that, on key demographic characteristics (e.g., sex, SMA type, age), individuals who participated in the 2018 survey were largely similar to those in the overall Cure SMA database (Supplemental Table 1).
Table 1
Demographic characteristics of 2018 and 2017 survey cohorts, all individuals with SMA types I, II, and III
| Characteristics | 2018 Survey | 2017 Survey | ||||
| Type I | Type II | Type III | Type I | Type II | Type III | |
| (n = 268) | (n = 290) | (n = 173) | (n = 213) | (n = 270) | (n = 187) | |
| Sex, n (%) | ||||||
| Male | 129 (48.1) | 127 (43.8) | 80 (46.2) | 109 (51.2) | 115 (42.6) | 72 (38.5) |
| Female | 139 (51.9) | 150 (51.7) | 90 (52.0) | 96 (45.1) | 142 (52.6) | 106 (56.7) |
| Unknown | 0 | 13 (4.5) | 3 (1.7) | 8 (3.8) | 13 (4.8) | 9 (4.8) |
| Age at survey | ||||||
| n* | 157 | 275 | 171 | 104 | 243 | 176 |
| Mean (SD), years | 6.4 (7.8) | 15.8 (14.0) | 30.1 (19.0) | 8.2 (9.0) | 15.0 (12.6) | 30.7 (18.2) |
| Median (range), years | 3 (0–43) | 11 (1–76) | 29 (2–78) | 5 (0–52) | 11 (0–64) | 29.2 (1–77) |
| Age at survey categories, in years, n (%) | ||||||
| n* | 157 | 275 | 171 | 104 | 243 | 176 |
| ≤4 | 96 (61.2) | 58 (21.1) | 10 (5.9) | 50 (48.1) | 53 (21.8) | 7 (4.0) |
| 5–10 | 26 (16.6) | 73 (26.5) | 24 (14.0) | 19 (18.3) | 61 (25.1) | 26 (14.8) |
| 11–17 | 21 (13.4) | 44 (16.0) | 25 (14.6) | 23 (22.1) | 47 (19.3) | 23 (13.1) |
| ≥18 | 14 (8.9) | 100 (36.4) | 112 (65.5) | 12 (11.5) | 82 (33.7) | 120 (68.2) |
| Deceased, n (%) | 111 (41.4) | 15 (5.2) | 2 (1.2) | 108 (50.7) | 5 (1.9) | 0 |
| Age at death | ||||||
| N | 110 | 15 | 2 | 99 | 4 | 0 |
| Mean (SD), months | 27.8 (54.3) | 124.8 (128.4) | 243 (239.0) | 22.8 (48.1) | 138.3 (102.8) | N/A |
| Median (range), months | 9 (0–348) | 67 (14–407) | 243 (74–412) | 8 (0–348) | 121.5 (32–278) | N/A |
| Highest level of education for adults (≥18), n (%)† | ||||||
| N | 14 | 100 | 112 | 12 | 82 | 120 |
| No schooling completed | 1 (7.1) | 1 (1.0) | 0 | 0 | 0 | 0 |
| Some high school, no diploma | 1 (7.1) | 3 (3.0) | 2 (1.8) | 4 (33.3) | 2 (2.4) | 1 (0.8) |
| High school graduate | 4 (28.6) | 11 (11.0) | 15 (13.4) | 2 (16.7) | 16 (19.5) | 12 (10.0) |
| Trade/technical/voca-tional training | 0 | 3 (3.0) | 3 (2.7) | 0 | 1 (1.2) | 4 (3.4) |
| Some college credit, no degree | 3 (21.4) | 17 (17.0) | 13 (11.6) | 3 (25.9) | 18 (22.0) | 15 (12.5) |
| Associate or professional degree | 0 | 5 (5.0) | 17 (15.1) | 1 (8.3) | 6 (7.3) | 18 (15.0) |
| Bachelor’s degree | 3 (20.0) | 31 (31.0) | 41 (36.6) | 0 | 25 (30.5) | 41 (34.2) |
| Master’s or Doctorate degree | 2 (14.2) | 24 (24.0) | 20 (17.9) | 2 (16.7) | 13 (15.8) | 27 (22.5) |
| Unknown/missing | 0 | 5 (5.0) | 1 (0.9) | 0 | 1 (1.2) | 2 (1.7) |
| Currently employed or attending school, n (%) | ||||||
| n‡ | 54 | 206 | 152 | 51 | 198 | 162 |
| Employed full-time | 0 | 26 (12.6) | 37 (24.3) | 1 (2.0) | 18 (9.1) | 44 (27.2) |
| Employed part-time | 2 (3.7) | 17 (8.3) | 9 (5.9) | 0 | 16 (8.1) | 9 (5.6) |
| Attend school full-time | 28 (51.9) | 118 (57.3) | 49 (32.2) | 32 (62.8) | 119 (60.1) | 54 (33.3) |
| Attend school and employed | 0 | 1 (0.5) | 7 (4.6) | 1 (2.0) | 6 (3.0) | 1 (0.6) |
| Not employed nor attending school | 15 (27.8) | 32 (15.5) | 41 (27.0) | 7 (13.7) | 35 (17.7) | 48 (29.6) |
| Not applicable (N/A) | 9 (16.7) | 12 (5.8) | 9 (5.9) | 10 (19.6) | 4 (2.0) | 6 (3.7) |
N/A, not applicable; SMA, spinal muscular atrophy. Note: Percentages may not add up to 100 due to rounding. *Sample size is for age at survey among living individuals with valid responses. †If homeschooled, respondent is asked to select the grade equivalent. ‡Sample size is for living individuals who are at least school-aged (i.e., ≥5 years).
Figure 1 displays the 2017 and 2018 participants by SMA type. In each year, infantile-onset (type I) and later-onset (types II and III) phenotypes were well represented. In 2018, 35.3% of surveys were completed for individuals with SMA type I (n = 268), 38.2% for type II (n = 290), and 22.8% for type III (n = 173). As would be expected based on disease epidemiology [15], few surveys were completed for individuals with type 0 (data available from 2018 only; n = 12, 1.6%) and type IV (2018; n = 5, 0.7%). A small percentage reported SMA type as “unknown” (2018; n = 12, 1.6%). Although enhancing understanding of the patient and caregiver experience for the less common type 0 and type IV phenotypes is important, the numbers of respondents were too sparse to make meaningful inferences. Consequently, Tables 1–4 focus on types I–III.
Fig. 1
Characteristics of the 2017 and 2018 survey participants by SMA type.
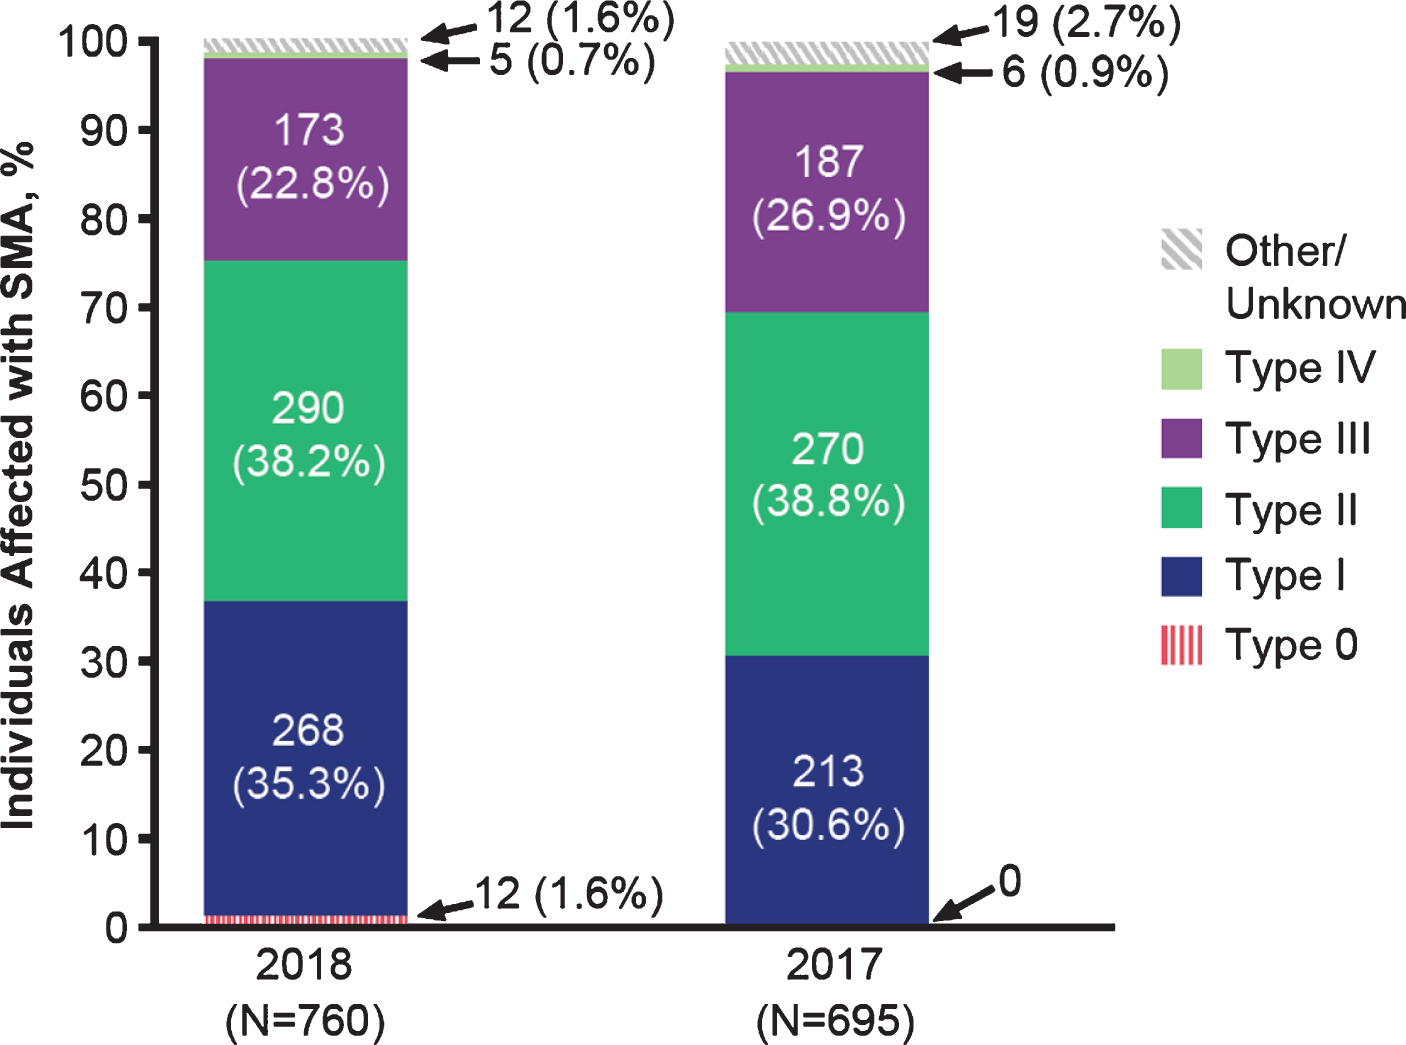
Table 2
Disease characteristics, all individuals with SMA types I, II, and III
| Characteristics | 2018 Survey | 2017 Survey | ||||
| Type I | Type II | Type III | Type I | Type II | Type III | |
| (n = 268) | (n = 290) | (n = 173) | (n = 213) | (n = 270) | (n = 187) | |
| Age at symptom onset | ||||||
| N | 258 | 272 | 159 | |||
| Mean (SD), months | 2.6 (3.9) | 10.2 (10.4) | 39.4 (70.6) | NC | NC | NC |
| Median (range), months | 2 (0–49) | 9 (0–160) | 18 (0–680) | NC | NC | NC |
| Age at diagnosis | ||||||
| N | 263 | 280 | 167 | 203 | 243 | 167 |
| Mean (SD), months | 5.2 (10.7) | 22.9 (33.1) | 114.4 (119.8) | 4.9 (9.6) | 21.7 (36.9) | 107.5 (126.2) |
| Median (range), months*, † | 4 | 16 | 59 | 4 | 16 | 46 |
| (–6 to 128) | (–7 to 310) | (–6 to 587) | (–9 to 126) | (–6 to 520) | (–5 to 587) | |
| Diagnostic delay‡ | ||||||
| N | 226 | 242 | 138 | |||
| Mean (SD), months | 5.7 (33.4) | 15.9 (39.7) | 89.4 (111.8) | NC | NC | NC |
| Median (range), months | 2 (0–437) | 7 (0–329) | 37 (0–547) | NC | NC | NC |
| SMN2 copy number, n (%) | ||||||
| 1 copy | 19 (7.1) | 3 (1.0) | 1 (0.6) | 14 (6.6) | 6 (2.2) | 1 (0.5) |
| 2 copies | 117 (43.7) | 27 (9.3) | 10 (5.8) | 85 (39.9) | 16 (5.9) | 5 (2.7) |
| 3 copies | 16 (6.0) | 112 (38.6) | 36 (20.8) | 7 (3.3) | 83 (30.7) | 29 (15.5) |
| 4 copies | 0 | 5 (1.7) | 39 (22.5) | 1 (0.5) | 0 | 19 (10.2) |
| 5 or more copies | 1 (0.4) | 0 | 6 (3.5) | 0 | 1 (0.4) | 3 (1.6) |
| Don’t know/missing | 115 (42.9) | 143 (49.3) | 81 (46.8) | 106 (49.8) | 164 (60.7) | 130 (69.5) |
NC, not collected; SMA, spinal muscular atrophy. *Excluded values of <-9 months. †Negative values indicate diagnosis before birth. ‡Diagnostic delay = age at diagnosis minus age at symptom onset. If diagnostic delay was negative (child started to show symptoms after receiving a diagnosis), the negative value was edited to “0” to indicate no diagnostic delay.
Table 3
Respiratory interventions, motor function, surgeries and hospitalizations among living individuals with SMA types I, II, and III*
| Characteristics | 2018 Survey (living individuals) | 2017 Survey (living individuals) | ||||
| Type I | Type II | Type III | Type I | Type II | Type III | |
| (n = 157) | (n = 275) | (n = 171) | (n = 105) | (n = 265) | (n = 187) | |
| Current use of respiratory intervention, n (%) | ||||||
| Yes | 144 (91.7) | 190 (69.1) | 34 (19.9) | 97 (92.4) | 181 (68.3) | 36 (19.3) |
| No | 10 (6.4) | 70 (25.5) | 126 (73.7) | 7 (6.7) | 74 (27.9) | 135 (72.2) |
| Unknown/missing | 3 (1.9) | 15 (5.5) | 11 (6.4) | 1 (1.0) | 10 (3.8) | 16 (8.6) |
| Type of current respiratory interventions, n (%) | ||||||
| Oxygen | 21 (13.4) | 24 (8.8) | 1 (0.6) | 24 (22.9) | 24 (9.1) | 1 (0.5) |
| BiPAP | 74 (47.1) | 95 (34.7) | 12 (7.0) | 45 (42.9) | 97 (36.6) | 13 (7.0) |
| CPAP | 1 (0.6) | 7 (2.6) | 8 (4.7) | 12 (1.0) | 4 (1.5) | 9 (4.8) |
| Cough assist | 156 (69.4) | 156 (56.9) | 15 (8.8) | 77 (73.3) | 142 (53.6) | 18 (9.6) |
| Ventilator | 58 (36.9) | 18 (6.6) | 0 | 42 (40.0) | 24 (9.1) | 0 |
| Tracheostomy | 48 (30.6) | 10 (3.7) | 0 | 39 (37.1) | 9 (3.4) | 0 |
| Current motor function(s) at time of survey† | ||||||
| Head control | 82/148 (55.4) | 237/270 (87.8) | 159/169 (94.1) | 39/96 (40.6) | 216/243 (88.9) | 162/175 (92.6) |
| Maintains seated position supported | 53/148 (35.8) | 204/270 (75.6) | 155/169 (91.7) | 28/96 (29.2) | 184/243 (75.7) | 158/175 (90.3) |
| Maintains seated position unsupported | 32/144 (22.2) | 127/270 (47.0) | 148/169 (87.6) | 11/93 (11.8) | 127/242 (52.5) | 145/175 (82.9) |
| Stands with support | 8/141 (5.7) | 30/270 (11.1) | 111/169 (65.7) | 5/91 (5.5) | 28/242 (11.6) | 85/175 (48.6) |
| Walks with support | 4/131 (3.1) | 16/270 (5.9) | 93/169 (55.0) | 2/89 (2.2) | 14/242 (5.8) | 69/175 (39.4) |
| Walks independently | 3/125 (2.4) | 4/270 (1.5) | 76/169 (45.0) | 0 | 6/241 (2.5) | 53/175 (30.3) |
| Surgeries ever had related to SMA, n (%)‡ | ||||||
| Yes | 132 (83.0) | 178 (64.7) | 41 (23.8) | 101 (92.7) | 227 (85.3) | 82 (43.9) |
| No | 19 (12.0) | 83 (30.2) | 102 (59.3) | 8 (7.3) | 39 (14.7) | 105 (56.2) |
| Unknown/missing | 8 (5.0) | 14 (5.1) | 29 (16.9) | 0 | 0 | 0 |
| Type of SMA-related surgeries, if ever SMA-related surgery¶ | ||||||
| Scoliosis | 31 (23.5) | 124 (69.7) | 26 (63.4) | 31 (31.6) | 133 (79.2) | 35 (64.8) |
| Orthopedic | 10 (7.6) | 43 (24.2) | 7 (17.1) | 10 (10.2) | 48 (28.6) | 14 (25.9) |
| Gastrointestinal | 127 (96.2) | 85 (47.8) | 3 (7.3) | 94 (95.9) | 64 (38.1) | 2 (3.7) |
| Otolaryngology/oral | 27 (20.5) | 45 (25.3) | 10 (24.4) | 11 (11.2) | 31 (18.5) | 9 (16.7) |
| Respiratory | 57 (43.2) | 14 (7.9) | 0 | 39 (39.8) | 13 (7.7) | 0 |
| Any hospitalizations in past 12 months, n (%)§ | ||||||
| Yes | 82 (51.6) | 98 (35.6) | 24 (14.0) | 49 (46.79) | 72 (27.2) | 12 (6.4) |
| No | 63 (39.6) | 153 (55.6) | 122 (71.4) | 45 (42.9) | 155 (58.5) | 151 (80.8) |
| Unknown/missing | 14 (8.8) | 24 (8.7) | 25 (14.6) | 11 (10.5) | 38 (14.3) | 24 (12.8) |
| Reasons for hospitalization in past 12 months | – | – | – | |||
| Respiratory distress | 47 (29.6) | 47 (17.1) | 3 (1.7) | |||
| Pneumonia | 34 (21.4) | 44 (16.0) | 3 (1.7) | |||
| Infection (other than pneumonia) | 21 (13.2) | 35 (12.7) | 5 (2.9) | |||
| Failure to thrive | 6 (3.8) | 1 (0.4) | 0 | |||
| Dehydration | 11 (6.9) | 19 (6.9) | 0 | |||
| Feeding tube problems | 7 (4.4) | 4 (1.5) | 0 | |||
| Abdominal | 1 (0.6) | 8 (2.9) | 2 (1.2) | |||
| Trauma, fracture or external injury | 2 (1.3) | 2 (0.7) | 4 (2.3) | |||
| Headache | 2 (1.3) | 2 (0.7) | 2 (1.2) | |||
| Surgery | 19 (12.0) | 25 (9.1) | 3 (1.7) | |||
| Laminectomy | 1 (0.6) | 1 (0.4) | 1 (0.6) | |||
BiPAP, bilevel positive airway pressure; CPAP, continuous positive airway pressure; VEPTR, vertical expandable prosthetic titanium rib; SMA, spinal muscular atrophy; CDC, Centers for Disease Control and Prevention. *Questions were not asked of caregivers of deceased individuals. †Respondents selected a single response reflecting current maximum motor function; they did not indicate all current motor function(s). To derive an indicator of whether the affected individual had each motor function at the time of survey, the response options were treated as a continuum, encompassing head control maintaining seated position (with or without support), stands with support, walks with support, and walks independently. If “none of the above” was selected, the affected individual was assumed to not have current head control (the lowest function on the continuum). Given the heterogeneous age range of patients and the fact that some had not yet reached the age at which they would be expected to achieve various motor milestone (based on CDC guidelines [43]), denominators were adjusted to accurately determine proportions currently able to perform each motor function. The age cut-offs for each motor function were as follows: 4 months for head control, 4 months of maintains seated position supported, 7 months for maintains seated position unsupported, 8 months for stands with support, 11 months for walks with support, 15 months for walks independently. Patients who were missing data for this question and those who had not yet reached the milestone and where younger than the CDC age cut-offs, were removed from the denominator. Denominators are given for each milestone by type in the table. ‡Created variable –“Yes” coded based on “yes” to any of the following: spinal fusion, spinal rods, VEPTR, MAGEC® rods, hip surgery, joint contractures, ankle or foot surgery, Nissen fundoplication, g-tube placement, gastrostomy tonsillectomy, dental surgery, and ear tube placement, or tracheostomy. “No” coded based on endorsement of an item indicating the affected individual never had an SMA-related surgery. ¶Surgical procedures related to SMA included scoliosis surgery (spinal fusion, spinal rods, VEPTR, and MAGEC® rods), orthopedic surgery (hip surgery, joint contractures, and ankle or foot surgery), gastrointestinal surgery (Nissen fundoplication, g-tube placement, and gastrostomy), otolaryngology/oral surgery (tonsillectomy, dental surgery, and ear tube placement), and respiratory surgery (tracheostomy). §In 2018 survey, “No” was for either answering “0” for number of times they were hospitalized in the last 12 months or selecting “I was not hospitalized in the last 12 months” when asked for the reason for hospitalization.
Table 4
Care for individuals with SMA: providers and caretakers, among living individuals with SMA types I, II, and III*
| Characteristics | 2018 Survey (living individuals) | 2017 Survey (living individuals) | ||||
| Type I | Type II | Type III | Type I | Type II | Type III | |
| (n = 157) | (n = 275) | (n = 171) | (n = 105) | (n = 265) | (n = 187) | |
| Number of specialists | ||||||
| Mean (SD) | 4.1 (1.1) | 4.9 (3.3) | 3.2 (2.9) | 3.7 (4.2) | 4.7 (3.0) | 3.0 (2.7) |
| Median (range) | 4 (0–14) | 5 (0–15) | 2 (0–16) | 1 (0–13) | 5 (0–11) | 2 (0–10) |
| Types of specialists seen, n (%) | ||||||
| Neurologist | 135 (87.1) | 233 (92.5) | 141 (91.6) | 89 (82.4) | 202 (81.8) | 137 (86.7) |
| Pulmonologist | 143 (92.3) | 217 (86.1) | 67 (43.5) | 100 (92.6) | 198 (80.2) | 64 (40.5) |
| Rehab medicine/physiatrist | 40 (25.8) | 66 (26.2) | 25 (16.3) | 30 (27.8) | 60 (24.3) | 33 (20.9) |
| Geneticist | 44 (28.4) | 51 (20.2) | 32 (20.8) | 28 (25.9) | 28 (11.3) | 26 (16.5) |
| Orthopedist | 100 (64.5) | 151 (59.9) | 39 (25.3) | 72 (66.7) | 146 (59.1) | 54 (34.2) |
| Cardiologist | 40 (25.8) | 49 (19.4) | 23 (14.9) | 39 (36.1) | 46 (18.6) | 21 (13.3) |
| Speech therapist | 93 (60.0) | 50 (19.8) | 5 (3.3) | 70 (64.8) | 31 (12.6) | 9 (5.7) |
| Occupational therapists | 98 (63.2) | 136 (54.0) | 30 (19.5) | 69 (63.9) | 119 (48.2) | 41 (26.0) |
| Nutritionist | 103 (66.5) | 100 (39.7) | 34 (22.1) | 76 (70.4) | 90 (36.4) | 30 (19.0) |
| Orthotist | 49 (31.6) | 67 (26.6) | 23 (14.9) | 35 (32.4) | 61 (24.7) | 18 (11.4) |
| Vocational rehabilitation counselor | 4 (2.6) | 21 (8.3) | 6 (3.9) | 3 (2.8) | 12 (4.9) | 7 (4.4) |
| Psychologist/therapist | 7 (4.5) | 30 (11.9) | 18 (11.7) | 9 (8.3) | 22 (8.9) | 14 (8.9) |
| Nephrologist | 17 (11.0) | 10 (4.0) | 7 (4.6) | 7 (6.5) | 11 (4.5) | 2 (1.3) |
| Social worker | 57 (36.8) | 53 (21.0) | 21 (13.6) | 49 (45.4) | 50 (20.2) | 20 (12.7) |
| Physical therapist | 125 (80.7) | 180 (71.4) | 86 (55.8) | 84 (77.8) | 169 (68.4) | 78 (49.4) |
| Palliative care | 32 (20.7) | 12 (4.8) | 5 (3.3) | 28 (25.9) | 11 (4.5) | 2 (1.3) |
| Have a caregiver/caretaker, n (%) | 138 (86.8) | 240 (87.3) | 128 (74.4) | 99 (90.8) | 244 (91.7) | 155 (82.9) |
| Of those with caregiver, caregiver is family member, n (%) | 137 (99.3) | 223 (92.9) | 100 (78.1) | 99 (100.0) | 227 (93.0) | 128 (82.1) |
| Of those with caregiver, non-family/paid caretaker, n (%) | 54 (39.1) | 114 (47.5) | 56 (43.8) | 25 (25.3) | 116 (47.4) | 76 (48.7) |
| Of those with a non-family/paid caretaker, number hours per week, n (%) | ||||||
| 0–20 | 7 (13.0) | 34 (29.8) | 8 (14.3) | 2 (8.0) | 33 (28.5) | 30 (39.5) |
| 21–40 | 14 (25.9) | 18 (15.8) | 13 (23.2) | 7 (28.0) | 26 (22.4) | 17 (22.4) |
| ≥40 | 18 (33.3) | 43 (37.7) | 6 (10.7) | 10 (40.0) | 40 (34.5) | 12 (15.8) |
| Missing | 15 (27.8) | 19 (16.7) | 29 (51.8) | 6 (24.0) | 17 (14.7) | 17 (22.4) |
| Nusinersen | ||||||
| Yes, I have been treated† | 127 (80.9) | 148 (53.8) | 87 (50.9) | – | – | – |
| No, never been treated | 21 (13.4) | 114 (41.5) | 78 (45.6) | – | – | – |
| Don’t know | 0 | 1 (0.4) | 0 | – | – | – |
| Missing | 9 (5.7) | 12 (4.4) | 6 (3.5) | – | – | – |
SD, standard deviation; SMA, spinal muscular atrophy. *Questions were not asked of caregivers of deceased individuals. †Includes those who have been treated commercially and/or in a clinical trial.
In comparing year-to-year results, there was little meaningful variation across the characteristics examined. As such, the description of study results focuses on the most recently collected data from 2018, but results from both surveys are presented in the Tables.
Demographic characteristics (Table 1)
Both sexes were well represented in the surveys (2018; 48.1% male). In 2018, 41.4% (n = 111) of SMA type I individuals were deceased at the time of the survey. The mean age of death reported among those with type I was 27.8 months; the median age of death was 9 months. Only a small proportion of type II and type III individuals were no longer alive (5.2% and 1.2%, respectively). Among living individuals in 2018, the average age at survey varied and increased across types, from a mean of 6.4 years for type I, 15.8 years for type II, and 30.1 years for type III.
More than 50% of adults with later-onset (type II or type III) SMA had completed at least a bachelor’s degree. Yet a noteworthy proportion of living patients with SMA type I, II, and III who were at least school-aged, i.e.,≥5 years, were neither in school nor employed at the time of the 2018 survey (27.8%, 15.5%, and 27.0%, respectively).
Disease characteristics (Table 2)
In 2018, the average age of reported SMA symptom onset was 2.6 months, 10.2 months, and 39.4 months for types I, II, and III, respectively. This is consistent with summary findings from a 2015 literature review that SMA symptom onset occurs at an average age of 2.5 months, 8.3 months, and 39.0 months for types I, II, and III, respectively [17]. The average age at SMA diagnosis was 5.2 months, 22.9 months, and 114.4 months (or 9.5 years) for types I, II, and III, respectively. The average delay increased substantially from type I (5.7 months) and type II (15.9 months) to type III (89.4 months).
As shown in Fig. 2, nearly three-quarters of individuals with type I were reported to have 2 copies of the SMN2 gene, three-quarters with type II to have 3 copies, and approximately 50% with type III to have 3 copies. However, a substantial number of individuals with SMA lacked data on SMN2 gene copy number (Table 2). This was likely because copy number-testing was not often performed in the pre-treatment era.
Fig. 2
SMN2 gene copy number by spinal muscular atrophy (SMA) type. Distributions of SMN2 gene copy numbers observed in the 2018 Cure SMA survey (among those with valid responses) and those reported in a recent analysis by Calucho et al., 2018 [58] for each SMA type.
![SMN2 gene copy number by spinal muscular atrophy (SMA) type. Distributions of SMN2 gene copy numbers observed in the 2018 Cure SMA survey (among those with valid responses) and those reported in a recent analysis by Calucho et al., 2018 [58] for each SMA type.](https://content.iospress.com:443/media/jnd/2021/8-1/jnd-8-1-jnd200563/jnd-8-jnd200563-g002.jpg)
Respiratory interventions, motor function, surgeries, and hospitalizations (Table 3)
At the time of the 2018 survey, 91.7% of type I, 69.1% of type II, and 19.9% of type III patients were reportedly using at least one type of respiratory intervention. Among those with SMA type I, a range of respiratory interventions were commonly reported, including the use of a cough assist machine (69.4%), bilevel positive airway pressure (BiPAP) (47.1%), ventilator (36.9%), and an invasive intervention of tracheostomy (30.6%). For SMA type II, the most commonly reported respiratory interventions were for cough assist (56.9%) and BiPAP (34.7%) machines. Reasons for use were not collected (e.g., ongoing use or during acute illness). As noted previously, use of respiratory interventions was not frequently reported for individuals with SMA type III. Similar results for SMA types I–III were reported in the 2017 survey. Among those who had passed away, 85.6%, 66.7%, and 50.0% of individuals with SMA type I, II, and III, respectively, had used at least one type of respiratory intervention prior to death. Moreover, 22.1% of individuals with type I were on ventilator support prior to death (data not shown in table).
Current motor function was assessed in both the 2017 and 2018 surveys. At the time of the 2018 survey, approximately half (55.4%) of the living patients with SMA type I (who had passed through the expected development window to achieve the milestone) could maintain head control, and 35.8% could reportedly maintain a seated position while supported. Some patients had reported motor milestones atypical for type I according to natural history, including sitting unsupported (22.2%) and standing with support (5.7%). These atypical milestones for type I had increased from the 2017 survey, which showed 11.8% of individuals with type I sitting unsupported and 5.5% of individuals with type I standing with support. Although this could be due to misclassification of SMA or motor functioning, it could also be due to the benefits of SMA treatments, but was not examined here due to data limitations (i.e., age at start of treatment was not collected). Among the type II patients in the 2018 survey, only 47.0% were able to sit independently and, among the type III patients, only 45.0% could reportedly walk independently.
Among living individuals, SMA-related surgeries were commonly reported across SMA types; 83.0% with type I, 64.7% with type II, and 23.8% with type III were reported to have one or more in their lifetime. The most common surgeries were gastrointestinal (i.e., g-tube placement) among patients with SMA type I (96.2%, n = 127/132) and spinal surgery for scoliosis among patients with SMA types II and III (69.7%, n = 124/178 and 63.4%, n = 26/41, respectively).
Among living individuals, a large percentage reported having been hospitalized in the last 12 months: 51.6% with type I, 35.6% with type II, and 14.0% with type III. The most common reason for hospitalizations in the last 12 months was respiratory distress among those with SMA type I (29.6%) and type II (17.1%), and an infection other than pneumonia for type III (2.9%).
Care for individuals with SMA: Providers and caretakers (Table 4)
Respondents were also asked to identify specialists comprising the care team of the affected individual. On average, 4.1, 4.9, and 3.2 different types of specialists were reported to be on care teams for type I, type II, and type III patients, respectively. Among the living individuals, the most common specialists identified were neurologists, pulmonologists, and physical therapists; the type of specialists seen varied by SMA type.
In the 2018 survey, the majority of type I (86.8%), II (87.3%) and III (74.4%) patients were reported to have a caregiver/caretaker. For most, the full-time caretaker was a family member, but a noteworthy percentage reported having a nonfamily/paid caretaker (type I: 39.1%, type II: 47.5%, type III: 43.8%). Of those with a nonfamily/paid caretaker, many reported receiving this assistance for ≥ 40 hours/week (type I: 33.3%, type II: 37.7%, type III: 10.7%).
In the 2018 survey, the vast majority of living patients with SMA type I had received at least one dose of nusinersen (80.9%) and approximately half of those with type II (53.8%) or type III (50.9%) had received nusinersen. Among those with SMA type II and type III, 41.5% and 45.6% reported not being treated with nusinersen, whereas 5% and 4%, respectively, did not provide a response. Among those with type I and alive during the survey, 13.4% of those with type I reported no nusinersen treatment. Data on use of other therapies were not collected.
Twelve-month reliability
Although responses for some patient characteristics, function, and disease burden collected in each survey year have the potential to vary over time, there were several parameters that should not vary within individuals over the surveys years, including SMA type, age at diagnosis, and SMN2 gene copy number. For the subset of participants (n = 313) with available data from both the 2017 and 2018 surveys, we examined 12-month concordance. For most such variables, we found high concordance across the two timepoints (sex: κ= 1.00, p < 0.0001; type: κ= 0.93, p < 0.0001, age at diagnosis: r = 0.96, p < 0.001, age at death [if deceased at the time of the 2017 survey]: r = 0.95, p < 0.0001, and highest level of education for adults: κ= 0.80, p < 0.0001). This suggests that individuals with SMA and caregivers are consistent reporters on key demographic and disease characteristics. Moderate agreement was found for SMN2 gene copy number (κ= 0.57, p < 0.0001).
DISCUSSION
For the past three decades, Cure SMA has played a central role in furthering an understanding of experiences of individuals and families affected by SMA [34, 39, 42, 45, 46]. The annual membership survey collects information from the perspective of the individual with SMA and caregiver and highlights experiences of Cure SMA community members, including survival by SMA type and diagnostic delays.
Generally, those who participated in the 2017 and 2018 surveys were largely similar on key demographic characteristics (e.g., sex, SMA type, age) with those in the overall Cure SMA database. However, several noteworthy differences were found. For example, the average age of type I patients in the 2018 survey was higher compared with the Cure SMA database, and with the average age of living type I patients observed in earlier clinical studies [47–49]. The availability of 2 years of data permitted an examination of the consistency of results over an approximate 12-month period and within individuals (among the subset of participants with data from both survey years).
Results from the Cure SMA membership surveys presented here underscore the impact of the disease on affected individuals—from infants to adults—and their families. For example, in our work, we found a noteworthy proportion of individuals with SMA across the phenotypic spectrum who had reached school age and were neither in school nor employed at the time of the survey. Although we did not collect the reasons school-aged individuals were not attending school, it nevertheless underscores the loss of productivity among many affected individuals. Moreover, a substantial number of individuals reported relying on family and paid caregivers showing the potential for significant indirect and direct costs associated with the care and assistance of individuals with SMA.
The data show noteworthy diagnostic delay (defined as time from age at symptom onset to age at diagnosis) that occurred within each SMA type. This suggests that SMA disease awareness is suboptimal. Decreasing diagnostic delay and access to treatment is critical for achieving maximal therapeutic benefit, as evidenced by the increased rate of survival, motor milestone achievement, and other outcomes such as improved respiratory function [22, 26] seen in clinical trials. Interim results from the phase 2 NURTURE study of 25 infants genetically diagnosed with SMA (most likely to develop SMA type I or type II), who were treated with nusinersen presymptomatically, showed that 73% were able to walk independently within the expected window for age of achievement in healthy children (based on World Health Organization guidelines); this was contrary to natural history [22]. These results highlight the need to diagnose and initiate treatment with disease-modifying therapy as early as possible to ensure optimal outcomes that would otherwise not be observed in an SMA population [50, 51]. Yet this study showed a median diagnostic delay of 2 months for SMA type I to 37 months for SMA type III. Subsequent SMA surveys are likely to reveal the impact of newborn screening and early treatment on survival and motor function on infantile-onset SMA, as shown in clinical trials and retrospective studies [22, 26, 52, 53].
At the time of the 2018 survey, a little more than half of the individuals with SMA type I had head control, and less than half of those with SMA type II or type III were sitting unsupported or walking independently, respectively. These results highlight the level of physical disability in individuals with SMA and are generally consistent with the expected natural history of infantile- and later-onset SMA, except that infants with SMA type I generally do not achieve full head control [11, 38, 54–56]. Furthermore, they suggest that motor function in the individuals with SMA types II and III have been lost over time.
The 2017 survey did not include questions related to treatment with nusinersen, as this treatment had just been approved in December 2016. In the 2018 survey, over 90% of living individuals with infantile-onset SMA and approximately half of those with later-onset disease that were living at the time of the survey reported having received nusinersen. Only one question on use was collected, limiting the ability to understand the relationship between treatment and disease characteristics and burden. Subsequent surveys have expanded the information collected on both nusinersen and other therapies to better understand these important relationships across a range of patients. Moreover, repeated surveys of individuals with SMA over time are critical to promote a better understanding of the evolution of phenotypes of SMA [57] in the era of effective SMA treatments. It is likely that the study population examined here reflects a prevalence population. As survival improves in the infantile-onset population with the increasing availability of disease-modifying treatments for SMA, studies of survival cohorts can provide valuable insights.
Information presented here also supports the reliability and validity of self- and caregiver-reported clinical data. Self- and caregiver-reported SMN2 gene copy number by SMA subtype in this study closely matched the proportions described in a previous analysis using clinically based data in a Spanish cohort [58]. Overall, missing data were not common. An exception to this is SMN2 gene copy number, which was missing or not known for more than 40% of individuals in the 2018 survey regardless of SMA type. The most likely explanation is that the test was not performed rather than respondents not completing the question. There was some increase between 2017 and 2018 in the reporting of SMN2 gene copy number for SMA types II and III. Testing of SMN2 gene copy number is important to understanding the potential trajectory of disease. This will become increasingly important in the era of treatments for SMA to characterize the evolving phenotypes as individuals achieve unexpected motor function based on SMA natural history. High concordance/correlations were also observed across the 2017 and 2018 surveys for factors that should not change within individuals over time. Together, this suggests that individuals with SMA and caregivers may be accurate and consistent reporters on key disease characteristics.
The data presented here are not without limitations. All data were self-reported by either caregivers or adult patients and are subject to error in recall, inaccurate reporting, and/or incomplete reporting. Additionally, response bias is likely as respondents represent an engaged, proactive subsample of the SMA community. For example, the average age of death for an individual with type I was 27.8 months, more than twice the average age (10.4 months) of those represented in the full Cure SMA database [42].
These findings highlight an opportunity to implement tools to reduce diagnostic delays (e.g., newborn screening) and the initiation of earlier treatment to improve patient care and long-term outcomes. The types of reported surgeries and hospitalizations show the range of health complications that individuals with SMA experience. Data collected in these membership surveys will be important to enhance the patient voice in relation to treatment experiences from infants to adult patients and across SMA types. These surveys help to advance the understanding of SMA, support advocacy efforts, and assist in healthcare services planning.
CONFLICTS OF INTEREST
Lisa Belter, Jill Jarecki, Colleen McCarthy, Shannon O’Brien, and Mary Schroth are employees of Cure SMA and have no personal financial interest in any SMA drug program; Rosangel Cruz was an employee of Cure SMA at the time of the survey and the development of the manuscript. Cure SMA has received support from Astellas Pharma US, Inc, AveXis, Inc, Biogen, Cytokinetics, Inc, Genentech/Roche Pharmaceuticals, Novartis Pharmaceuticals, and Scholar Rock for collaborative activities, including specific funding from Biogen for the 2017 and 2018 Cure SMA Community surveys. Sandra P. Reyna was an employee of Biogen at the time the survey was conducted, and is currently an employee of Novartis/Avexis. Cynthia C. Jones, Susan A. Hall, Nicole B. Johnson, and Angela D. Paradis are employees of Biogen and hold stock/stock options in Biogen.
ACKNOWLEDGMENTS
The authors thank Mehul Jhaveri for his contributions to the development of the survey and earlier versions of analyses. Thank you to all the families and individuals in the Cure SMA community who participated in this study and provided invaluable information. The 2017 and 2018 Cure SMA surveys were funded by Biogen (Cambridge, MA, USA). Biogen provided funding for medical writing support in the development of this paper; Bess Reinoso, PhD, Excel Scientific Solutions, provided writing assistance in the development of the first and subsequent drafts based on input from the authors, and Sheryl Weinerman copyedited and styled the manuscript per journal requirements. Biogen reviewed and provided feedback on the paper to the authors. The authors had full editorial control of the paper and provided their final approval of all content.
SUPPLEMENTARY MATERIAL
[1] The supplementary material is available in the electronic version of this article: https://dx.doi.org/10.3233/JND-200563.
REFERENCES
[1] | Lefebvre S , Bürglen L , Reboullet S , Clermont O , Burlet P , Viollet L , et al. Identification and characterization of a spinal muscular atrophy-determining gene. Cell. (1995) ;80: (1):155–65. doi: 10.1016/0092-8674(95)90460-3 |
[2] | Farrar MA , Kiernan MC . The genetics of spinal muscular atrophy: Progress and challenges. Neurotherapeutics. (2015) ;12: (2):290–302. doi: 10.1007/s13311-014-0314-x |
[3] | Tassie B , Isaacs D , Kilham H , Kerridge I . Management of children with spinal muscular atrophy type 1 in Australia. J Paediatr Child Health. (2013) ;49: (10):815–9. doi: 10.1111/jpc.12291 |
[4] | Prior TW , Snyder PJ , Rink BD , Pearl DK , Pyatt RE , Mihal DC , et al. Newborn and carrier screening for spinal muscular atrophy. Am J Med Genet A. (2010) ;152a: (7):1608–16. doi: 10.1002/ajmg.a.33474 |
[5] | Sugarman EA , Nagan N , Zhu H , Akmaev VR , Zhou Z , Rohlfs EM , et al. Pan-ethnic carrier screening and prenatal diagnosis for spinal muscular atrophy: Clinical laboratory analysis of>72,400 specimens. Eur J Hum Genet. (2012) ;20: (1):27–32. doi: 10.1038/ejhg.2011.134 |
[6] | Arkblad E , Tulinius M , Kroksmark AK , Henricsson M , Darin N . A population-based study of genotypic and phenotypic variability in children with spinal muscular atrophy. Acta Paediatr. (2009) ;98: (5):865–72. doi: 10.1111/j.1651-2227.2008.01201.x |
[7] | Jedrzejowska M , Milewski M , Zimowski J , Zagozdzon P , Kostera-Pruszczyk A , Borkowska J , et al. Incidence of spinal muscular atrophy in Poland–more frequent than predicted? Neuroepidemiology. (2010) ;34: (3):152–7. doi: 10.1159/000275492 |
[8] | Ogino S , Wilson RB , Gold B . New insights on the evolution of the SMN1 and SMN2 region: Simulation and meta-analysis for allele and haplotype frequency calculations. Eur J Hum Genet. (2004) ;12: (12):1015–23. doi: 10.1038/sj.ejhg.5201288 |
[9] | Lunn MR , Wang CH . Spinal muscular atrophy. Lancet. (2008) ;371: (9630):2120–33. doi: 10.1016/s0140-6736(08)60921-6 |
[10] | Darras B , Markowitz J , Monani U , De Vivo D . Spinal muscular atrophies. In: Jones JHR, De Vivo D, Darras B, editors. Neuromuscular disorders of infancy, childhood, and adolescence. 2nd ed. San Diego, CA: Academic Press; 2015. pp. 117-45. |
[11] | Finkel R , Bertini E , Muntoni F , Mercuri E , ENMC SMA Workshop Study Group. 209th ENMC International Workshop: Outcome Measures and Clinical Trial Readiness in Spinal Muscular Atrophy, 7-9 November 2014, Heemskerk, The Netherlands. Neuromuscul Disord. (2015) ;25: (7):593–602. doi: 10.1016/j.nmd.2015.04.009 |
[12] | Monani UR , Lorson CL , Parsons DW , Prior TW , Androphy EJ , Burghes AH , et al. A single nucleotide difference that alters splicing patterns distinguishes the SMA gene SMN1 from the copy gene SMN2 . Hum Mol Genet. (1999) ;8: (7):1177–83. doi: 10.1093/hmg/8.7.1177 |
[13] | Grotto S , Cuisset JM , Marret S , Drunat S , Faure P , Audebert-Bellanger S , et al. Type 0 spinal muscular atrophy: Further delineation of prenatal and postnatal features in 16 patients. J Neuromuscul Dis. (2016) ;3: (4):487–95. doi: 10.3233/jnd-160177 |
[14] | Finkel RS , Sejersen T , Mercuri E , ENMC SMA Workshop Study Group. 218th ENMC International Workshop: Revisiting the consensus on standards of care in SMA Naarden, The Netherlands, 19-21 February 2016. Neuromuscul Disord. (2017) ;27: (6):596–605. doi: 10.1016/j.nmd.2017.02.014 |
[15] | Verhaart IEC , Robertson A , Wilson IJ , Aartsma-Rus A , Cameron S , Jones CC , et al. Prevalence, incidence and carrier frequency of 5q-linked spinal muscular atrophy - a literature review. Orphanet J Rare Dis. (2017) ;12: (1):124. doi: 10.1186/s13023-017-0671-8 |
[16] | Wang CH , Finkel RS , Bertini ES , Schroth M , Simonds A , Wong B , et al. Consensus statement for standard of care in spinal muscular atrophy. J Child Neurol. (2007) ;22: (8):1027–49. doi: 10.1177/0883073807305788 |
[17] | Arnold WD , Kassar D , Kissel JT . Spinal muscular atrophy: Diagnosis and management in a new therapeutic era. Muscle Nerve. (2015) ;51: (2):157–67. doi: 10.1002/mus.24497 |
[18] | Kaufmann P , McDermott MP , Darras BT , Finkel R , Kang P , Oskoui M , et al. Observational study of spinal muscular atrophy type 2 and Functional outcomes over 1 year. Arch Neurol. (2011) ;68: (6):779–86. doi: 10.1001/arch-neurol.2010.373 |
[19] | Zerres K , Rudnik-Schöneborn S . Natural history in proximal spinal muscular atrophy. Clinical analysis of 445 patients and suggestions for a modification of existing classifications. Arch Neurol. (1995) ;52: (5):518–23. doi: 10.1001/archneur.1995.00540290108025 |
[20] | Zerres K , Rudnik-Schöneborn S , Forrest E , Lusakowska A , Borkowska J , Hausmanowa-Petrusewicz I . A collaborative study on the natural history of childhood and juvenile onset proximal spinal muscular atrophy (type II and III SMA): 569 patients. J Neurol Sci. (1997) ;146: (1):67–72. doi: 10.1016/s0022-510x(96)00284-5 |
[21] | Ogino S , Leonard DG , Rennert H , Ewens WJ , Wilson RB . Genetic risk assessment in carrier testing for spinal muscular atrophy. Am J Med Genet. (2002) ;110: (4):301–7. doi: 10.1002/ajmg.10425 |
[22] | De Vivo DC , Bertini E , Swoboda KJ , Hwu WL , Crawford TO , Finkel RS , et al. Nusinersen initiated in infants during the presymptomatic stage of spinal muscular atrophy: Interim efficacy and safety results from the phase 2 NURTURE study. Neuromuscul Disord. (2019) ;29: (11):842–56. doi: 10.1016/j.nmd.2019.09.007 |
[23] | Darras BT , Chiriboga CA , Iannaccone ST , Swoboda KJ , Montes J , Mignon L , et al. Nusinersen in later-onset spinal muscular atrophy: Long-term results from the phase 1/2 studies. Neurology. (2019) ;92: (21):e2492–e506. doi: 10.1212/wnl.0000000000007527 |
[24] | Mercuri E , Lucibello S , Pera MC , Carnicella S , Coratti G , de Sanctis R , et al. Long-term progression in type II spinal muscular atrophy: A retrospective observational study. Neurology. (2019) ;93: (13):e1241–e7. doi: 10.1212/wnl.0000000000008166 |
[25] | Stevens D , Claborn MK , Gildon BL , Kessler TL , Walker C . Onasemnogene abeparvovec-xioi: Gene therapy for spinal muscular atrophy. Ann Pharmacother. (2020) ;54: (10):1001–09. doi: 10.1177/1060028020914274 |
[26] | Finkel RS , Mercuri E , Darras BT , Connolly AM , Kuntz NL , Kirschner J , et al. Nusinersen versus sham control in infantile-onset spinal muscular atrophy. N Engl J Med. (2017) ;377: (18):1723–32. doi: 10.1056/NEJMoa1702752 |
[27] | Prior TW , Leach ME , Finanger E . Spinal muscular atrophy. 2000. In: Adam MP, Ardinger HH, Pagon RA, et al., editors. GeneReviews(R) [Internet]. Seattle (WA): University of Washington, Seattle; 1993-2020. Available from: https://www.ncbi.nlm.nih.gov/books/NBK1352/. |
[28] | Hoy SM . Nusinersen: First global approval. Drugs. (2017) ;77: (4):473–9. doi: 10.1007/s40265-017-0711-7 |
[29] | Hoy SM . Onasemnogene abeparvovec: First global approval. Drugs. (2019) ;79: (11):1255–62. doi: 10.1007/s40265-019-01162-5 |
[30] | U.S. Food and Drug Administration. FDA Approves Oral Treatment for Spinal Muscular Atrophy [press release]. August 7, 2020.Available from: https://www.fda.gov/news-events/press-announcements/fda-approves-oral-treatment-spinal-muscular-atrophy |
[31] | Ramdas S , Servais L . New treatments in spinal muscular atrophy: An overview of currently available data. Expert Opin Pharmacother. (2020) ;21: (3):307–15. doi: 10.1080/14656566.2019.1704732 |
[32] | Wadman RI , van der Pol WL , Bosboom WM , Asselman FL , van den Berg LH , Iannaccone ST , et al. Drug treatment for spinal muscular atrophy types II and III. Cochrane Database Syst Rev. (2020) ;1: :Cd006282. doi: 10.1002/14651858.CD006282.pub5 |
[33] | Sturm S , Gunther A , Jaber B , Jordan P , Al Kotbi N , Parkar N , et al. A phase 1 healthy male volunteer single escalating dose study of the pharmacokinetics and pharmacodynamics of risdiplam (RGRO067), a SMN2 splicing modifier. Br J Clin Pharmacol. (2019) ;85: (1):181–93. doi: 10.1111/bcp.13786 |
[34] | McGraw S , Qian Y , Henne J , Jarecki J , Hobby K , Yeh WS . A qualitative study of perceptions of meaningful change in spinal muscular atrophy. BMC Neurol. (2017) ;17: (1):68. doi: 10.1186/s12883-017-0853-y |
[35] | Heatwole C , Hunter M , Johnson N , editors. Patient-identified disease burden in adult spinal muscular atrophy. SMA 19th Annual Researcher Meeting; 2015, June 18-21; Kansas City, MO: Cure SMA. |
[36] | Lamb C , Peden A . Understanding the experience of living with spinal muscular atrophy: A qualitative description. J Neurosci Nurs. (2008) ;40: (4):250–6. doi: 10.1097/01376517-200808000-00009 |
[37] | Dunaway S , Montes J , Kramer S , Podwika B , Rao A , De Vivo D . Perceived fatigue and physiological fatigue in spinal muscular atrophy (SMA): Are they related? Neurology. (2014) ;82: (10 Suppl):P7.117. |
[38] | Kaufmann P , McDermott MP , Darras BT , Finkel RS , Sproule DM , Kang PB , et al. Prospective cohort study of spinal muscular atrophy types 2 and 3. Neurology. (2012) ;79: (18):1889–97. doi: 10.1212/WNL.0b013e318271f7e4 |
[39] | Qian Y , McGraw S , Henne J , Jarecki J , Hobby K , Yeh WS . Understanding the experiences and needs of individuals with spinal muscular atrophy and their parents: A qualitative study. BMC Neurol. (2015) ;15: :217. doi: 10.1186/s12883-015-0473-3 |
[40] | Rao VK , Kapp D , Schroth M . Gene therapy for spinal muscular atrophy: An emerging treatment option for a devastating disease. J Manag Care Spec Pharm. (2018) ;24: (12-a Suppl):S3–s16. doi: 10.18553/jmcp.2018.24.12-a.s3 |
[41] | Dangouloff T , Burghes A , Tizzano EF , Servais L , NBS SMA Study Group. 244th ENMC International Workshop: Newborn screening in spinal muscular atrophy, May 10-12, 2019, Hoofdorp, The Netherlands. Neuromuscul Disord. (2020) ;30: (1):93–103. doi: 10.1016/j.nmd.2019.11.002 |
[42] | Belter L , Cook SF , Crawford TO , Jarecki J , Jones CC , Kissel JT , et al. An overview of the Cure SMA membership database: Highlights of key demographic and clinical characteristics of SMA members. J Neuromuscul Dis. (2018) ;5: (2):167–76. doi: 10.3233/jnd-170292 |
[43] | Centers for Disease Control and Prevention. WIC developmental milestone checklists [updated 2009]: cdc.gov; 1991. Available from: https://www.cdc.gov/ncbddd/actearly/pdf/checklists/CDC LTSAE-Checklists WIC-Version FINAL-2019-508.pdf. |
[44] | U.S. Food and Drug Administration. FDA approves first drug for spinal muscular atrophy [press release]. December 23, 2016. Available from: https://www.fda.gov/news-events/press-announcements/fda-approves-first-drug-spinal-muscular-atrophy#:~:text=The%20U.S.%20Food%20and%20Drug,affecting%20muscle%20strength%20and%20movement |
[45] | Jones CC , Cook SF , Jarecki J , Belter L , Reyna SP , Staropoli J , et al. Spinal muscular atrophy (SMA) subtype concordance in siblings: Findings from the Cure SMA cohort. J Neuromuscul Dis. (2020) ;7: (1):33–40. doi: 10.3233/jnd-190399 |
[46] | Cruz R , Belter L , Wasnock M , Nazarelli A , Jarecki J . Evaluating benefit-risk decision-making in spinal muscular atrophy: A first-ever study to assess risk tolerance in the SMA patient community. Clin Ther. (2019) ;41: (5):943–60.e4. doi: 10.1016/j.clinthera.2019.03.012 |
[47] | Oskoui M , Levy G , Garland CJ , Gray JM , O’Hagen J , De Vivo DC , et al. The changing natural history of spinal muscular atrophy type 1. Neurology. (2007) ;69: (20):1931–6. doi: 10.1212/01.wnl.0000290830.40544.b9 |
[48] | Gregoretti C , Ottonello G , Chiarini Testa MB , Mastella C , Rava L , Bignamini E , et al. Survival of patients with spinal muscular atrophy type 1. Pediatrics. (2013) ;131: (5):e1509–14. doi: 10.1542/peds.2012-2278 |
[49] | Sproule DM , Hasnain R , Koenigsberger D , Montgomery M , De Vivo DC , Kaufmann P . Age at disease onset predicts likelihood and rapidity of growth failure among infants and young children with spinal muscular atrophy types 1 and 2. J Child Neurol. (2012) ;27: (7):845–51. doi: 10.1177/0883073811415680 |
[50] | Glascock J , Sampson J , Haidet-Phillips A , Connolly A , Darras B , Day J , et al. Treatment algorithm for infants diagnosed with spinal muscular atrophy through newborn screening. J Neuromuscul Dis. (2018) ;5: (2):145–58. doi: 10.3233/jnd-180304 |
[51] | Tizzano EF , Zafeiriou D . Prenatal aspects in spinal muscular atrophy: From early detection to early presymptomatic intervention. Eur J Paediatr Neurol. (2018) ;22: (6):944–50. doi: 10.1016/j.ejpn.2018.08.009 |
[52] | Mendell JR , Al-Zaidy S , Shell R , Arnold WD , Rodino-Klapac LR , Prior TW , et al. Single-dose gene-replacement therapy for spinal muscular atrophy. N Engl J Med. (2017) ;377: (18):1713–22. doi: 10.1056/NEJMoa1706198 |
[53] | Lin CW , Kalb SJ , Yeh WS . Delay in diagnosis of spinal muscular atrophy: A systematic literature review. Pediatr Neurol. (2015) ;53: (4):293–300. doi: 10.1016/j.pediatrneurol.2015.06.002 |
[54] | Mercuri E , Finkel R , Montes J , Mazzone ES , Sormani MP , Main M , et al. Patterns of disease progression in type 2 and 3 SMA: Implications for clinical trials. Neuromuscul Disord. (2016) ;26: (2):126–31. doi: 10.1016/j.nmd.2015.10.006 |
[55] | Kolb SJ , Coffey CS , Yankey JW , Krosschell K , Arnold WD , Rutkove SB , et al. Natural history of infantile-onset spinal muscular atrophy. Ann Neurol. (2017) ;82: (6):883–91. doi: 10.1002/ana.25101 |
[56] | De Sanctis R , Coratti G , Pasternak A , Montes J , Pane M , Mazzone ES , et al. Developmental milestones in type I spinal muscular atrophy. Neuromuscul Disord. . (2016) ;26: (11):754–9. doi: 10.1016/j.nmd.2016.10.002 |
[57] | Wirth B , Karakaya M , Kye MJ , Mendoza-Ferreira N . Twenty-five years of spinal muscular atrophy research: From phenotype to genotype to therapy, and what comes next. Annu Rev Genomics Hum Genet. (2020) ;21: :231–61. doi: 10.1146/annurev-genom-102319-103602 |
[58] | Calucho M , Bernal S , Alias L , March F , Vencesla A , Rodriguez-Alvarez FJ , et al. Correlation between SMA type and SMN2 copy number revisited: An analysis of 625 unrelated Spanish patients and a compilation of reported cases. Neuromuscul Disord. (2018) ;28: (3):208–15. doi: 10.1016/j.nmd.2018.01.003 |

