
Correlation Between Quantitative MRI and Muscle Histopathology in Muscle Biopsies from Healthy Controls and Patients with IBM, FSHD and OPMD
Abstract
Background:
Muscle MRI is increasingly used as a diagnostic and research tool in muscle disorders. However, the correlation between MRI abnormalities and histopathological severity is largely unknown.
Objective:
To investigate correlations between muscle MRI abnormalities and histopathological severity in healthy controls and patients with muscle disease.
Methods:
We performed quantitative MRI and histopathological analysis in 35 patients with inclusion body myositis, facioscapulohumeral muscular dystrophy or oculopharyngeal muscular dystrophy and 12 healthy controls. Participants contributed needle biopsies of the vastus lateralis and/or tibialis anterior, yielding 77 muscle biopsies with matched T1, T2 and TIRM MRI imaging. Muscle biopsies were evaluated with a semi-quantitative histopathology severity grading scale (range 0–12) and an inflammation severity grading scale (range 0–3).
Results:
In muscle disease, histopathology sum scores ranged from 0 to 11 and correlated significantly with fat percentage as measured on MRI (Spearman’s rho = 0.594, p < 0.001). Muscle edema on muscle MRI was associated with increased amounts of inflammation (p < 0.001). Mild abnormalities occured in 95% of control biopsies and were more pronounced in tibialis anterior (median sum score of 1±1 in vastus lateralis and 2±1 in tibialis anterior (p = 0.048)).
Conclusion:
In muscle disease, fatty infiltration on MRI correlates moderately with muscle histopathology. Histopathological abnormalities can occur prior to the onset of fatty infiltration. In middle-aged controls, almost all biopsies showed some histopathological abnormalities. The findings from this study may facilitate the choice for appropriate imaging sequences as outcome measures in therapeutic trials.
INTRODUCTION
Muscle MRI is an increasingly important tool in the diagnosis and research of muscle disorders. It is used to detect patterns of fatty infiltration that may aid in the diagnosis of specific muscle disorders and sometimes it can be considered as pathognomonic for a specific disease [1, 2]. The degree of fatty infiltration of a specific muscle or muscle groups has been shown to correlate with functional outcome measures in several muscle disorders such as Duchenne muscular dystrophy and facioscapulohumeral muscular dystrophy (FSHD), which has strengthened the position of quantitative muscle MRI as an outcome measure in clinical trials [3, 4]. Another application of muscle MRI is the detection of patterns of muscle involvement associated with specific muscle disease, for example in congenital myopathies, IBM and OPMD [5–7].
Increasing our understanding of the correlation between fatty infiltration on muscle MRI and histopathological changes may benefit the diagnosis of muscle disorders and the application of muscle MRI as an outcome measure in clinical trials. However, studies that investigate the correlation between muscle MRI and histopathological changes are limited. A previous study in Duchenne muscular dystrophy found a correlation between radiological changes and histopathological abnormalities in 15 muscle biopsies of the extensor digitorum brevis muscle, but used only qualitative assessment of fatty infiltration on MRI and a qualitative histopathological assessment [8].
Another application of muscle MRI is the assessment of hyperintense changes on MRI inversion recovery imaging (TIRM –Turbo Inversion Recovery Magnitude or STIR –Short TI Inversion Recovery) that represent muscle edema. In the context of muscle disease, TIRM or STIR hyperintense areas are often seen in inflammatory myopathies and reflects edema, as a consequence of muscle inflammation. Using TIRM or STIR imaging to select an appropriate muscle for muscle biopsy has been shown to increase sensitivity in the diagnosis of inflammatory myopathies [9, 10]. Apart from muscle inflammation, TIRM or STIR hyperintensities can also arise from other pathological changes in muscle such as denervation, regeneration, necrosis or high intensity physical exercise.
In this study, we investigate the correlation between MRI abnormalities –i.e. the amount of fatty infiltration measured by quantitative MRI or TIRM hyperintensity which reflects muscle edema –and histopathological changes measured using a semi-quantitative histopathology grading scale in 77 vastus lateralis and tibialis anterior muscle biopsies obtained from 35 patients with inclusion body myositis (IBM), FSHD or oculopharyngeal muscular dystrophy (OPMD) and 12 healthy controls.
MATERIALS AND METHODS
Participants
Healthy controls and patients with IBM (fulfilling the 2010 modified Griggs criteria) and genetically confirmed FSHD and OPMD were recruited for a separate study that included muscle MRI and muscle biopsies of the vastus lateralis and tibialis anterior [11, 12]. These disorders were selected because they are relatively common and allowed for inclusion of patients with either muscular dystrophy or inflammatory myopathy within the same age group. All control participants underwent the same examinations as participants with muscle disease, including assessment of medical history and medication, muscle strength testing, measurement of creatine kinase (CK), and muscle MRI to ensure that they had no neuromuscular disease. Exclusion criteria were: age < 18 or ≥65 years, diabetes mellitus, chronic obstructive pulmonary disease, chronic heart failure, current malignancy, previous treatment with chemotherapy and/or radiation therapy, use of corticosteroids during more than two weeks in the past 5 years, use of statins in the past 3 months, wheelchair bound, pregnancy, and contra-indications for MRI or muscle biopsy. Age matching was applied on the group level, resulting in an adjustment of the lower age limit to ∼40 years during patient recruitment. Muscle strength was graded using the MRC grading scale. The Medical Ethics Review Committee region Arnhem-Nijmegen approved this study (no. 2011/181). Informed consent was obtained from all individual participants included in the study.
Quantitative imaging
MRI protocol
Prior to MRI imaging, the prospective muscle biopsy site was marked on the skin with a fish-oil marker. Prospective biopsy sites were positioned on a line connecting the anterior superior iliac spine (ASIS) and patella; 2/3 from the ASIS and 1/3 from the patella for the upper leg, and on the maximum muscle bulk of the tibialis anterior for the lower leg. The right leg was biopsied except in the presence of asymmetrical weakness, in which case the weakest leg was biopsied.
Transversal T1 weighted, multi-echo T2 images and Turbo Inversion Recovery sequences (TIRM) of the upper and lower leg were acquired on a 3 Tesla MRI system (Tim TRIO, Siemens, Erlangen, Germany) using a spine array coil and two phased-array coils placed around the legs. Patients were placed in the scanner feet first supine. The table was positioned to have first the upper and subsequently the lower leg in the isocenter of the magnetic field for imaging of the upper and lower leg respectively. Scout images were acquired in three orthogonal directions for accurate positioning of the MRI slices, centered on the fish-oil marker to facilitate correlation between radiological findings and tissue-based studies. Eight transversal slices (FOV 175×175 mm2, thickness 4 mm, gap 6 mm, base resolution 256) were acquired with a T2 multi spin echo sequence (TR: 3000 ms, 16 equally spaced echo times 7.7–123.2 ms). Next 23 transversal slices (thickness 4 mm, gap 0.4 mm) were obtained with a T1 turbo spin echo sequence (FOV 250×244.5 mm2, TR/TE 600 ms/13 ms, base resolution 448), and with a Turbo Inversion Recovery sequence (TIRM) (FOV 175×175 mm2, TR/TE/TI 4100 ms/41 ms/220 ms, base resolution 256). The same imaging protocol was used for both the upper and lower leg.
MRI-guided FSHD vastus lateralis muscle biopsies were performed immediately after MRI scanning [13]. All other biopsies were performed on the same day, targeting the marked biopsy site.
MRI analysis
Multi-echo T2 images were analyzed using a custom-made data analysis program as described previously [14]. The amount of fatty infiltration of the vastus lateralis and tibialis anterior was quantified by manually tracing the outline of the individual muscle on the multi-echo T2 images corresponding to the level of the fish-oil marker. TIRM images were evaluated for the presence or absence of TIRM hyperintensities by the first author (SL).
Muscle biopsy collection
One Bergström needle biopsy of the vastus lateralis and one of the tibialis anterior were obtained from each participant by an experienced neurology resident (SL) taking routine antiseptic precautions [15]. An MRI-guided muscle biopsy of the vastus lateralis was performed in FSHD participants [13]. Biopsy specimens were snap-frozen in isopentane and stored at –80°C for histological analysis [16].
Histopathological analysis
Hematoxylin-phloxine (Hphlox) staining was used to evaluate variability in fiber size, extent of central nucleation, necrosis and/or regeneration, and interstitial fibrosis. Severity was graded semi-quantitatively as normal (0), mild (1), moderate (2) or severe (3) for each of these parameters and scores were added to provide a cumulative histopathological severity score ranging from 0 to 12 [17]. Inflammation on Hphlox was graded separately as normal (0), mild (1), moderate (2) or severe (3). A minor increase in internal nuclei <3% was considered normal and scored as 0. The presence of any necrosis and/or regeneration was considered abnormal and scored as ≥1 depending on the severity of abnormalities. Interstitial fibrosis in a localized part of the muscle biopsy was scored as 1, more extensive interstitial fibrosis was scored as ≥2 depending on the severity of abnormalities. The presence of any inflammation was considered abnormal and scored as ≥1 depending on the severity of abnormalities. All histopathology and inflammation severity scores were assigned by an experienced neuropathologist (BK) who was aware that the dataset included biopsies from healthy controls and patients with IBM, FSHD and OPMD, but was blinded to the exact diagnosis.
Statistics
Statistical analysis was performed with IBM SPSS Statistics 22. Continuous data were analyzed using paired t-test or one-way ANOVA with post-hoc comparisons using Bonferroni’s correction for multiple comparisons. Ordinal data were analyzed using Chi-square. Correlations were analyzed using the Spearman correlation coefficient. Data are reported as mean±SEM or median±IQR unless otherwise specified.
RESULTS
Participants and muscle biopsies
We included 12 healthy control subjects and 35 patients with acquired and hereditary muscle disorders (8 IBM, 13 FSHD, 14 OPMD) aged 39–65 years. Healthy controls and patients groups did not differ in age, sex distribution, or BMI. Detailed information about participants is provided in Table 1. From these participants, we obtained 77 muscle biopsies with matched T1, T2 and TIRM images (37 vastus lateralis, 40 tibialis anterior). Representative MRI and histopathology images are provided in Fig. 1 and supplemental figure 1. An overview of all muscle biopsies is provided in supplemental tables 1–4.
Table 1
Participants
| Control | IBM | FSHD | OPMD | P | |
| N | 12 | 8 | 13 | 14 | |
| Age (years) | 53.8±1.7 | 58.5±1.8 | 53.2±1.4 | 51.8±1.9 | 0.101 |
| Sex | 6M/6F | 7M/1F | 6M/7F | 6M/8F | 0.196 |
| BMI (cm/m2) | 27.3±1.5 | 26.6±0.6 | 25.3±1.1 | 25.7±1.1 | 0.693 |
| Disease duration (years) | N/A | 6.4±2.5 | 28.5 ± 3.5 *** | 10.2±2.5 | <0.001 |
| MRC score | |||||
| Quadriceps | 5.0±0.0 | 4.0 ± 0.9 ** | 5.0±0.8 | 5.0±0.0 | 0.003 |
| Tibialis anterior | 5.0±0.0 | 4.5 ± 0.8 ** | 4.5±3.0 | 5.0±0.0 | 0.005 |
| CK (U/L) | 136.3±24.6 | 772.3 ± 261.1 ** | 263.0±31.3 | 292.8±76.5 | 0.002 |
Data are reported as mean±SEM for continuous data, and median±IQR for ordinal data. Abbreviations: CK: creatine kinase. IBM: inclusion body myositis. FSHD: facioscapulohumeral muscular dystrophy. OPMD: oculopharyngeal muscular dystrophy. *p < 0.05, **p < 0.01, ***p < 0.001.
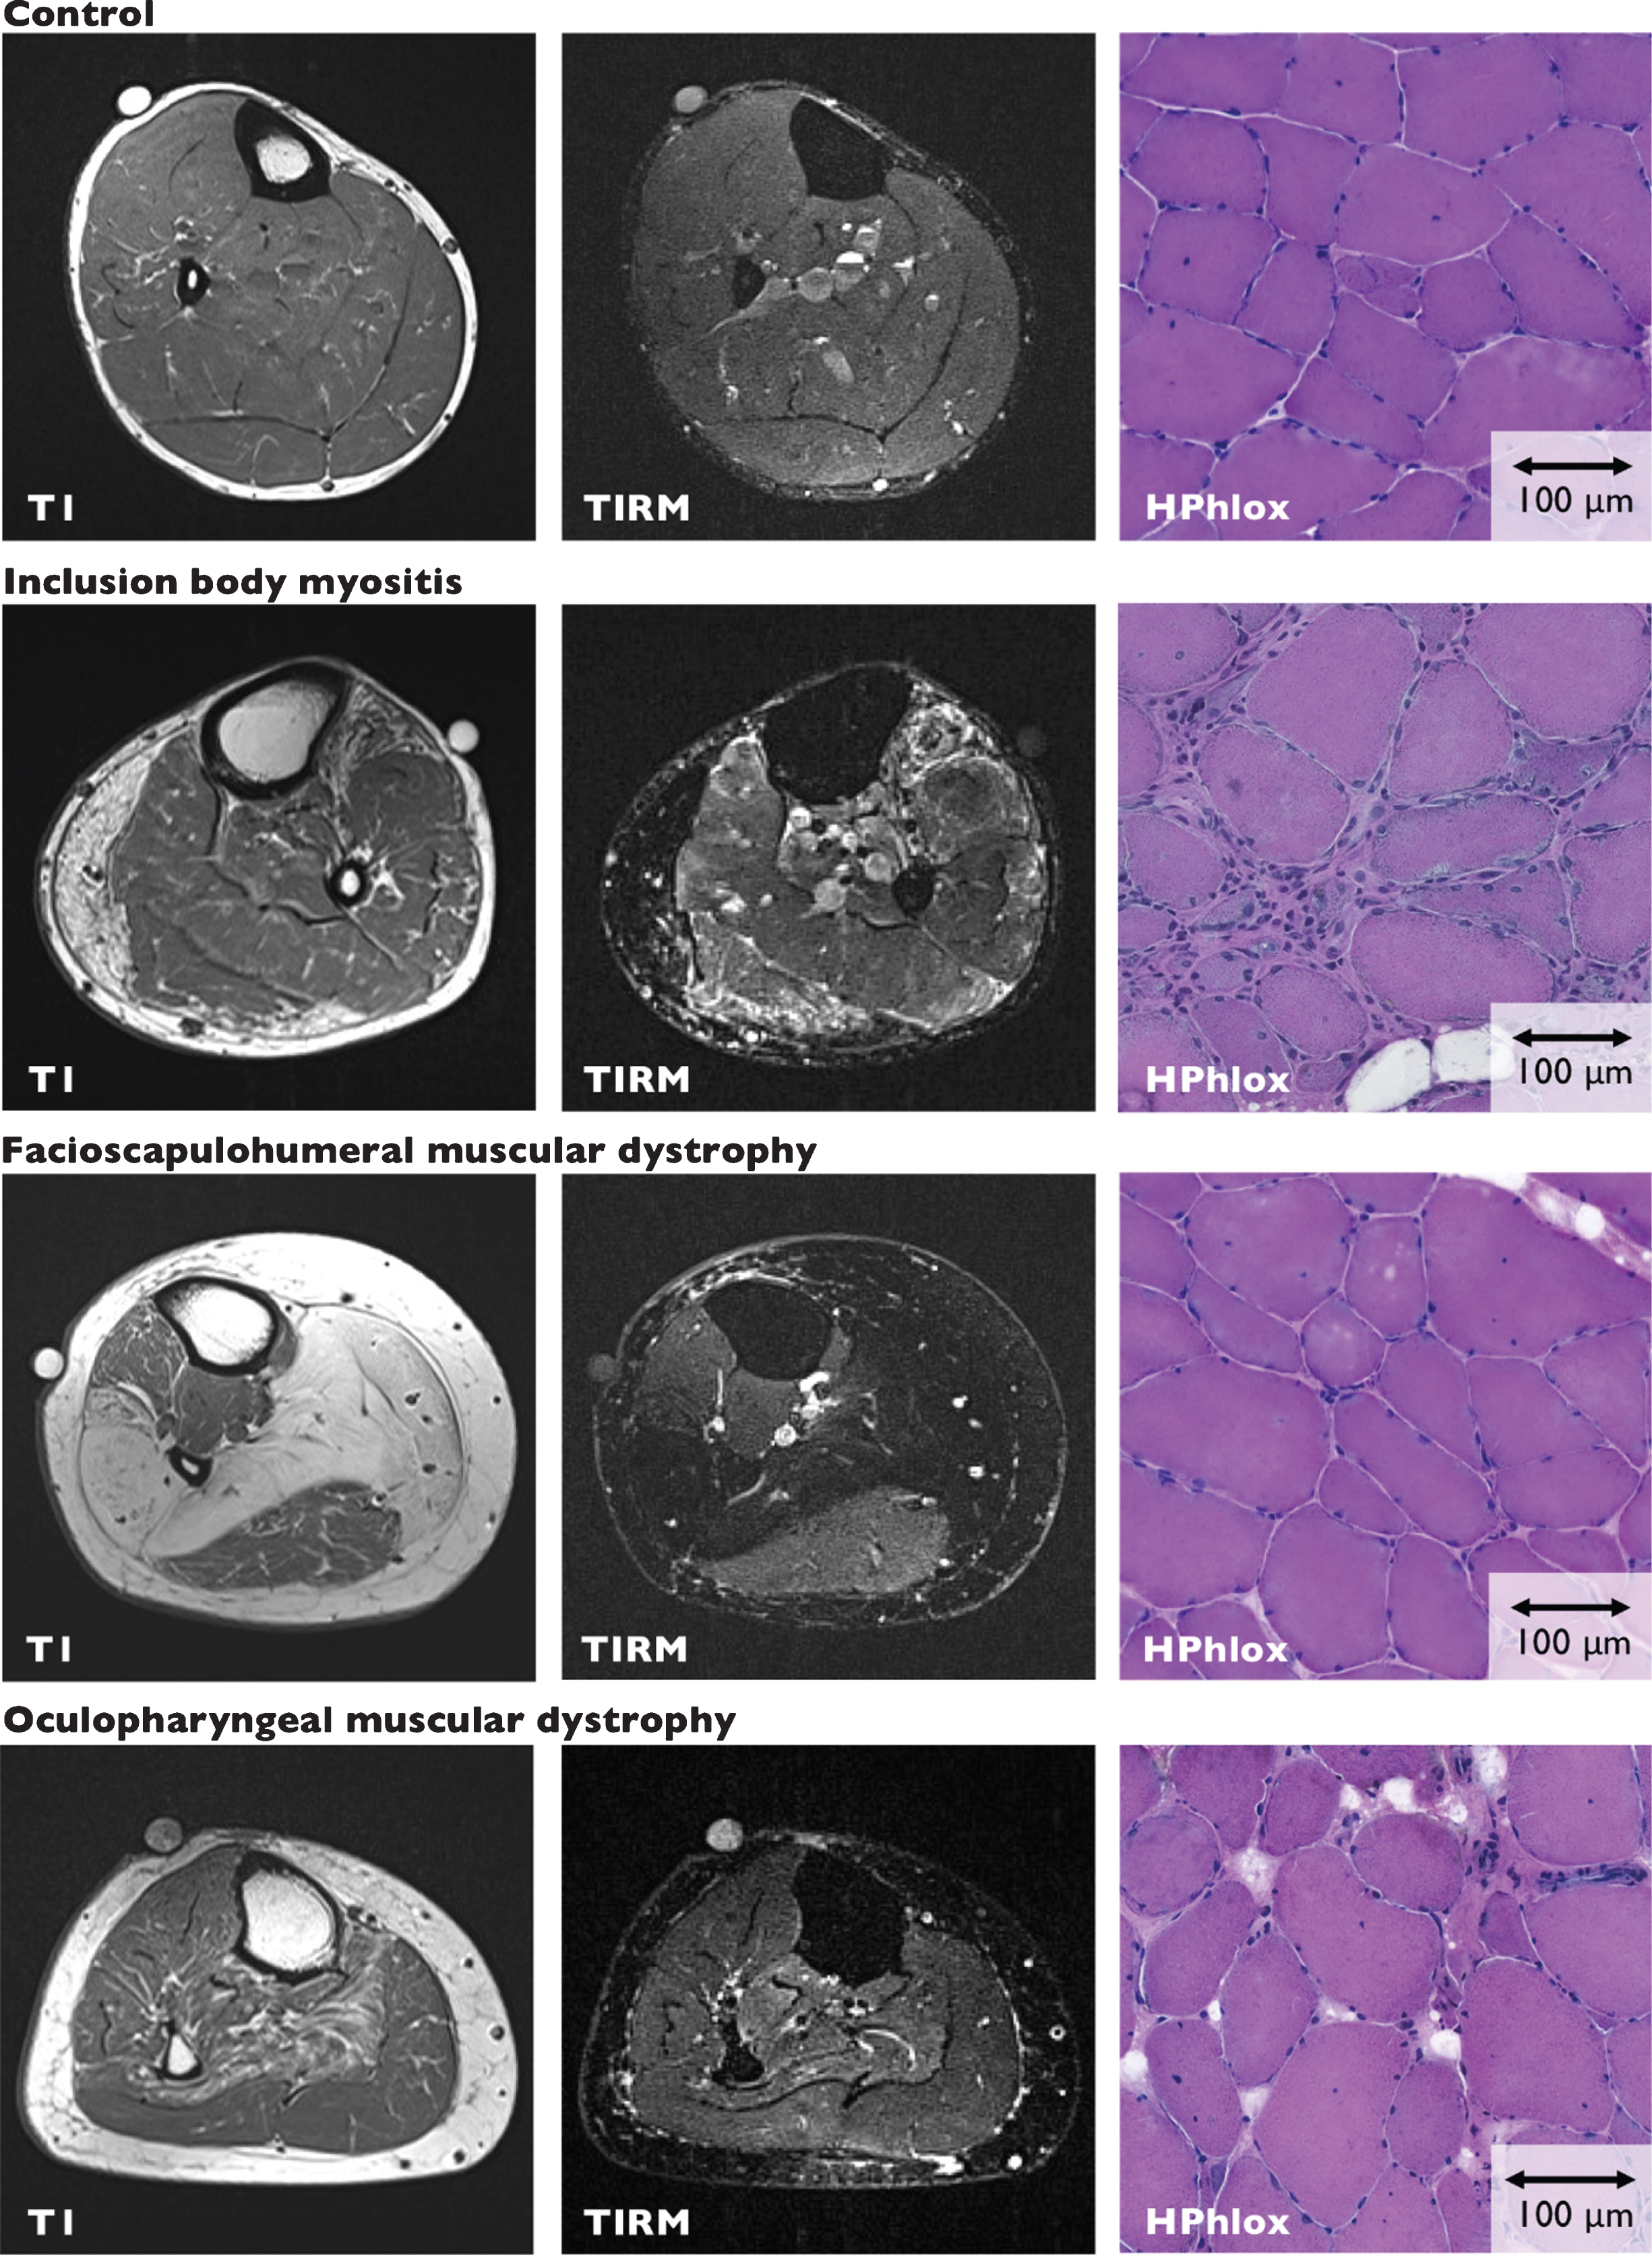
Fig. 1
MRI imaging and muscle biopsy sections. Representative T1 and TIRM images and corresponding muscle biopsy sections (HPhlox staining) from the tibialis anterior of control, IBM, FSHD and OPMD participants. Control Participant C3, MRI shows 3% fatty infiltration and negative TIRM. The muscle biopsy has a histopathological severity sum score of 3 and shows mildly increased variability in fiber size, a mild increase in internal nuclei, no necrosis and/or regeneration, and mild fibrosis. Inflammation was scored as none. IBM Participant I2, MRI shows fatty infiltration and TIRM-hyperintense changes. Quantitative assessment of fatty infiltration is not reliable in TIRM hyperintense muscles. The muscle biopsy has a histopathological severity sum score of 11 and shows severely increased variability in fiber size, a moderate increase in internal nuclei, severe necrosis and/or regeneration, and severe fibrosis. Inflammation was scored as severe. FSHD Participant F2, MRI shows 20% fatty infiltration and negative TIRM. The muscle biopsy has a histopathological severity sum score of 7 and shows moderately increased variability in fiber size, a moderate increase in internal nuclei, mild necrosis and/or regeneration, and moderate fibrosis. Inflammation was scored as none. OPMD Participant O14, MRI shows 3% fatty infiltration and negative TIRM. The muscle biopsy has a histopathological severity sum score of 5 and shows mild increased variability in fiber size, a moderate increase in internal nuclei, mild necrosis and/or regeneration, and mild fibrosis. Inflammation was scored as none.
Healthy controls
All controls underwent the same investigations as the participants with a muscle disorder. None of the controls had muscle complaints, there was no muscle weakness on neurological examination, none had hyperCKemia. Current smoking was present in 1/12 controls (8%) compared to 4/35 patients (11%). Previous history of lumbosacral radiculopathy was reported in 3/12 controls (25%) compared to 2/35 patients (6%).
Quantitative MRI
Mean muscle fat percentage was 5.2±1.2% in control subjects (range 0.5–25.9%). There was no significant difference between fat percentage of the vastus lateralis compared to the tibialis anterior (6.7±2.1 in vastus lateralis vs. 4.1±0.8 in tibialis anterior, p = 0.268). An increased fat percentage of 25.9% was observed in the vastus lateralis of one control participant; a 62-year-old obese woman with a BMI of 34. Fat percentage was ≤10% in all other investigated control muscles.
Histopathology
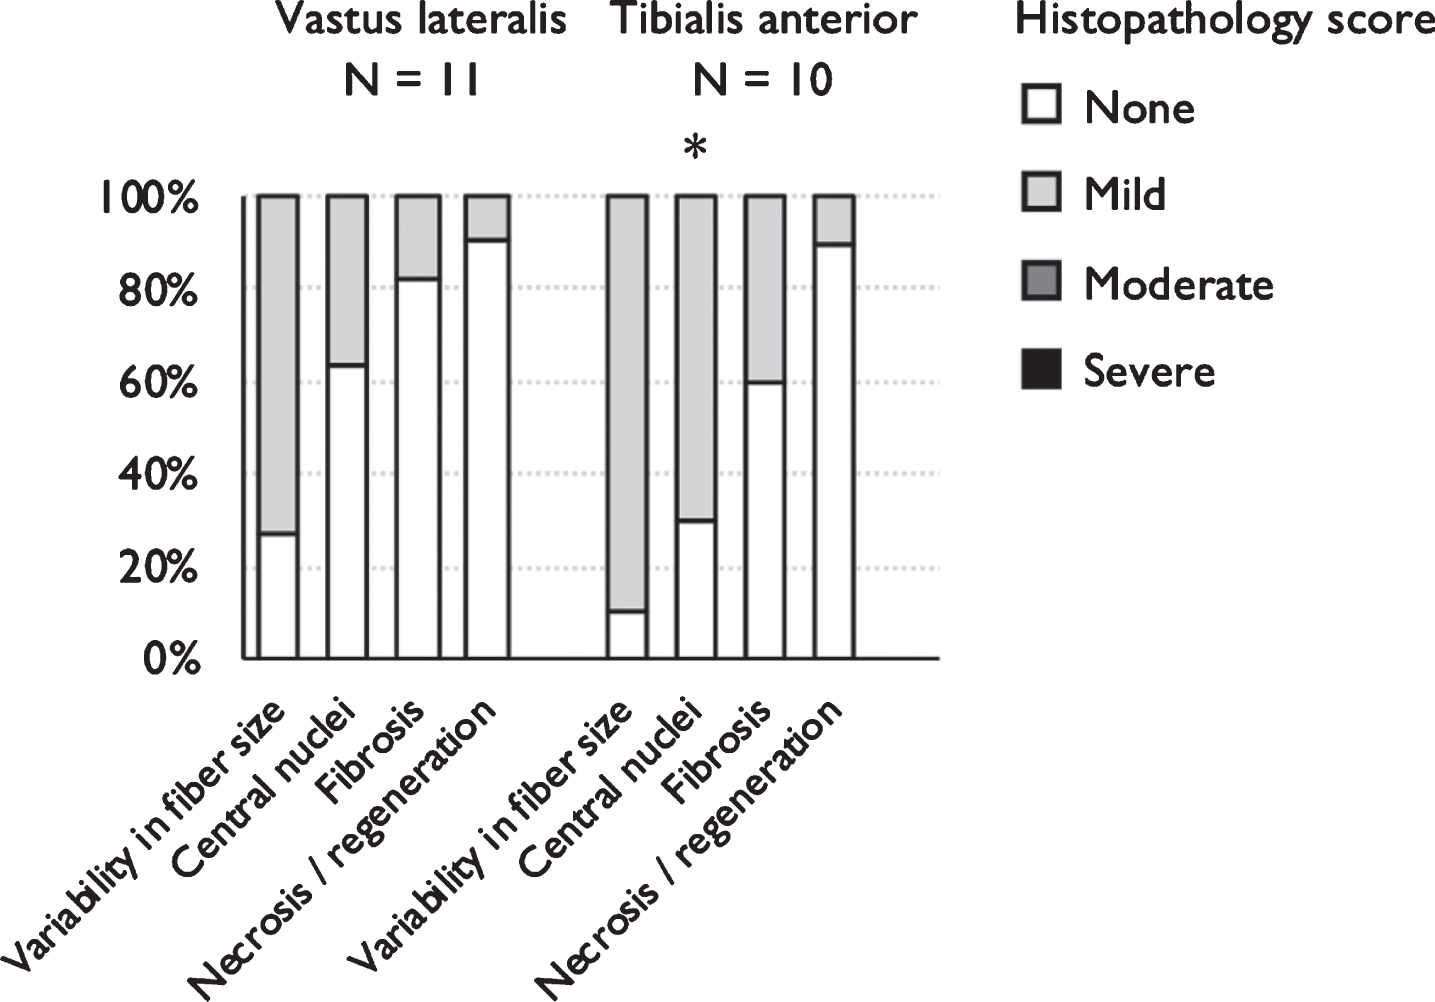
Median sum score in healthy control biopsies was 1±1 (range 0–3) in vastus lateralis and 2±1 (range 0–4) in tibialis anterior (p = 0.048). Most vastus lateralis muscle biopsies had a sum score of 1 (7/11, 64%), most tibialis anterior muscle biopsies had a sum score of 2 (5/11, 45%) or 3 (4/11, 36%). A sum score of 0, indicating no abnormalities, was obtained in only 1/22 (5%) control biopsies, both vastus lateralis. A sum score of 4 was measured in 1/22 (5%) control biopsies; a tibialis anterior biopsy that also showed fiber type grouping and nuclear clumps indicative of neurogenic changes. This participant had previously undergone surgery for a herniated lumbar disc L3–L4, but did not report L5 radiculopathy. Because the sum score of 4 in this biopsy could be attributed to neurogenic changes we excluded this biopsy from subsequent analyses.
Scores for the different elements of the histopathological evaluation where always either normal or mild. Distribution for separate histopathology subscales are shown in Fig. 2.
Fig. 2
Mild histopathological changes are common in healthy middle-aged controls. Distribution of the presence and severity of histopathology sub scores for healthy control vastus lateralis and tibialis anterior muscle biopsies. The amount of central nucleation was significantly increased in tibialis anterior compared to vastus lateralis control biopsies. *p = <0.05 **p = <0.01 / ***p < 0.001 compared to vastus lateralis.
Muscle disease
Quantitative MRI
Seven biopsies were performed in TIRM-hyperintense muscles (TIRMPOS, 6 IBM, 1 FSHD). TIRM-hyperintense changes affect T2 relaxation times, resulting in falsely increased values for muscle fat percentage. In TIRM-negative diseased muscles (TIRMNEG), mean muscle fat percentage was 17.2±3.3% (N = 48, range 1.6–91.7%). Mean muscle fat percentage was 18.1±4.8% (N = 24, range 1.1–97.4%) in vastus lateralis and 16.2±4.7% (N = 24, range 1.1–97.4%) in tibialis anterior.
Histopathology
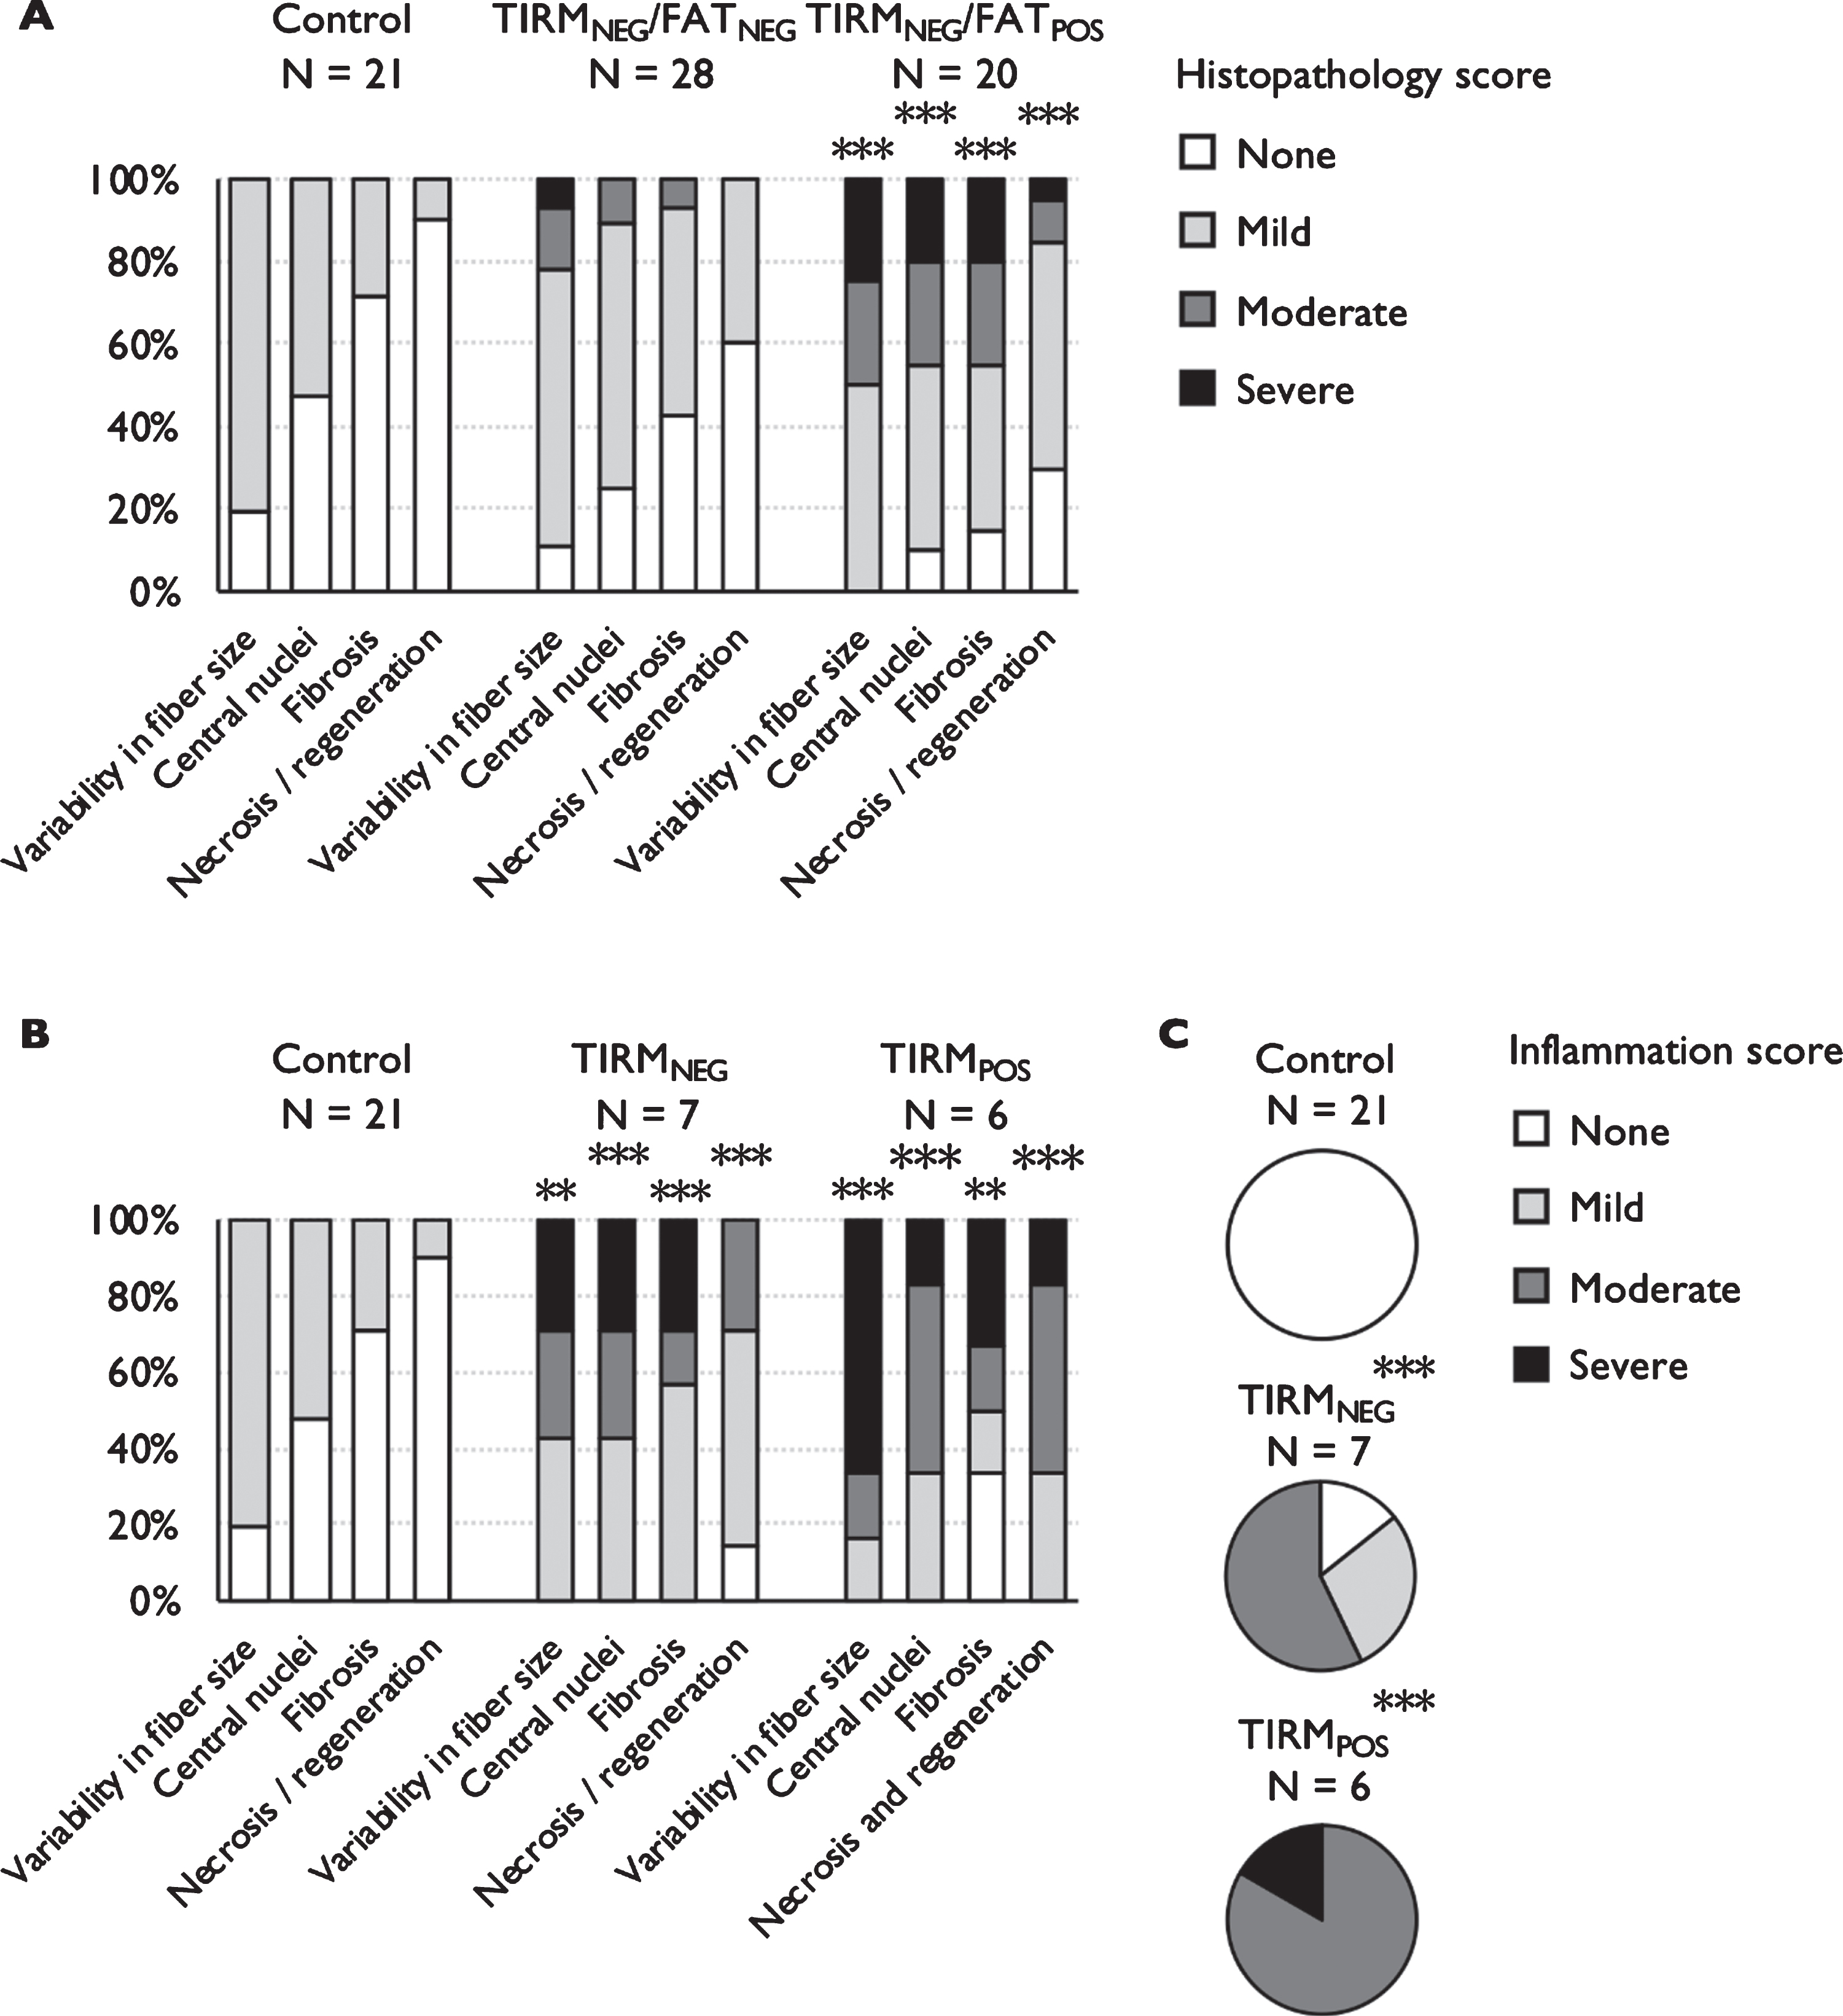
Histopathology sum scores in TIRMNEG muscle biopsies ranged from 0 to 11. There was a moderate correlation between muscle fat percentage and histopathology sum score (Spearman’s rho = 0.594, p < 0.001, Fig. 3A). We performed a separate analysis to investigate histopathological changes in biopsies obtained from muscles with normal fat percentages (FATNEG, cut-off defined as control mean±SD: 10.6% fatty infiltration). Median histopathology sumscore was 3±2 in FATNEG biopsies (p = 0.062 compared to controls) and 6±5 in FATPOS biopsies (p < 0.001 compared to control and FATNEG biopsies). Distribution for separate histopathology subscales are shown in Fig. 4A. Normal histopathology sum scores (cut-off defined as control mean±SD: ≤2 for vastus lateralis, ≤3 for tibialis anterior) were observed in 14/28 FATNEG muscle biopsies (50%, N = 5 FSHD, N = 9 OPMD biopsies).
Fig. 3
Correlation between fatty infiltration and histopathology sum score. 3A Histopathology sum score correlates moderately with fatty infiltration on MRI in TIRMNEG muscle biopsies from patients with IBM, FSHD and OPMD. Gray shading marks fatty infiltration ≤10.6% (control mean±SD) and histopathology sum scores ≤3 (control median±IQR). 3B Normal amounts of fatty infiltration (≤10.6%) can be associated with histopathology sum scores within the control range, but also with intermediate scores (range 0–7). Normal histopathology sum scores (≤2 for vastus lateralis, ≤3 for tibialis anterior) are encountered in muscles with up to 20.7% fatty infiltration.
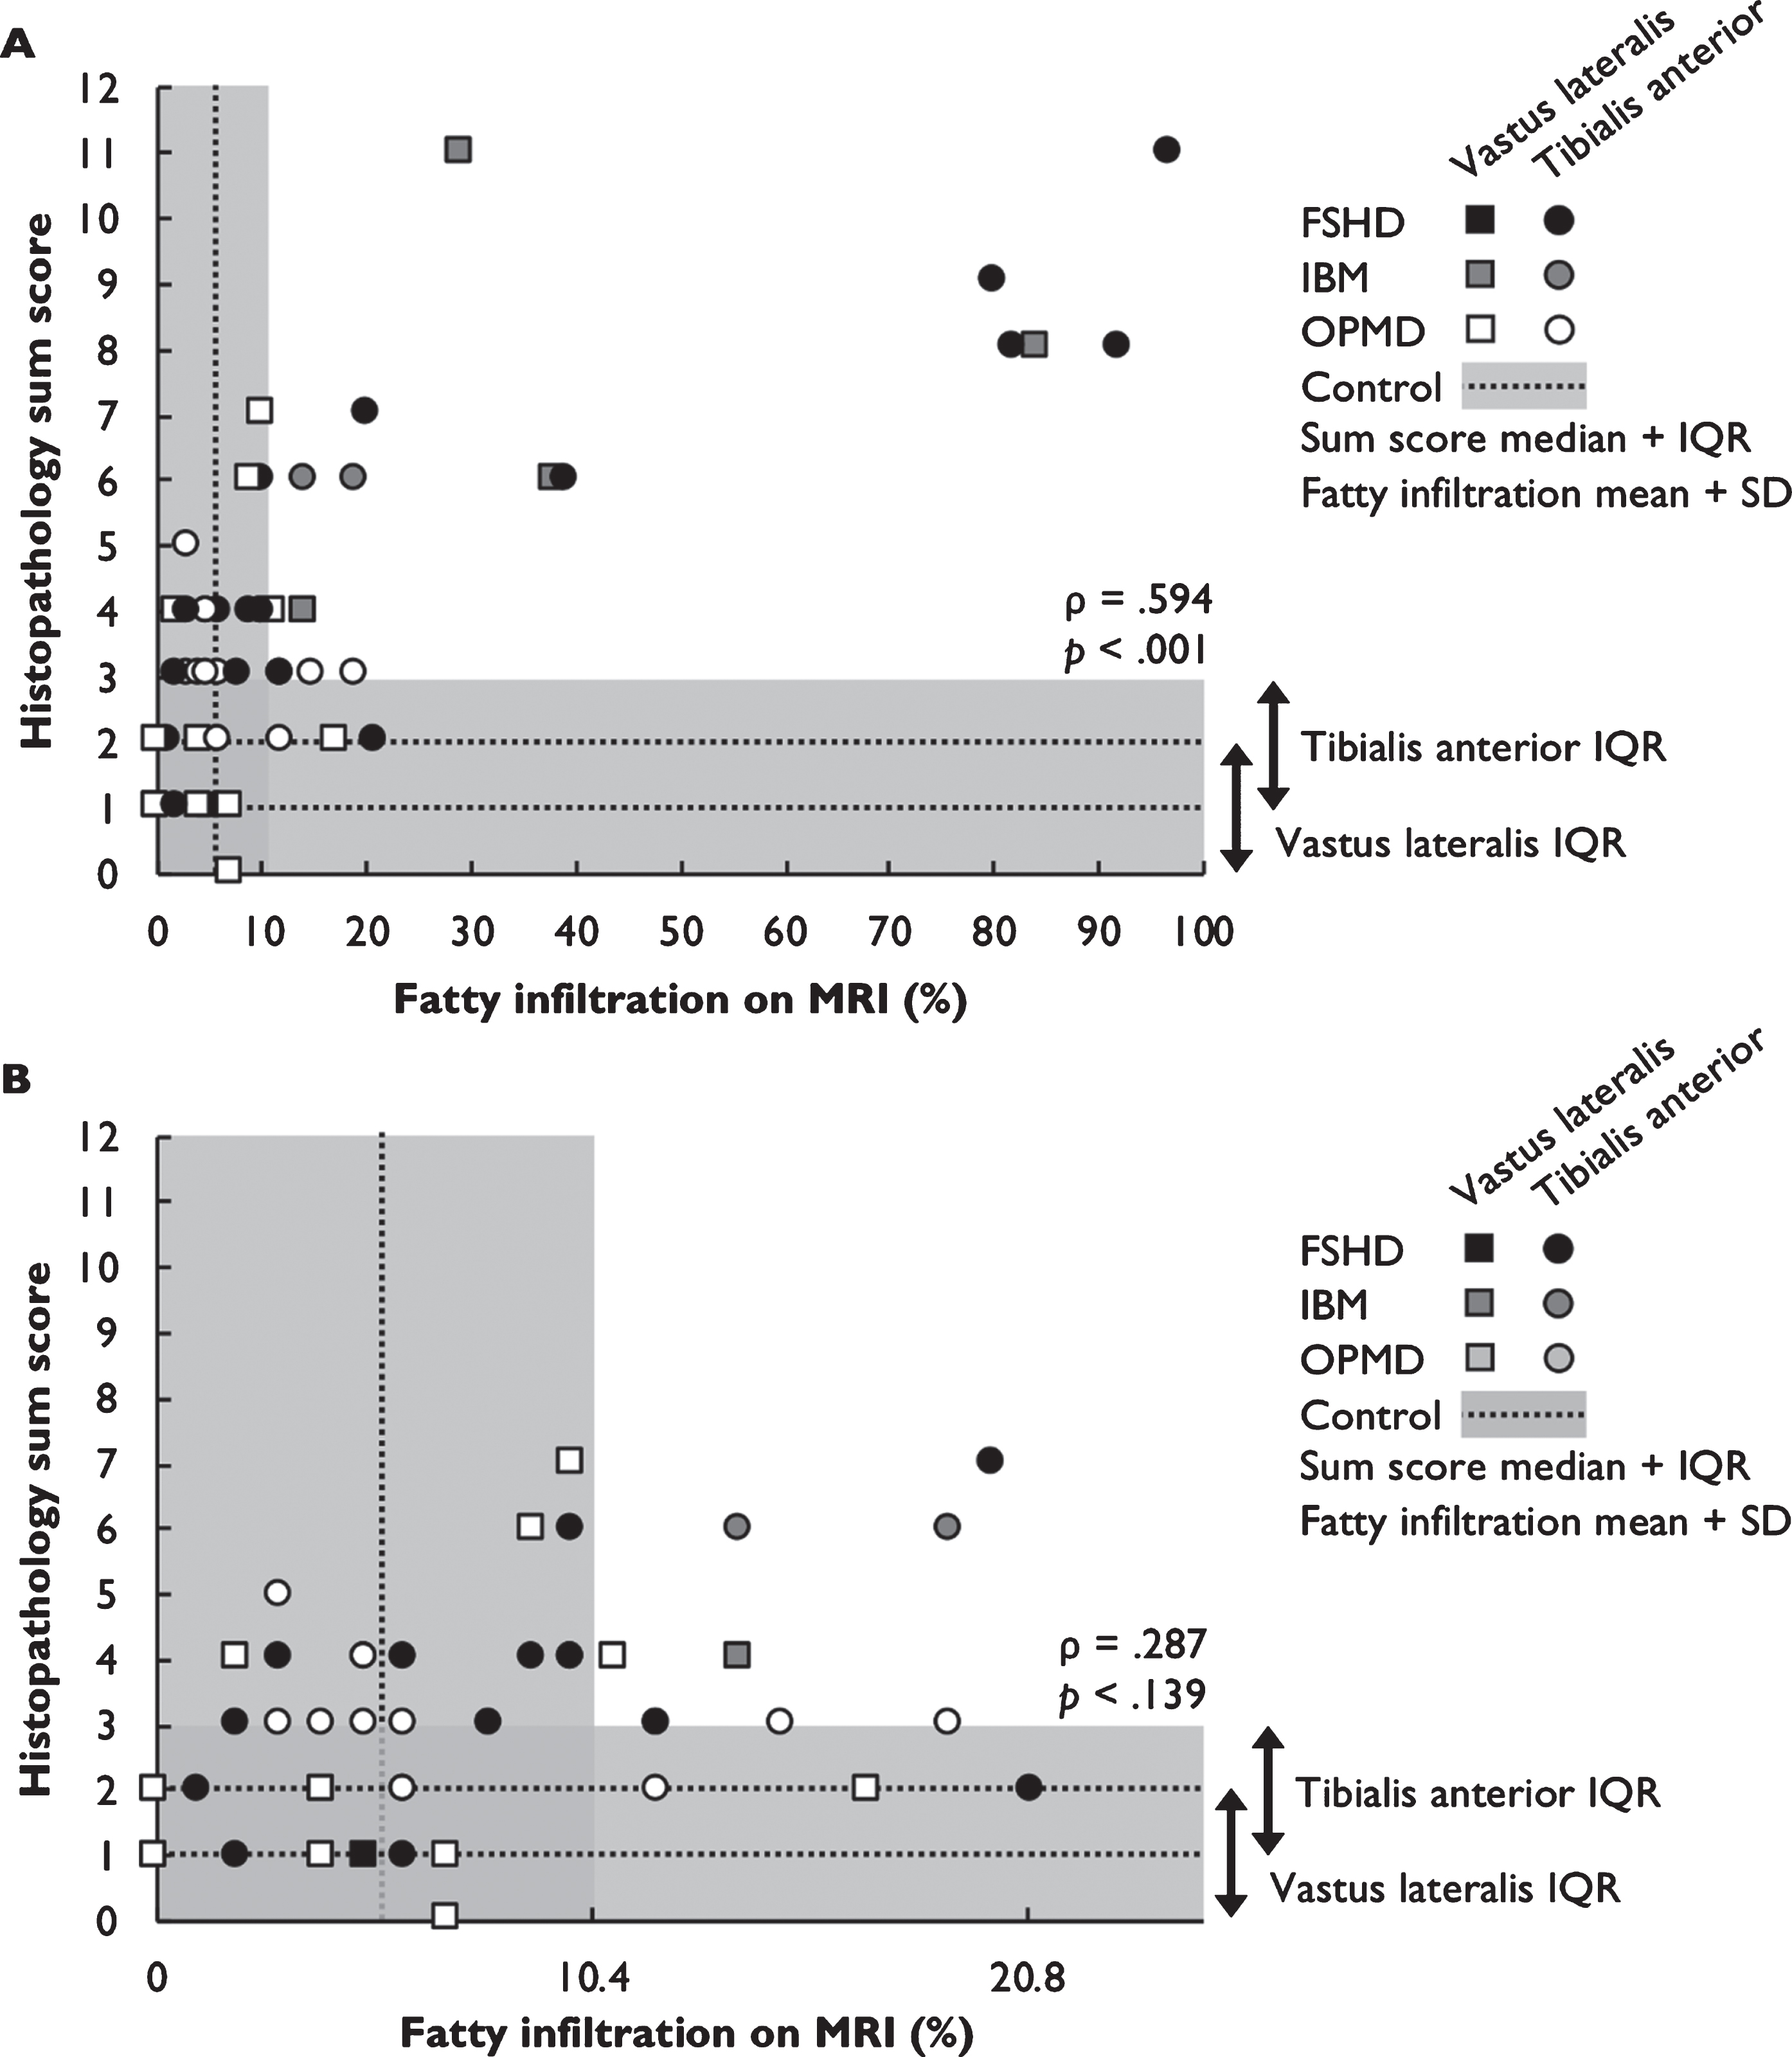
Fig. 4
Histopathological abnormalities associated with fatty infiltration and TIRM hyperintensity. 4A Histopathology sub scores for vastus lateralis and tibialis anterior biopsies obtained from healthy controls and TIRMNEG/FATNEG and TIRMNEG/FATPOS biopsies. More severely abnormalities are present in TIRMNEG/FATPOS biopsies compared to controls and TIRMNEG/FATNEG biopsies. For legibility, p-values are provided for comparison to controls. Comparisons between TIRMNEG/FATNEG and TIRMNEG/FATPOS are all significant at p < 0.05. 4B Distribution of the presence and severity of histopathology sub scores for vastus lateralis and tibialis anterior muscle biopsies obtained from healthy controls and TIRMNEG and TIRMPOS IBM biopsies. Histopathological sub scores were increased in both TIRMNEG and TIRMPOS IBM biopsies compared to controls, independent of the presence or absence of TIRM hyperintensity. 4C TIRMNEG IBM biopsies show either normal or mild-to-moderate inflammation whereas all TIRMPOS IBM biopsies show moderate-to-severe inflammation. *p = <0.05 **p = <0.01 / ***p < 0.001 compared to vastus lateralis.
TIRM hyperintensity
Histopathology sum scores in TIRMPOS muscle biopsies ranged from 3 to 11. Because 6/7 (86%) TIRMPOS biopsies were obtained from patients with IBM, we compared histopathological changes associated with TIRM hyperintensity in IBM biopsies only. Median histopathology sumscore was 6±6 in TIRMNEG IBM biopsies (p < 0.001 compared to controls) and 8.5±6 in TIRMPOS biopsies (p < 0.001 compared to controls). Distribution for separate histopathology subscales are shown in Fig. 4B. TIRM hyperintensity does not necessarily reflect structural changes, but represents edema associated with muscle inflammation or an active regenerative process. The amount of inflammation was evaluated separately and was more severe in TIRMPOS IBM biopsies (Fig. 4C, p < 0.001 compared to controls, p = 0.003 compared to TIRMNEG IBM biopsies).
DISCUSSION
This study investigated the correlation between MRI abnormalities –i.e. the amount of fatty infiltration measured by quantitative MRI or TIRM hyperintensity which reflects muscle edema –and histopathological changes measured using a semi-quantiative histopathology grading scale in a large dataset of 77 vastus lateralis and tibialis anterior muscle biopsies obtained from 12 middle-aged healthy controls and 35 patients with acquired and hereditary muscle disease.
We found a moderate correlation between MRI fat percentage and histopathological changes, showing that MRI abnormalities indeed reflect structural changes in diseased muscle and may serve as an outcome measure for disease progression in muscle disease. Longitudinal studies that combine muscle MRI and muscle biopsy could provide additional insight into the correlation between fatty infiltration and histopathological abnormalities within individual patients. Muscles with normal MRI fat percentages ≤10.6% may show both normal histopathology or mild myopathic changes (histopathology sum score range 0–7). This limits the applicability of muscle MRI fat percentage as an outcome measure in early disease. Addition of muscle ultrasound or novel MRI techniques which may detect fibrosis and other changes in muscles with a normal MRI T1 may complement MRI imaging in therapeutic trials [18–20].
Based on the findings in healthy controls, we determined a histopathology sum score of >2 in the vastus lateralis and >3 in the tibialis anterior as the cut-off for an abnormal biopsy in this age group (40–65 years). Normal histopathology sum scores were present in diseased biopsies with normal and mildly increased amounts of fatty infiltration up to 20.7%. The histopathology sum scores we used in this study was developed and validated for FSHD [17]. However, the score is composed of items that are routinely assessed in the evaluation of muscle biopsies (variability in fiber size, extent of central nucleation, necrosis and/or regeneration, and interstitial fibrosis), which makes this score suitable for other muscle disorders.
TIRM hyperintensity is considered to reflect muscle edema indicative of muscle inflammation and regeneration [21]. In our cohort, TIRMPOS IBM biopsies showed increased amounts of inflammation compared to TIRMNEG muscle biopsies. This confirms the use of MRI inversion recovery imaging as a biomarker for disease activity in IBM.
Unexpectedly, mild histopathological abnormalities were present in nearly all control biopsies (95%), and were more severe in tibialis anterior. The higher histopathology sum scores in the tibialis anterior may partially be explained by the relatively frequent occurrence of lumbar degenerative changes in this age group. Another explanation may be that tibialis anterior undergoes greater mechanical stress during walking and other activities of daily living. The increased amount of mild histopathological changes in the tibialis anterior, which also has a different composition with an increased amount of type 1 fibers (70–90%) may limit the reliability of this muscle as an outcome measure in clinical trials,
In subjects in this age group (45–65 years old), muscle complaints are common, whereas myopathies are relatively rare. Although this study was not designed to determine sensitivity and specificity in a clinical setting, in this age group a biopsy result of ‘mild myopathic changes’ or ‘limited unspecific changes’ should be interpreted with caution. This is compatible with existing evidence that age-related muscle decline starts in the fifth decade [22, 23].
The strength of this study is a large dataset of quantitative MRI and muscle biopsies that were collected on the same day and specifically for this study. All participants with muscle disease were included based on a confirmed genetic diagnosis (FSHD, OPMD) or established diagnostic criteria (IBM). Healthy controls and disease subgroups did not differ in age, BMI or sex distribution. Controls were a representative cross-section of the population in this age group and had no signs or symptoms of muscle disease. Pathological evaluation was performed by an experienced pathologist who was unaware whether a biopsy was obtained from a healthy control or a patient with muscle disease.
A limitation of this study is that our histopathological evaluation may have underestimated the amount of fibrosis because all parameters were assessed on a HPhlox staining without additional trichrome staining. The amount of biopsies with increased amounts of fatty infiltration was relatively low (20% of all biopsies), which may account for the only moderate correlation between fatty infiltration and histopathology sum score. The high amount of muscles with normal MRI can in part be explained by the inclusion of patients with OPMD; a late-onset myopathy that debuts after age 40 and usually doesn’t involve the quadriceps or tibialis anterior until later in the disease course [6]. The amount of TIRMPOS biopsies was low in the FSHD group, which limited comparison of TIRMPOS and TIRMNEG biopsies to the IBM group. TIRMPOS biopsies were analyzed separately because TIRM hyperintensity affects T2-based determination of fatty infiltration. MRI scanning using the Dixon method would have been able to provide a more reliable quantification of fat fraction in TIRMPOS muscles, however this method was not routinely used in our center at the time the first participants were included.
Our findings underscore that different techniques measure distinct aspects of disease. Quantitative MRI of fatty infiltration reflects structural changes associated with accumulated muscle damage, whereas histopathological analysis and imaging of muscle edema are better suited to reflect active disease and inflammation. The findings from this study may facilitate the choice for appropriate imaging modalities as outcome measures in therapeutic trials, but need to be confirmed in different cohorts and different diseases. In a diagnostic setting, our findings show that mild myopathic changes are common in middle-aged healthy controls and are not indicative of a muscle disease.
FUNDING
This study was supported by the Prinses Beatrix Spierfonds and Stichting Spieren voor Spieren (grant no. W.OR10-30 to BvE and CO)
AUTHOR CONTRIBUTIONS
C.O. and B.v.E. were responsible for conception and design of the study and obtained funding. S.L. included all participants and performed clinical evaluation, MRI analysis, interpretation of the data, drafting of the manuscript and figures, supervised by A.H., N.V. and B.v.E. within their specific areas of expertise. B.K. performed histopathological analysis and interpretation of the data. M.S. performed data collection, data analysis and interpretation of the data. All authors provided critical input for interpretation of the data and revision of the manuscript.
ACKNOWLEDGMENTS
We would like to thank Nils Köster MD for his initial histopathological evaluation of the muscle biopsies.
SUPPLEMENTARY MATERIAL
[1] The supplementary material is available in the electronic version of this article: https://dx.doi.org/10.3233/JND-200543.
REFERENCES
[1] | Jungbluth H . Myopathology in times of modern imaging. Neuropathol Appl Neurobiol. (2017) ;43: (1):24–43. |
[2] | Leung DG . Magnetic resonance imaging patterns of muscle involvement in genetic muscle diseases: A systematic review. J Neurol. (2017) ;264: (7):1320–33. |
[3] | Mul K , Vincenten SCC , Voermans NC , Lemmers R , van der Vliet PJ , van der Maarel SM , et al. Adding quantitative muscle MRI to the FSHD clinical trial toolbox. Neurology. (2017) ;89: (20):2057–65. |
[4] | Barnard AM , Willcocks RJ , Finanger EL , Daniels MJ , Triplett WT , Rooney WD , et al. Skeletal muscle magnetic resonance biomarkers correlate with function and sentinel events in Duchenne muscular dystrophy. PLoS One. (2018) ;13: (3):e0194283. |
[5] | Tasca G , Monforte M , De Fino C , Kley RA , Ricci E , Mirabella M . Magnetic resonance imaging pattern recognition in sporadic inclusion-body myositis. Muscle Nerve. (2015) ;52: (6):956–62. |
[6] | Alonso-Jimenez A , Kroon R , Alejaldre-Monforte A , Nunez-Peralta C , Horlings CGC , van Engelen BGM , et al. Muscle MRI in a large cohort of patients with oculopharyngeal muscular dystrophy. J Neurol Neurosurg Psychiatry. (2019) ;90: (5):576–85. |
[7] | Warman Chardon J , Diaz-Manera J , Tasca G , Bonnemann CG , Gomez-Andres D , Heerschap A , et al. MYO-MRI diagnostic protocols in genetic myopathies. Neuromuscul Disord. (2019) ;29: (11):827–41. |
[8] | Kinali M , Arechavala-Gomeza V , Cirak S , Glover A , Guglieri M , Feng L , et al. Muscle histology vs MRI in Duchenne muscular dystrophy. Neurology. (2011) ;76: (4):346–53. |
[9] | Van De Vlekkert J , Maas M , Hoogendijk JE , De Visser M , Van Schaik IN . Combining MRI and muscle biopsy improves diagnostic accuracy in subacute-onset idiopathic inflammatory myopathy. Muscle Nerve. (2015) ;51: (2):253–8. |
[10] | Schweitzer ME , Fort J . Cost-effectiveness of MR imaging in evaluating polymyositis. AJR Am J Roentgenol. (1995) ;165: (6):1469–71. |
[11] | Hilton-Jones D , Miller A , Parton M , Holton J , Sewry C , Hanna MG . Inclusion body myositis: MRC Centre for Neuromuscular Diseases, IBM workshop, London, 13 June 2008. Neuromuscul Disord. (2010) ;20: (2):142–7. |
[12] | Lassche S , Ottenheijm CA , Voermans NC , Westeneng HJ , Janssen BH , van der Maarel SM , et al. Determining the role of sarcomeric proteins in facioscapulohumeral muscular dystrophy: A study protocol. BMC Neurol. (2013) ;13: :144. |
[13] | Lassche S , Janssen BH , T IJ , Futterer JJ , Voermans NC , Heerschap A , et al. MRI-Guided Biopsy as a Tool for Diagnosis and Research of Muscle Disorders. J Neuromuscul Dis. (2018) ;5: (3):315–9. |
[14] | Kan HE , Scheenen TW , Wohlgemuth M , Klomp DW , van Loosbroek-Wagenmans I , Padberg GW , et al. Quantitative MR imaging of individual muscle involvement in facioscapulohumeral muscular dystrophy. Neuromuscul Disord. (2009) ;19: (5):357–62. |
[15] | Shanely RA , Zwetsloot KA , Triplett NT , Meaney MP , Farris GE , Nieman DC . Human skeletal muscle biopsy procedures using the modified Bergstrom technique. J Vis Exp. 2014(91):51812. |
[16] | Stienen GJ , Kiers JL , Bottinelli R , Reggiani C . Myofibrillar ATPase activity in skinned human skeletal muscle fibres: Fibre type and temperature dependence. The Journal of Physiology. (1996) ;493: (Pt 2):299–307. |
[17] | Statland JM , Shah B , Henderson D , Van Der Maarel S , Tapscott SJ , Tawil R . Muscle pathology grade for facioscapulohumeral muscular dystrophy biopsies. Muscle Nerve. (2015) ;52: (4):521–6. |
[18] | Mul K , Horlings CGC , Vincenten SCC , Voermans NC , van Engelen BGM , van Alfen N . Quantitative muscle MRI and ultrasound for facioscapulohumeral muscular dystrophy: Complementary imaging biomarkers. J Neurol. (2018) ;265: (11):2646–55. |
[19] | Pillen S , Tak RO , Zwarts MJ , Lammens MM , Verrijp KN , Arts IM , et al. Skeletal muscle ultrasound: Correlation between fibrous tissue and echo intensity. Ultrasound Med Biol. (2009) ;35: (3):443–6. |
[20] | Murphy AP , Greally E , O’Hogain D , Blamire A , Caravan P , Straub V . Noninvasive quantification of fibrosis in skeletal and cardiac muscle in mdx mice using EP3533 enhanced magnetic resonance imaging. Magn Reson Med. (2019) ;81: (4):2728–35. |
[21] | Carlier PG , Marty B , Scheidegger O , Loureiro de Sousa P , Baudin PY , Snezhko E , et al. Skeletal Muscle Quantitative Nuclear Magnetic Resonance Imaging and Spectroscopy as an Outcome Measure for Clinical Trials. J Neuromuscul Dis. (2016) ;3: (1):1–28. |
[22] | Curtis E , Litwic A , Cooper C , Dennison E . Determinants of Muscle and Bone Aging. J Cell Physiol. (2015) ;230: (11):2618–25. |
[23] | Arts IM , Pillen S , Overeem S , Schelhaas HJ , Zwarts MJ . Rise and fall of skeletal muscle size over the entire life span. J Am Geriatr Soc. (2007) ;55: (7):1150–2. |


