
What Happened with Muscle Force, Dynamic Stability And Falls? A 10-Year Longitudinal Follow-Up in Adults with Myotonic Dystrophy Type 1
Abstract
Background:
Individuals with myotonic dystrophy type 1 (DM1) are known to stumble and fall, but knowledge is scarce regarding dynamic stability in this disorder.
Objective:
To describe disease progress regarding muscle force, dynamic stability and patient reported unintentional falls during a ten-year period, in individuals with DM1.
Methods:
Quantification of isometric muscle force in four leg muscle groups and assessment of Timed 10-meter-walk in maximum speed (T10max), Timed Up&Go (TUG) and Step test (STEP) were performed at three occasions in a DM1 cohort, together with self-reported falls.
Results:
Thirty-four people (m/f:11/23, age: 50.2 + /–9.4) participated. The muscle force loss after ten years was large in the distal ankle muscles. A steeper force decrease was seen in most muscles between year five and ten compared to the former five-year period. Males reported more falls than females, 91% vs 35% had fallen last year. A positive correlation, ρ= 0.633, p < 0.001, was shown between walking time (T10max) and number of falls. Frequent fallers were only seen among those with slower walk (T10max > 10seconds), and fewer steps in the STEP test (STEP≤5 steps).
Conclusions:
A diminishing leg muscle strength and worse dynamic stability were seen in the group, with a steeper decrease in the latter five years. Weak ankle dorsiflexors, a slower walk and difficulties to lift the forefoot were related to frequent falls.
INTRODUCTION
Myotonic dystrophy type 1 (DM1) is the most common inherited myopathy among adults [1, 2]. The prevalence varies but is known to be approximately 3–15/100.000 in European inhabitants [3]. Impairments in multiple organ systems are common, due to the RNA-mediation of the disease [3]. The impairments include heart engagement, respiratory affection, cognitive deficits and fatigue [4, 5]. Muscle weakness in the distal muscles of the extremities and/or myotonia in the hand are early manifestations of the muscle affection in persons with DM1 [4]. The age at first reported or recalled symptom defines the clinical classification of the patient: congenital form (0-1 years old); childhood form (1–10); juvenile form (10–20); adult form (20–40); late-onset or mild form (40+) [6].
The progression of muscle weakening in persons with non-congenital DM1 has previously been investigated [7–14]. This slowly progressive weakening of the leg muscles is suggested to be the main contributing factor to the increased risk of stumbles, which has been shown in persons with DM1, and in conjunction with an uneven surface often results in a sometimes injurious fall [12, 14, 15]. Muscle weakness affects the dynamic stability secondarily and impinge the ability to hinder an impending fall, but there could also be many other factors contributing to a fall, e.g. primary balance deficit, mobility limitation, visuospatial and cognitive deficits, dizziness, cardiovascular conditions, urinary urgency, neuromuscular transmission abnormalities as well as external conditions like an uneven ground [16].
A retrospective multinational survey in persons with DM1 has shown an increased risk of falling depending on age and disease severity with no significant difference between males and females [14]. Indeed, fatigue and cognitive stress may also contribute to frequent stumbles and falls [17].
A five-year prospective evaluation of muscle force, gait and balance (n = 43, m/f 18/25) was performed showing a worse muscle force decrease in the males than in the females, –2.65% and –0.95%/year respectively in the leg muscles [12]. The difference was less in the performance-based measures of walking and dynamic balance, but the deterioration was nonetheless statistically significant, p < 0.001 [12].
Postural control is complex and involves many bodily systems [18]. One model is proposed by dr Horak, appointing several body functions and control systems to be of uttermost importance for the management of postural control [19]. This model includes biomechanical constraints (as range of motion and muscle strength), stability limits, anticipatory postural adjustments, automatic postural responses, sensory orientation and stability in gait, e.g. constraints in spinal locomotor, brain-stem postural sensorimotor programs and cognition.
In our understanding of the postural control deficiency in individuals with DM1 the major cause would be the weakness of the distal leg muscles primarily. Our interest lies in the connection between these constraints and the dynamic stability in gait and daily activities, and the number of falls. Therefore our choice was to use three separate performance-based measures of dynamic stability in conjunction with force measurements, namely Timed 10 meter walk in maximum speed (T10max), the Timed Up and Go (TUG), and a Step test by Hill (STEP) [20–23].
To our knowledge a ten-year prospective study on muscle force and performance-based measures of dynamic stability, as well as patient reported unintentional falls, has not been performed in persons with DM1. The objective of this study was thus to prospectively follow the disease progress regarding muscle force, dynamic stability and number of falls for ten years in an adult DM1 cohort.
The following objective was established:
• to describe leg muscle force, dynamic stability and number of falls recalled, at three occasions during ten years
• to compare possible differences between the first (0–5) versus the last (5–10) five years
• to show number of falls versus muscle force and dynamic stability
MATERIALS AND METHODS
Participants
This study was designed as a prospective, longitudinal, descriptive investigation of the adult DM1 cohort at the Neuromuscular Centre, Sahlgrenska University Hospital, Gothenburg, Sweden. The inclusion criteria were: genetically confirmed DM1 diagnosis and ability to perform TUG with or without handheld gait aids. Exclusion criteria were congenital DM1-form, whereas intellectual disability and autism is common, or other disorder that could interfere with the postural stability or the ability to follow the test instructions. The patient cards were checked for severe cognitive deficit also among the childhood or juvenile form participants. Seventy-two eligible persons were invited by letter and/or by phone to participate in the original study. Fifty-one persons accepted participation; the results of the baseline investigation and the five-year follow-up have been published [12, 24]. For this final assessment the inclusion criterion was previous participation in the baseline study. Hence, the former data in the present study were collected from the baseline investigation and the five-year follow-up.
The patients gave their written informed consent to participate in the longitudinal study at the baseline and knew that they could refuse further participation without any impact on further treatment. The Regional Ethical Review Board in Gothenburg, Sweden, has given approval of the study (Dnr 248–06 and Dnr 601–11).
Procedures
At each time blinded to previous results, the same experienced physiotherapist (EH) examined the participants at baseline, after five year, and after ten year. The assessments were performed in the same order each time, with the possibility to rest in between, when needed.
Characteristics
Body mass index (BMI) kg/m2, was recorded. CTG-repeats and the clinical classification of DM1 form were collected from the patient cards. Age at onset was defined as onset of the first DM1-related symptom described by the patient, according to the patient card.
A fall was defined as “an event, which results in a person coming to rest inadvertently on the ground or floor or other lower level” according to the World Health Organization definition [25]. Further we have regarded a person reporting three to five falls during preceding 12-month period as a recurrent faller and those reporting six or more falls during the same period as frequent fallers [16].
To classify the participants in relation to their muscular condition the Muscular Impairment Rating Scale (MIRS) was used, this scale is based on manual muscle testing [26]. Reported walking index (RWI) was used to evaluate the participants’ own opinion on walking ability [27]. The maximum RWI score is 12, showing no subjective walking difficulties; the minimum score is 5, subjective very large walking difficulties.
Measurements and assessments
Force measurements can be performed in different ways, i.e. manual muscle testing, quantitative force in isometric state, with Biodex® system (or similar), or with handheld dynamometry [8]. In this study we chose to measure isometric force in the way that was clinically most feasible, with handheld dynamometry. As the participants were all adults, with permanent bone length, we used the unit newton [28, 29]. Reference values have been shown to differ between countries, outside 95% confidence interval, which makes it difficult to compare our results to “normal” muscle strength, and thus we chose to compare each individual only with him-/herself.
Quantitative isometric muscle force was assessed at maximum effort with the “break” method using a handheld force gauge meter (Mecmesin Basic Force Gauge 1000N, Chauvin Arnaux Group). The muscle functions quantitatively measured were hip flexion, knee extension and flexion, and ankle dorsiflexion, all measured bilateral. The assessment positions were chosen according to Phillips et al. for the hip flexion (supine, hip and knee in 90° flexion) and ankle dorsiflexion (supine, with free heel) and Bäckman et al. for the knee muscle functions (knee extension: sitting, hip and knee in 90° flexion; knee flexion: prone position, knee in 90° flexion) [28, 29].
The timed ten meter-walk in maximum speed (T10max) was chosen as walking test due to its similarity to the everyday activity passing a zebra crossing. It has also shown to be more reliable than the comfortable speed walking test in the DM1 patient group [30]. This test was performed in a long undisturbed hallway, with a cold start and flying finish. The participant was asked to walk at least 2 metres beyond the 10-meter line. A stopwatch was used together with the command: “Ready-Set-Go!” On the word “Go!” the stopwatch was started. The watch was stopped as the participant passed the ten-meter-mark on the wall facing the assessor. This walking test has shown high test-retest relative reliability (ICC2,1 = 0.94) and a low absolute variation (SEM = 0.4) in individuals with DM1 [30].
The performance-based test of basic mobility, Timed Up & Go (TUG), was used to include various aspects of dynamic stability associated with falls [20]. A TUG time exceeding 14 seconds has shown association with falls [22, 24]. The TUG includes rising from a chair, walking 3 meters, turning, walking back and sitting down. The TUG has been assessed for psychometric properties as a test of balance in the elderly. It has shown good test-retest relative reliability, (ICC2.1 = 0.83) in individuals with DM1, and the absolute variation was low (SEM = 0.7) [30, 31].
The Step test by Hill was chosen to capture another aspect of dynamic stability, as it challenges the ankle dorsiflexors, often being weak in this patient group. In this test the individual, without support places his/her foot, during 15 seconds, on a low box (40×40×8cm), up and down as many times as possible without losing the postural stability. Both sides are tested after practice. If the postural stability is lost, only the completed steps are counted. This test has shown good test-retest relative reliability (ICC2.1 = 0.88), and the absolute variation was low (SEM = 1.4) among individuals with DM1 [23, 30].
Additional information on the assessment instruments is shown in the enclosed Appendix.
Statistics
Characteristics of the participants are shown according to data level. Non-parametric test statistics were used when appropriate. For comparison between males and females in continuous but skewed data the independent-samples Mann-Whitney U test was used, and in ordered categorical data the Fisher’s Exact test was used. Changes over time were analysed with the Wilcoxon Signed rank test for continuous variables with skewed data. In ordered categorical data the changes were analysed with Sign test.
In the results section, the mean of right and left results in muscle force measurements and Step test were used in the analysis, as no significant differences could be detected between the sides. For changes over time the General Linear Model, One-way Repeated Measures ANOVA was used for analysis of normally distributed continuous data. Post-hoc paired t-tests were performed to detect any differences between the first and second five-year-period regarding individual force and dynamic stability decrease. All significance tests were two-sided at the 5% significance level. The guidelines by Cohen (1988) on effect size interpretation were used [32]. The Spearman’s rank correlation coefficient (ρ) was used as appropriate. Calculations were made in SPSS®, Statistics, v21 (IBM, USA).
RESULTS
Participants
Initially, 51 participants were included in this longitudinal study. After dropouts due to mortality (n = 8), disease progress (n = 4), refusal by different reasons (n = 5), the results of the ten-year assessments are based upon the 34 remaining participants; 23 women and 11 men, mean (SD) age 50.2 (9.4) years, Fig. 1. The last assessments were performed mean (SD) 122 (2.2) months after baseline and the characteristics at that time are shown in Table 1. The distribution of muscular condition by MIRS impairment grade was significantly changed compared to baseline: 18 participants (53%) now had a more severe muscular condition (Sign test p < 0.001).
Fig. 1
Flow chart of the longitudinal, prospective study.
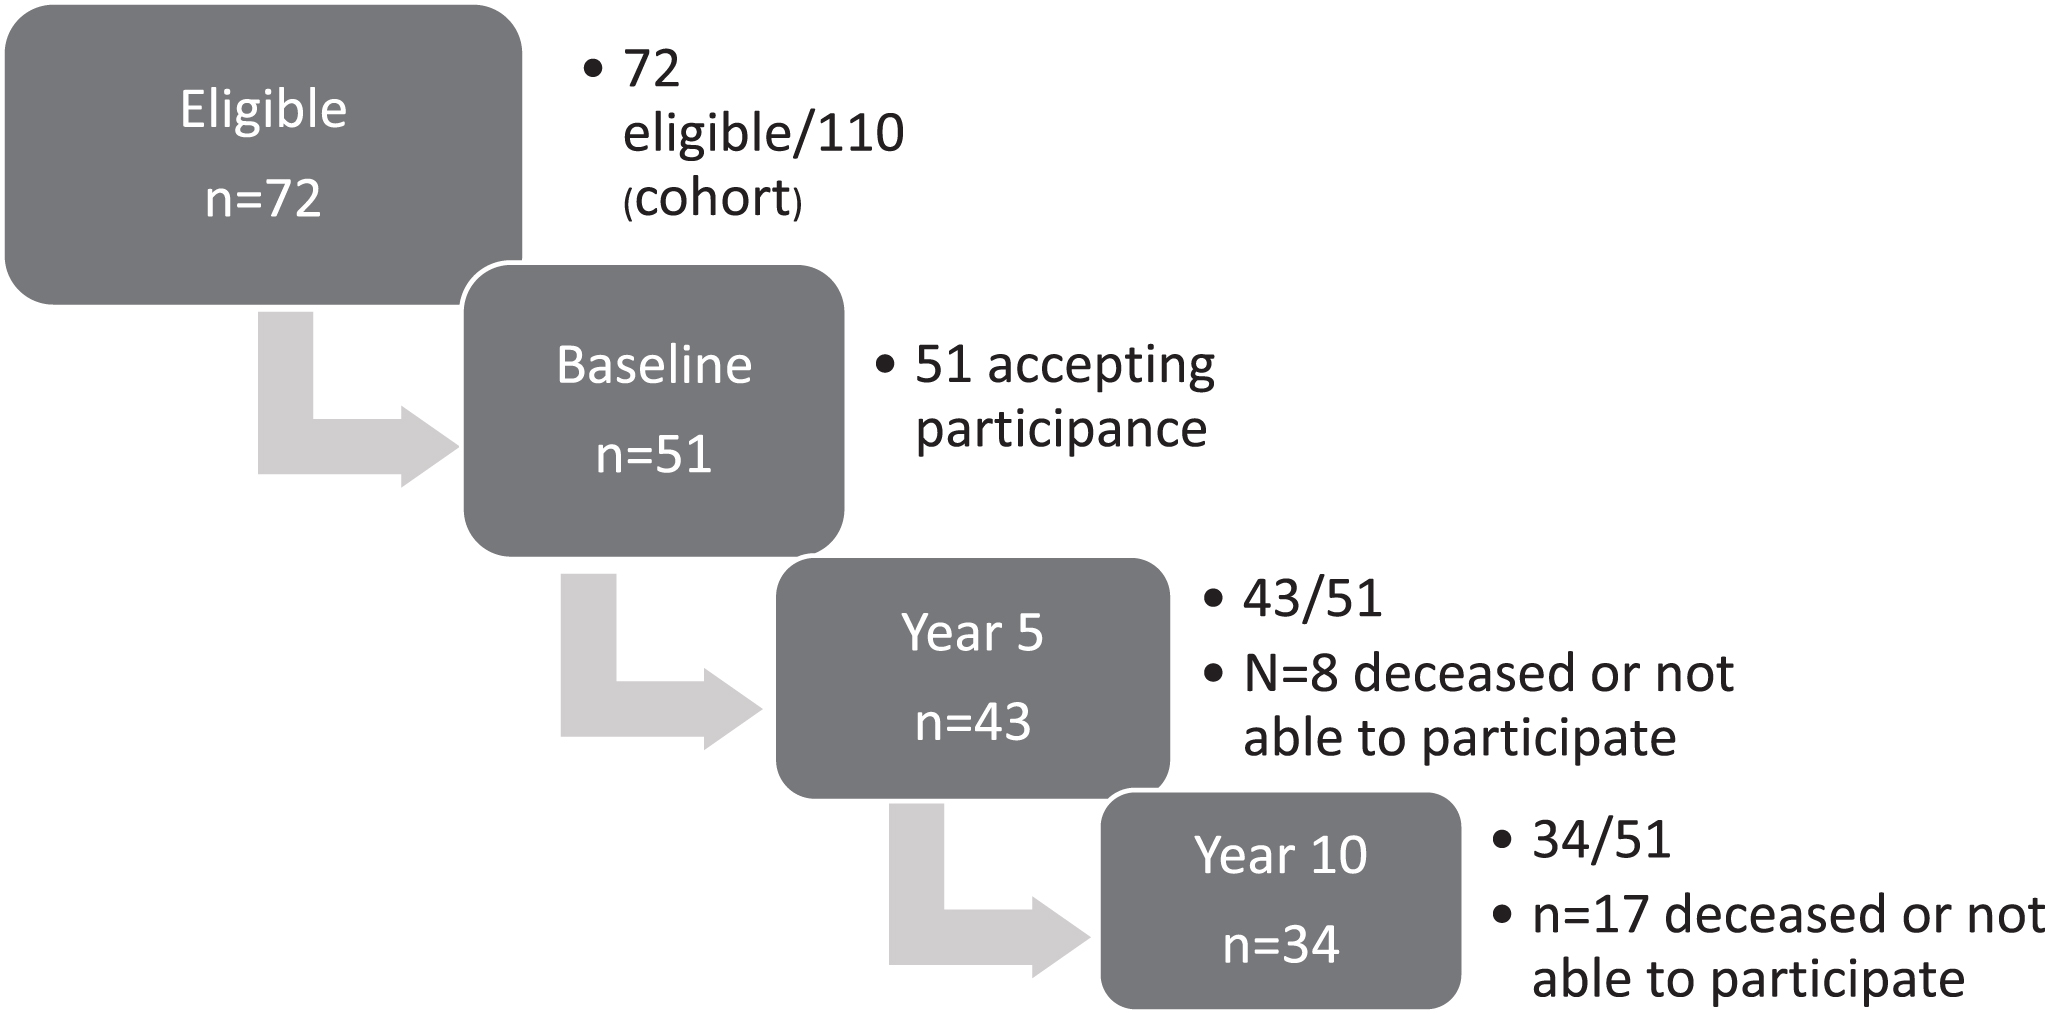
Table 1
Clinical characteristics of patients participating in the 10-year follow-up
| Variable | All N = 34 | Males N = 11 | Females N = 23 | p-value |
| Age (years) mean (SD) | 50 (9.4) | 46 (7.9) | 52 (9.7) | 0.11 |
| BMI (kg/m2) mean (SD) | 26.9 (5.46) | 27.1 (4.50) | 26.8 (5.86) | 0.86 |
| CTG- repeats at diagnosis | 450 (64–2000) | 462 (105–1100) | 400 (64–2000) | 0.60 |
| Disease duration* | 21 (11–50) | 21 (14–35) | 20 (11–50) | 0.49 |
| Wheelchair/walking aids*** /no walking aids | 3/11/20 | 2/3/6/ | 1/8/14 | |
| Employed for work > 20h/week | 14 | 0 | 14 | |
| Accidental falls*** | 2 (0–35) | 2 (0–35) | 1 (0–14) | 0.16 |
| RWI | 8 (5–12) | 7 (5–11) | 8 (5–12) | 0.15 |
| Clinical classification number (%) | ||||
| Childhood | 5 (15%) | 3 (27%) | 2 (9%) | 0.227 (childhood + juvenile forms versus adult + late forms) |
| Juvenile | 7 (20,5%) | 2 (18%) | 5 (22%) | |
| Adult | 14 (41%) | 5 (45%) | 9 (39%) | |
| Late | 8 (23,5%) | 1 (9%) | 7 (30%) | |
| MIRS-score number (%) | 0.227 (Grade 1–3 versus grade 4–5) | |||
| Grade 1 | 0 | 0 | 0 | |
| Grade 2 | 4 (12%) | 1 (9%) | 3 (13%) | |
| Grade 3 | 4 (12%) | 0 | 4 (17%) | |
| Grade 4 | 16 (47%) | 3 (27%) | 13 (57%) | |
| Grade 5 | 10 (29%) | 7 (64%) | 3 (13%) |
*Years since first reported or recalled symptom, from patient card. **Handheld walking aids, cane or wheeler. ***Self-reported (recalled) number of falls in preceding 12 months. Median and min-max are presented if nothing else is stated. P-values are shown for differences between males and females. The independent-samples T-test was conducted in continuous normally distributed data (age, BMI), the Independent-samples Mann-Whitney U-test in skewed data and the Fisher’s Exact test in the clinical classification of DM1 form and in the MIRS variable, where the data was grouped into two subgroups for the analyses. Abbreviations: SD, standard deviation. RWI, Reported Walking Index. MIRS, Muscular Impairment Rating Scale.
The reported walking ability (RWI) showed a decrease after 10 years. Subjective walking difficulties, mild or severe, as indicated by RWI≤11, were reported by 62% of the participants at baseline but by 88% after 10 years. Three participants were now continuously using a wheelchair.
Isometric leg muscle force
A statistically significant effect for time was shown in each leg muscle group, the means and 95% confidence interval are presented in Table 2. A statistically significant difference was shown between the two time periods. This bi-phased muscle force decrease showed a steeper decline in newtons for three of four muscle groups during the latter five years. A smaller successive decline was shown in the hip flexors. For the whole group, the decline was most pronounced in the knee flexors, with a mean decrease of 46% from baseline to year ten, but 7% from baseline to year five, Table 4. The ankle dorsiflexors showed a mean decrease of 38% from baseline to year ten, but 9% during the first period. Splitting the group in participants with disease duration at baseline shorter (≤10 years) or longer (> 10 years) revealed no significant difference in the force decline.
Table 2
Descriptive results for isometric leg muscle force (in newtons) at three time-points. Repeated measures ANOVA
| Muscle group, number | Isometric leg muscle force Mean (CI 95%) | ANOVA | ||||
| Baseline | Year 5 | Year 10 | Effect for time | Partial Eta2 | ||
| Hip flexors, N = 31 | All | 169 (158; 180) | 159 (148; 170) | 144 (132; 156) | < 0.001*** | 0.46 |
| Males | 185 (164; 206) | 174 (154; 194) | 155 (143; 167) | |||
| Females | 162 (150; 174) | 152 (140; 165) | 138 (122; 155) | |||
| Knee extensors, N = 32 | All | 291 (193; 389) | 282 (182; 381) | 244 (136; 352) | 0.023* | 0.21 |
| Males | 358 (302; 415) | 324 (264; 385) | 238 (174; 302) | |||
| Females | 259 (234; 284) | 261 (231; 292) | 247 (209; 284) | |||
| Knee flexors, N = 30 | All | 107 (98; 115) | 100 (89; 110) | 56 (44; 68) | < 0.001*** | 0.75 |
| Males | 114 (98; 130) | 101 (78; 124) | 83 (52; 113) | |||
| Females | 104 (94; 113) | 99 (87; 111) | 44 (36; 52) | |||
| Ankle dorsiflexors, N = 32 | All | 143 (112; 174) | 130 (97; 162) | 89 (68; 110) | < 0.001*** | 0.56 |
| Males | 107 (31; 183) | 91 (21; 161) | 62 (20; 105) | |||
| Females | 160 (133; 188) | 148 (114; 182) | 102 (80; 124) | |||
Leg muscle force at three time points are shown, mean (CI 95%). The results for all individuals were analysed with General Linear Model, repeated measures ANOVA. There was a significant effect for time in each muscle group, statistics were computed with Wilks’ Lambda, and partial eta squared shows the effect size.
There were large individual variations in knee extensor force, individual changes are shown in Figs. 2a&b. In our cohort the males had mean (SD) -120 (123.4) newtons and the females had -12 (55.0) newtons.
Fig. 2
Isometric force in knee extension, at three measurement points, including reference line calculated from regression equation (NIMS Data Consortium) with respect to gender, age and a BMI equal to 25. Number in series post equals the individuals’ age at baseline. DM1 form is shown as diamonds (&z.diam;= childhood), triangles (Δ = juvenile), boxes (□= classic) and circles (∘= late onset). Some series posts are also shown in the figure, for the readers own interpretation.
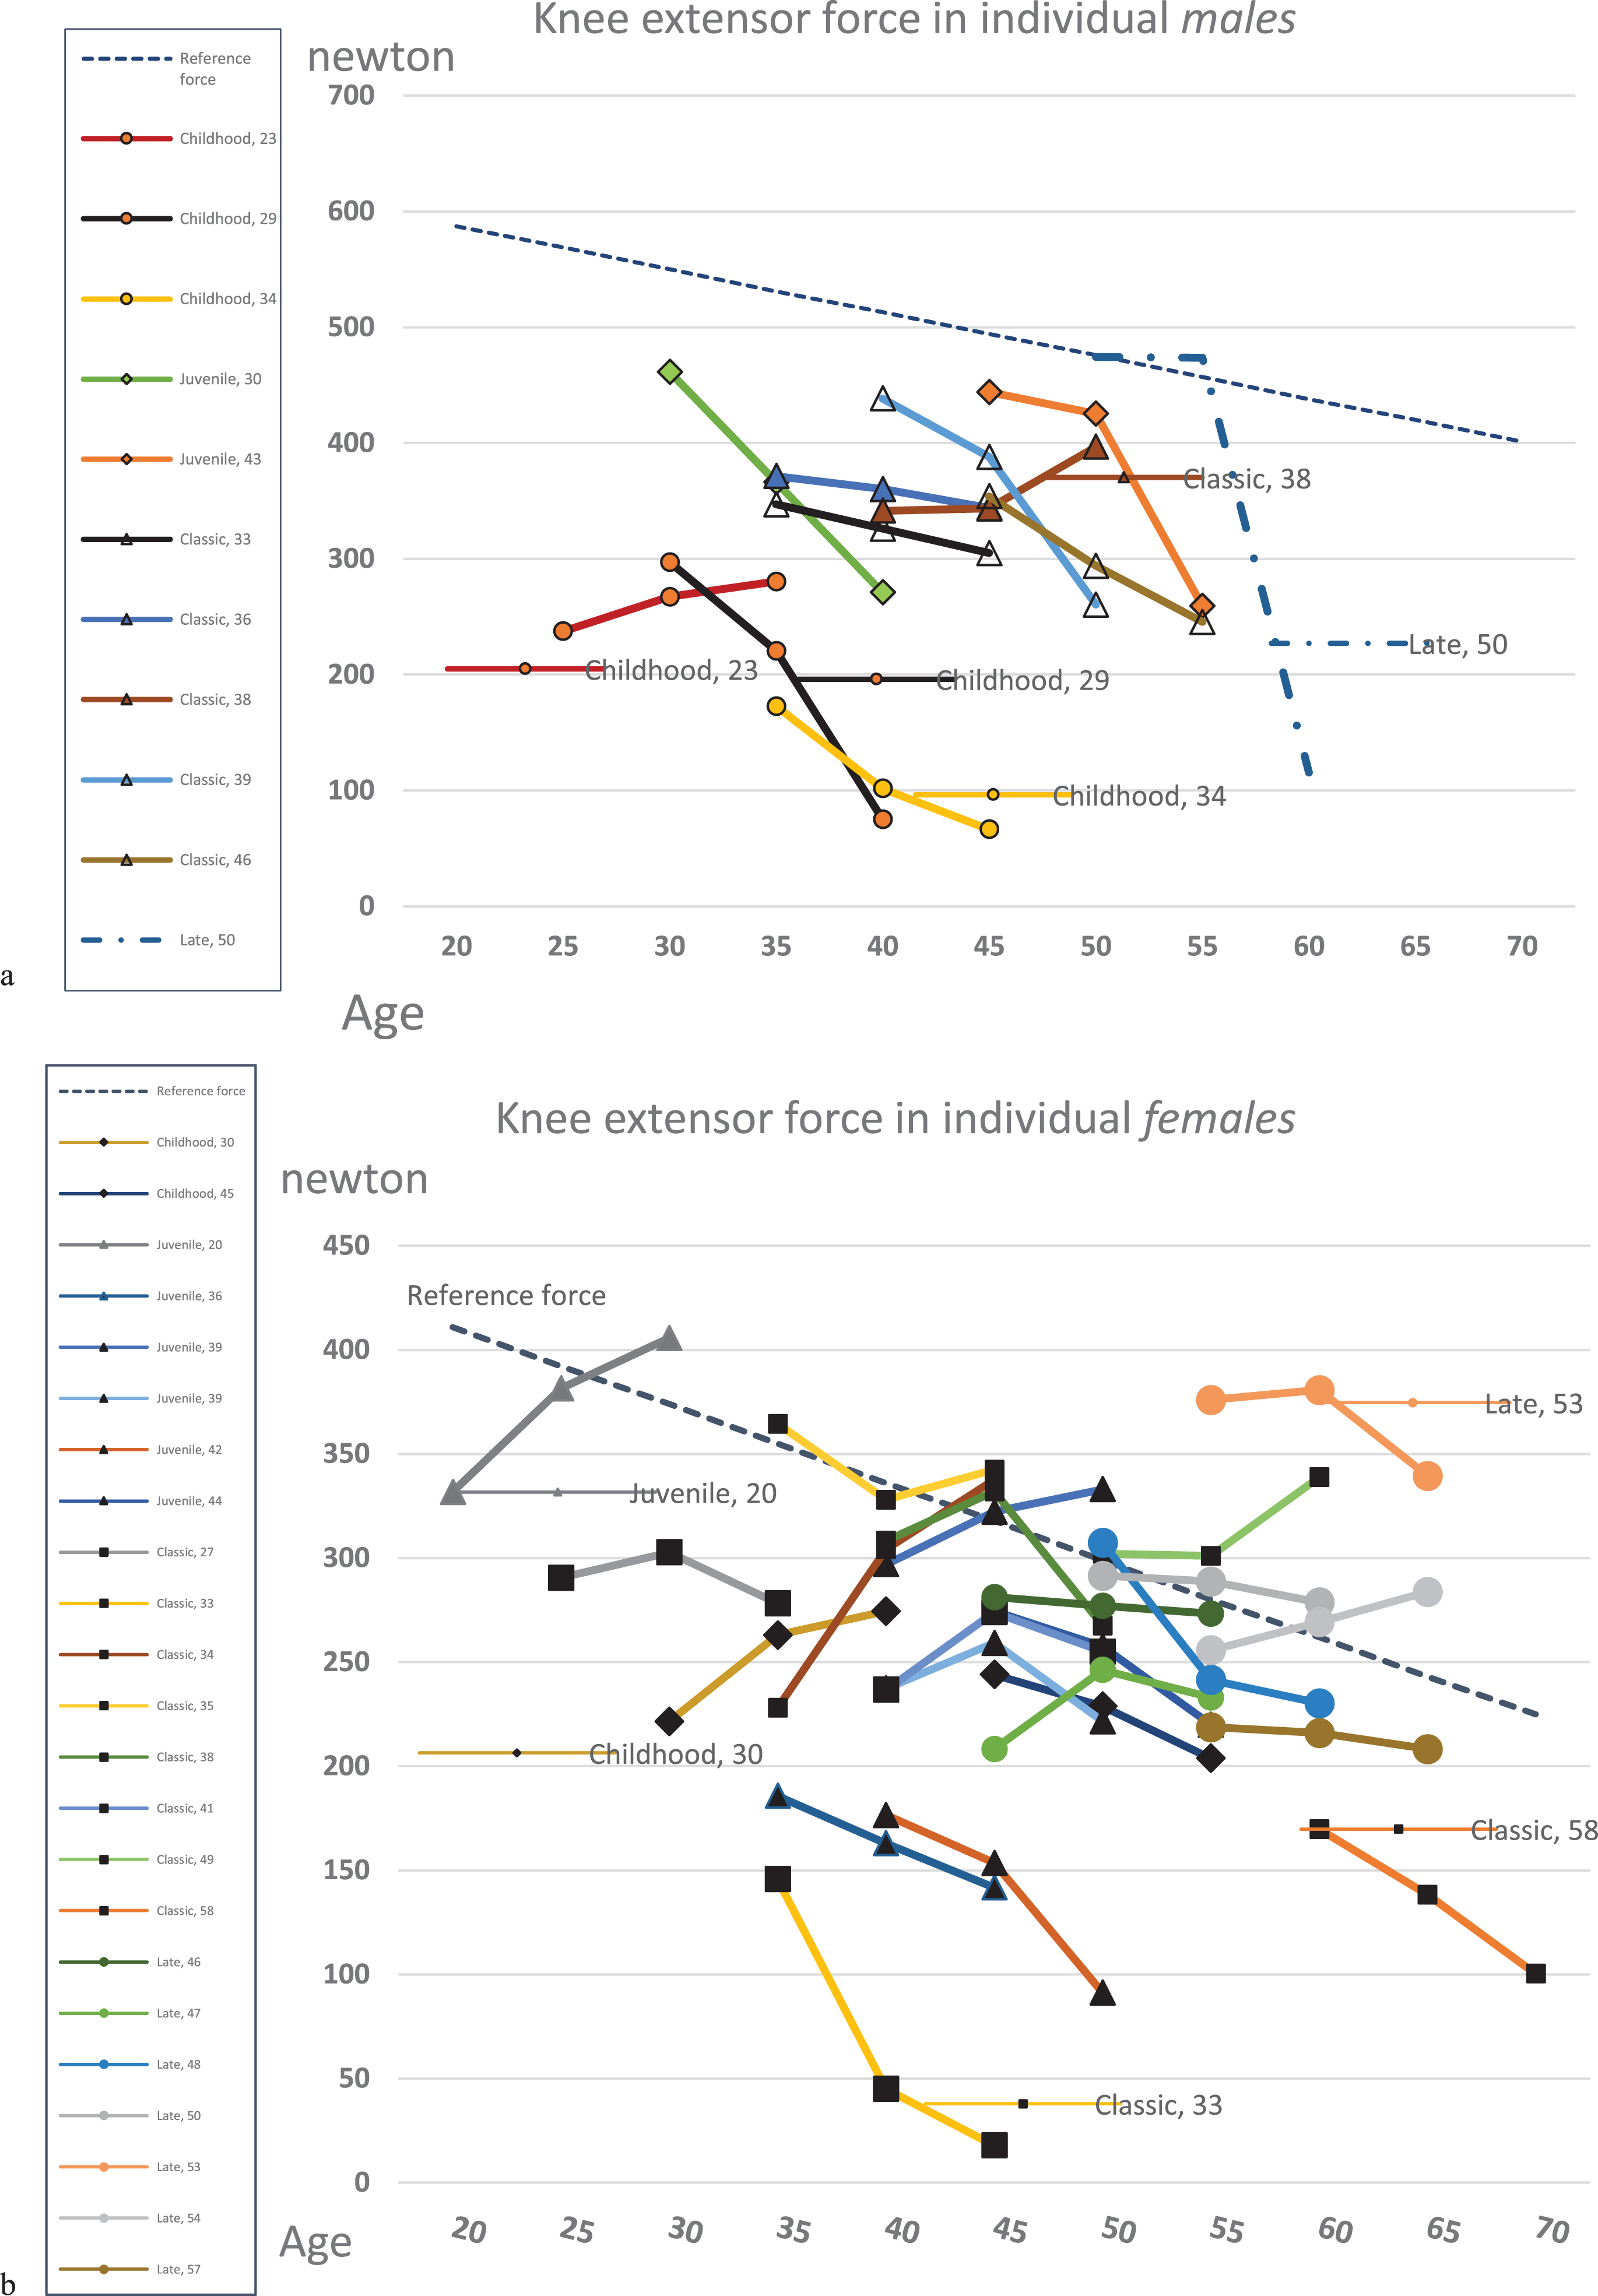
The ankle dorsiflexor force had a statistically significant correlation with number of falls the preceding year, Spearman’s ρ –0.376, p-value 0.029. This was not shown for the other muscle groups.
Performance-based tests of dynamic stability
Thirty-one participants were able to perform the T10max walking test, and 30 could perform the TUG. In STEP test, as zero step is a possible result (but also a floor effect), those not being able to lift a foot up on top of the box at year ten were also included. The ten-year assessments of T10max, TUG and STEP all showed deterioration compared to baseline. When conducting repeated-measures ANOVA we had to reduce the data to those who had results from three time-points and exclude those with zero steps. The results of the performance-based measures at the three time points are shown in Table 3. An enforced decline during the last five years was shown in the STEP test, but there was a similar decline for the both time periods in the T10max walk test and TUG. Table 4 shows the % change for each test.
Table 3
Descriptive results for Timed 10-m walk in maximum speed (T10max), Timed Up & Go (TUG) and Step test (STEP) at the three occasions. Repeated measures ANOVA
| Variable | Performance-based tests of dynamic stability | ANOVA | ||||
| Baseline Mean (SD) | Year 5 Mean (SD) | Year 10 Mean (SD) | Sig. (2-tailed) | Partial eta2 | ||
| T10max (seconds) | n = 28 | 6.7 (1.3) | 7.7 (1.9) | 9.0 (2.9) | < 0.001 *** | 0.58 |
| m (n = 9) | 7.2 (1.3) | 8.6 (2.1) | 10.6 (2.8) | - | - | |
| f (n = 19) | 6.4 (1.3) | 7.2 (1.6) | 8.2 (2.7) | - | - | |
| TUG (seconds) | n = 28 | 9.1 (2.0) | 10.2 (2.1) | 11.2 (3.6) | 0.002 ** | 0.40 |
| m (n = 9) | 9.8 (2.2) | 10.8 (1.9) | 12.5 (3.1) | - | - | |
| f (n = 19) | 8.7 (1.9) | 9.9 (2.2) | 10.6 (3.7) | - | - | |
| STEP (steps) | n = 22 | 15 (1.4) | 14 (1.4) | 8 (2.6) | 0.004 ** | 0.43 |
| m (n = 6) | 13 (1.3) | 13 (1.1) | 8 (1.8) | - | - | |
| f (n = 16) | 16 (1.4) | 14 (1.5) | 8 (3.0) | - | - | |
Mean and standard deviation (SD) are presented for dynamic stability and walk tests (seconds and steps). One-way repeated measures ANOVA was conducted for the whole group only, showing a significant effect for time in all tests. Abbreviations: SD, standard deviation; sig, significance; n, number; m, males; f, females.
Table 4
Means and % changes over time for the leg muscle force (in newtons) and the performance-based tests of dynamic stability for the whole group
| Variable | Baseline | % change year 0–5 | Year 5 | % change year 5–10 | Year 10 | % change year 0–10 | Paired t-test p-value |
| Hip flexors | 169 | –6% | 159 | –9% | 144 | –15% | 0.213 |
| Knee extensors | 291 | –3% | 282 | –14% | 244 | –16% | 0.027* |
| Knee flexors | 107 | –7% | 100 | –44% | 56 | –48% | < 0.001*** |
| Ankle dorsiflexors | 143 | –9% | 130 | –32% | 89 | –38% | 0.016* |
| T10max (seconds) | 6.7 | 15% | 7.7 | 17% | 9.0 | 34% | 0.27 |
| TUG (seconds) | 9.1 | 12% | 10.2 | 10% | 11.2 | 23% | 0.94 |
| STEP (steps) | 15 | –7% | 14 | 43% | 8 | 47% | < 0.001*** |
A post-hoc paired t-test was performed to detect any difference in changes between year 0–5 and year 5–10.
Number of falls
The median (min-max) number of unintentional falls during the preceding year had increased in the whole group at the 10-year assessment: n = 2(0–35) compared to baseline: n = 1(0–15). The number (%) of persons experiencing at least one fall during the previous year had increased from 12 (35%) to 18 (53%). The falls had in some individuals increased and in other cases decreased. Among the males ten out of 11 (91%) had fallen, in contrast to the females, where eight out of 23 (35%) had fallen.
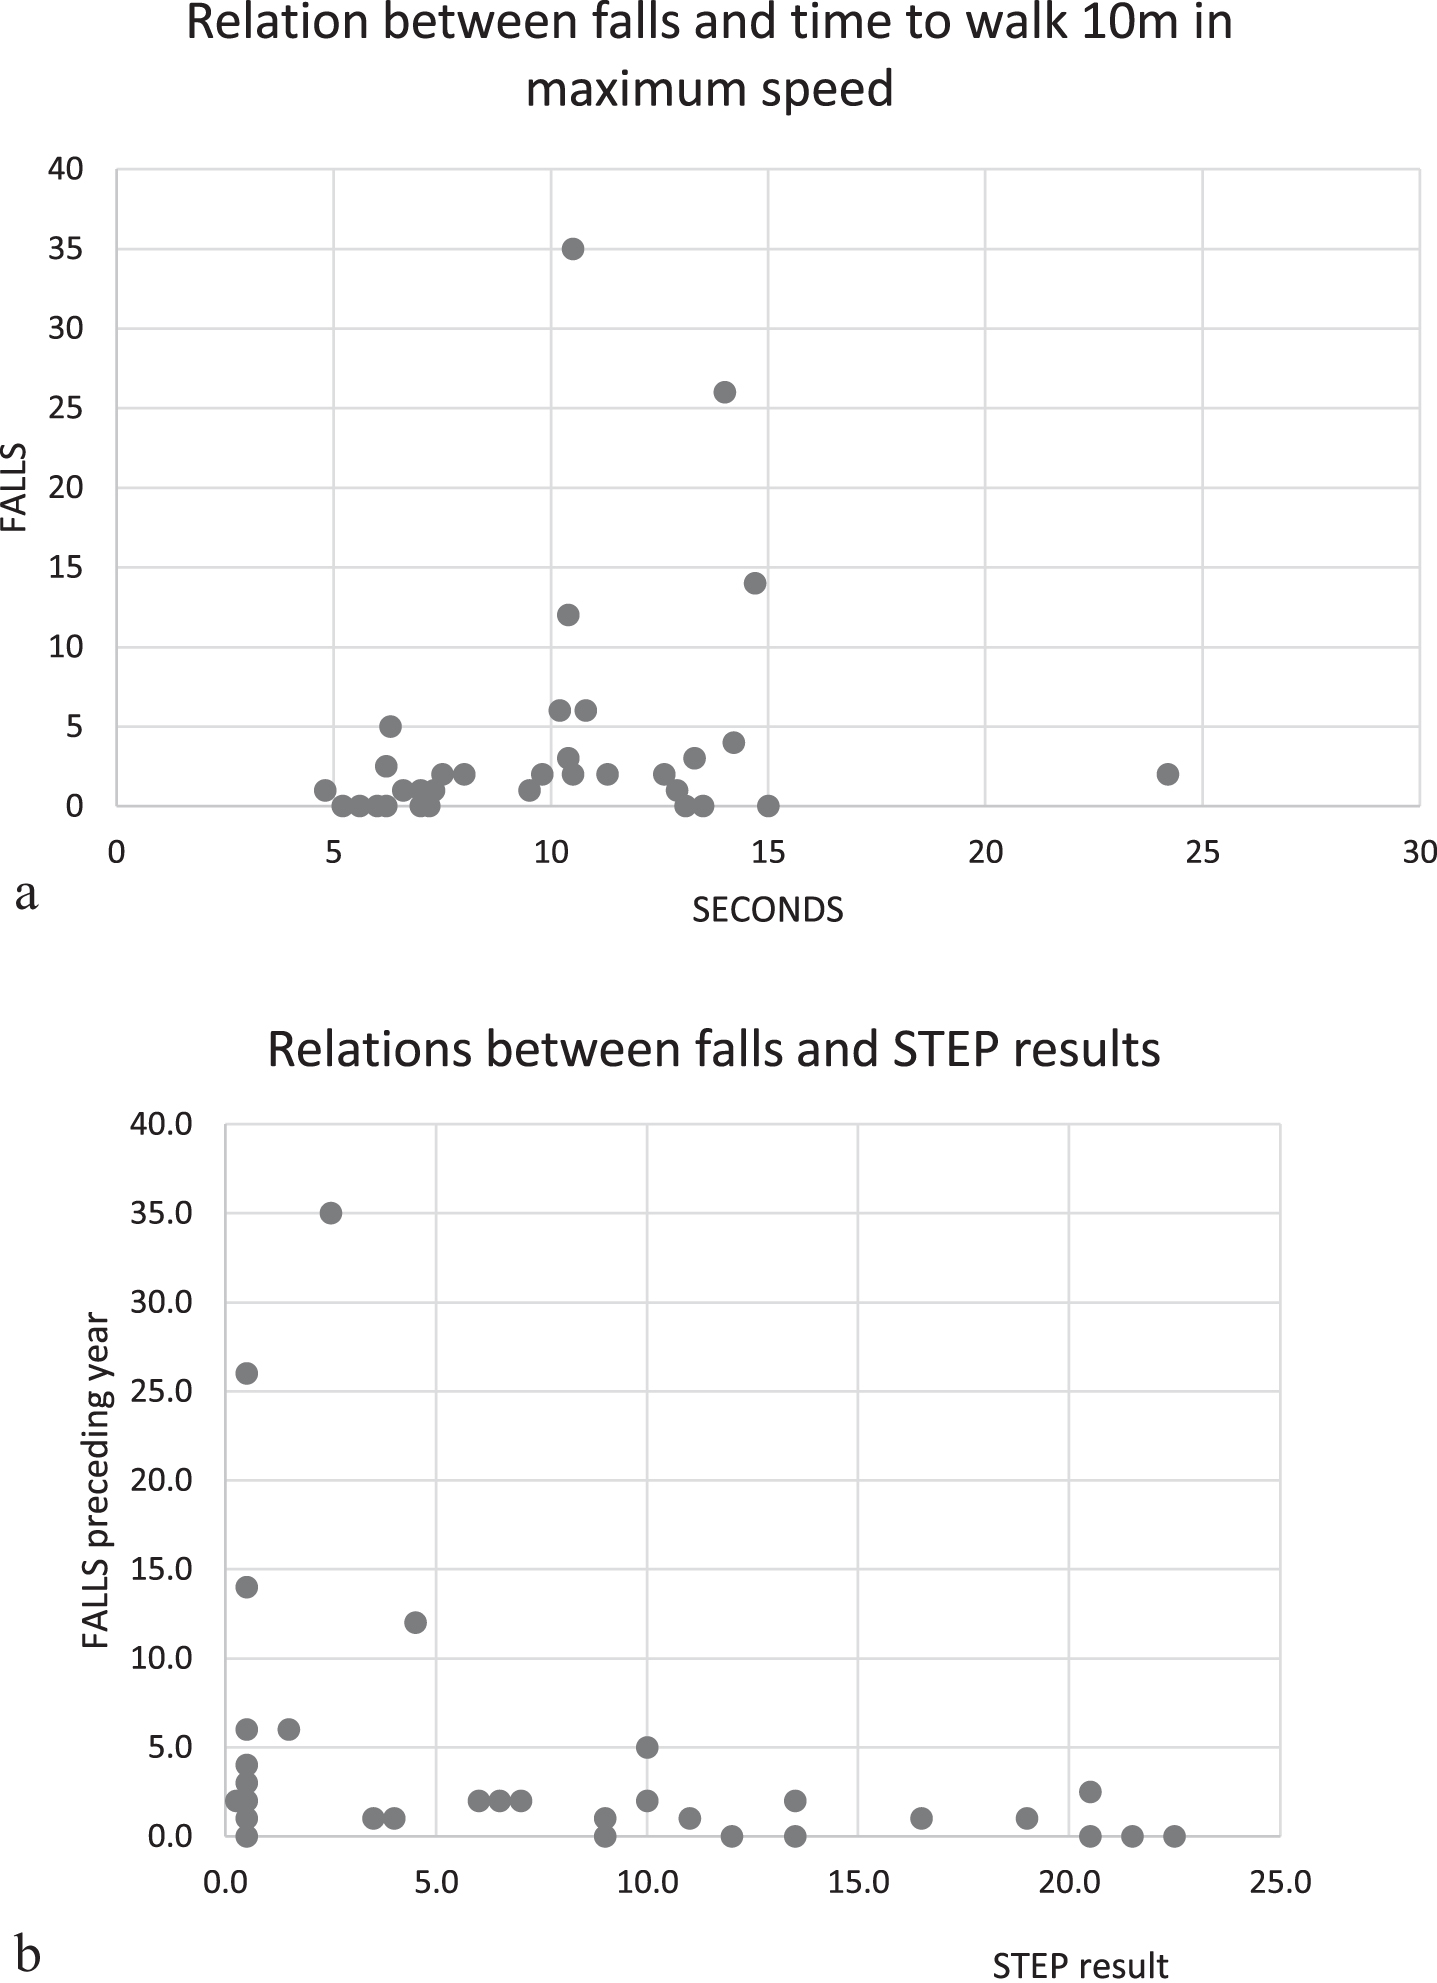
The number of unintentional falls in the year preceding the 10-year assessments showed a strong correlation with T10max (ρ 0.633, p-value < 0.001), a slower walk indicated by a longer walking time in T10max was related to a higher number of falls, Table 5. Indeed, frequent fallers were only seen among those who walked 10 meters on a time surpassing 10 seconds, Fig. 3a. There was also a statistically significant correlation between the number of falls and STEP test (ρ= –0.403, p-value = 0.020), the fewer steps you were able to perform, the higher was the risk of numerous falls. All frequent fallers the preceding year had 5 steps or less in STEP test, Fig. 3b.
Table 5
Correlation between falls and ankle dorsiflexion force, STEP and Timed 10 m walk in maximum speed (T10max)
| Ankle dorsiflexion (N = 33) | STEP (N = 29) | T10max (N = 34) | ||
| Falls (N = 34) | Spearman’s ρ | –0.376* | –0.403* | 0.633** |
| p-value | 0.029 | 0.020 | < 0.001 |
Accidental falls during the year preceding the assessments, estimated by the individuals, show correlation with the assessments including a forefoot lift at ten-year follow-up in the analysis with Spearman’s correlation coefficient (rho).
Fig. 3
Scatterplots showing the number of patient-reported unintentional falls the year preceding the 10-year assessment in relation to: a) Timed 10 m walk in maximum speed, frequent fallers were seen among those who walked 10 meters on a time surpassing 10 seconds (frequent faller defined as having more than five unintentional falls the preceding year). b) The performed number of steps in STEP test at 10-year assessment. Frequent fallers were only seen among those with less than 5 steps in STEP test.
DISCUSSION
We have followed a DM1 cohort for ten years. Deteriorations were seen in both distal and proximal muscles, as well as in performance-based measures of dynamic stability. Specifically, we could notice a large deterioration in the ankle dorsiflexors. Some participants showed a large decrease in the knee extensors, other had a larger decrease in the knee flexors. In our cohort more males had a decrease in the knee extensor force, and more females in the knee flexor force. These knee muscle groups are of great importance when stabilising the knee for the maintenance of the postural stability in walking and other dynamic actions, or in more static postures. Not quantified in our study, but also very important is the plantar flexor force. Stumbling has been shown to be very common in patients with myotonic dystrophy due to the weak ankle muscles [7, 15]. Most participants in our study reported a decline in walking ability, and on group level an increase in median number of falls was shown.
Among the participants in our study that fell repeatedly the TUG time was not especially extended. On the other hand, all participants who reported six or more falls in the preceding year had less than five steps in STEP and a Timed 10-meter walk in maximum speed exceeding 10 seconds.
Frequent fallers were only seen among participants with a slow walking (T10max) and difficulty to perform foot lifting onto a box (STEP). This result enhances the urge for intervention studies of aids as ankle foot orthoses to compensate for weak ankle dorsiflexors, not only to make the walking easier but also to diminish the number of falls.
We want to stress the importance of detecting the patients that could be at risk for experiencing an increase in number of falls. Our recommendation is to include the use of dynamic stability tests together with muscle force assessments in the clinical practice. Both ankle muscle force and knee muscle forces seem relevant to follow.
Study limitations
Muscle force decline has been shown to be amenable to DM1 form, and studying the whole group without concern about this could violate the results. Nevertheless, splitting the cohort in two subgroups depending on disease duration did not show any differences.
Neuromuscular transmission abnormalities, insufficient visual input, fatigue and cognitive stress are known contributors to impaired postural control. There is a need for a wider understanding of the evolvement of the balance impairment and falls of the person with DM1, also in respect of these variables, which were not included in this long-term study.
Only muscle groups easily assessed with handheld dynamometry in the clinical setting were examined. Other potentially important muscle groups for walking, mobility and functional balance, e.g. the trunk muscles, hip extensors and plantar flexors were not examined. These muscle groups could be worth considering in future studies, if other measurement instruments are available. A standardised assessment of muscle force could contribute to a deeper understanding of the underlying reasons for the individual functional performance and which muscles contribute the most to the falls. It sometimes could bring the clinician closer to the patient’s core problem than the performance-based measures are able to.
This descriptive study was aimed to be as large as possible and was performed with all eligible (and accepting) patients with DM1 at that time known at the Neuromuscular Centre, Sahlgrenska University Hospital, why no power estimation was done. During the ten years of observation, two persons died before the five-year assessment. Another five of the participants passed away during the following years preceding the 10-year assessment. The remaining participants were contacted by mail and/or phone. During the year of the final assessment (2017) another six persons passed away, nevertheless five of these had been able to participate in the ten-year assessment before their decease. Altogether this loss of participants was detrimental for the study, hindering further subgroup analyses.
A larger study sample would therefore be recommended to enable subgroup analyses in the future.
Future studies
Further studies are demanded to evaluate if rehabilitation interventions including alternative postural control strategies could diminish fall rate and injuries and enhance a fully accomplished participation.
CONCLUSIONS
We have followed a DM1 cohort during a time of ten years and could see a serious decrease in the distal ankle muscle force. Also knee extensor force and knee flexor force showed large weakening in ten years. These three muscle groups are known to be essential for the performance of walk and the maintenance of stability. Most participants had experienced a decline in walking ability and an increased number of falls. Although our sample was too small to make subgroup analyses, the males reported worse walking ability and more falls than the females, which might support the assumption of sex difference in deterioration shown in other studies.
ACKNOWLEDGMENTS INCLUDING SOURCES OF SUPPORT
We want to direct a special thanks to the persons with DM1 who have given us so much of their precious time. We also want to direct our deep appreciation to our friends and colleagues in the prospective study Dr Christopher Lindberg and Dr Gunilla Kjellby-Wendt. This work was supported by grants from the Council of Research and Development of Göteborg and southern Bohuslän, and Muskelfonden, Sweden. The funding sources have had no influence over the study, neither design, conduction, nor the report of the study.
CONFLICT OF INTEREST
The authors have no conflict of interest to report.
SUPPLEMENTARY MATERIAL
[1] The appendix is available in the electronic version of this article: https://dx.doi.org/10.3233/JND-200521.
REFERENCES
[1] | Ahlstrom G , Gunnarsson LG , Leissner P , Sjoden PO . Epidemiology of neuromuscular diseases, including the postpolio sequelae, in a Swedish county. Neuroepidemiology. (1993) ;12: (5):262–9. |
[2] | Lopez de Munain A , Cobo AM , Saenz A , Blanco A , Poza JJ , Martorell L , et al. Frequency of intergenerational contractions of the CTG repeats in myotonic dystrophy. Genet Epidemiol. (1996) ;13: (5):483–7. |
[3] | Ranum LP , Cooper TA . RNA-mediated neuromuscular disorders. Annu Rev Neurosci. (2006) ;29: :259–77. |
[4] | Harper PS . Myotonic dystrophy - the clinical picture. 3rd ed. London: Saunders; (2001) . |
[5] | Winblad S , Lindberg C , Hansen S . Cognitive deficits and CTG repeat expansion size in classical myotonic dystrophy type 1 (DM1). Behav Brain Funct. (2006) ;2: :16. |
[6] | De Antonio M , Dogan C , Hamroun D , Mati M , Zerrouki S , Eymard B , et al. Unravelling the myotonic dystrophy type 1 clinical spectrum: A systematic registry-based study with implications for disease classification. Rev Neurol (Paris). (2016) ;172: (10):572–80. |
[7] | Johnson ER , Abresch RT , Carter GT , Kilmer DD , Fowler WM Jr ., Sigford BJ , et al. Profiles of neuromuscular diseases: Myotonic dystrophy. Am J Phys Med Rehabil. (1995) ;74: (5):S104–16. |
[8] | Mathieu J , Boivin H , Richards CL . Quantitative motor assessment in myotonic dystrophy. Can J Neurol Sci. (2003) ;30: (2):129–36. |
[9] | Nitz JC , Burns YR , Jackson RV . A longitudinal physical profile assessment of skeletal muscle manifestations in myotonic dystrophy. Clin Rehabil. (1999) ;13: (1):64–73. |
[10] | Raymond K , Levasseur M , Mathieu J , Desrosiers J , Gagnon C . A 9-year follow-up study of the natural progression of upper limb performance in myotonic dystrophy type A similar decline for phenotypes but not for gender. Neuromuscul Disord. (2017) ;27: (7):673–82. |
[11] | Whittaker R , Ferenczi E , Hilton-Jones D . Myotonic dystrophy: Practical issues relating to assessment of strength. J Neurol Neurosurg Psychiatry. (2006) ;77: (11):1282–3. |
[12] | Hammarén E , Kjellby-Wendt G , Lindberg C . Muscle force, balance and falls in muscular impaired individuals with myotonic dystrophy type A five-year prospective cohort study. Neuromuscul Disord. (2015) ;25: (2):141–8. |
[13] | Gagnon C , Petitclerc É , Kierkegaard M , Mathieu J , Duchesne É , Hébert LJ . A 9-year follow-up study of quantitative muscle strength changes in myotonic dystrophy type 1. J Neurol. (2018) ;265: (7):1698–705. |
[14] | Jiménez-Moreno A , Raaphorst J , Babačić H , Wood L , van Engelen B , Lochmueller H , et al. Falls and resulting fractures in myotonic dystrophy: Results from a multinational retrospective survey. Neuromuscul Disord. (2018) ;28: (3):229–35. |
[15] | Wiles CM , Busse ME , Sampson CM , Rogers MT , Fenton-May J , van Deursen R . Falls and stumbles in myotonic dystrophy. J Neurol Neurosurg Psychiatry. (2006) ;77: (3):393–6. |
[16] | Masud T , Morris RO . Epidemiology of falls. Age Ageing. (2001) ;30: (suppl_4):3–7. |
[17] | Van der Werf S , Kalkman J , Bleijenberg G , Van Engelen B , Schillings M , Zwarts M . The relation between daytime sleepiness, fatigue, and reduced motivation in patients with adult onset myotonic dystrophy. J Neurol Neurosurg Psychiatry. (2003) ;74: (1):138–9. |
[18] | Stoll T , Huber E , Seifert B , Michel B , Stucki G . Maximal isometric muscle strength: Normative values and gender-specific relation to age. Clin Rheumatol. (2000) ;19: (2):105–13. |
[19] | Horak FB . Postural orientation and equilibrium: What do we need to know about neural control of balance to prevent falls? Age Ageing. (2006) ;35: (suppl 2):ii7–ii11. |
[20] | Podsiadlo D , Richardson S . The timed “Up & Go”: A test of basic functional mobility for frail elderly persons. J Am Geriatr Soc. (1991) ;39: (2):142–8. |
[21] | Barry E , Galvin R , Keogh C , Horgan F , Fahey T . Is the Timed Up and Go test a useful predictor of risk of falls in community dwelling older adults: A systematic review and meta-analysis. BMC Geriatrics. (2014) ;14: (1):1–14. |
[22] | Shumway-Cook A , Brauer S , Woollacott M . Predicting the probability for falls in community-dwelling older adults using the Timed Up & Go Test. Phys Ther. (2000) ;80: (9):896–903. |
[23] | Hill KD , Bernhardt J , McGann AM , Maltese D , Berkovits D . A new test of dynamic standing balance for stroke patients: Reliability, validity and comparison with healthy elderly. Physiother Can. 1996:257-62. |
[24] | Hammarén E , Kjellby-Wendt G , Kowalski J , Lindberg C . Factors of importance for dynamic balance impairment and frequency of falls in individuals with myotonic dystrophy type 1 - A cross-sectional study - Including reference values of Timed Up & Go, 10m walk and step test. Neuromuscul Disord. (2014) ;24: (3):207–15. |
[25] | WHO. Falls. Fact sheets. http://www.who.int/mediacentre/factsheets/fs344/en: World Health Organization; 2012. |
[26] | Mathieu J , Boivin H , Meunier D , Gaudreault M , Bégin P . Assessment of a disease-specific muscular impairment rating scale in myotonic dystrophy. Neurology.. (2001) ;56: (3):336–40. |
[27] | Bergland A , Jarnlo G-B , Laake K . Validity of an index of self-reported walking for balance and falls in elderly women. Advances in Physiotherapy. (2002) ;4: :65–73. |
[28] | Phillips BA , Lo SK , Mastaglia FL . Muscle force measured using “break” testing with a hand-held myometer in normal subjects aged 20 to 69 years. Arch Phys Med Rehabil. (2000) ;81: (5):653–61. |
[29] | Bäckman E , Johansson V , Häger B , Sjöblom P , Henriksson KG . Isometric muscle strength and muscular endurance in normal persons aged between 17 and 70 years. Scand J Rehabil Med. (1995) ;27: (2):109–17. |
[30] | Hammarén E , Ohlsson JA , Lindberg C , Kjellby-Wendt G . Reliability of static and dynamic balance tests in subjects with myotonic dystrophy type 1. Advances in Physiotherapy. (2012) ;14: (2):48–54. |
[31] | Lin MR , Hwang HF , Hu MH , Wu HD , Wang YW , Huang FC . Psychometric comparisons of the timed up and go, one-leg stand, functional reach, and Tinetti balance measures in community-dwelling older people. J Am Geriatr Soc. . (2004) ;52: (8):1343–8. |
[32] | Cohen J . Statistical power analysis for the behavioural sciences. Hillsdale, NJ: Laurence Erlbaum Associates. Inc; (1988) . |


