
Upregulation of Hallmark Muscle Genes Protects GneM743T/M743T Mutated Knock-In Mice From Kidney and Muscle Phenotype
Abstract
Background:
Mutations in GNE cause a recessive, adult onset myopathy characterized by slowly progressive distal and proximal muscle weakness. Knock-in mice carrying the most frequent mutation in GNE myopathy patients, GneM743T/M743T, usually die few days after birth from severe renal failure, with no muscle phenotype. However, a spontaneous sub-colony remains healthy throughout a normal lifespan without any kidney or muscle pathology.
Objective:
We attempted to decipher the molecular mechanisms behind these phenotypic differences and to determine the mechanisms preventing the kidney and muscles from disease.
Methods:
We analyzed the transcriptome and proteome of kidneys and muscles of sick and healthy GneM743T/M743T mice.
Results:
The sick GneM743T/M743T kidney was characterized by up-regulation of extra-cellular matrix degradation related processes and by down-regulation of oxidative phosphorylation and respiratory electron chain pathway, that was also observed in the asymptomatic muscles. Surprisingly, the healthy kidneys of the GneM743T/M743T mice were characterized by up-regulation of hallmark muscle genes. In addition the asymptomatic muscles of the sick GneM743T/M743T mice showed upregulation of transcription and translation processes.
Conclusions:
Overexpression of muscle physiology genes in healthy GneM743T/M743T mice seems to define the protecting mechanism in these mice. Furthermore, the strong involvement of muscle related genes in kidney may bridge the apparent phenotypic gap between GNE myopathy and the knock-in GneM743T/M743T mouse model and provide new directions in the study of GNE function in health and disease.
INTRODUCTION
GNE myopathy is a unique recessive neuromuscular disorder characterized by adult-onset, slowly progressive distal and proximal muscle weakness, and a typical muscle pathology [1]. We first identified GNE as the disease-causing gene in the large Persian Jewish cluster of GNE myopathy. All patients share a single homozygous missense mutation (M743T) [2, 3], thus confirming the founder effect hypothesis of this disorder in Middle Eastern Jews. Today, more than 200 different mutations in this same gene have been identified in GNE myopathy in non-Jewish patients worldwide [4]; for the latest updates of GNE myopathy mutations see the online GNE variation database, https://databases.lovd.nl/shared/genes/GNE.
GNE is the key enzyme in the metabolic pathway leading to the synthesis of N-acetylneuraminic acid (Neu5Ac) [5, 7], a cytosolic pathway of four consecutive reactions. Neu5Ac is the biosynthetic precursor of virtually all of the naturally occurring sialic acids, the most abundant terminal monosaccharides on glycoconjugates in eukaryotic cells [8, 9]. The biological importance of GNE is further reflected by the fact that a knockout of the gene in mice is lethal to the embryo at day 8.5 [10]. Marked GNE deficiency has not been observed in GNE myopathy patients; in fact, GNE protein is expressed at equal levels in GNE myopathy patients and normal control subjects [11]. Furthermore, no mislocalization of GNE in patients’ skeletal muscle could be documented [11, 12]: the GNE protein is cytoplasmatic in a variety of human cells including muscle.
To date, the pathophysiological pathway leading from GNE mutations to the muscle phenotype in GNE myopathy is still unclear. The obvious hypothesis of impaired sialylation in patients’ muscle cells is controversial [13–17]. Although the cellular biochemistry of GNE as a key enzyme in the biosynthesis of sialic acid has been thoroughly investigated, its comprehensive role in normal muscle remains to be determined. Besides its role in the sugar metabolism, other independent functions of GNE could be postulated, as documented in satellite cell dysfunction [18], in modulatory effects on other biochemical pathways [19], by a yet undetermined nuclear activity [12, 20] by identified association with various protein partners [21, 22], and by defects in the adhesion process [23]. In particular, effects on alpha actinins, which are part of the filament structure of the muscle sarcomere, are promising targets for furthering the understanding of the pathophysiology of GNE myopathy [24]. Reduced sialic acid production could be an epiphenomenon in the muscle pathology; alternatively, the combination of sialic acid involvement - in particular in aging muscle [25] - with additional functions, could be the cause of GNE myopathy.
The established mouse models are also difficult to interpret vis-a-vis pathophysiology of the human disease[26–28], although GNE is highly conserved between human and mouse. Knock-in mice generated by homologous recombination to introduce the GneM743T/M743T mutation, usually die few days after birth from severe renal failure, with no muscle phenotype [27, 28]. In contrast, a subcolony of GneM743T/M743T mice developed in our laboratory, was spared from kidney pathology. These mice were healthy and usually did not manifest either kidney disease or muscle weakness and histopathology changes, throughout their normal life span. Occasionally and at variable adult ages, some of them did develop the kidney disease, but still with no muscle pathology, even at very advanced age (up to 2 years) [28]. The lack of renal involvement in GNE myopathy patients and the lack of muscle phenotype in GneM743T/M743T sick or healthy mice, hamper conclusions on GNE myopathy mechanism in humans and its potential treatment. However, the existence of the healthy GneM743T/M743T mice subcolony could indicate that in those homozygous healthy mice there is a protecting mechanism which prevents the appearance and development of the kidney phenotype, and possibly also from muscle pathology. In an attempt to understand the various mechanisms involved in generating our phenotypically unique GneM743T/M743T mice, we have performed a comprehensive comparative study comprising transcriptomic and proteomic analyses of kidneys and muscles of the two GneM743T/M743T knock-in phenotypes, kidney sick and healthy, and of control (wild-type) Gne+/+ mice. We describe altered pathways in kidney-affected and kidney-unaffected mice, in particular the up-regulation of muscle related genes in the kidney of healthy-mutated mice. Our results may bridge the apparent phenotype gap between human GNE myopathy and the GneM743T/M743T knock-in mice model.
MATERIALS AND METHODS
Biological samples
The GneM743T/M743T knock-in mice were generated and characterized as described previously [28]. The colony was maintained at the SPF animal facility of the Hebrew University Hadassah Medical School. Sick GneM743T/M743T mice were sacrificed for tissue collection according to the beginning of symptoms appearance (general behavior and weight loss for 2 consecutive weeks). Healthy GneM743T/M743T mice, as well as control Gne+/+ mice of the same litter were sacrificed concomitantly. In this study we have analyzed mice up to 3 months of age. Since we have not seen any differences between males and females, only males were analyzed. As biological repeats for statistical purposes, we have analyzed 4 mice of similar age (up to 3 months) for each genotype/phenotype. All animal procedures were performed in accordance with institutional guidelines under protocols approved by the Institutional Committee for Animal Care of the Hebrew University Hadassah Medical Center.
After sacrifice, kidneys and muscles (gastrocnemius, tibialis anterior and quadriceps) were collected from each of those mice for histological examination and snap frozen for RNA and proteomics analysis. To ensure that the only difference in the Gne gene between the 3 mice groups, at the DNA level, was the M743T mutation, the entire GNE coding sequence was verified by Sanger sequencing in each of them.
RNA sequencing and analysis
RNA was extracted from mouse tissues using the miRvana Ambion kit and subsequently treated with DNase. For kidneys, final elution was in 35μl and concentrations between 62 to 124 ng/ μl. Average RIN was 9 (in a range from 8.5 to 9.5). For muscles, final elutions were also in 35 μl and concentrations between 20–40 ng/ μl. Average RIN was 8.50 (in the range from 7.60 to 9.50). The mRNAs libraries were prepared at the Technion Genome Center, Haifa, from 200 ng RNA and sequenced on an Illumina HiSeq 2500 for 50 cycles of single-end reads. Low quality (q < 32) and adapter sequences were removed, with Trim Galore! (version 0.3.7). Low quality reads were filtered out with the FASTX package (version 0.0.14). The processed reads were aligned against the mouse genome GRCm38, with Ensembl release 75 annotations, with TopHat2 (version 2.0.11), and raw counts for each gene were calculated with the Cufflinks package (cuffquant and cuffnorm, version 2.2.1), taking advantage of the – multi-read-correct option in order to account for reads that were not uniquely aligned. Normalization and differential expression were done with the DESeq2 package (version 1.12.4). For kidney, the significance threshold was taken as padj < 0.1, testing for a log fold change greater than 0.5 (lfc threshold parameter to the results method). For muscles, the significance threshold was padj < 0.1 and abs(log2FoldChange) > (5/sqrt(baseMean) + 0.6). A description of the parameters and all RNA-seq data files can be found under GEO accession number GSE141302 [29].
Real time PCR
Real time PCR was performed for validation of the relative expression of representative genes. The same RNA samples (stored at –80C) that were previously sequenced were used for this purpose. RNA samples (4μg) were treated with DNase (Turbo DNA free kit AM1907, Ambion) and reverse transcribed with random primers, with Superscript-III reverse transcriptase (Invitrogen). Real time PCR was performed in a StepOnePlus Real time PCR systems with the following probe assays (Thermo-Fisher Scientific USA) Hprt, Mm00446968_m1; Myh1, Mm01332489_m1; Ttn, Mm00658612_g1;Col12a1, Mm01148576_m1; Serpine 1, Mm00435858_m1; Hspb1, Mm00834384_g1; Actn2, Mm00473657_m1; Foxo1, Mm00490671_m1; Fhl1,Mm04204611_g1; Hspa1b, Mm03038954_s1.
Analysis for the Myh1 and Ttn genes were done after the RNA samples were stored for a long period of time at –80°C. All samples were of good quality except the ones extracted from kidneys of the W genotype. Therefore, only the H and the S states were compared in this analysis.
All samples were normalized to their Hprt expression. The fold expression (relative quantity) of Coll2 a1, Serpine1, Actn2, Hspb1, Foxo1, Fhl1 and Hspab1 was calculated relative to the W state; the fold expression of Myh1 and Ttn, relative to the S state. Some p values were significant but some were not, most likely because only 2 samples of each state were analyzed.
Proteomics analyses
A second fragment of the very same biopsies used for RNA extraction was used for protein extraction. Protein extracts were trypsinized, the tryptic peptides separated and analyzed by reversed-phase capillary chromatography coupled on line to tandem mass spectrometry (uLC-MS/MS) using standard protocols. Proteomics was performed at the Technion Smoler Proteomic Center. The mass spectrometry was done on the Q Exactive plus mass spectrometer (Thermo) and the data analyzed by the MaxQuant software yielding identification and quantification of the peptides and proteins. Threshold for differentially expressed genes (DEG): Welch p value < 0.05.
Pathway enrichment analysis
DEG from RNA and protein were subjected to enrichment analysis using the metadatabases EnrichR [30] and GeneAnalytics [31]. The threshold for pathway enrichment significance was FDR < 0.0001.
Gene set enrichment analysis (GSEA). Whole differential expression data were subjected to gene set enrichment analysis using GSEA [32]. GSEA uses all differential expression data (cut-off independent) to determine whether a priori–defined sets of genes show statistically significant, concordant differences between two biological states.
Heatmaps
Heatmaps (for Figs. 3, 4, 8) were generated using Clustergrammer [33]. In Fig. 3, each row represents a gene, and color coded from blue (down) to red (up). For the transcriptome data, the “stat” parameter from DESeq2 analysis is used; for kidney proteomics data, log10pval with the sign of fold-change. Both parameters indicate the statistical significance of up and down-regulation. In Figs. 4 and 8, each row is color coded using the z-score of expression.
RESULTS
1. Molecular profiling of kidney and muscles in GneM743T/M743T and wild-type mice
To decipher the molecular mechanisms behind the phenotypic differences between healthy and sick mice, kidney and muscle samples from 3 months old male mice that were sick-mutated (GneM743T/M743T) (S), healthy-mutated (GneM743T/M743T) (H) and wild type (W) were subjected to RNA-seq and proteomics analyses. In each tissue, for both RNA and proteomics, we performed differential expression analysis of the three pairs, S/H, S/W and H/W. The genes that were significantly differentially expressed in RNA or protein (DEG: differentially expressed genes), were submitted to enrichment analysis against the meta-databases EnrichR [30] and GeneAnalytics [31]. In addition, whole expression data (non-cut-off based) was also analyzed using GSEA [32]. The experimental system is depicted in Fig. 1. This analysis revealed that genotype and phenotype dictate variance in the molecular profile of the kidney: the sick-mutated, healthy-mutated and wild type mice display distinct expression profiles, as can be seen in the PCA plot generated from RNA-seq data (Fig. 2a).
Fig.1
Experimental System for molecular profiling. Molecular profiling was carried out using differential expression and pathway enrichment analysis of RNA and proteins from kidney and muscles of sick (GneM743T/M743T), healthy (GneM743T/M743T) and wild-type mice. S: sick (GneM743T/M743T); H: healthy (GneM743T/M743T); W: wild-type.
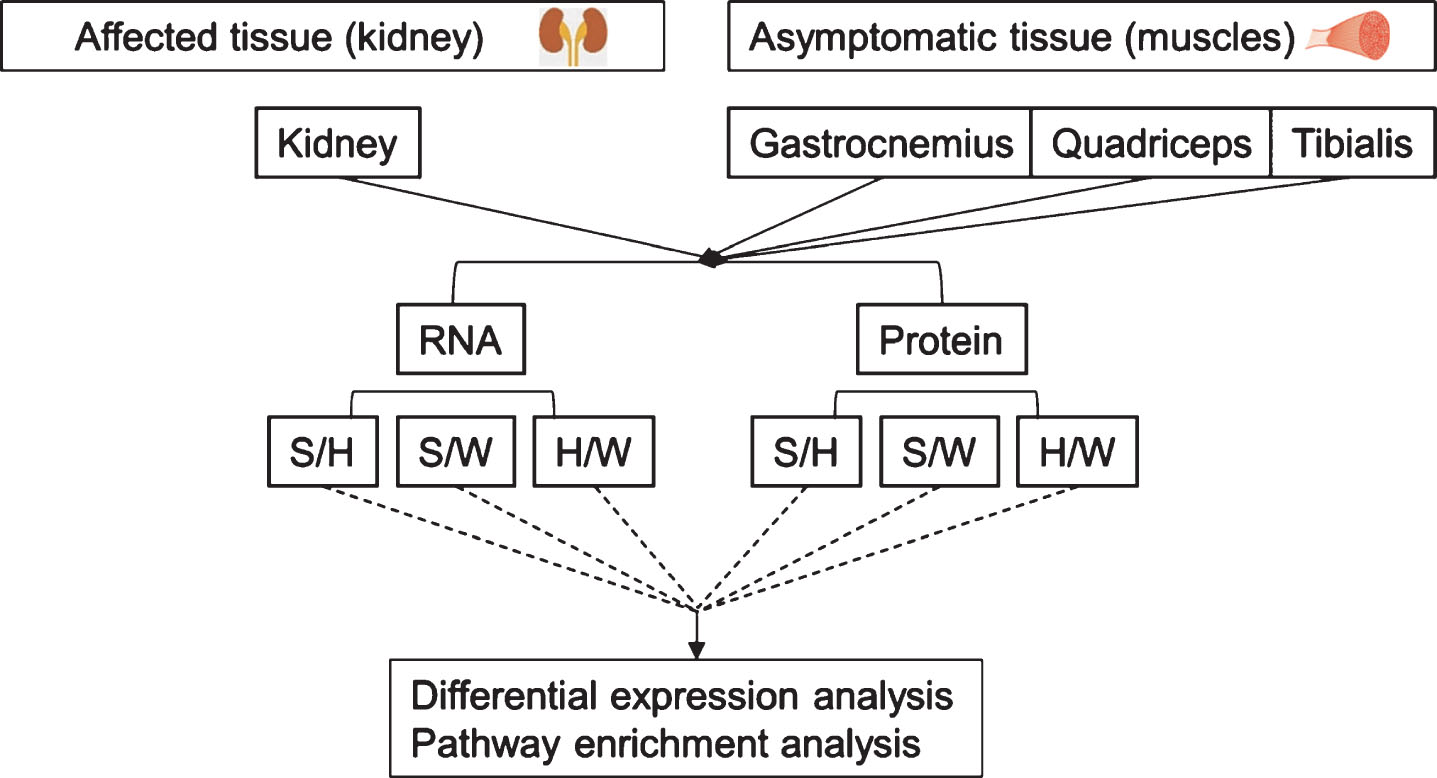
Fig.2
Principle component analysis (PCA) of RNA seq data. In kidney, A, the primary axis of variance (71%) separates the samples based on phenotype; left (W+H); right: sick (S). The secondary axis of variance (10%) separates the healthy samples based on their genotype: upper part, wild-type (W); lower part, healthy-mutated GneM743T/M743T (H). In muscles, B, samples were separated according to the kidney phenotype.
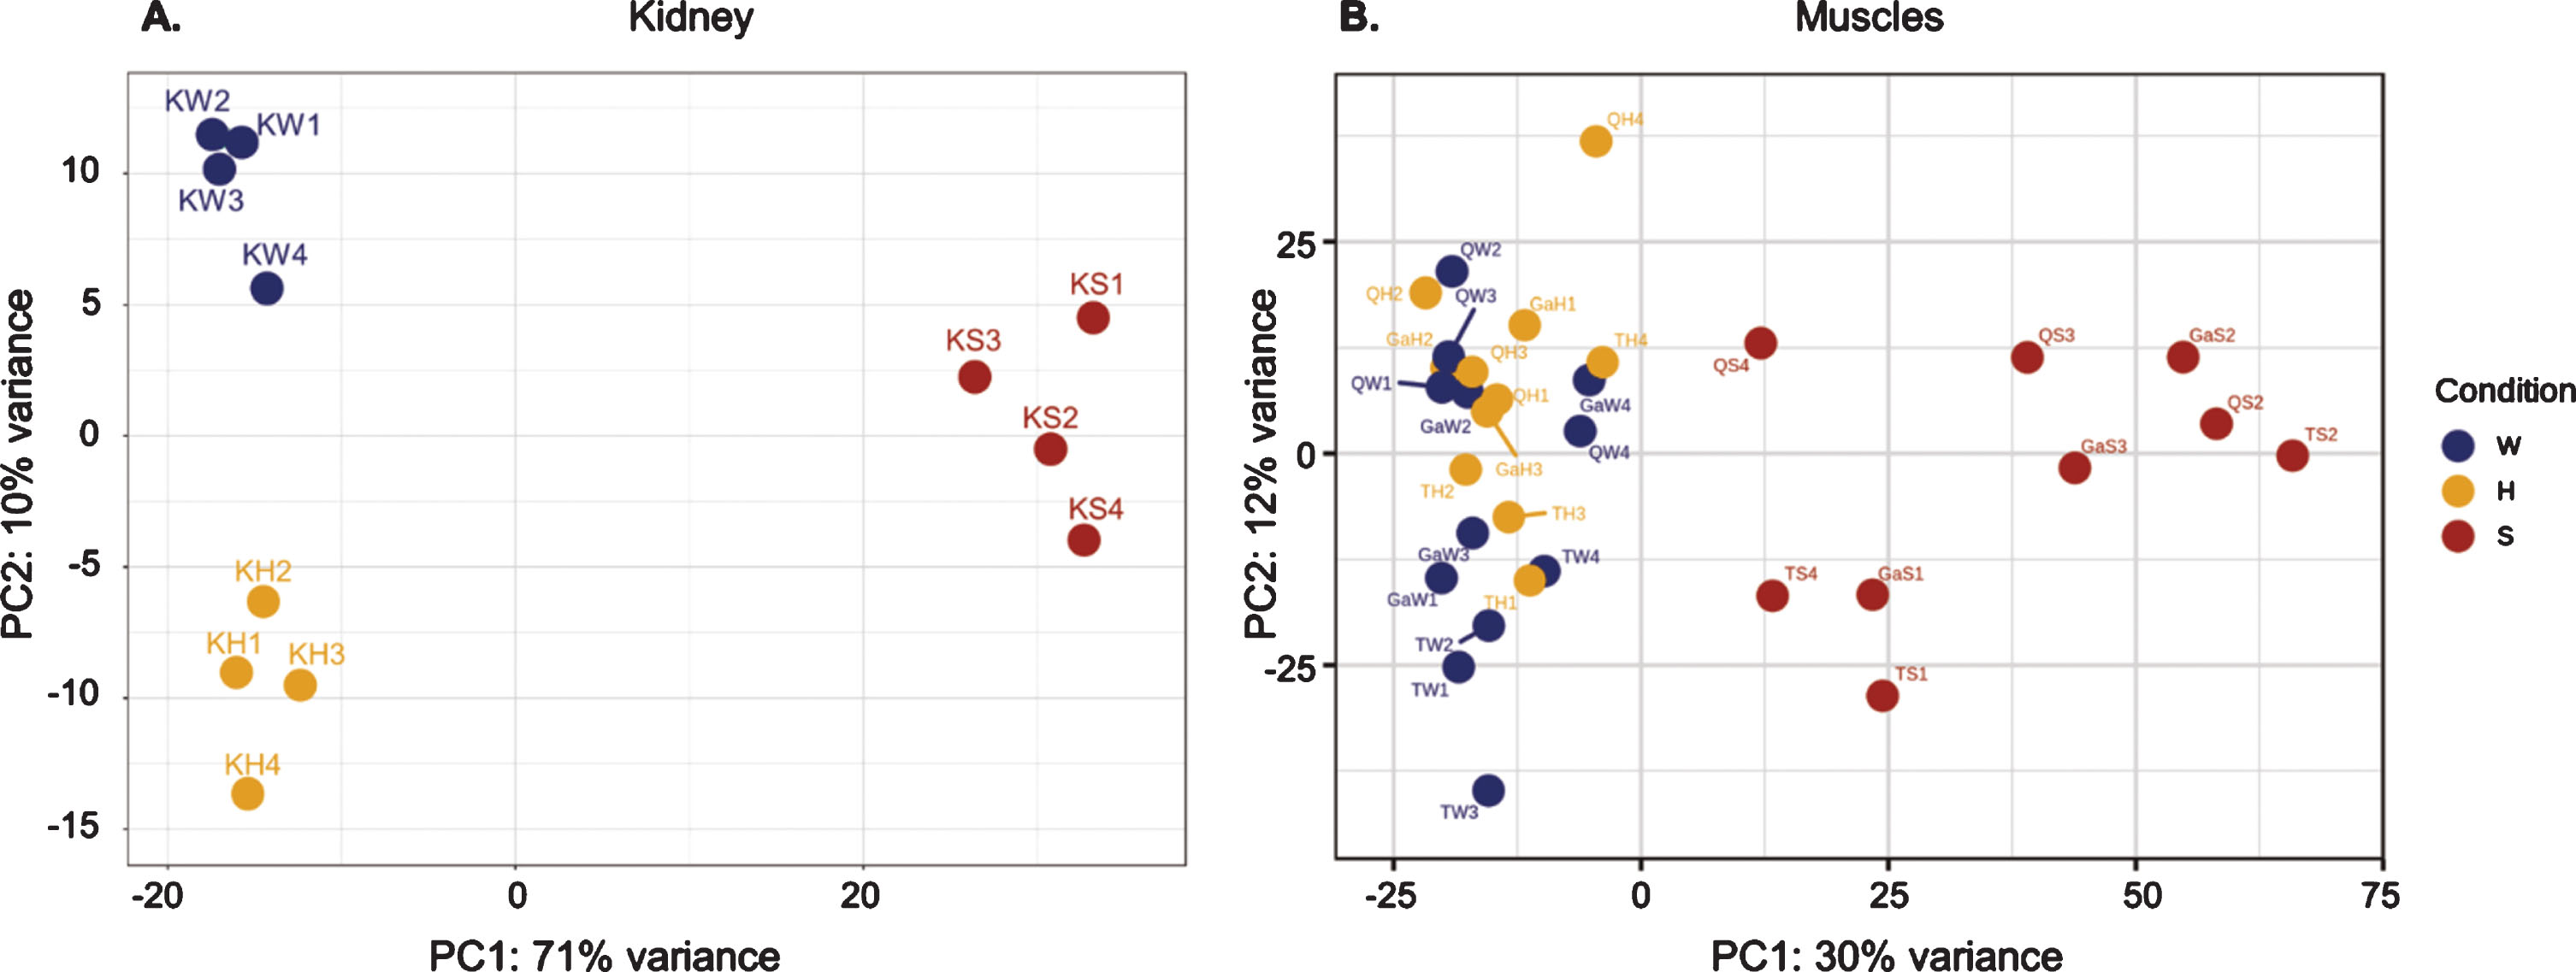
Although the muscles were not affected even in kidney sick-mutated mice, changes were observed at the molecular level, not only between “sick” and wild-type, but also between the “sick” and “healthy” mutated mice, both at RNA and protein levels. In the PCA plot for RNA-seq data (Fig. 2b), the main axis of variance (30%) separated the muscle samples based on the kidney phenotype. The samples of the healthy mice, composed of both GneM743T/M743T mutated and wild type mice, were not separated by PCA when all three muscle types were analyzed altogether.
Notably, as detailed in the following sections, RNA and protein share differentially expressed genes and enriched pathways.
2. Phenotypic molecular profile of the sick kidney of GneM743T/M743T mice
To characterize the molecular profile of the sick mice kidney, we looked at the DEG common to the two comparisons S/H and S/W. (Fig. 3a). Altered RNA and protein levels in these genes represent an effect attributed to the sick phenotype in kidney. Interestingly, most of the many DEG in the sick kidney overlap in S/W and S/H comparisons, and change in the same direction (3136 overlapping DEG out of 4226 for S/W and 3480 for S/H in RNA (75/90%); 853 overlapping DEG out of 1070 and 1050 for S/W and S/H respectively (overlap of 80%) in protein (Fig. 3b, 3c).
Fig.3
Molecular profiling of the sick GneM743T/M743T kidney phenotype. In kidney, the intersection of significantly differentially expressed genes/proteins (DEG) between the comparisons S/H and S/W in RNA and protein represents the phenotype signature (marked in the schematic Venn diagram A). These genes/proteins are framed in the heat-map visualization of DEG in RNA (B) and protein (C). Up regulated genes are colored in red, down-regulated genes in blue. Most altered genes and proteins are shared between S/H and S/W. The Figures in (B), (C) and (E) were generated using Clustergrammer ([33], see Methods for details). S: sick (GneM743T/M743T); H: healthy (GneM743T/M743T); W: wild-type. n: number of genes. Same data for muscles is depicted in (D) and (E).
![Molecular profiling of the sick GneM743T/M743T kidney phenotype. In kidney, the intersection of significantly differentially expressed genes/proteins (DEG) between the comparisons S/H and S/W in RNA and protein represents the phenotype signature (marked in the schematic Venn diagram A). These genes/proteins are framed in the heat-map visualization of DEG in RNA (B) and protein (C). Up regulated genes are colored in red, down-regulated genes in blue. Most altered genes and proteins are shared between S/H and S/W. The Figures in (B), (C) and (E) were generated using Clustergrammer ([33], see Methods for details). S: sick (GneM743T/M743T); H: healthy (GneM743T/M743T); W: wild-type. n: number of genes. Same data for muscles is depicted in (D) and (E).](https://content.iospress.com:443/media/jnd/2020/7-2/jnd-7-2-jnd190461/jnd-7-jnd190461-g003.jpg)
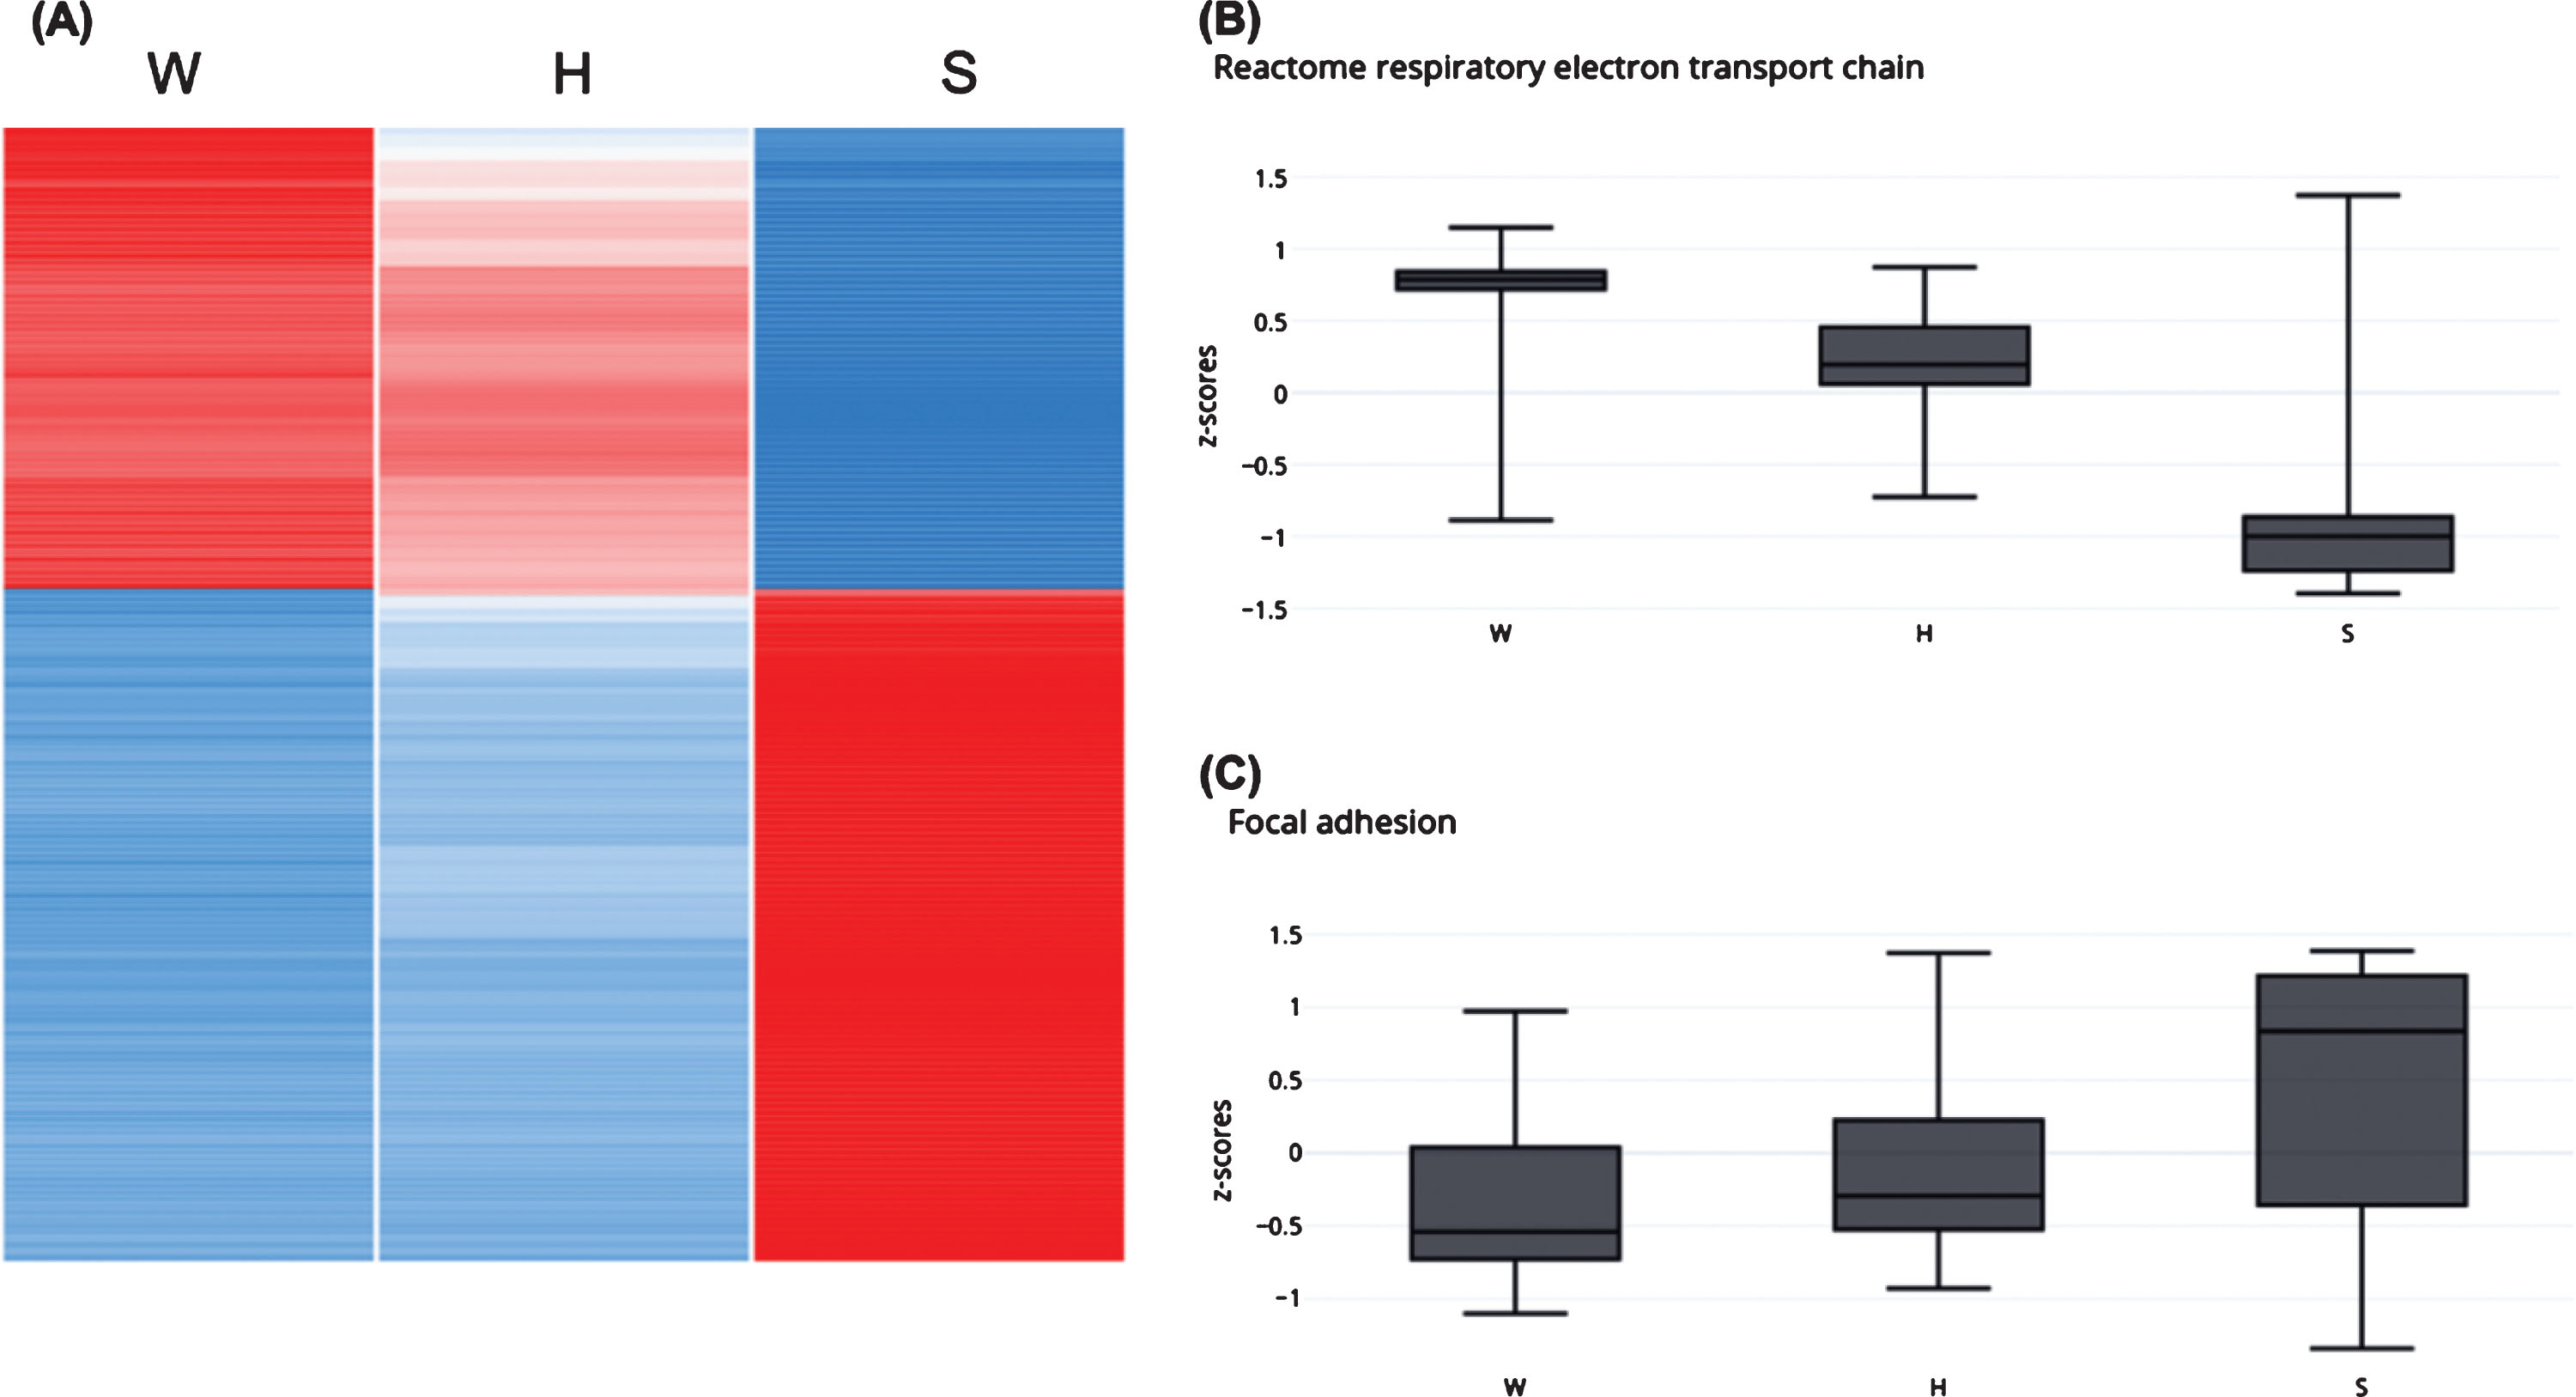
The number of DEG is higher in S/W, especially in RNA, and reflects a kinetics gradient of expression from the wild-type to the healthy GneM743T/M743T state, and further to the sick GneM743T/M743T phenotype (Fig. 4a). Beyond the overall number of DEG, this gradient is illustrated in specific enriched pathways, for example in the down-regulation of the respiratory electron transport chain and in the upregulation of focal adhesion processes (Fig. 4b, 4c): the number of DEG from the respiratory electron transport chain at the RNA level is 59 and 161 in S/H and S/W, respectively, with 58 overlapping genes. A box-plot of the z-score values of all genes in this pathway demonstrates the molecular progression from W to H to S (Fig. 4b). In 3374 DEG which are 80% of all S/W DEG and 75% of all DEG in the system, the z-score of expression in H is an intermediate between W and S (Fig. 4).
Fig.4
Molecular gradient from wild type, to healthy-mutated and to sick phenotype. The healthy GneM743T/M743T mice kidneys display intermediate molecular patterns between wild-type to sick GneM743T/M743T. (A) The heatmap depicts z-score of expression in 3374 DEG (75% of all DEG in the system) for which the healthy GneM743T/M743T mice display intermediate values between wild-type and sick GneM743T/M743T. (B) Box plot for z-score values of all genes that belong to respiratory electron transport chain pathway. This pathway is down-regulated in sick vs wild-type. (C) Box plot for z-score values of all genes that belong to the focal adhesion gene set. This pathway is up-regulated in sick vs wild-type.
Enrichment analyses of the phenotype molecular signature revealed that the up-regulated genes in sick kidneys are enriched with several related biological pathways, mainly: integrin pathway, extracellular matrix degradation, focal adhesion, collagen trimerization and degradation, cytoskeleton signaling and ERK/AKT signaling. The main down-regulated pathways are respiratory electron transport chain, oxidative-phosphorylation, carbon and amino acids metabolism and metabolite transport. The down regulation in metabolite transport pathway may explain the sick kidney phenotype.
Notably, the enriched pathways in up and in down regulated genes are consistent in RNA and protein, and result from overlapping genes (same genes are altered at the RNA and the protein level). Validation of representative genes was performed by real time PCR (Fig. 5). Table 1 and Fig. 6 illustrate the enriched pathways shared by RNA and protein.
Fig.5
Experimental validation of relative expression for representative genes in the kidney of GneM743T/M743T mice. Real time PCR was performed for the indicated genes. Col12a1 and Serpine1 are genes involved in the integrin pathway, Hspb1 in the AKT pathway. Myh1 (myosin heavy chain 1) and Ttn (titin), Actn2 (actinin2), Foxo1 are key muscle physiology genes. All data was normalized to the Hprt mouse gene. Relative quantity was calculated in kidney compared to the measure obtained from wild type (W) kidney and for muscle from the lowest expression in muscle, except for Myh1 and Ttn which was calculated compared to the measure obtained from the sick (S) kidney. H, healthy kidney.
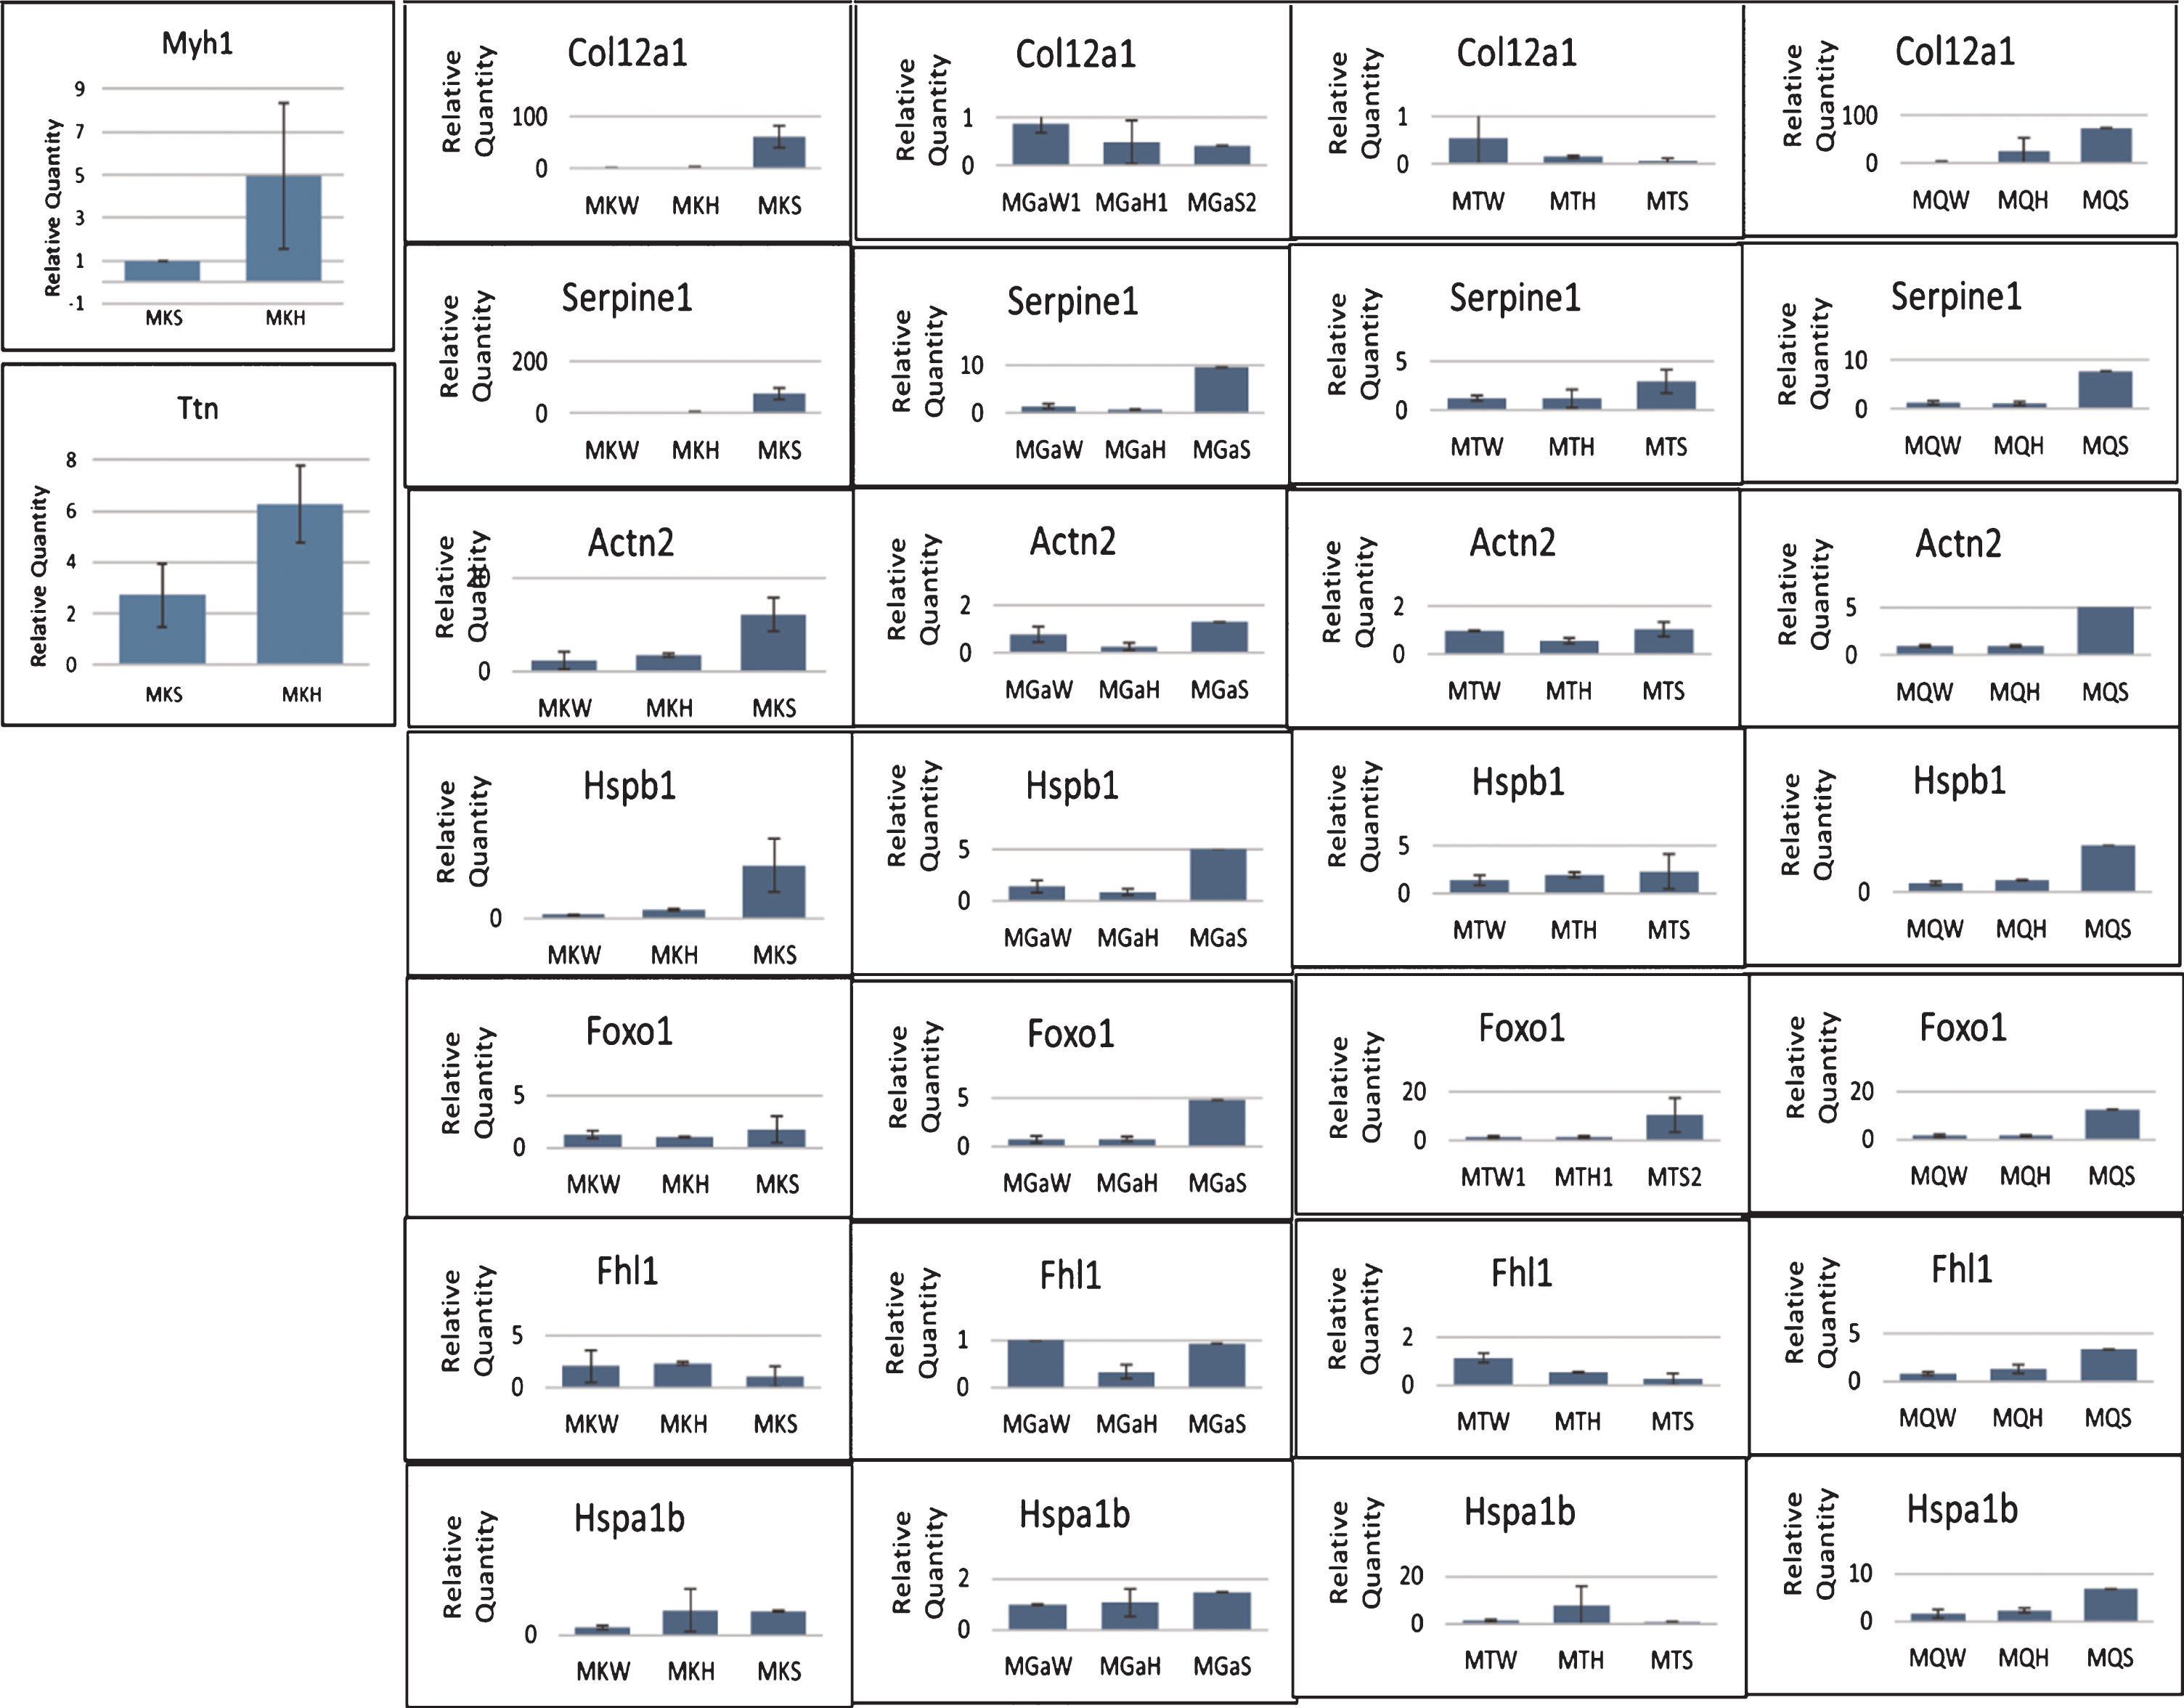
Fig.6
RNA and protein of sick phenotype kidneys share dysregulated pathways. Down-regulated genes in RNA and protein are colored in blue and light-blue, respectively. Common genes in grey. Up-regulated genes in RNA and protein are colored in red and orange, respectively. Common genes in grey.
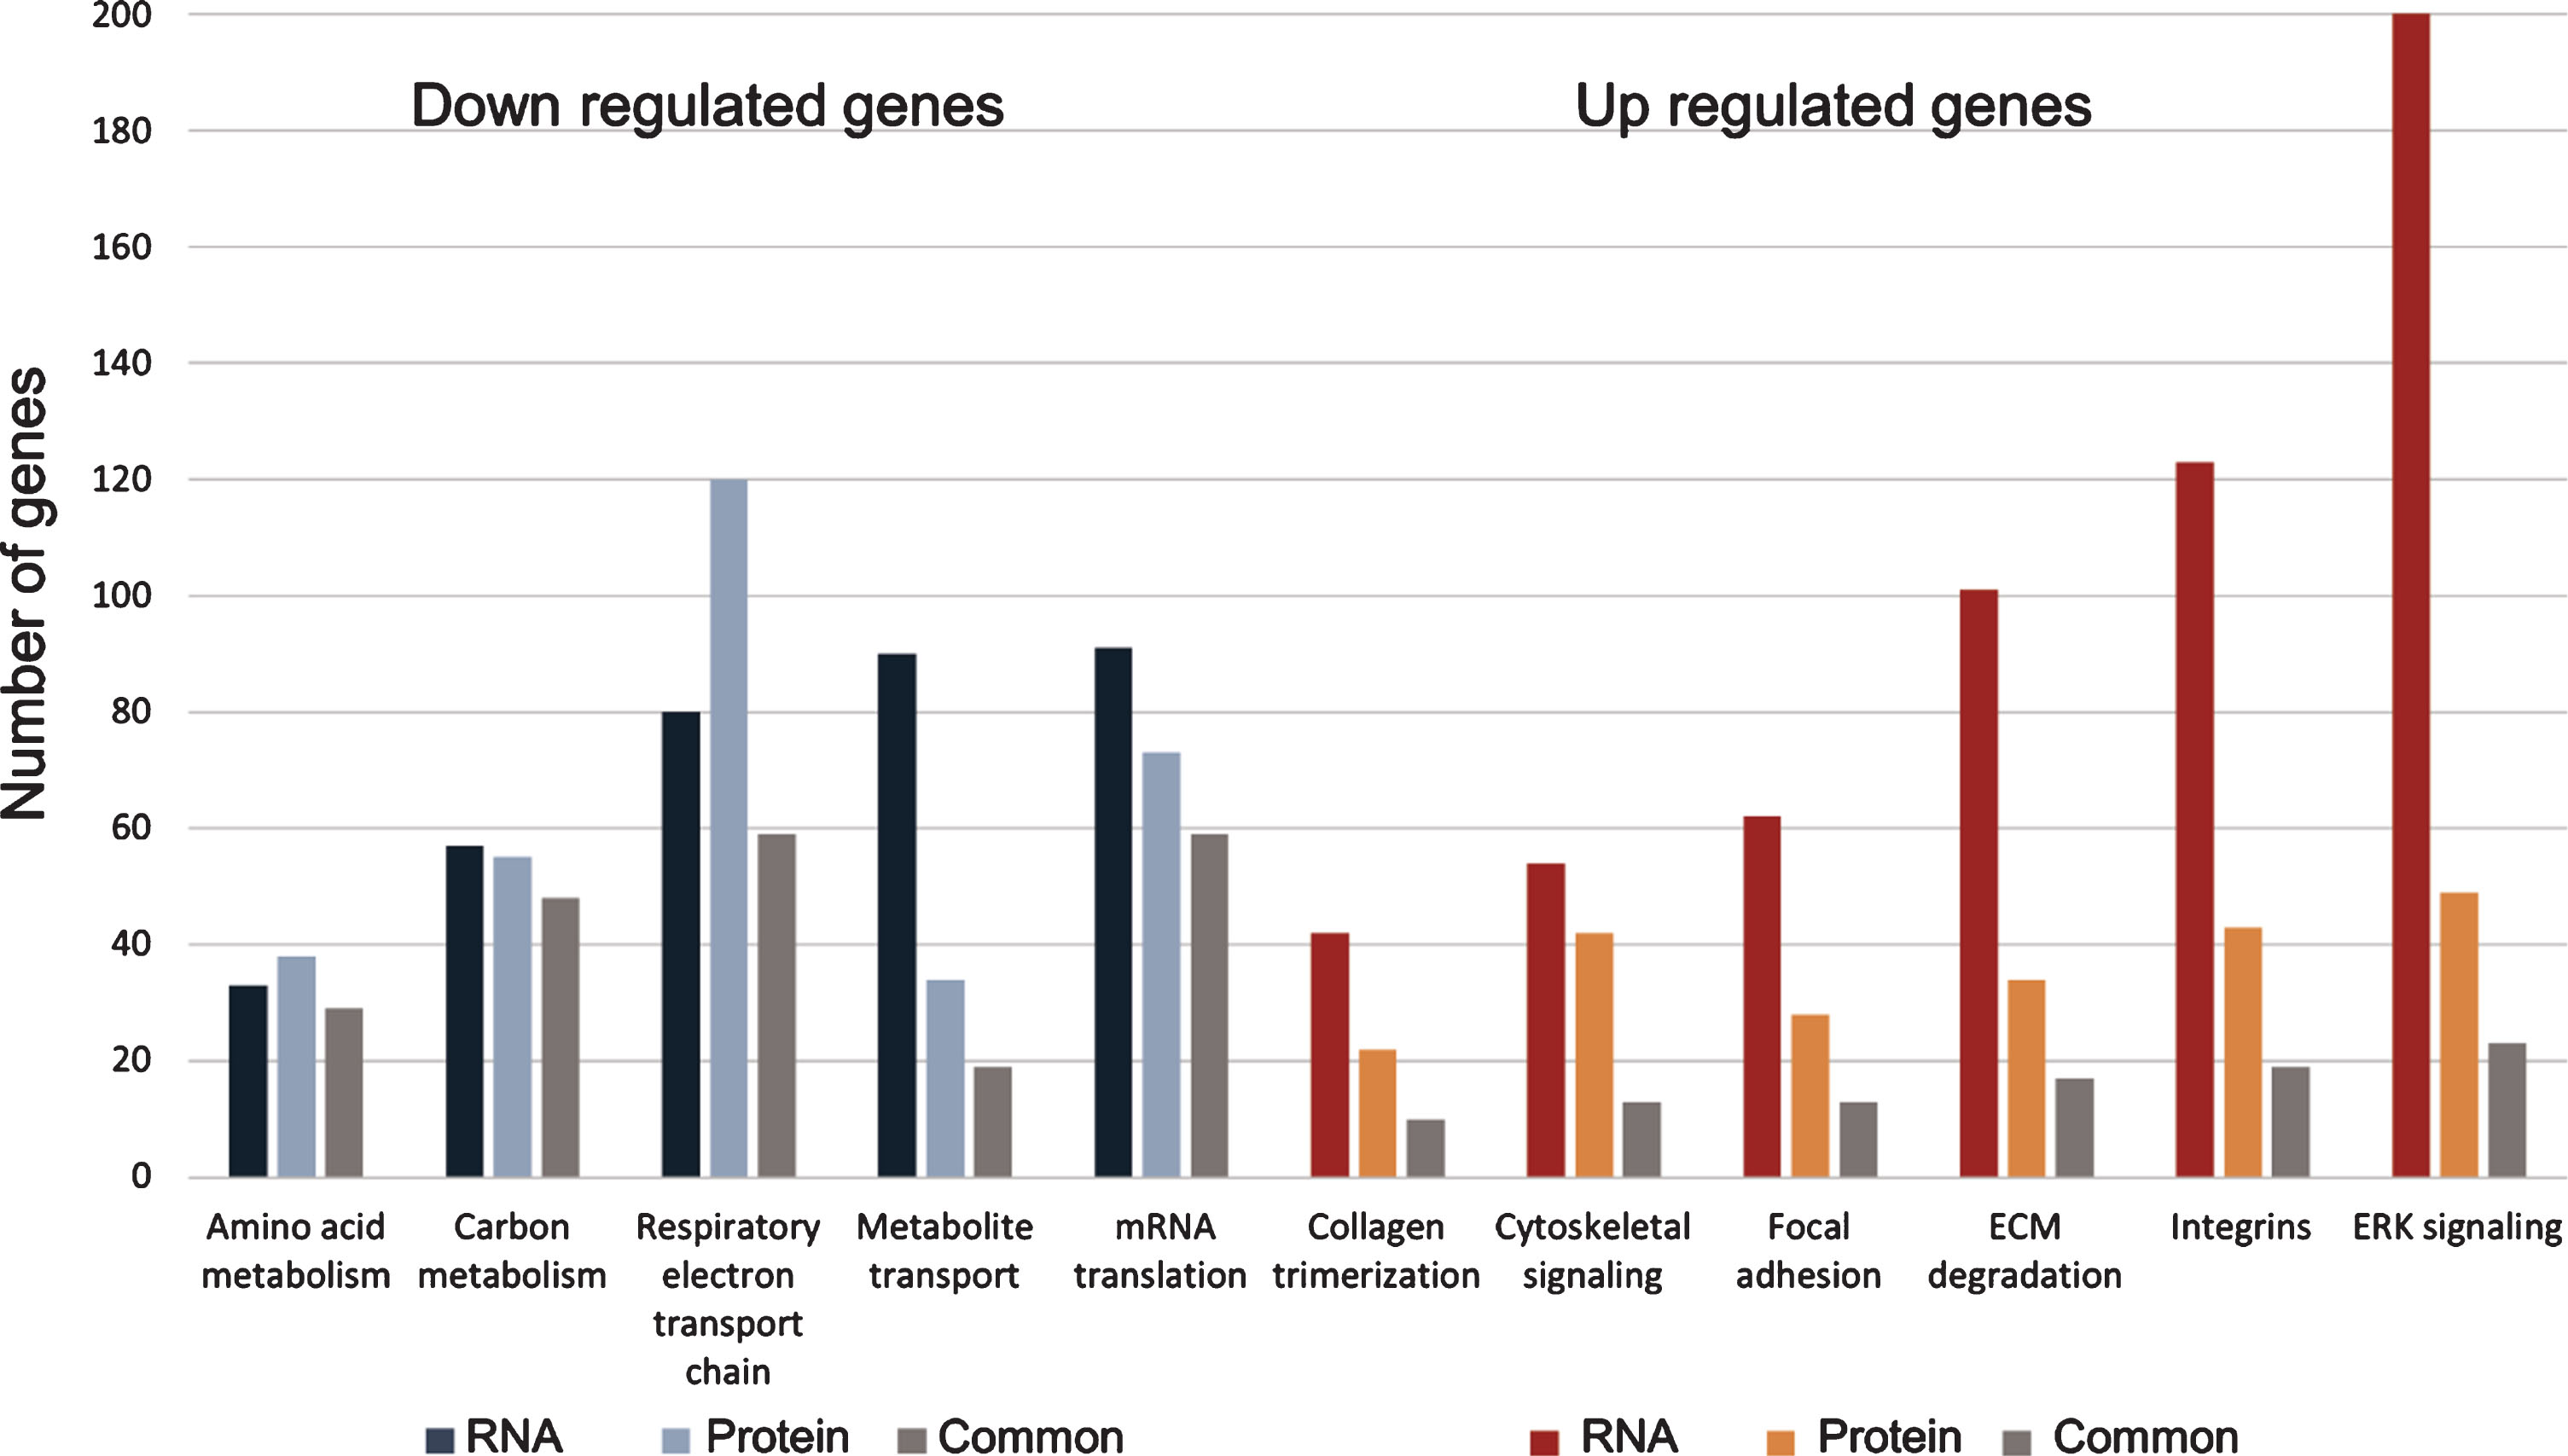
Table 1
RNA and protein in kidney of sick phenotype share dysregulated pathways
| Regulation of expression | Enriched pathway | No. of genes (RNA) | No. of proteins | No. of genes common to RNA and proteins |
| Down | Amino acid metabolism | 33 | 38 | 29 |
| Down | Carbon metabolism | 57 | 55 | 48 |
| Down | Respiratory electron transport chain | 80 | 120 | 59 |
| Down | Metabolite transport | 90 | 34 | 19 |
| Down | mRNA translation | 91 | 73 | 59 |
| Up | Collagen trimerization | 42 | 22 | 10 |
| Up | Cytoskeletal signaling | 54 | 42 | 13 |
| Up | Focal adhesion | 62 | 28 | 13 |
| Up | ECM degradation | 101 | 34 | 17 |
| Up | Integrins | 123 | 43 | 19 |
| Up | ERK signaling | 202 | 49 | 23 |
3. Sick kidneys share molecular patterns with several human renal and muscular diseases
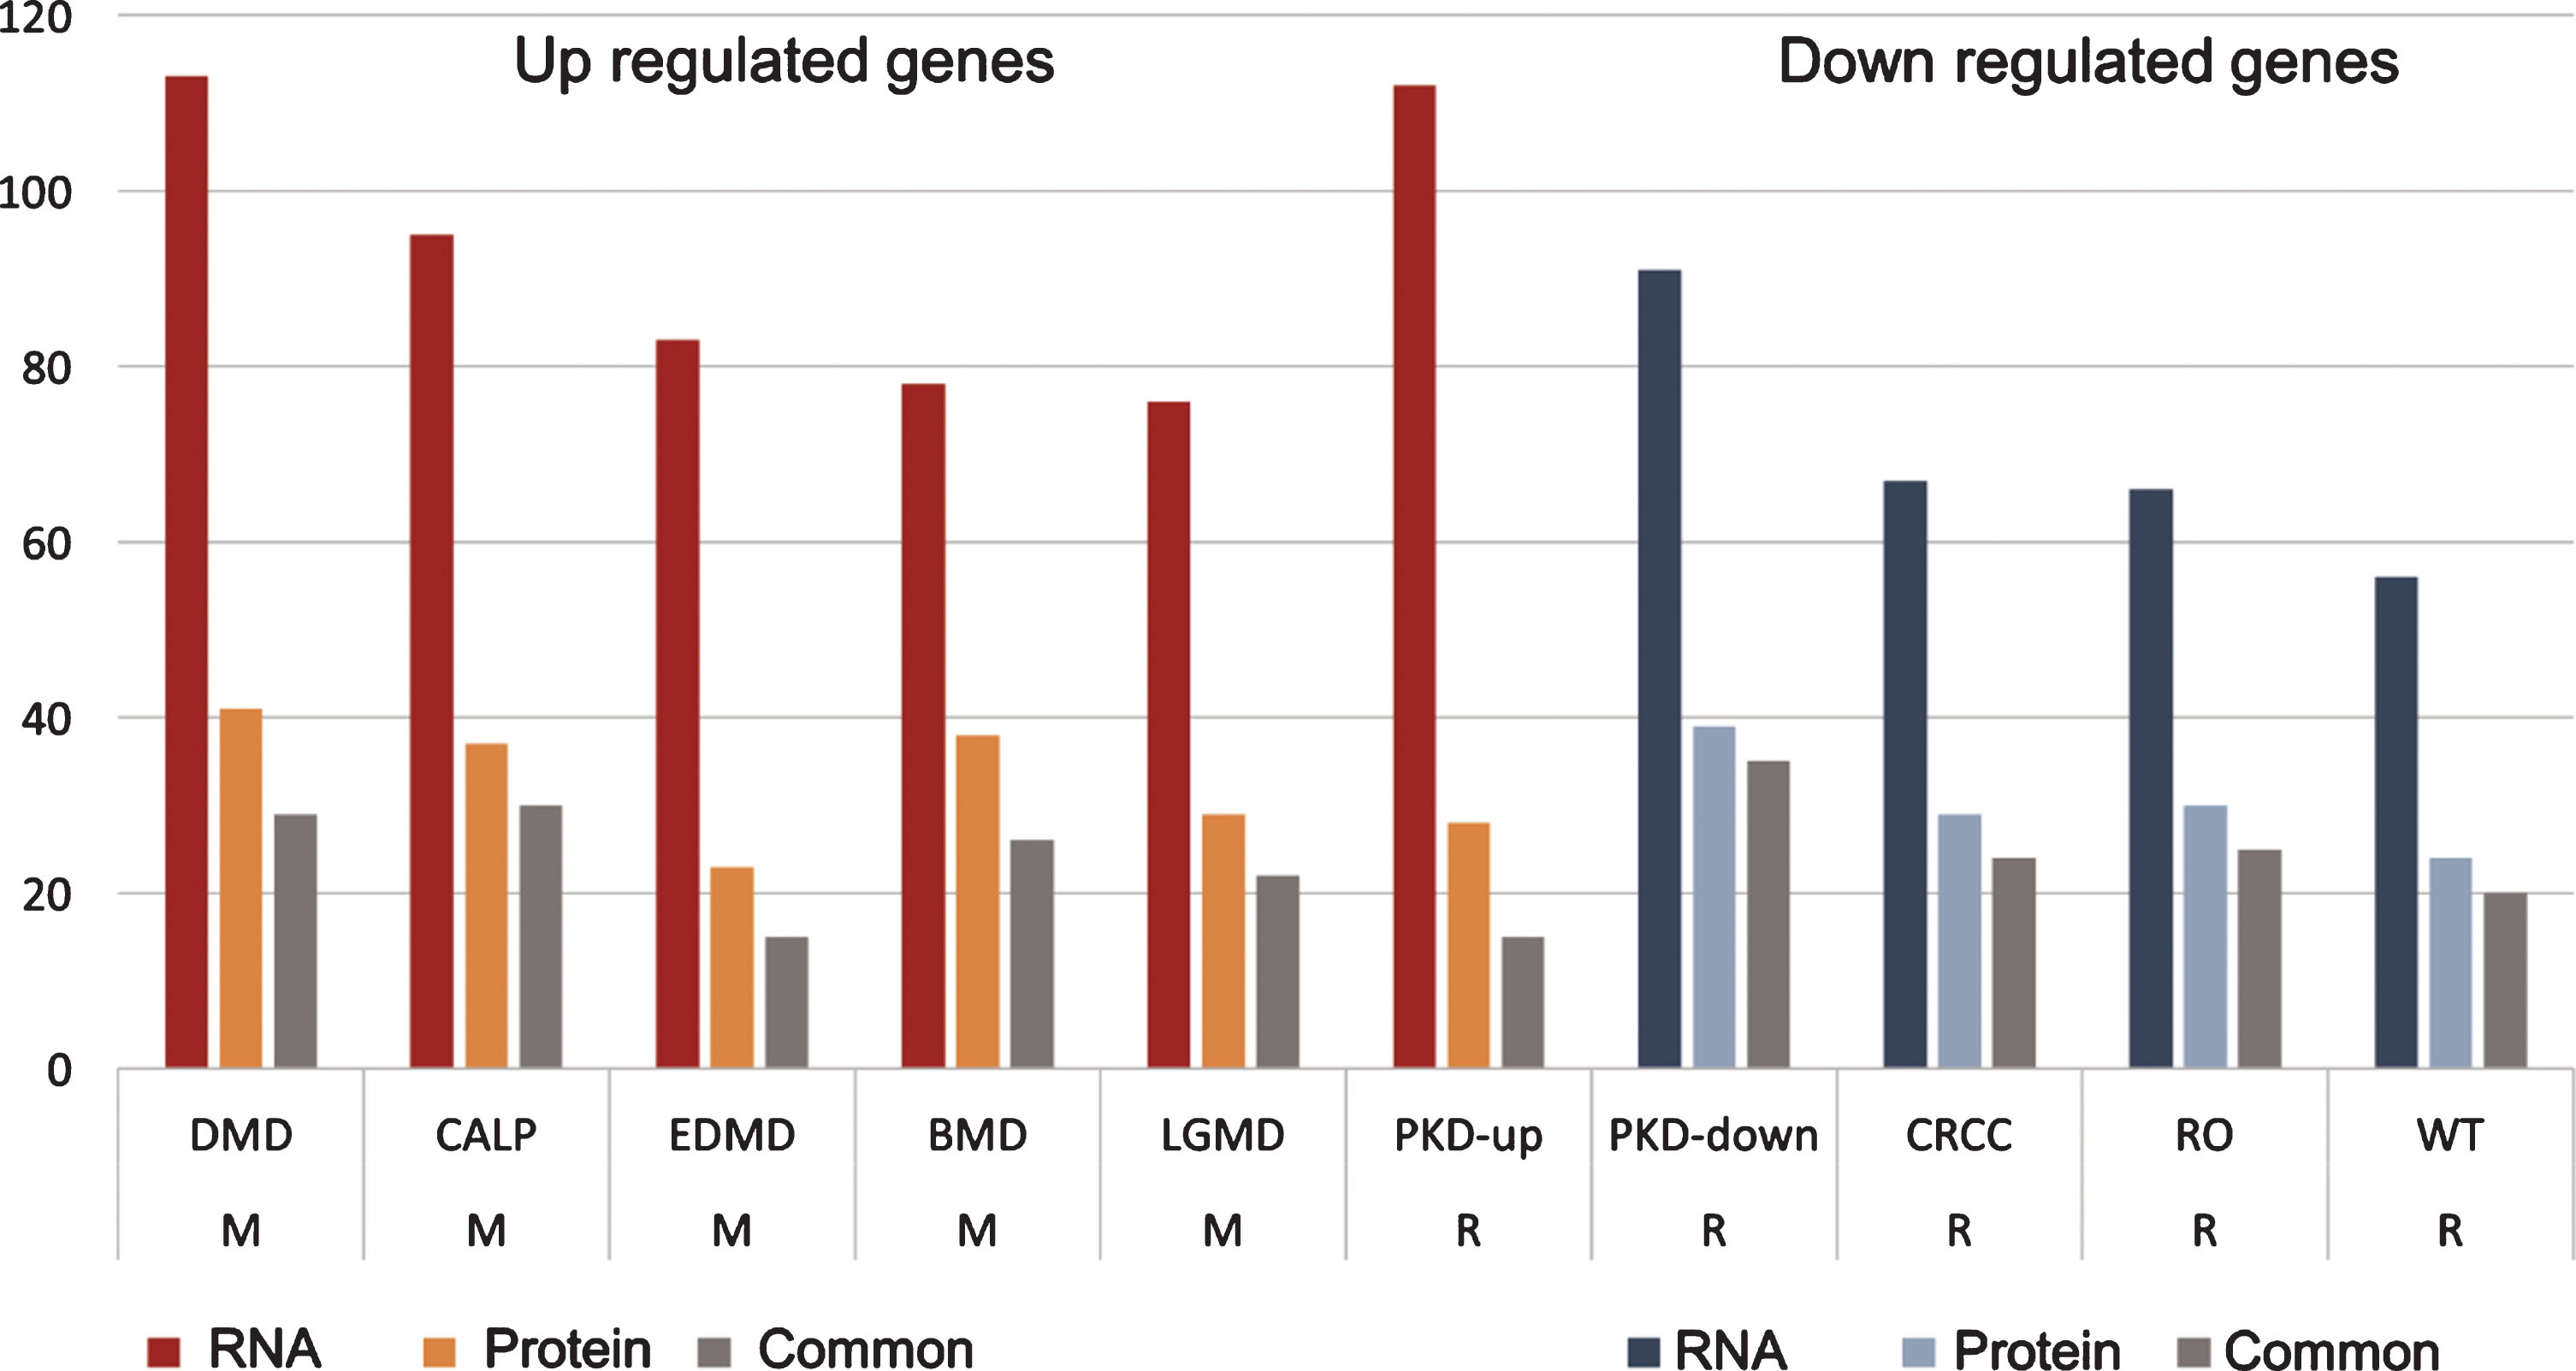
We analyzed the DEG in both RNA and protein for enrichment against the MalaCards/ LifeMap discovery database, which gathers information on DEG in various human diseases [34]. These analyses, detailed in Table 2 and Fig. 7, revealed that the sets of significantly up-regulated genes in both RNA and protein in the sick kidney of GneM743T/M743T mice are enriched with gene sets that are also up-regulated in polycystic kidney disease (PKD) in human, as well as, and more interestingly, in an array of known hereditary muscular diseases, such as Duchenne muscular dystrophy, Becker muscular dystrophy, limb-girdle muscular dystrophy, calpainopathy and Emery-Dreifuss muscular dystrophy. The known upregulated genes in these muscular diseases are highly overlapping and have the same enriched annotations as the upregulated genes in GneM743T/M743T mice sick kidney, namely the integrin pathway, extracellular matrix degradation, focal adhesion, collagen degradation, cytoskeleton signaling and ERK signaling. The group of down-regulated genes in both RNA and protein in sick kidney of GneM743T/M743T mice is enriched with genes that are significantly down-regulated in an array of renal diseases, including PKD. This set of downregulated genes in these diseases is mostly enriched for metabolic pathways and metabolite transport. However, the strong down regulation of the respiratory electron transport pathway appears to be a unique feature of GneM743T/M743T mice kidney disease. In summary, the sick kidney of GneM743T/M743T knock-in mice shares molecular patterns with both human renal and muscle diseases.
Table 2
Human muscular and renal diseases share dysregulated gene sets with the sick kidney of GneM743T/M743T mice
| Category | Disease | RNA | Protein | Common |
| M | DMD (up) | 113 | 41 | 29 |
| M | CALP (up) | 95 | 37 | 30 |
| M | EDMD (up) | 83 | 23 | 15 |
| M | BMD (up) | 78 | 38 | 26 |
| M | MDLG (up) | 76 | 29 | 22 |
| R | PKD (up) | 112 | 28 | 15 |
| R | PKD (down) | 91 | 39 | 35 |
| R | CRCC (down) | 67 | 29 | 24 |
| R | RO (down) | 66 | 30 | 25 |
| R | WT (down) | 56 | 24 | 20 |
Fig.7
Human muscular and renal diseases share dysregulated gene sets with the sick kidney of GneM743T/M743T mice. DEG from sick kidney, both from RNA and protein, displayed enrichments in genes that are differentially expressed in muscular and renal diseases. Up regulated genes in sick kidney were enriched with genes that are up-regulated in PKD and muscular diseases; down regulated genes in sick kidney are enriched with genes that are down-regulated in renal diseases. The values in “RNA” and “Protein” columns are the number of genes with the specific enrichment in either RNA or protein, “common” are the shared genes that are up or down regulated in both RNA and protein. M: muscular; R: renal. DMD: Duchenne muscular dystrophy; CALP: calpainopathy; EDMD: Emery-Dreifus muscular dystrophy; BMD: Becker muscular dystrophy; LGMD: limb-girdle muscular dystrophy; PKD: polycystic kidney disease; CRCC: chromophobe renal cell carcinoma; RO: renal oncocytoma; WT: Wilms tumor.
4. Muscle physiology genes are upregulated in the unaffected kidney of healthy GneM743T/M743T mice
One of the intriguing challenges regarding the studied system was to find the molecular features that characterize the GneM743T/M743T mutated but healthy mice. Namely, which altered patterns may explain the apparent resistance of these mice to the deleterious mutation? We denote these as “protective patterns” and expect such patterns to be detected in two components: (i) DEG in healthy-mutated mice compared to the wild type mice (H/W); and (ii) DEG in healthy mutated mice compared to the kidney-sick mice (H/S), with the omission of DEG between the sick and the wild type mice (H/S – W/S; H/W–W/S) (Fig. 8A). The omission of W/S DEG removes the phenotype effect.
Fig.8
Up-regulation of muscle genes and pathways in kidneys of healthy GneM743T/M743T mice. (A) Venn diagram illustrating the fraction of genes defined as the protection signal; (B) Heatmap representation of expression (z-scores) of the protection signal genes in the three different states of the mice kidneys: a unique cluster of genes is up-regulated solely in H compared to W and to S; (C) Zoom in on this cluster reveals a majority of muscle-related genes (marked with a green circle). (D) Gene Ontology enriched biological processes, molecular functions and cellular components of the genes presented in C, emphasizing the muscle physiology signal and their involvement in human muscle diseases (OMIM: online Mendelian inheritance in man database). (E) The Filament sliding pathway is up-regulated in the kidney of healthy GneM743T/M743T mice. Gene set enrichment analysis (GSEA) of healthy-mutated versus sick (H/S, left) and versus wild-type (H/W, right). Most of the genes representing the filament sliding pathway are concentrated in the left (up regulated) side of the plot. NES: normalized enrichment signal; FDR: false discovery rate. Top genes that contributed to the enrichment signal: Neb, Acta1, Mybpc1, Ttn, Actc1, Actn2, Actn3, Tcap, Tnnt3, Tnnc2, Tnni2, Myl1, Myl6b.
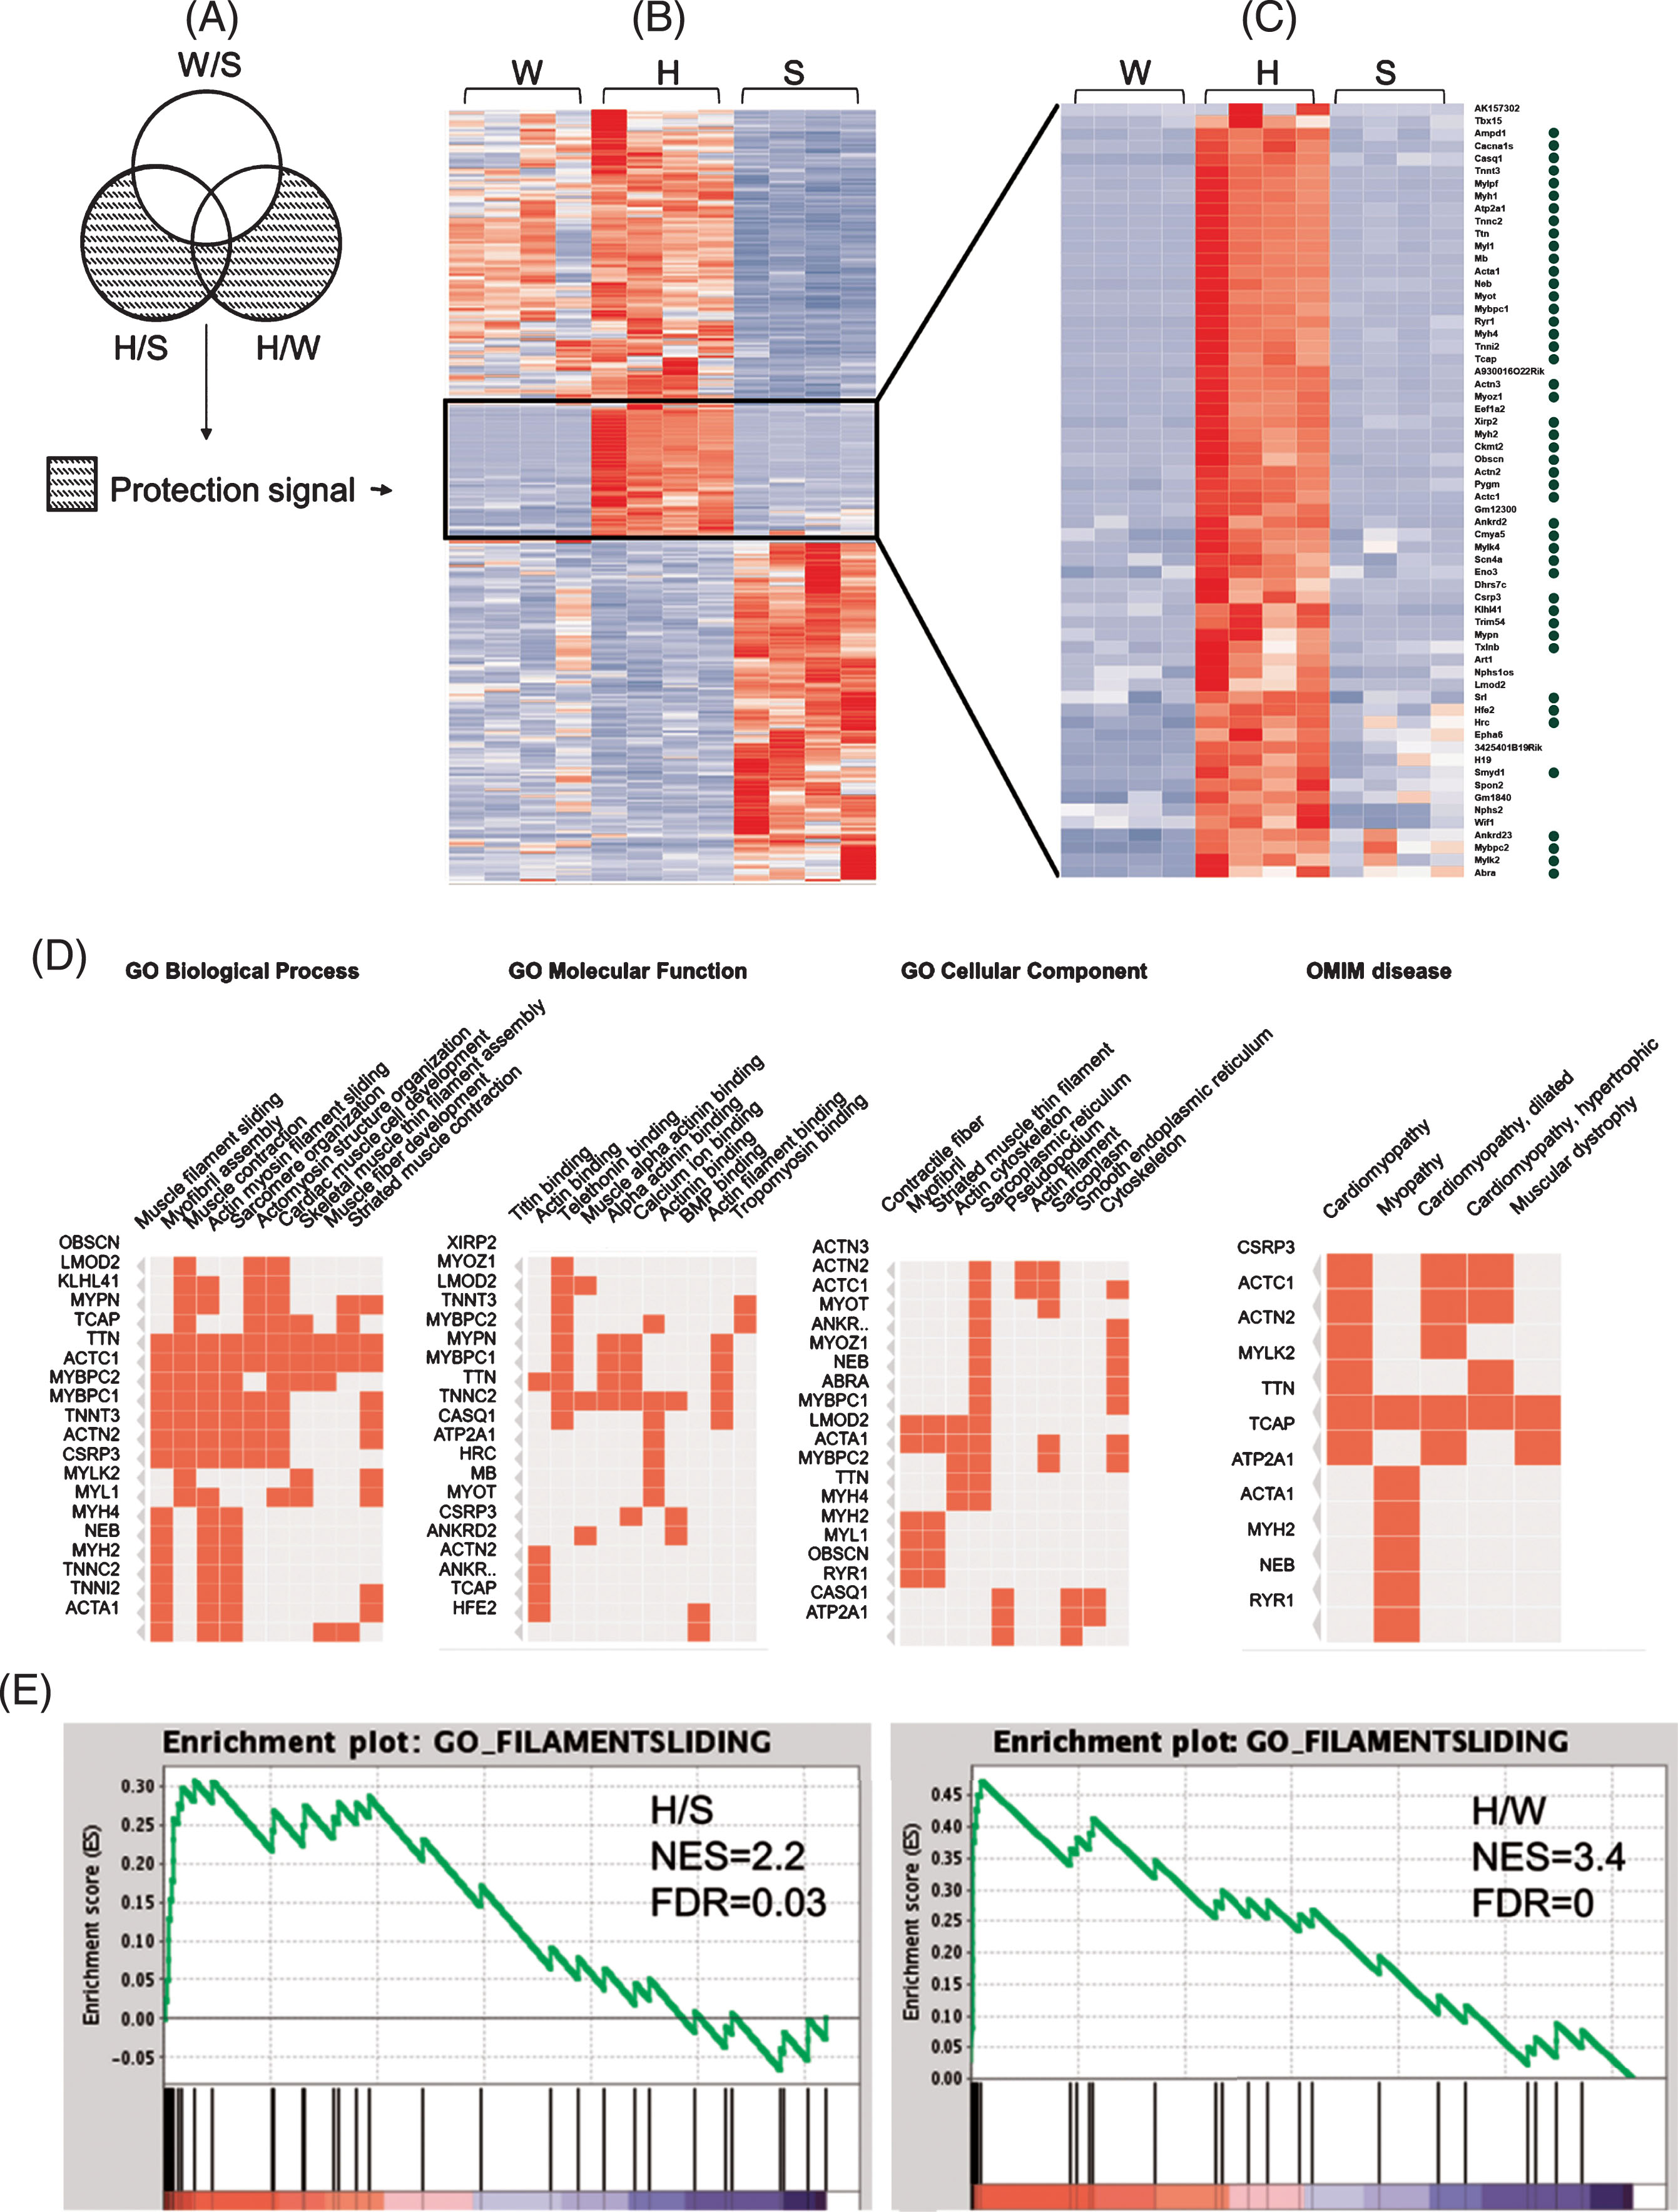
Surprisingly, annotations of the “protective” genes (n = 359) at the RNA level were dominated by up-regulation in healthy-mutated mice of functions and pathways that are hallmarks of muscle physiology, including muscle development and differentiation, muscle contraction, and structural constitution of muscle. Muscle physiology genes were up-regulated in kidney of healthy-mutated mice compared to both sick-mutated and wild-type mice. The muscle physiology enrichment is present whether considering the H/W DEG set, the (H/S-W/S) set, or the combined set. The findings are depicted in Fig. 8: A heatmap of the z-scores of the 359 DEG (from RNA-seq) in the three states in kidney revealed a cluster of 62 genes that displayed a pattern of up-regulation in both H/S and H/W (Fig. 8B). Genes that have a role in muscle physiology are marked with a green circle (Fig. 8C). Enrichments of the gene ontology (GO) categories biological process, molecular function and cellular component are in agreement with strong muscle physiology signal (Fig. 8D). The importance to muscle physiology of these upregulated genes in healthy GneM743T/M743T is also reflected in the fact that mutations in many of these genes result in muscular diseases, with the highest rank for myopathies (Fig. 8D, Clustergram representation of enrichment of OMIM genes). The top ranked GO biological process, filament sliding, is strongly up-regulated in kidney of healthy-mutated mice. We also examined gene set enrichment analysis (GSEA) using whole expression data. The strong up regulation of the filament sliding pathway in healthy GneM743T/M743T kidney, compared to sick and wild-type, is seen in Fig. 8E. At the protein level, 5/26 DEG in kidney of healthy-mutated mice vs wild-type also had muscle annotations (Krt8, Krt19, Des, Vim and Nes), however the numbers of detected and DEG proteins from healthy mice were too low to establish significance for the protection signal at the protein level. Table 3 details the differentially expressed proteins in healthy-mutated vs. wild-type.
Table 3
Differentially expressed proteins in the kidney of healthy GneM743T/M743T mice versus wild type
| Gene name | Protein name | Welch difference | Welch p-value |
| Tgfbi | Transforming growth factor-beta-induced protein Ig-h3 | 11.22134304 | 0.027906368 |
| Npnt | Nephronectin | 11.15993881 | 0.026935403 |
| Uba6 | Ubiquitin-like modifier-activating enzyme 6 | 10.60315466 | 0.046628819 |
| Nes | Nestin | 10.03561592 | 0.04599475 |
| Ftl1 | Ferritin light chain 1 | 4.423143387 | 0.004540852 |
| Fth1 | Ferritin heavy chain | 3.708479881 | 0.022851555 |
| Krt19 | Keratin, type I cytoskeletal 19 | 1.588711262 | 0.024401743 |
| Des | Desmin | 1.460905552 | 0.020851926 |
| Them4 | Acyl-coenzyme A thioesterase THEM4 | 1.089107037 | 0.044795418 |
| Prelp | Prolargin | 1.067718983 | 0.022337805 |
| Krt8 | Keratin, type II cytoskeletal 8 | 0.972580433 | 0.012296938 |
| Vim | Vimentin | 0.970125675 | 0.003918861 |
| Col6a2 | Collagen alpha-2(VI) chain | 0.732880116 | 0.031066302 |
| Sh3bgrl | SH3 domain-binding glutamic acid-rich-like protein | 0.686810017 | 0.010327305 |
| Hmgb3 | High mobility group protein B3 | 0.59184742 | 0.017964266 |
| Pabpc4 | poly(A) binding protein, cytoplasmic 4 | 0.257706642 | 0.038164493 |
| Eif4h | Eukaryotic translation initiation factor 4H | –0.338630676 | 0.01279069 |
| Rps28 | 40S ribosomal protein S28 | –0.603909492 | 0.01621515 |
| Pfn2 | Profilin-2 | –0.702214241 | 0.043417664 |
| Uqcrh | Cytochrome b-c1 complex subunit 6, mitochondrial | –0.760519505 | 0.030750084 |
| Marcks | Myristoylated alanine-rich C-kinase substrate | –0.822722912 | 0.035724365 |
| Iyd | Iodotyrosine dehalogenase 1 | –1.058822632 | 0.009632163 |
| Cpsf6 | Cleavage and polyadenylation specificity factor subunit 6 | –1.241416931 | 0.036614237 |
| Lta4h | Leukotriene A-4 hydrolase | –1.280785084 | 0.042052669 |
| Stmn1 | Stathmin | –1.794016361 | 0.022343258 |
| Setdb1 | Histone-lysine N-methyltransferase SETDB1 | –2.710329533 | 0.044896973 |
5. Molecular profile of the unaffected muscles in Gne M743T/M743T mice
Since the muscles of the mice are histologically intact in all three states, we can consider that in the two states where the GneM743T/M743T mutation is present (H and S) muscles are protected from any pathological or functional change. To understand the processes taking place, we have examined in each of the three muscle types, gastrocnemius, tibialis anterior and quadriceps, the differentially expressed genes and proteins between the S and W, S and H, and H and W states. As seen in Fig. 3d, at the S state many genes are differentially expressed relative to the W state (1749 genes, 1983, 1476 respectively) or to the H state (2052, 1660, 1551 respectively) and most of them are common to those two comparisons. In contrast, few genes are differentially expressed between the H and W states (35 for gastrocnemius, 46 for tibialis, 20 for quadriceps). The H and W states were also not separated by PCA (Fig. 2).
The DEG in the S/H and S/W comparisons highly overlapped for all three muscle types (Fig. 3e).
At the protein level, differential expression was detected at much lower extent. The DEG numbers for S/H and S/W were 22 and 57 for gastrocnemius, 65 and 47 for tibialis anterior, 44 and100 for quadriceps. The DEG for H/W were 11, 20 and 51 for gastrocnemius, tibialis anterior and quadriceps respectively. No enriched pathways were detected in the H/W comparison for RNA or protein.
6. Altered pathways in muscles from sick mice
Since most of the differentially expressed genes were common to the 3 muscle types, we performed an additional comparative analysis (S versus non S which includes bothW and H), taking in consideration the different state in the 3 muscle types altogether, to obtain a single list of the genes differentially expressed globally in the asymptomatic muscle of the kidney sick mouse.
Enrichment analysis was performed against numerous gene sets and pathways, using the meta database GeneAnalytics [31] (Fig. 9). The 813 up regulated genes differentially expressed in muscle at the S state were enriched for pathways representing gene expression, including regulation of transcription, ribosomal RNA processing and translation initiation processes. In addition, significant up-regulations of the p53, Foxo and beta adrenergic signaling were detected. The 825 downregulated DEG were enriched mostly for genes representing degradation of extracellular matrix biological pathways, including ECM organization, collagen degradation, integrin pathway and cell adhesion – ECM remodeling. With the DEG approach, the decrease in the respiratory electron transport chain pathway was detected in tibialis and gastrocnemius. The non-cut-off approach (GSEA) which is sensitive for milder changes revealed that respiratory electron chain was down-regulated in each sick muscle as well as in all muscles combined (Fig. 10).
Fig.9
Enriched pathways in asymptomatic muscles at the various states. Up and down-regulated differentially expressed genes (DEGs) were submitted to enrichment analysis using GeneAnalytics [31]. Enriched pathways with high score (FDR < 0.0001) which are common in most muscles are depicted and color coded according to their score. Blue colored cells represent pathways enriched in down regulated DEGs and red represent up regulated DEGs.
![Enriched pathways in asymptomatic muscles at the various states. Up and down-regulated differentially expressed genes (DEGs) were submitted to enrichment analysis using GeneAnalytics [31]. Enriched pathways with high score (FDR < 0.0001) which are common in most muscles are depicted and color coded according to their score. Blue colored cells represent pathways enriched in down regulated DEGs and red represent up regulated DEGs.](https://content.iospress.com:443/media/jnd/2020/7-2/jnd-7-2-jnd190461/jnd-7-jnd190461-g009.jpg)
Fig.10
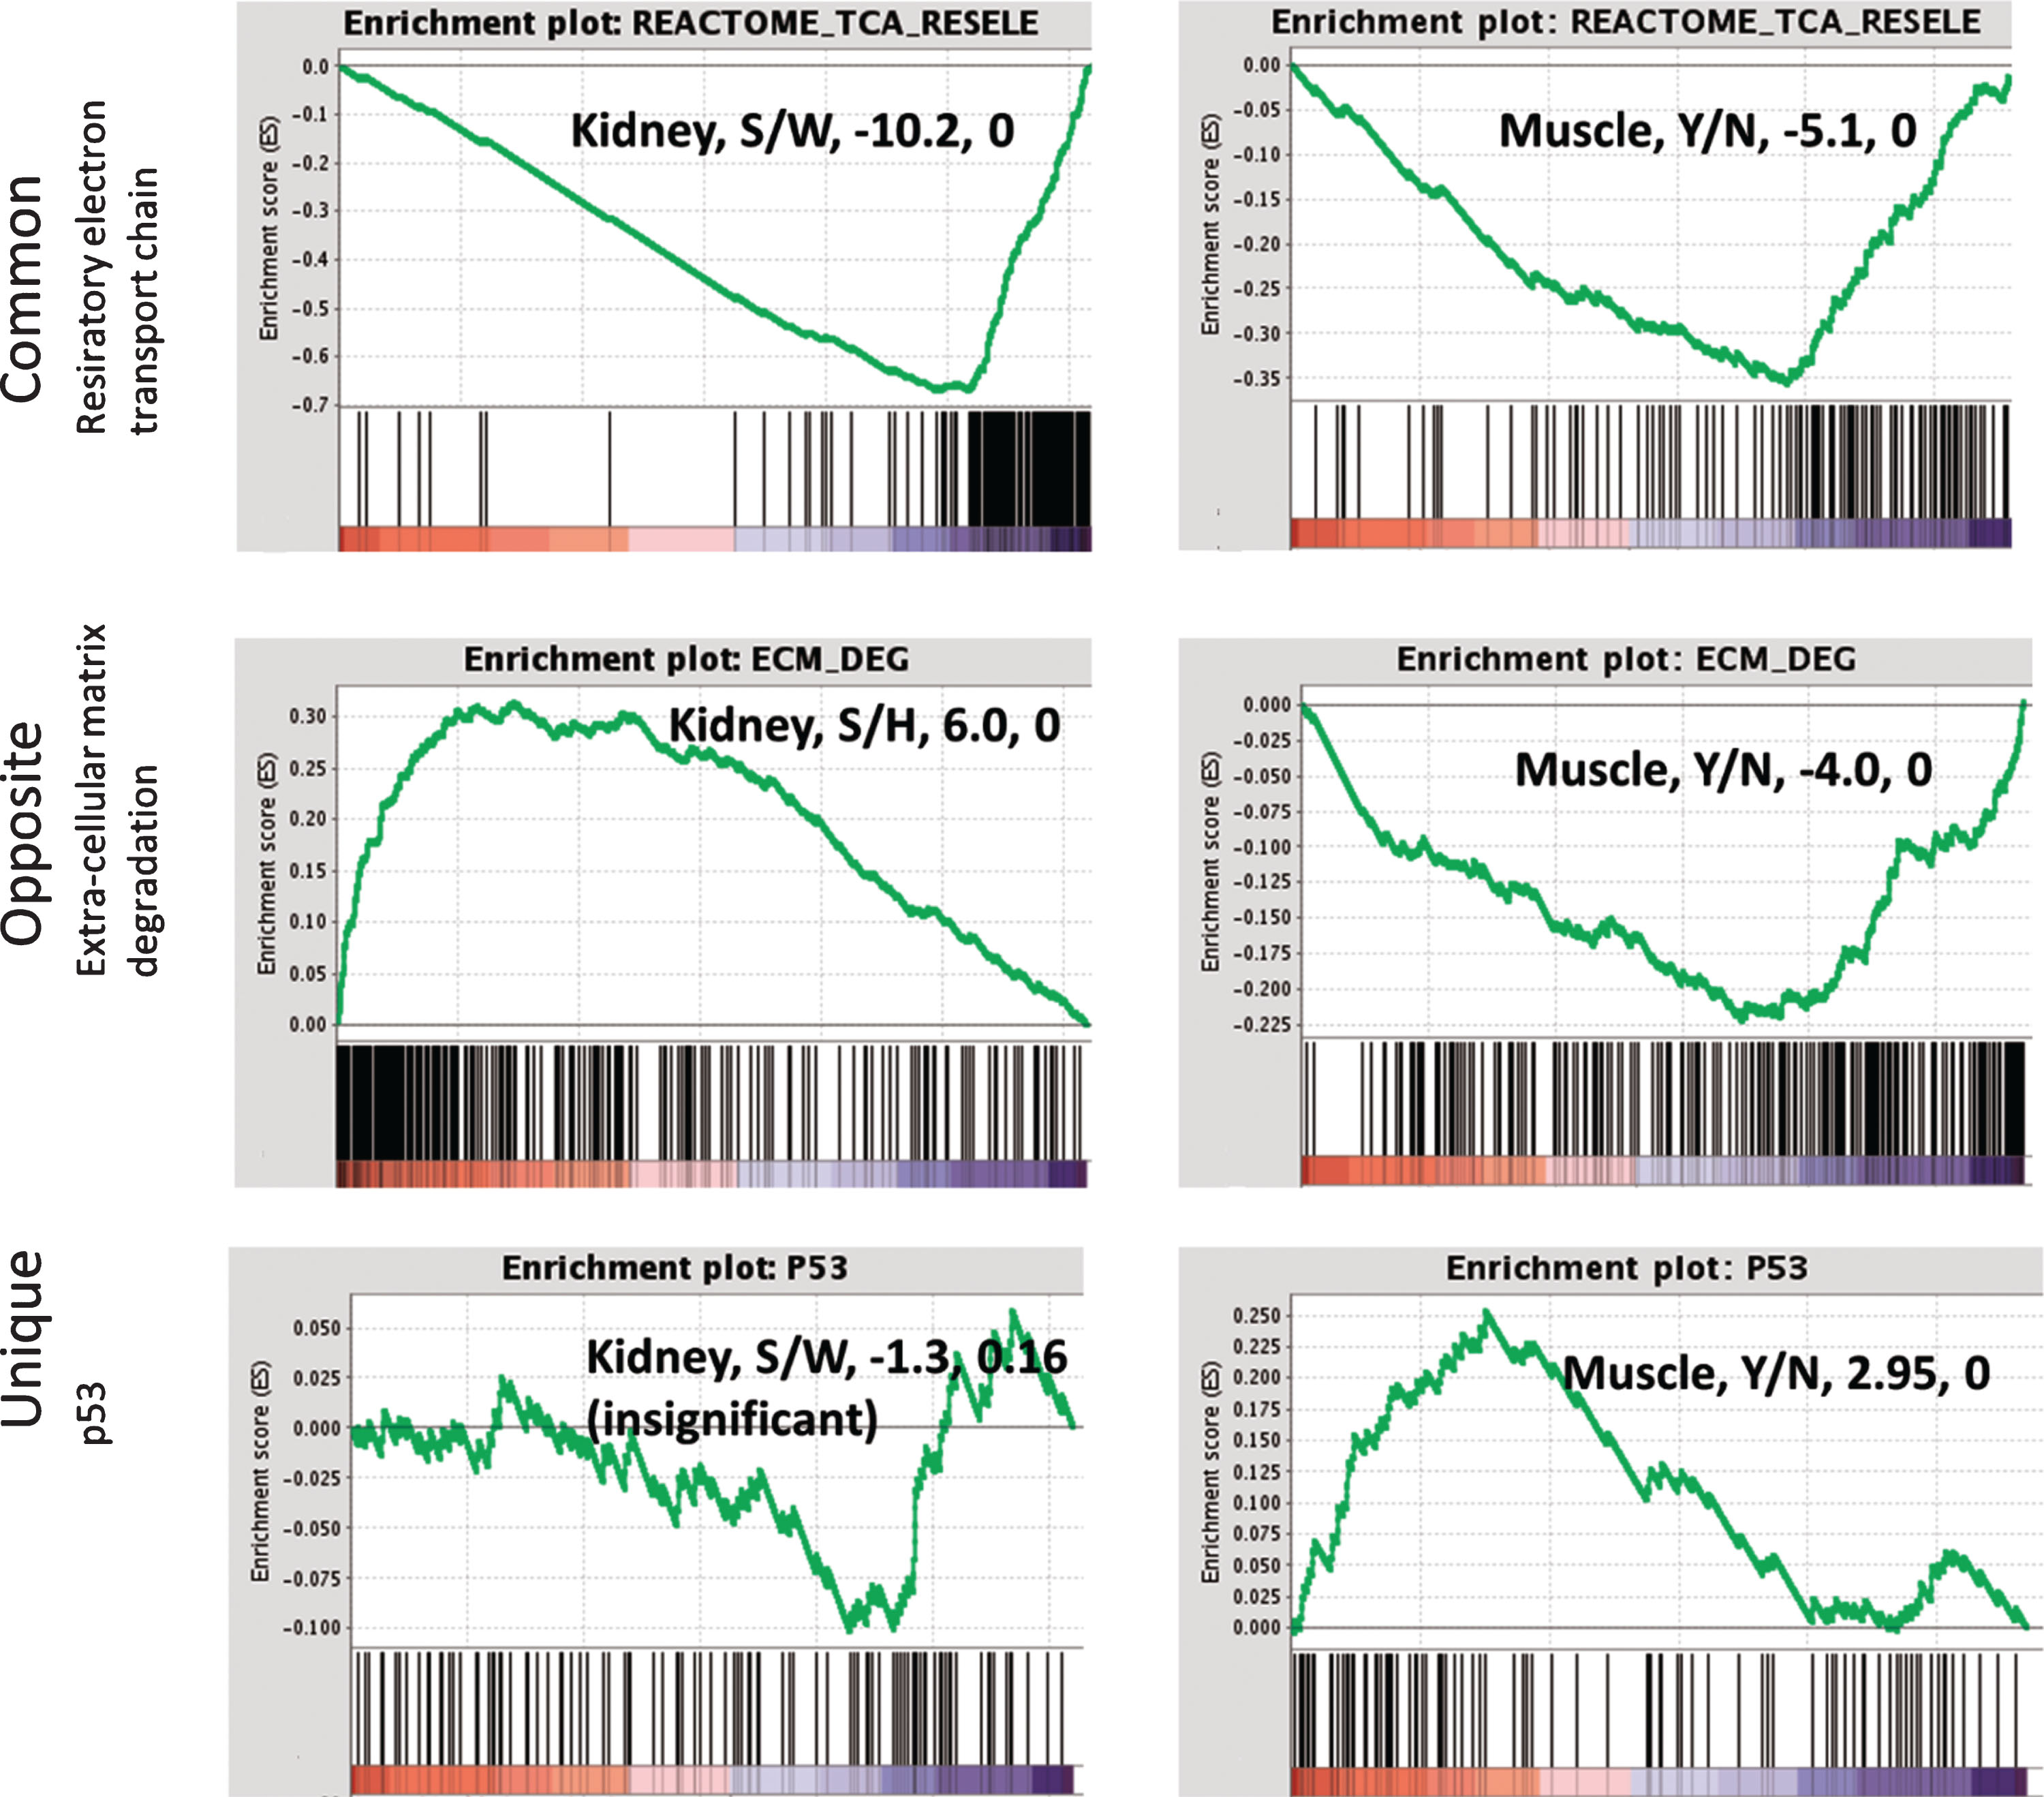
Gene set enrichment analysis (GSEA) for representative pathways in kidney and muscle. Down-regulation of the respiratory electron transport chain is common in kidney and muscles of sick mice. ECM degradation and related processes are up-regulated in kidney while down-regulated in muscles from sick mice. Up-regulation of p53 signalling represents the uniquely altered pathways in asymptomatic muscles from sick mice. The normalized enrichment signal and the FDR are detailed in the text box. Right panel: muscle, Y/N represents disease (yes) vs. no, i.e. GSEA was performed on the comparison of sick vs not sick, where not sick included both healthy-mutated and wild-type.
Validation of the expression of several representative genes was performed by real time PCR (Fig. 5).
At the protein level, despite the low numbers of detected DEG, a signal of down-regulation of respiratory electron transport was found at the tibialis (S/H, 11/40 analyzed genes) and gastrocnemius (S/W, 13/40) (data not shown).
Two major enriched pathways were shared by the mutated muscle and kidney (Fig. 10): the respiratory electron transport chain was downregulated in both tissues. This pathway therefore may not be leading to the sick phenotype in kidney, since it is also present in the “unaffected” muscle, but rather could characterize the primary changes due to mutation in GNE.
In contrast, a second pathway was enriched in both muscle and kidney but in opposite directions: the extra cellular matrix degradation pathway is down-regulated in asymptomatic muscles of sick vs. healthy mice (both healthy-mutated and wild-type), while upregulated in the sick kidney. In kidney the upregulation was detected in RNA and protein while in muscles downregulation is seen in RNA only, probably due to the small number of significantly differentially expressed proteins. This pathway may be involved in the phenotype of the sick kidney, and could protect the muscle from deterioration when regulated in the opposite direction. The up-regulation of p53, Foxo and beta adrenergic signaling was unique to the asymptomatic muscles of sick mice.
7. The sialic acid enzymatic biosynthetic pathway is not altered in GneM743T/M743T mice
The only well-established known function of GNE is its key role in the sialic acid biosynthesis pathway. We have specifically looked at the molecular expression profile of the genes involved in this pathway. A set of 26 genes included the 4 enzymes directly involved in the intracellular sialic acid metabolism (GNE, NANS, NANP and CMAS), 2 transporters that translocate CMP-sialic acid into the Golgi (SLC35A1 and SLC35A3) and 18 sialyltransferases active in incorporation of sialic acid on sugar chains, UAP1, the enzyme leading to the synthesis of UDP-GlcNac, a step before the epimerase activity of GNE, and NAGK, a kinase which can also use UDP-N acetyl mannosamine as a substrate, thus competing with the kinase activity of GNE in the cell [35].
We looked at both the individual gene expression level and at the gene set expression level. At the individual gene level, some genes were altered (Table 4), however at the gene-set level the hypergeometric p-values are not significant in all comparisons in kidney and muscle. In addition, in GSEA analysis which is more sensitive to milder changes, the 26 gene set did not show up- or down-regulation signals in any of the comparisons in either kidney or muscle.
Table 4
Differential expression of the enzymes involved in the sialic acid biosynthesis pathway in GneM743T/M743T mice sick kidneys and asymptomatic muscles
| Gene | Kidney S/H | Kidney S/W | Muscles Y/N |
| St8sia1 | – 2.1, 3E-19 | – 2.1, 5E-18 | –1.95, 0.003 |
| St6gal1 | 1.52, 1E-04 | 2.06, 6E-10 | –0.29, 0.1 |
| St8sia2 | 3.17, 8E-07 | 3.7, 1E-08 | –0.78, 0.08 |
| St6galnac6 | 1.68, 6E-05 | 1.84, 3E-06 | 0.38, 0.003 |
| St6galnac4 | 1.4, 0.006 | 1.66, 2E-04 | 0.224, 0.18 |
| St3gal1 | 1.03, 0.076 | 1.39, 4E-04 | –0.45, 0.03 |
| St8sia4 | 1.6, 0.013 | 1.7, 0.005 | –0.5, 0.03 |
| Slc35a3 | –0.76, 0.89 | –1.2, 0.031 | –0.09, 0.52 |
| St8sia5 | –0.64, N/A | –0.2, N/A | –1.1, 2E-07 |
| St3gal5 | 0.7, 1 | 0.82, 0.52 | –0.37, 0.11 |
| St6galnac5 | 1.12, 0.29 | 0.78, 1 | 0.99, 0.02 |
| St3gal6 | 0.06, 1 | 0.06, 1 | –0.59, 1E-04 |
| Nanp | –0.77, 1 | –1.36, 0.23 | –0.44, 0.08 |
| St3gal2 | 0.71, 0.55 | 0.75, 0.32 | –0.32, 0.03 |
| St3gal3 | –0.87, 0.32 | –0.78, 0.56 | 0.09, 0.36 |
| Cmas | –0.57, 1 | –0.72, 0.74 | –0.52, 2.7E-10 |
| Uap1 | –0.84, 1 | –0.91, 0.75 | 0.08, 0.62 |
| St3gal4 | 0.9, 0.15 | 0.65, 0.99 | –0.67, 5E-09 |
| Gne | –0.78, 0.79 | –0.54, 1 | –0.03, 0.79 |
| St8sia6 | –0.67, 0.97 | –0.4, 1 | 0.846, 3E-05 |
| Nagk | –0.05, 1 | –0.24, 1 | –0.36, 0.008 |
| Nans | –0.44, 1 | 0.15, 1 | –0.41, 2E-04 |
| Slc35a1 | –0.22, 1 | –0.5, 1 | –0.17, 0.06 |
| St6galnac1 | –0.03, 1 | 0.34, 1 | 2.7, 4.4E-07 |
| St6galnac2 | –0.48, 1 | –0.5, 1 | 0.19, 0.56 |
| St6galnac3 | –0.68, 1 | –0.58, 1 | –0.02, 0.95 |
The table details log2fold-change and FDR (adjusted p-value) for the kidney S/H and S/W comparisons, and the muscles global sick vs. non sick comparison. Significantly altered genes are marked with a bold font (7, 8 and 1 in kidney S/H, kidney S/W and muscles sick/non sick respectively). The cut-off for significant differential expression is detailed in Methods. W, wild type; H, GneM743T/M743T healthy kidney; S, GneM743T/M743T sick kidney.
Among the 26 sialic acid synthesis genes examined, only four were detected in our proteomic experiment in kidney, Nans, Cmas, Slc35a3 and Uap1 and only Nans in muscle. None of them showed any significant change of expression in any of the three states. To note, GNE itself, which is mutated in S and H mice, is expressed at similar RNA levels in the 3 different states W, H and S in both kidney and muscles. GNE was not detected at the protein level in kidneys or muscles in any of the three states, most likely pointing to its low level of expression in these tissues.
DISCUSSION
GNE myopathy in humans is caused by mutations in the GNE gene, resulting solely in muscular pathology with progressive functional impairment. The GneM743T/M743T mouse model, which mimics genetically the most common patients’ cluster, does not recapitulate the disease symptoms in humans. The mouse model is characterized by severe early renal impairment leading to death few days after birth. A subcolony of this model composed of healthy mice with a normal life span was spontaneously generated with only few individual mice developing the fatal renal disorder. This unique experimental system where genetically identical siblings from the same litter can be either healthy or sick has allowed us to investigate not only the functions that could lead to the pathological phenotype in kidney, but also those that could protect the kidney from disease.
Comprehensive high throughput methods of transcriptomics, proteomics and bioinformatics have revealed the main pathways changes occurring in the sick kidney compared with the healthy one in either wild type or GneM743T/M743T mice, as well as the involved molecular pathways of the asymptomatic muscle in these mice. In kidney, the main down regulated pathways were carbon and amino acids metabolism as well as solute carriers mediated metabolite transport. These pathways are of critical relevance in kidney and their disturbance reflects the pathology of this organ. The respiratory electron transport chain/oxidative-phosphorylation pathway is also strongly down regulated in the kidneys of sick versus healthy mice, with individual genes displaying 2–4.5 fold changes. In contrast, the integrin pathway, the extracellular matrix degradation, focal adhesion processes, collagen degradation and cytoskeleton signaling were the main upregulated processes. These two pathways, respiratory electron transport chain and extracellular matrix degradation are also dysregulated in the asymptomatic muscles. Although the respiratory electron transport chain/oxidative-phosphorylation pathway is also down regulated in the asymptomatic muscle in these sick mice, the extracellular matrix degradation related processes, in contrast to kidney, are downregulated in muscle. Notably, several of these pathways were identified in our and other laboratories’ studies in GneM743T/M743T mutated human muscle cells and tissues: the respiratory chain and oxidative phosphorylation pathways were slightly upregulated in GNE myopathy patients muscle tissues and cells [36], although the fold change was minimal. The same results were obtained at the protein level [37]. In addition, ROS related molecules were upregulated in patients and in muscles of Gne KO mice carrying a transgenic Gne mutation frequent in Japan [38]. These processes, essential for energy supply of cells, can respond to diverse stress stimuli via signaling events [39]. Interestingly, in the sick kidney analyzed in the present study, the changes in these pathways were in the opposite direction. It is well established that redox state plays an important role in muscle atrophy [40], but the role of redox agents in kidney biology has been less explored. Recently redox involvement has been reported in chronic kidney disease [41, 42]. While it has been hypothesized that the mild increase in the respiratory chain alterations observed in patients’ muscle indicate a compensatory effect of the slowly progressive degenerating muscle in the disease, the downregulation of these pathways in the mouse sick kidney could reflect the much more aggressive process occurring in this tissue, resulting in a dramatic loss of the kidney structures and functions in mouse.
In addition, Sela et al. [37] described up-regulation of genes enriched in the pathways of cytoskeleton organization and focal adhesion in GNE myopathy patients’ cells. Our results in sick kidney are in agreement with these reports: most of the genes involved in these pathways were upregulated in the present studies on the sick mouse kidney. The perturbation of adhesion processes was also reported in cells overexpressing mutated GNE by Arya et al. [23].
Our results point to a molecular dynamic progression with the healthy GneM743T/M743T mutated state being a molecular intermediate between the wild type and the sick states.
Usually the mutation affects dramatically these pathways, resulting in a clear pathogenic phenotype, but according to our results under some conditions, when a specific gene set involved in muscle physiology is overexpressed, the mutation effect on the phenotype is much milder, even undetectable.
Our findings also illustrate similarities of the molecular pathways occurring in the sick kidney to those taking place in various human renal and muscular diseases, thus attributing some relevance of the GneM743T/M743T model for pathophysiology studies on GNE myopathy.
In contrast, the electron transport/oxidative phosphorylation pathway is affected only in GneM743T/M743T mouse kidney and in GNE mutated human muscle (not reported for other renal and muscular diseases). This supports the hypothesis that this pathway is a specific effect of the GneM743T/M743T mutation. The molecular progression of this pathway from the wild-type to the healthy and the sick states (Fig. 4) and its downregulation also in asymptomatic muscle suggests that this pathway is a primary and direct target of GNE function, but not related to the phenotype. In contrast, the extracellular matrix degradation and related processes may be involved in the phenotype of the sick kidney, and could protect the muscle from deterioration when regulated in opposite directions.
Notably, in spite of the mutation in Gne, the sialic acid enzymatic gene set, upstream and downstream of the GNE molecule, is not substantially altered in this experimental system. It has been reported that sialic acid availability in stem cells regulates the transcription of sialyltransferases [43]: absolute lack of sialic acid did upregulate sialyltransferases in Gne KO stem cells. Although hyposialylation has been reported in the sick mice kidney [27], we see only a slight upregulation of 3 among the 20 known sialyltransferases. No effect was observed in the muscles of the mice. This indicates that Gne does not have a direct modulating effect on the expression of the enzymes in the sialic acid biosynthesis pathway.
The fact that the main processes protecting the GneM743T/M743T mutated kidney from being clinically affected are well defined muscle pathways is rather surprising. One possible explanation could be that the kidney disease in these mice affects the glomeruli, which function as a filtration barrier. Podocytes are the most differentiated cell type in the glomeruli and are crucial for the maintenance of the barrier integrity [43]. Recently, podocytes have been defined as contractile units which assist the glomeruli filtration function. Furthermore, Saleem et al. [44] described the molecular phenotype of glomerular podocytes as having key features of contractile smooth muscle and showed that differentiated podocytes contract in an actin dependent manner. Calponin1 (CNN1), which is considered a specific smooth muscle protein involved in muscle contraction, is the most highly expressed protein in differentiated podocytes. In addition, myocardin, a master regulator of smooth muscle differentiation, is also expressed in these cells [44]. Noris and Remuzzi [45] reported an actin-based contractile apparatus very tightly regulated to maintain the glomeruli filtration function intact. Indeed, the molecular events taking place in the podocyte are being elucidated, and many contractile molecules have been shown to be involved in the protection of the glomeruli, enabling them to resist the high pressure inflicted by the filtration functions. In many hereditary forms of nephrotic syndrome, several of the mutated genes identified are known to play crucial roles in signaling and regulation of the actin cytoskeleton dynamics (ACTN4, MYH9), in podocyte integrity maintenance and cell-matrix interactions (such as LAMB2 and ITGB4, paxillin, talin, vinculin) [44, 46, 47]. Of particular interest is the nephrin gene (NPHS1) which was the first podocyte gene identified in nephrotic syndrome, and podocin (NPHS2), a lipid raft protein which recruits nephrin to the plasma membrane [48]. Both genes interact with actin in the podocyte and play a key role in protein filtration. Mutations in either one of these genes (Nphs1 and Nphs2) are associated with autosomal recessive nephrotic syndrome. Interestingly, it has been shown that nephrin KO in mice and in zebrafish results in poorly developed muscles and incompletely fused myoblasts, suggesting that nephrin also plays a role in myoblasts fusion processes, specifically in secondary fusion of myoblasts into nascent myotubes [49]. In our studies Nphs2 and other muscle related genes/proteins are the main overexpressed gene set in the healthy GneM743T/M743T mutated kidney. This could indicate that overexpression of these molecules protects the kidney from glomeruli disease and maintains its healthy state, possibly by attempting to reach an homeostasis functional level of all the “muscle like” functions which ensure the integrity of the filtration barrier. Interestingly, one of the enriched muscle-related pathways in the healthy GneM743T/M743T mutated kidney is filament sliding. This could well fit our previous reports on GNE protein binding to alpha-actinin and on its localization at the Z disk and at the M line of the sarcomere [22, 24]. This also supports our hypothesis that GNE has a function related to the titin filament and that it is part of the muscle sliding machinery [50].
In addition, the asymptomatic muscles in the sick mice are enriched with unique pathways, such as the FOXO, SMAD, p53 and beta adrenergic signaling pathways. All these pathways are involved in the regulation of physiological muscle wasting and muscle fiber atrophy and are crucial for muscle mass homeostasis [51–54]. The upregulation of these pathways may point to the attempts of the tissue to prevent degradation.
The involvement of muscle physiology genes in maintaining healthy the kidney and muscles of the GneM743T/M743T mice unravels a novel connection between the mice kidney disease and the human myopathy, caused by the same mutation.
Further, this protective mechanism could be extrapolated to human muscle, providing a new direction in the understanding of GNE myopathy. In particular those protective pathways should be analyzed in the muscle of GNE Myopathy patients, and if present, could define novel targets for disease modulation such as delaying symptoms onset or slowing down progression.
In summary, although GneM743T/M743T sick mice do not present a muscle phenotype but rather a kidney disorder, at the molecular level, the main processes occurring are strongly related to muscle physiology and pathology. In particular, upregulation of muscle pathways may protect mutated mice from the glomeruli and muscle pathology. Thus, these findings strongly support our hypothesis that GNE has specific functions that are relevant to muscle. Further, they may bridge the apparent phenotype gap between human GNE myopathy and the GneM743T/M743T knock-in mice model, possibly contributing new insights in our understanding of this enigmatic molecule and providing new avenues on clinical modifiers of the human muscle disease.
ACKNOWLEDGMENTS
This work was supported by the Neuromuscular Disease Foundation (NDF), Los Angeles, California. This work is dedicated to the memory of Ophir Kishon.
REFERENCES
[1] | Argov Z , Mitrani-Rosenbaum S . Hereditary Inclusion Body Myopathies. In: KarpatiG, Hilton-JonesD, BushbyK, GriggsRC, editors. Disorders of Voluntary Muscle. 8th edition, Cambridge, (2010) p. 492–8. |
[2] | Eisenberg I , Avidan N , Potikha T , Hochner H , Chen M , Olender T , et al. The UDP-N-acetylglucosamine 2-epimerase/N-acetylmannosamine kinase gene is mutated in recessive hereditary inclusion body myopathy. Nat Genet. (2001) ;29: (1):83–7. |
[3] | Huizing M , Carrillo-Carrasco N , Malicdan MC , Noguchi S , Gahl WA , Mitrani-Rosenbaum S , et al. GNE myopathy: New name and new mutation nomenclature. Neuromuscul Disord. (2014) ;24: (5):387–9. |
[4] | Celeste FV , Vilboux T , Ciccone C , de Dios JK , Malicdan MC , Leoyklang P , et al. Mutation update for GNE gene variants associated with GNE myopathy. Hum Mutat. (2014) ;35: (8):915–26. |
[5] | Hinderlich S , Stasche R , Zeitler R , Reutter W . A bifunctional enzyme catalyzes the first two steps in N-acetylneuraminic acid biosynthesis of rat liver. Purification and characterization of UDP-N-acetylglucosamine 2-epimerase/N-acetylmannosamine kinase. J Biol Chem. (1997) ;272: (39):24313–8. |
[6] | Effertz K , Hinderlich S , Reutter W . Selective loss of either the epimerase or kinase activity of UDP-N-acetylglucosamine 2-epimerase/N-acetylmannosamine kinase due to site-directed mutagenesis based on sequence alignments. J Biol Chem. (1999) ;274: (40):28771–8. |
[7] | Keppler OT , Hinderlich S , Langner J , Schwartz-Albiez R , Reutter W , Pawlita M . UDP-GlcNAc 2-epimerase: A regulator of cell surface sialylation. Science. (1999) ;284: (5418):1372–6. |
[8] | Chen X , Varki A . Advances in the biology and chemistry of sialic acids. ACS Chem Biol. (2010) ;5: (2):163–76. |
[9] | Varki A , Gagneux P . Multifarious roles of sialic acids in immunity. Ann N Y Acad Sci. (2012) ;1253: :16–36. |
[10] | Schwarzkopf M , Knobeloch KP , Rohde E , Hinderlich S , Wiechens N , Lucka L , et al. Sialylation is essential for early development in mice. PNAS America. (2002) ;99: (8):5267–70. |
[11] | Krause S , Aleo A , Hinderlich S , Merlini L , Tournev I , Walter MC , et al. GNE protein expression and subcellular distribution are unaltered in HIBM. Neurology. (2007) ;69: (7):655–9. |
[12] | Krause S , Hinderlich S , Amsili S , Horstkorte R , Wiendl H , Argov Z , et al. Localization of UDP-GlcNAc 2-epimerase/ManAc kinase (GNE) in the Golgi complex and the nucleus of mammalian cells. Exp Cell Res. (2005) ;304: (2):365–79. |
[13] | Hinderlich S , Salama I , Eisenberg I , Potikha T , Mantey LR , Yarema KJ , et al. The homozygous M712T mutation of UDP-N-acetylglucosamine 2-epimerase/N-acetylmannosamine kinase results in reduced enzyme activities but not in altered overall cellular sialylation in hereditary inclusion body myopathy. FEBS Lett. (2004) ;566: (1–3):105–9. |
[14] | Noguchi S , Keira Y , Murayama K , Ogawa M , Fujita M , Kawahara G , et al. Reduction of UDP-N-acetylglucosamine 2-epimerase/N-acetylmannosamine kinase activity and sialylation in distal myopathy with rimmed vacuoles. J Biol Chem. (2004) ;279: (12):11402–7. |
[15] | Saito F , Tomimitsu H , Arai K , Nakai S , Kanda T , Shimizu T , et al. A Japanese patient with distal myopathy with rimmed vacuoles: Missense mutations in the epimerase domain of the UDP-N-acetylglucosamine 2-epimerase/N-acetylmannosamine kinase (GNE) gene accompanied by hyposialylation of skeletal muscle glycoproteins. Neuromuscul Disord. (2004) ;14: (2):158–61. |
[16] | Salama I , Hinderlich S , Shlomai Z , Eisenberg I , Krause S , Yarema K , et al. No overall hyposialylation in hereditary inclusion body myopathy myoblasts carrying the homozygous M712T GNE mutation. Biochem Biophys Res Commun. (2005) ;328: (1):221–6. |
[17] | Broccolini A , Gidaro T , Tasca G , Morosetti R , Rodolico C , Ricci E , et al. Analysis of NCAM helps identify unusual phenotypes of hereditary inclusion-body myopathy. Neurology. (2010) ;75: (3):265–72. |
[18] | Amsili S , Shlomai Z , Levitzki R , Krause S , Lochmuller H , Ben-Bassat H , et al. Characterization of hereditary inclusion body myopathy myoblasts: Possible primary impairment of apoptotic events. Cell Death Differ. (2007) ;14: (11):1916–24. |
[19] | Wang Z , Sun Z , Li AV , Yarema KJ . Roles for UDP-GlcNAc 2-epimerase/ManNAc 6-kinase outside of sialic acid biosynthesis: Modulation of sialyltransferase and BiP expression, GM3 and GD3 biosynthesis, proliferation, and apoptosis, and ERK1/2 phosphorylation. J Biol Chem. (2006) ;281: (37):27016–28. |
[20] | Nakamura K , Tsukamoto Y , Hijiya N , Higuchi Y , Yano S , Yokoyama S , et al. Induction of GNE in myofibers after muscle injury. Pathobiology. (2010) ;77: (4):191–9. |
[21] | Weidemann W , Stelzl U , Lisewski U , Bork K , Wanker EE , Hinderlich S , et al. The collapsin response mediator protein 1 (CRMP-1) and the promyelocytic leukemia zinc finger protein (PLZF) bind to UDP-N-acetylglucosamine 2-epimerase/N-acetylmannosamine kinase (GNE), the key enzyme of sialic acid biosynthesis. FEBS Lett. (2006) ;580: (28-29):6649–54. |
[22] | Amsili S , Zer H , Hinderlich S , Krause S , Becker-Cohen M , MacArthur DG , et al. UDP-N-acetylglucosamine 2-epimerase/N-acetylmannosamine kinase (GNE) binds to alpha-actinin 1: Novel pathways in skeletal muscle? PLoS One. (2008) ;3: (6):e2477. |
[23] | Grover S , Arya R . Role of UDP-N-acetylglucosamine2-epimerase/N-acetylmannosamine kinase (GNE) in beta1-integrin-mediated cell adhesion. Mol Neurobiol. (2014) ;50: (2):257–73. |
[24] | Harazi A , Becker-Cohen M , Zer H , Moshel O , Hinderlich S , Mitrani-Rosenbaum S . The Interaction of UDP-N-Acetylglucosamine 2-Epimerase/N-Acetylmannosamine Kinase (GNE) and Alpha-Actinin 2 Is altered in GNE Myopathy M743T Mutant. Mol Neurobiol. (2017) ;54: (4):2928–38. |
[25] | Hanisch F , Weidemann W , Grossmann M , Joshi PR , Holzhausen HJ , Stoltenburg G , et al. Sialylation and muscle performance: Sialic acid is a marker of muscle ageing. PLoS One. (2013) ;8: (12):e80520. |
[26] | Malicdan MC , Noguchi S , Nonaka I , Hayashi YK , Nishino I . A Gne knockout mouse expressing human GNE D176V mutation develops features similar to distal myopathy with rimmed vacuoles or hereditary inclusion body myopathy. Hum Mol Genet. (2007) ;16: (22):2669–82. |
[27] | Galeano B , Klootwijk R , Manoli I , Sun M , Ciccone C , Darvish D , et al. Mutation in the key enzyme of sialic acid biosynthesis causes severe glomerular proteinuria and is rescued by N-acetylmannosamine. J Clin Invest. (2007) ;117: (6):1585–94. |
[28] | Sela I , Yakovlev L , Becker Cohen M , Elbaz M , Yanay N , Ben Shlomo U , et al. Variable phenotypes of knockin mice carrying the M712T Gne mutation. Neuromolecular Med. (2013) ;15: (1):180–191. |
[29] | Edgar R , Domrachev M , Lash AE . Gene Expression Omnibus: NCBI gene expression and hybridization array data repository. Nucleic Acids Research. (2002) ;30: (1):207–10. |
[30] | Kuleshov MV , Jones MR , Rouillard AD , Fernandez NF , Duan Q , Wang Z , et al. Enrichr: A comprehensive gene set enrichment analysis web server 2016 update. Nucleic Acids Research. (2016) ;44: (W1):W90–7. |
[31] | Ben-Ari Fuchs S , Lieder I , Stelzer G , Mazor Y , Buzhor E , Kaplan S , et al. GeneAnalytics: An Integrative Gene Set Analysis Tool for Next Generation Sequencing, RNAseq and Microarray Data. Omics: A Journal of Integrative Biology. (2016) ;20: (3):139–51. |
[32] | Subramanian A , Tamayo P , Mootha VK , Mukherjee S , Ebert BL , Gillette MA , et al. Gene set enrichment analysis: A knowledge-based approach for interpreting genome-wide expression profiles. PNAS USA. (2005) ;102: (43):15545–50. |
[33] | Fernandez NF , Gundersen GW , Rahman A , Grimes ML , Rikova K , Hornbeck P , et al. Clustergrammer, a web-based heatmap visualization and analysis tool for high-dimensional biological data. Scientific Data. (2017) ;4: :170151. |
[34] | Rappaport N , Nativ N , Stelzer G , Twik M , Guan-Golan Y , Stein TI . MalaCards: An integrated compendium for diseases and their annotation. Database. (Oxford). (2013) :bat018. |
[35] | Hinderlich S , Berger M , Keppler OT , Pawlita M , Reutter W . Biosynthesis of N-acetylneuraminic acid in cells lacking UDP-N-acetylglucosamine 2-epimerase/N-acetylmannosamine kinase. Biol Chem. (2001) ;382: (2):291–7. |
[36] | Eisenberg I , Novershtern N , Itzhaki Z , Becker-Cohen M , Sadeh M , Willems PH , et al. Mitochondrial processes are impaired in hereditary inclusion body myopathy. Hum Mol Genet. (2008) ;17: (23):3663–74. |
[37] | Sela I , Milman Krentsis I , Shlomai Z , Sadeh M , Dabby R , Argov Z , et al. The proteomic profile of hereditary inclusion body myopathy. PLoS One. (2011) ;6: (1):e16334. |
[38] | Cho A , Christine M , Malicdan V , Miyakawa M , Nonaka I , Nishino I , et al. Sialic acid deficiency is associated with oxidative stress leading to muscle atrophy and weakness in GNE myopathy. Hum Mol Genet. (2017) ;26: (16):3081–93. |
[39] | Ray PD , Huang BW , Tsuji Y . Reactive oxygen species (ROS) homeostasis and redox regulation in cellular signaling. Cell Signal. (2012) ;24: (5):981–90. |
[40] | Powers SK , Morton AB , Ahn B , Smuder AJ . Redox control of skeletal muscle atrophy. Free Radic Biol Med. (2016) ;98: :208–17. |
[41] | Poulianiti KP , Kaltsatou A , Mitrou GI , Jamurtas AZ , Koutedakis Y , Maridaki M , et al. Systemic Redox Imbalance in Chronic Kidney Disease: A Systematic Review. Oxid Med Cell Longev. (2016) ;8598253. |
[42] | Avin KG , Chen NX , Organ JM , Zarse C , O’Neill K , Conway RG , et al. Skeletal Muscle Regeneration and Oxidative Stress Are Altered in Chronic Kidney Disease. PLoS One. (2016) ;11: (8):e0159411. doi: 10.1371/journal.pone.0159411 |
[43] | Bork K , Weidemann W , Berneck B , Kuchta M , Bennmann D , Thate A , et al. The expression of sialyltransferases is regulated by the bioavailability and biosynthesis of sialic acids. Gene Expr Patterns. (2017) ;23-24: :52–58. doi: 10.1016/j.ge2017.03.003 |
[44] | Bierzynska A , Soderquest K , Koziell A . Genes and podocytes - new insights into mechanisms of podocytopathy. Front Endocrinol. (Lausanne). (2014) ;5: :226. |
[45] | Saleem MA , Zavadil J , Bailly M , McGee K , Witherden IR , Pavenstadt H , et al. The molecular and functional phenotype of glomerular podocytes reveals key features of contractile smooth muscle cells. Am J Physiol Renal Physiol. (2008) ;295: (4):F959–70. |
[46] | Noris M , Remuzzi G . Non-muscle myosins and the podocyte. Clin Kidney J. (2012) ;5: (2):94–101. |
[47] | Machuca E , Benoit G , Antignac C . Genetics of nephrotic syndrome: Connecting molecular genetics to podocyte physiology. Hum Mol Genet. (2003) ;18: (R2):R185–94. |
[48] | Huber TB , Simons M , Hartleben B , Sernetz L , Schmidts M , Gundlach E , et al. Molecular basis of the functional podocin-nephrin complex: Mutations in the NPHS2 gene disrupt nephrin targeting to lipid raft microdomains. Hum Mol Genet. (2003) ;12: (24):3397–405. |
[49] | Sohn RL , Huang P , Kawahara G , Mitchell M , Guyon J , Kalluri R , et al. A role for nephrin, a renal protein, in vertebrate skeletal muscle cell fusion. PNAS USA America. (2009) ;106: (23):9274–9. |
[50] | Pogoryelova O , Urtizberea JA , Argov Z , Nishino I , Lochmuller H . 237th ENMC International Workshop: GNE myopathy current and future research. Hoofddorp, The Netherlands, 14–16 September 2018. NeuromusculDisord. (2019) ;29: (5):401–10. |
[51] | Sanchez AMJ , Candau RB , Bernardi H . Foxo transcription factors: Their roles in the maintenanceof skeletal muscle homeostasis. Cell Mol Life Sci. (2014) ;71: :1657–71. |
[52] | GoodmanCA and HornbergerTA. New roles for Smad signaling and phosphatidic acid in the regulation of skeletal muscle mass. F1000Prime Reports. (2014) ;6–20. |
[53] | BeyfussK and HoodDA. A systematic review of p53 regulation of oxidative stress in skeletal muscle, Redox Report. (2018) ;23: :100–117. |
[54] | Ryall JG , Church JE , Lynch GS . Novel role for b-adrenergic signalling in skeletal muscle growth, development and regeneration. Clin Exper Pharmacol Physiol. (2010) ;37: :397–401. |


